
Phase Equilibria in the Fe-Mo-Co System: Experimental Investigation and Thermodynamic Calculation
1
School of Materials Science and Engineering, Xiangtan University, Xiangtan 411105, China
2
Guangdong Institute of Special Equipment Inspection and Research, Foshan 528251, China
3
AVIC Shaanxi Aircraft Industry, Co., Ltd., Hanzhong 723213, China
*
Authors to whom correspondence should be addressed.
Coatings 2023, 13(7), 1215; https://doi.org/10.3390/coatings13071215
Submission received: 25 May 2023
/
Revised: 11 June 2023
/
Accepted: 28 June 2023
/
Published: 7 July 2023
(This article belongs to the Special Issue Recent Developments in Interfaces and Surfaces Engineering)
Abstract
:As a kind of high-performance tool material, the phase relationship and microstructure evolution of Fe-Mo-Co alloy during manufacturing processes deserve attention and study. In the present work, isothermal sections of the Fe-Mo-Co system at 800 and 1350 °C were investigated using the equilibrium alloy method and diffusion couple technology. No ternary compounds were found in either isothermal section. Four three-phase regions and two three-phase regions were determined at 1350 and 800 °C, respectively. The μ-Fe7Mo6 phase presents a continuous solid solution in the two isothermal sections. A set of self-consistent thermodynamic parameters of the Fe-Mo-Co ternary system were obtained. The calculated results using the obtained thermodynamic parameters are in good agreement with the experimental results.
1. Introduction
Titanium alloys have a wide range of applications, but their difficult-to-cut property poses a challenge to selecting cutting tools [1,2,3]. Conventional machining of titanium alloy generally uses carbon-containing high-speed steel tools [4,5,6]. However, a huge amount of heat will be generated in the cutting process. Titanium alloys have a low thermal conductivity, which prevents heat from dissipating in time [7,8,9]. The accumulation of heat can cause the growth of carbide, leading to the failure of the tool. Therefore, it is necessary to seek carbon-free high-speed steel to be used as a chip-cutting tool. In this situation, Fe-Mo alloys become the candidate material for titanium alloy cutting tools because of their high hardness, which comes from the secondary µ-Fe7Mo6 phase [10,11,12]. The Co element is also often used as an additive element to form the Co7Mo6 phase with the same structure as the µ-Fe7Mo6 phase in the alloy [13,14,15,16,17,18]. In Fe-Mo-Co alloys, Co and Fe occupy the same sublattice, forming the µ-(Fe,Co)7Mo6 phase and improving the hardness of the alloy [19,20,21,22].
However, the composition and properties of these phases are unpredictable. Therefore, it is necessary to conduct an in-depth study on the phase relationship and thermodynamic description of the Fe-Co-Mo system to realize the precise control of microstructure evolution in the preparation and service performance of the alloy. During the last decades, the binary systems Fe-Co, Fe-Mo, and Co-Mo related to the Fe-Mo-Co system have been extensively studied; however, the phase relationship of the ternary system has not been reported in detail. The aim of this work is to determine the phase equilibrium in the Fe-Mo-Co system at 800 and 1350 °C and develop a set of self-consistent thermodynamic parameters of the Fe-Mo-Co system using the CALPHAD technique.
2. Literature Date
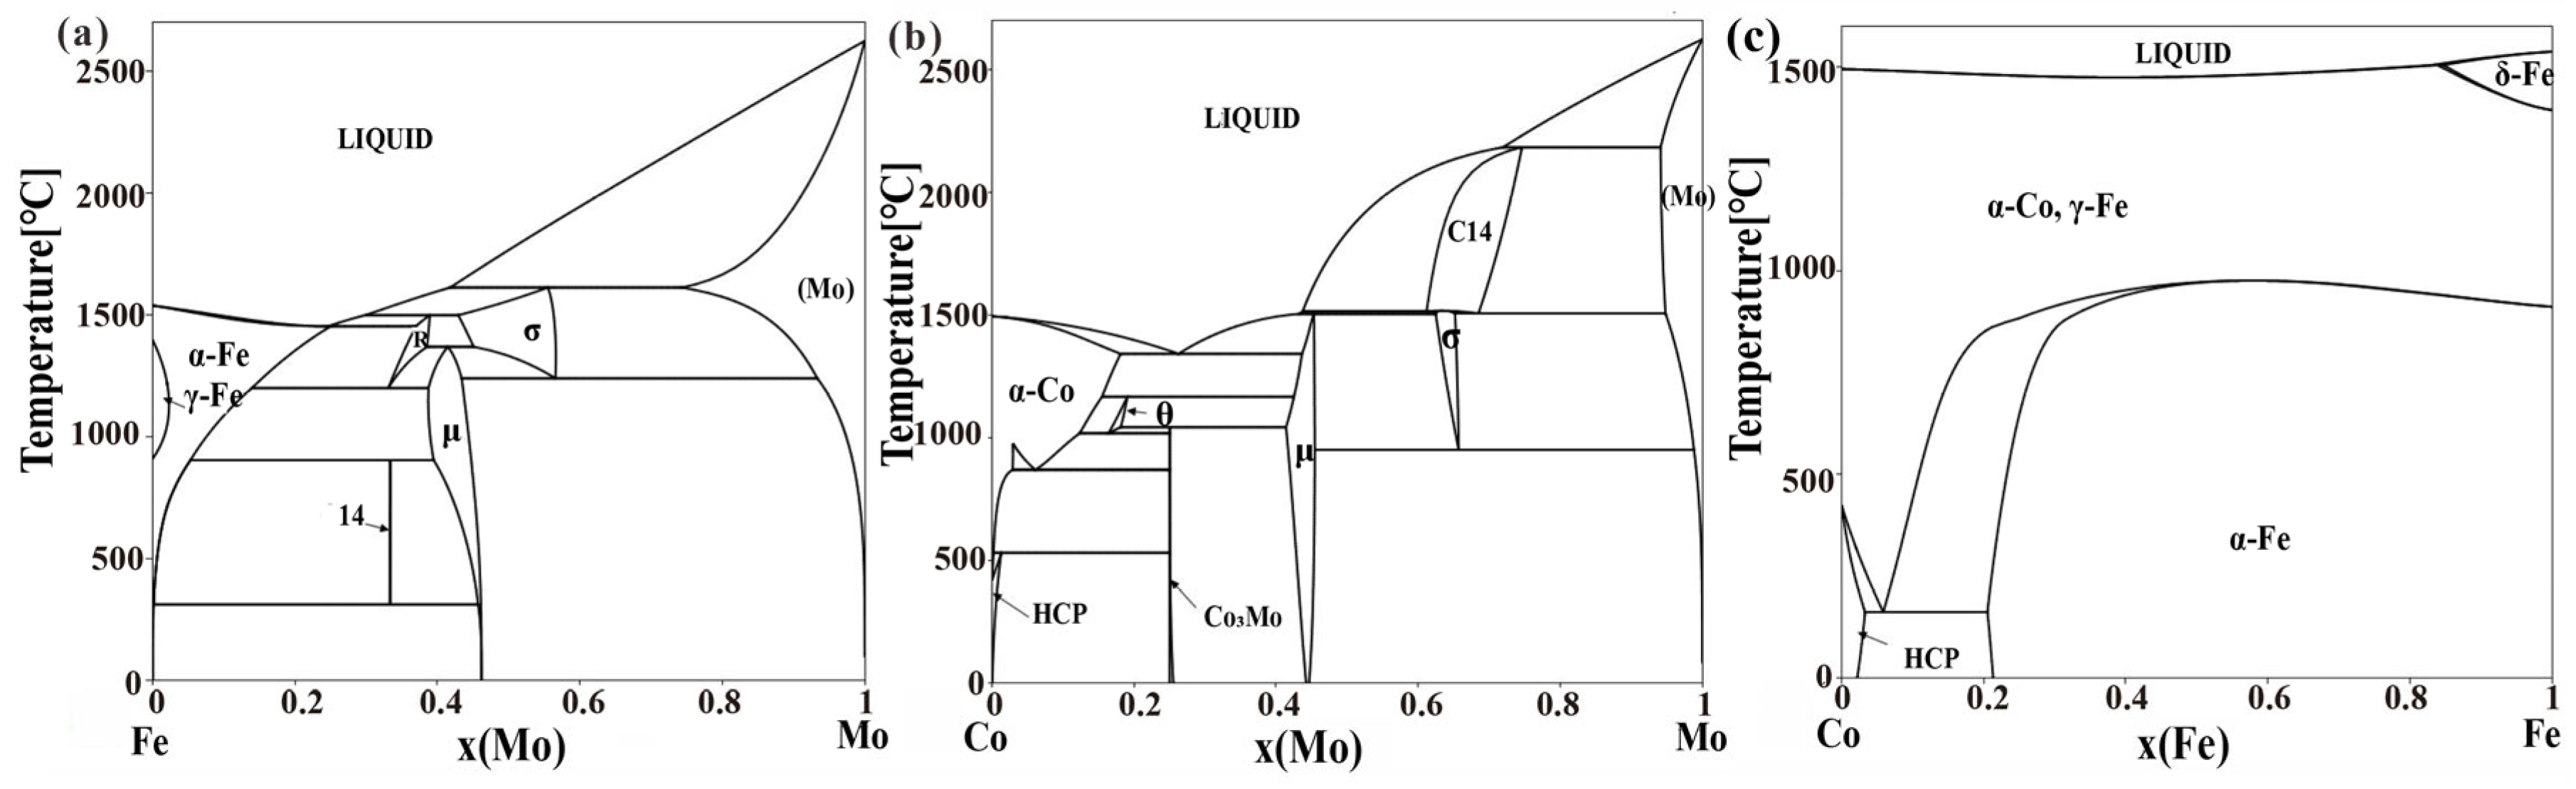
The phase diagram [23] and thermodynamic description [24,25,26,27] of the Fe-Mo system have been thoroughly studied by several researchers. In the phase diagram of the Fe-Mo system, there are four intermediate compounds, namely μ-Fe7Mo6, k-Fe2Mo, r-Fe5Mo3, and R-FeMo. Guillermet et al. [24], Andersson et al. [25], Houserová et al. [26], and Rajkumar et al. [27] have assessed the experimental data and obtained thermodynamic descriptions of the Fe-Mo system, respectively. The description from Andersson et al. was directly adopted in this study for matching with other thermodynamic databases developed by the authors [25], as presented in Figure 1a.
Experimental investigation and thermodynamic assessment of the Co-Mo binary system have been carried out by many researchers [28,29]. Much of the data for the Co-Mo phase diagram have been calculated and assessed by Brewer and Lamoreaux [29], who reported two intermetallic compounds in the Co-Mo system at 600 and 450 °C, namely, μ-Co7Mo6 and ε-Co3Mo. For the CALPHAD assessment, Kaufman and Nesor [30] pioneered this system, using simple regular solutions and linear compound models. Davydov and Kattner [31] added magnetic terms to the solution phase and used compound energy models; Davydov [32] revised the thermodynamic description for it. Recently, Oikawa et al. [33] reassessed the thermodynamic parameters for the Co-Mo system, as presented in Figure 1b.
The phase diagram of the Fe-Co system has also been evaluated by several authors [34,35,36]. Guillermet [34] performed a complete thermodynamic assessment first. However, the order–disorder transition was ignored, and the experimental data for evaluating the magnetic parameters are insufficient. Then, this system, experimentally determined by thin film technique at low temperature, was satisfactorily re-evaluated by Ohnuma et al. [35]. However, they ignored the energy contribution of vacancy when building the sublattice model of the ordered bcc_B2 phase, and the description of magnetic property deviated from the experimental data. Recently, Turchanin et al. [36] proposed re-optimizing the thermodynamic parameters for Fe-Co systems while focusing on the phase equilibria at high temperatures, especially with the liquid phase. Based on previous studies, Wang et al. [37] conducted a thermodynamic evaluation of the Fe-Co binary system in which first-principles calculation results and more robust experimental data were incorporated into the evaluation, as presented in Figure 1c.
3. Experimental Procedures
3.1. Equilibrated Alloy Samples Preparation
A series of Fe-Mo-Co alloy buttons were prepared from high-purity iron (99.99 wt.%), cobalt (99.99 wt.%), and molybdenum (99.99 wt.%) granules in a non-consumable vacuum arc-melting furnace under an atmosphere of argon. All the samples were smelted at least four times to ensure homogeneity. The obtained button samples were sealed in quartz tubes filled with argon gas and annealed at 800 °C for 70 days and 1350 °C for 10 days, respectively, to achieve an equilibrium state. Afterward, the samples were quenched in water immediately to preserve them at annealing temperatures. Subsequently, water quenching was performed to retain the phase equilibrium states at annealing temperatures.
3.2. Diffusion Couple Alloy Preparation
The diffusion couple technique was also adopted to analyze the phase equilibria in the Fe-Mo-Co system. A Fe-Co80Mo20 diffusion couple was prepared. The Co80Mo20 binary alloy and the pure Fe button samples were prepared in the same way as described previously. Blocks with dimensions of about 4 × 4 × 2 mm were cut from buttons using wire electrical discharge machining (WEDM). The blocks were polished to mirror-like quality, then assembled with molybdenum clamps. The diffusion couple was sealed in quartz tubes and annealed at 800 °C for seven days, following water quenching.
3.3. Metallographic Examination and Phase Identification
Each sample is cut into two parts for metallographic examination and phase identification. The metallographic examination and quantitative analysis were performed by scanning electron microscopy (SEM, JSM-6360LV, JEOL, Tokyo, Japan) coupled with wave-dispersive spectroscopy (WDS, OXFORD, Oxford Instruments, Abingdon, UK) and JEOL JXA-8230 (JEOL, Japan) electron probe microanalysis (EPMA). Phase identification was carried out by powder X-ray diffraction (XRD) analysis (Rigaku Ultima IV, 40 kV, 40 mA, Cu Kα radiation, Rigaku, Tokyo, Japan).
4. Thermodynamic Models
4.1. Pure Elements
The lattice stability parameters of Fe, Co, and Mo were taken from the SEGT database established by Dinsdale [38]. The Gibbs energy of element i in phase , (i = Fe, Mo, Co), can be expressed as:
where is the reference molar enthalpy of element i at 298.15 K and 1 bar; T is the Kelvin temperature; and A, B, C…are parameters describing the relationship between energy and temperature. They were taken from the SGTE database.
4.2. Solution Phases
The Gibbs energy of the solution phases like liquid, FCC_A1, BCC_A2, and HCP_A3 was described using an ordinary substitutional random solution model. In the Fe-Co-Mo system, the molar Gibbs energy of solution phases , , expressed as the sum of three terms: the reference term , which is the weighted superposition of energy for pure elements, the ideal entropy of mixing term , and the excess Gibbs energy term , i.e.,
where R is the gas constant, (i = Fe, Mo, Co) are the molar fractions of species i.
The excess Gibbs energy term is usually expressed by the Redlich-Kister-Muggianu polynomial [39] in the CALPHAD community:
With:
4.3. Ordered bcc_B2 Phase
A two-sublattice model, (Fe,Co,Va)0.5(Fe,Co,Va)0.5, was adopted for the ordered BCC_B2 phase. The energy change from order/disorder transition can be described by the model proposed by Ansara et al. [40]:
where is the mole fractions of the component i in sublattice s. is the Gibbs energy of bcc_A2. are the long-range ordering contributions. When phase bcc_B2 is completely out of order, the position fraction of i in the two sublattices is equal; that is, ; otherwise, for the ordered bcc_B2, .
4.4. Intermetallic Phases
The experimental results show that the Co3Mo and K (Fe2Mo) phases in the Fe-Mo-Co ternary system have limited solubility, so these two phases are regarded as stoichiometric compounds. The Gibbs energy per molar of the formula can be expressed as:
where σ(Co2Mo3), μ(Co7Mo6), and R phases are intermetallic phases with complex crystal structures and a large solubility range. They were modeled using three sublattice models of (Co)8(Mo)4(Co,Mo)18, (Co,Mo)7(Mo)2(Co,Mo)4, and (Fe)27(Mo)14(Fe,Mo)12, respectively. The Gibbs energy of phase Φ (Φ = σ, μ, and R) can be expressed as:
where is the Gibbs free energy of the Φ phase when the first sublattice is occupied by the element i (i = Fe, Co, or Mo), the element j (j = Fe, Co, or Mo), and the element k (k = Fe, Co, or Mo); is the interaction parameter between element i1 and i2 (i1, i2 = Fe, Co, or Mo and i1 ≠ i2).
5. Results and Discussion
5.1. Experimental Results
5.1.1. Isothermal Section at 1350 °C
A total of 11 equilibrium alloy samples were prepared to determine the phase equilibrium in the Fe-Mo-Co system at 1350 °C. The designed compositions of the alloys and all phase compositions in the alloys determined using EDS are listed in Table 1. Each value of phase composition was taken from an average of five or more measurements. The isothermal section of the Fe-Mo-Co system at 1350 °C was constructed based on the experimental results, as presented in Figure 2.
According to microstructure observation (Figure 3a) and X-ray diffraction analysis (Figure 3b), there are three phases present in the A6 alloy. The contrast between the three phases is quite distinct. Associated with component analysis, the dark phase was identified as the FCC phase, the gray phase as the L-phase, and the white phase surrounded by FCC as the μ phase. Due to the insufficient cooling rate during quenching, the L phase transitions to FCC and μ phase.
The microstructure of alloy A2 is presented in Figure 3c. Combining the XRD pattern as shown in Figure 3d and composition obtained via EDS analysis, three phases were identified in alloy A2, namely the R phase, FCC, and BCC. The contrast between the R phase and FCC is not obvious, but the difference in composition indicates that they are different phases. They can be further confirmed by XRD analysis.
The microstructure of alloy A5 obtained via SEM is illustrated in Figure 3e. Three very clear contrasts indicate the presence of three phases in the A5 alloy. As confirmed by the EDS and XRD analysis in Figure 3f, the three phases were identified as the R phase, FCC phase, and μ Phase. As marked in Figure 3e, the matrix phase is the FCC phase, and the blocky μ phase and the fine acicular R phase are distributed in the matrix.
The microstructures illustrated in Figure 3g also show three contrasts, as well as the XRD patterns in Figure 3h. Combining the composition analysis results, three phases, namely the (Mo), Co2Mo3, and μ phases, were identified. The matrix with gray contrast was identified as the Co2Mo3 phase, the blocks with dark contrast as the μ phase, and the white phase adjacent to the μ phase as the (Mo) phase.
Alloys A7, A8, A9, and A10 were located in two-phase regions, as the microstructures showed two contrasts, and the XRD patterns were calibrated to be two-phase. The microstructures obtained via SEM and XRD patterns of the four samples are illustrated in Figure 4. Figure 4a is the microstructure of alloy A8. SEM-EDS analysis shows that this is a two-phase of L + μ. Due to the insufficient cooling rate during quenching, the L phase transitions to FCC and μ phase. As shown in Figure 4c, alloy A7 is located in a two-phase region of R + μ. The microstructure of alloy A10 is presented in Figure 4e; the results show that alloy A10 is obviously composed of two phases of (Mo) + σ; Figure 4g is the microstructure of alloy A9. The μ and σ phases are confirmed in this alloy. The XRD results also confirm the results of these phases, as shown in Figure 3b,d,f,h. Based on the binary phase equilibria and phase composition measured above, a series of tie-lines can be plotted in the isothermal section, and finally, the phase boundary and solid solubility can be described.
5.1.2. Isothermal Section at 800 °C
The phase equilibrium in the Fe-Mo-Co system at 800 °C was determined by combining the equilibrium alloys method and diffusion couple technique. In the present work, four equilibrium alloys and one diffusion couple were prepared for the construction of the isothermal section. Assisted by metallographic examination using SEM, phase identification using XRD analysis, and composition determination using EDS and EPMA, the isothermal section of the Fe-Mo-Co system at 800 °C was constructed and illustrated in Figure 5, superimposed with the nominal components of the alloys and tie-lines.
The four alloy samples B1-B4 were well annealed to be thermally equilibrium. The microstructures and XRD patterns of sample B4-B2 are presented in Figure 6. The composition determination results for each contrast in the SEM images are summarized in Table 2, as well as the nominal component of the alloys. Figure 6a shows the microstructure of alloy B4. There exist three phases: μ + BCC + λ that can be easily differentiated by the morphology. The matrix is the BCC phase, the white block is μ, and the dark phase is λ. The XRD pattern of this alloy, as shown in Figure 6b, further confirms the μ + BCC + λ three-phase equilibrated state. Based on the microstructure and XRD results presented in Figure 6c,d, a two-phase region of Mo + μ can be determined. Figure 6e,f show the microstructure and XRD pattern of alloy B2, which indicate that the μ and BCC phases co-exist in this alloy.
To obtain more information about the phase relations of the Fe-Mo-Co system at 800 °C, diffusion couples were prepared. The Fe-Co80Mo20 diffusion couple was annealed at 800 °C for seven days. The microstructure backscatter photograph of the diffusion zone is present in Figure 7. Composition data for each phase occurring in the diffusion layers obtained with EPMA analyses are listed in Table 3. According to the comprehensive analysis of composition and microstructure, combined with the determination results of the equilibrium alloys, the diffusion path was identified as k + FCC → k → k + BCC + μ → BCC + μ → BCC. A three-phase region k + BCC + μ can be determined at the conjunction interface of the BCC + μ layer and k layer.
Based on the analysis of the equilibrium alloys and the diffusion couple, the phase relationship in the Fe-Mo-Co system at 800 °C was clarified. Three three-phase fields were determined, namely, μ + BCC + λ, k + BCC + μ, and k + BCC + FCC. From the results mentioned above, the μ-Fe7Mo6 and μ-Co7Mo6 phases form a continuous solid solution. The maximum solubility of Co in λ and Fe in the k phase is 2.13 at.% and 2.64 at.% at 800 °C, respectively.
5.2. Thermodynamic Calculation Results
Based on the obtained experimental information of phase equilibrium above, the thermodynamic optimization was carried out using the CALPHAD method. The optimization process was realized by the Thermo-Calc software assembled by the PARROT module [41]. The specific step-by-step optimization process was adopted, which was described by Du et al. [42]. The parameters for the liquid phase were first optimized. Then, all parameters are synchronously optimized to achieve self-consistency in thermodynamic descriptions.
The obtained thermodynamic parameters for the Gibbs energy of each phase in the Fe-Mo-Co system are summarized in Table 4. The calculation procedure of the isothermal section and liquidus projection were implemented based on these parameters. The calculated isothermal sections at 1350 and 800 °C compared with experimental data are presented in Figure 8. As shown in the figure, the calculated results match the experimental data in acceptable error limits, showing the accuracy of the obtained parameters.
The calculated liquidus projection of the Fe-Mo-Co system is illustrated in Figure 9. According to the calculation, six invariant reactions involving the liquid phase were predicted. The predicted invariant reactions are summarized in Table 5, along with their corresponding reaction temperatures. The prediction shows that five of them are perieutectic reactions, and one is peritectic a reaction. The μ phase in the Fe-rich alloy can be obtained by U5 reaction at 1372.79 °C during the solidification process.
6. Conclusions
In this work, two isothermal sections at 1350 and 800 °C of the Fe-Mo-Co system were systematically established. No ternary compounds were found in either isothermal section. Four three-phase regions and two three-phase regions were determined at 1350 and 800 °C, respectively. The μ-Fe7Mo6 phase, as the enhanced phase in the Fe-Co-Mo cutting tool material, presents a continuous solid solution in the two isothermal sections. Based on the experimental data and binary parameters, the thermodynamic assessment of the Fe-Co-Mo system was performed. The calculated results can provide theoretical support for optimizing the composition and heat treatment process for the Fe-Co-Mo alloy as tool steel.
Author Contributions
Conceptualization, Y.L.; methodology, M.L. and Y.L.; validation, Z.P.; formal analysis, Y.S.; investigation, M.L.; writing—original draft preparation, M.L. and Y.L.; visualization, M.L., Z.P., Y.S. and Y.L.; funding acquisition, M.L. and Y.L. All authors have read and agreed to the published version of the manuscript.
Funding
This research received no external funding.
Institutional Review Board Statement
Not applicable.
Informed Consent Statement
Not applicable.
Data Availability Statement
Not applicable.
Conflicts of Interest
The authors declare no conflict of interest.
References
- Gupta, M.K.; Sood, P.K.; Sharma, V.S. Optimization of machining parameters and cutting fluids during nano-fluid based minimum quantity lubrication turning of titanium alloy by using evolutionary techniques. J. Clean. Prod. 2016, 135, 1276–1288. [Google Scholar] [CrossRef]
- Bordin, A.; Sartori, S.; Bruschi, S.; Ghiotti, A. Experimental investigation on the feasibility of dry and cryogenic machining as sustainable strategies when turning Ti6Al4V produced by Additive Manufacturing. J. Clean. Prod. 2017, 142, 4142–4151. [Google Scholar] [CrossRef]
- Niketh, S.; Samuel, G.L. Surface texturing for tribology enhancement and its application on drill tool for the sustainable machining of titanium alloy. J. Clean. Prod. 2017, 167, 253–270. [Google Scholar] [CrossRef]
- Tillmann, W.; Stangier, D.; Meijer, A.; Krebs, E.; Ott, A.; Platt, T.; Lopes Dias, N.F.; Hagen, L.; Biermann, D. Adapting the Surface Integrity of High-Speed Steel Tools for Sheet-Bulk Metal Forming. J. Manuf. Mater. Process. 2022, 6, 37. [Google Scholar] [CrossRef]
- Prasad, K.N.; Syed, I. Surface Texturing and Laser Shock Peening Processes on High-Speed Steel Tool for Sustainable Machining. Arab. J. Sci. Eng. 2021, 47, 8589–8600. [Google Scholar] [CrossRef]
- Zhang, X.; Sun, H.; Gao, S.; Luo, Y. Processing Fundamentals and Performance Investigation of Selective Laser Melting of High-Speed Steel in Reactive N2 Atmosphere. Steel Res. Int. 2023, 94, 2200807. [Google Scholar] [CrossRef]
- Hong, X.D.; Zheng, H.R.; Liang, D. Field emission behavior of titanium alloy nanosheets. Mater. Lett. 2021, 304, 130717. [Google Scholar] [CrossRef]
- Liu, W.; Li, G.; Shao, Z.; Wu, X.; Ma, G.; Wang, F. Advance in experimental research on cutting temperature of titanium alloys. Int. J. Adv. Manuf. Technol. 2023, 126, 1827–1844. [Google Scholar] [CrossRef]
- Chen, Y.; Wu, W.; Dai, H. Overview of titanium alloy cutting based on machine learning. Int. J. Adv. Manuf. Technol. 2023, 126, 4749–4762. [Google Scholar] [CrossRef]
- Schröders, S.; Sandlöbes, S.; Berkels, B.; Korte-Kerzel, S. On the structure of defects in the Fe7Mo6 μ-Phase. Acta Mater. 2019, 167, 257–266. [Google Scholar] [CrossRef] [Green Version]
- Schröders, S.; Sandlöbes, S.; Birke, C.; Loeck, M.; Peters, L.; Tromas, C.; Korte-Kerzel, S. Room temperature deformation in the Fe7Mo6 μ-Phase. Int. J. Plast. 2018, 108, 125–143. [Google Scholar] [CrossRef] [Green Version]
- Xie, F.; He, Y.; Yuan, Z.; Kang, X. Microstructure and high-temperature sliding wear performance of Fe-Co-Mo alloy coating fabricated by plasma cladding. Surf. Coat. Technol. 2022, 444, 128667. [Google Scholar] [CrossRef]
- Yang, G.; Yin, H.; Deng, Z.; Zhang, C.; Zhang, R.; Qu, X. Effect of chemical composition on the microstructure and mechanical properties of MoCoB based cermets. Ceram. Int. 2020, 46, 18046–18055. [Google Scholar] [CrossRef]
- Ren, N.; Zhang, J. Site preference and alloying effect of tungsten in the μ phase of Co7Mo6. Philos. Mag. Lett. 2015, 96, 1–8. [Google Scholar] [CrossRef]
- Sun, Y.; Ganin, A.Y. The Synergistic Effects of Alloying on the Performance and Stability of Co3Mo and Co7Mo6 for the Electrocatalytic Hydrogen Evolution Reaction. Hydrogen 2020, 1, 11–21. [Google Scholar] [CrossRef]
- Peng, Z.Y.; Wang, X.M.; Yin, F.M.; Ouyang, X.M.; Hu, J.X. Phase equilibria of Co-Mo-Zn ternary system. Trans. Nonferrous Met. Soc. China 2020, 30, 417–427. [Google Scholar] [CrossRef]
- Li, P.; Zhang, J.; Ma, S.; Zhang, Y.; Jin, H.; Mao, S. First-principles investigations on structural stability, elastic and electronic properties of Co7M6 (M = W, Mo, Nb) µ phases. Mol. Simul. 2019, 45, 752–758. [Google Scholar] [CrossRef]
- Khimich, M.A.; Ibragimov, E.A.; Tolmachev, A.I.; Chebodaeva, V.V.; Uvarkin, P.V.; Saprykina, N.A.; Saprykin, A.A.; Sharkeev, Y.P. Influence of thermal treatment duration on structure and phase composition of additive Co-Cr-Mo alloy samples. Lett. Mater. 2022, 12, 43–48. [Google Scholar] [CrossRef]
- Geller, Y. Instrumentalniye Staly; Verlag Metallurgia: Moscow, Russia, 1983. [Google Scholar]
- Chen, W.; Hui, Z.; Hao, D.; Xiaocao, H.; George, C.H.; Bingshu, W.; Junfeng, C.; Xigui, C. Effects of B addition on the microstructure and magnetic properties of Fe-Co-Mo alloys. J. Alloys Compd. 2018, 766, 649–655. [Google Scholar]
- Danninger, H.; Rouzbahani, F.; Harold, C.; Ponemayr, H.; Daxelmuller, M.; Simancik, F.; Izdinsky, K. Heat treatment and properties of precipitation hardened carbon-free PM tool steels. Powder Metall. Prog. 2005, 5, 92–103. [Google Scholar]
- Leitner, H.; Schober, M.; Clemens, H.; Caliskanoglu, D.; Danoix, F. Precipitation behaviour of an Fe-Co-Mo-alloy during non-isothermal ageing. Int. J. Mater. Res. 2008, 99, 367–374. [Google Scholar] [CrossRef]
- Okamoto, H.; Massalski, T. Binary Alloy Phase Diagrams; ASM International: Materials Park, OH, USA, 1990; Volume 12. [Google Scholar]
- Guillermet, A.F. An assessment of the Fe-Mo system. Calphad 1982, 6, 127–140. [Google Scholar] [CrossRef]
- Andersson, J.O.; Lange, N. An experimental study and a thermodynamic evaluation of the Fe-Cr-Mo system. Metall. Mater. Trans. A 1988, 6, 1385–1394. [Google Scholar] [CrossRef]
- Houserová, J.; Vřešťál, J.; Šob, M. Phase diagram calculations in the Co-Mo and Fe-Mo systems using first-principles results for the sigma phase. Calphad 2005, 29, 133–139. [Google Scholar] [CrossRef]
- Rajkumar, V.; Kumar, K.H. Thermodynamic modeling of the Fe-Mo system coupled with experiments and ab initio calculations. J. Alloys Compd. 2014, 611, 303–312. [Google Scholar] [CrossRef]
- Pavlů, J.; Vřešťál, J.; Šob, M. Ab initio study of energetics and magnetism of sigma phase in Co–Mo and Fe–Mo systems. Model. Simul. Mater. Sci. Eng. 2016, 24, 025009. [Google Scholar] [CrossRef]
- Brewer, L. Molybdenum: Physico-Chemical Properties of Its Compounds and Alloys; International Atomic Energy Agency: Vienna, Austria, 1980; pp. 1–714. [Google Scholar]
- Birnie, D.; Machlin, E.; Kaufman, L.; Taylor, K. Comparison of pair potential and thermochemical models of the heat of formation of BCC and FCC alloys. Calphad 1982, 6, 93–126. [Google Scholar] [CrossRef]
- Davydov, A.; Kattner, U.R. Thermodynamic assessment of the Co-Mo system. J. Phase Equilibria 1999, 20, 5. [Google Scholar] [CrossRef]
- Davydov, A.; Kattner, U.R. Revised thermodynamic description for the Co-Mo system. J. Phase Equilibria 2003, 1, 7. [Google Scholar] [CrossRef]
- Oikawa, K.; UR, K.; Sato, J.; Omori, T.; Jiang, M.; Anzai, K.; Ishida, K. Experimental determination and thermodynamic assessment of phase equilibria in the Co-Mo system. Mater. Trans. 2012, 53, 1425–1435. [Google Scholar] [CrossRef] [Green Version]
- Fernandez Guillermet, A. Critical evaluation of the thermodynamic properties of the iron-cobalt system. High Temp. High Press. 1987, 19, 477–499. [Google Scholar]
- Ohnuma, I.; Enoki, H.; Ikeda, O.; Kainuma, R.; Ohtani, H.; Sundman, B.; Ishida, K. Phase equilibria in the Fe-Co binary system. Acta Mater. 2002, 50, 379–393. [Google Scholar] [CrossRef]
- Turchanin, M.; Dreval, L.; Abdulov, A.; Agraval, P. Mixing enthalpies of liquid alloys and thermodynamic assessment of the Cu-Fe-Co system. Powder Metall. Met. Ceram. 2011, 50, 98–116. [Google Scholar] [CrossRef]
- Wang, J.; Lu, X.G.; Zhu, N.; Zheng, W. Thermodynamic and diffusion kinetic studies of the Fe-Co system. Calphad 2017, 58, 82–100. [Google Scholar] [CrossRef]
- Dinsdale, A.T. SGTE data for pure elements. Calphad 1991, 15, 317–425. [Google Scholar] [CrossRef]
- Redlich, O.; Kister, A. Algebraic representation of thermodynamic properties and the classification of solutions. Ind. Eng. Chem. 1948, 40, 345–348. [Google Scholar] [CrossRef]
- Ansara, I.; Dupin, N.; Sundman, B. Reply to the paper: “When is a compound energy not a compound energy? A critique of the 2-sublattice order/disorder model”: Of Nigel Saunders, Calphad 20 491-499. Calphad 1997, 21, 535–542. [Google Scholar] [CrossRef]
- Sundman, B.; Jansson, B.; Andersson, J.O. The thermo-calc databank system. Calphad 1985, 9, 153–190. [Google Scholar] [CrossRef]
- Du, Y.; Schmid-Fetzer, R.; Ohtani, H. Thermodynamic assessment of the V–N system. Int. J. Mater. Res. 2021, 88, 545–556. [Google Scholar] [CrossRef]
Figure 2.
Experimental isothermal sections of the Fe-Mo-Co system at 1350 °C.

Figure 3.
Typical microstructures (a,c,e,g) and XRD patterns (b,d,f,h) corresponding to different three-phase fields of alloys annealed at 1350 °C: (a,b) alloy A6; (c,d) alloy A2; (e,f) alloy A5; and (g,h) alloy A11.
Figure 3.
Typical microstructures (a,c,e,g) and XRD patterns (b,d,f,h) corresponding to different three-phase fields of alloys annealed at 1350 °C: (a,b) alloy A6; (c,d) alloy A2; (e,f) alloy A5; and (g,h) alloy A11.

Figure 4.
The typical microstructures and XRD patterns of different alloys at 1623 K corresponding to different phase regions. (a,b) alloy A8, L + μ; (c,d) alloy A7, R + μ; (e,f) alloy A10, (Mo) + σ; (g,h) alloy A9, μ + σ.
Figure 4.
The typical microstructures and XRD patterns of different alloys at 1623 K corresponding to different phase regions. (a,b) alloy A8, L + μ; (c,d) alloy A7, R + μ; (e,f) alloy A10, (Mo) + σ; (g,h) alloy A9, μ + σ.

Figure 5.
Experimental isothermal sections of the Fe-Mo-Co system at 800 °C.

Figure 6.
Typical microstructures (a,c,e) and XRD patterns (b,d,f) corresponding to different alloys B4–B2 annealed at 800 °C.
Figure 6.
Typical microstructures (a,c,e) and XRD patterns (b,d,f) corresponding to different alloys B4–B2 annealed at 800 °C.

Figure 7.
The microstructures of the Co80Mo20-Fe diffusion couple annealed at 800 °C.

Figure 8.
Calculated isothermal sections of the Fe-Mo-Co system at (a) 800 °C and (b) 1350 °C compared with the experimental data. White circle symbol is the experimental alloy point of this work.
Figure 8.
Calculated isothermal sections of the Fe-Mo-Co system at (a) 800 °C and (b) 1350 °C compared with the experimental data. White circle symbol is the experimental alloy point of this work.

Figure 9.
Calculated liquidus projection of the Fe-Mo-Co system.


Table 1.
Composition of alloys and phases in the Fe-Mo-Co ternary system at 1350 °C (at.%).
| Sample | Designed Composition | Phase | Phase Composition (at.%) | ||
|---|---|---|---|---|---|
| Fe | Co | Mo | |||
| A1 | 48Fe-5Co-47Mo | μ | 51.98 | 5.41 | 42.61 |
| σ | 43.26 | 1.72 | 55.02 | ||
| A2 | 81Fe-3Co-16Mo | Fcc | 82.38 | 3.92 | 13.70 |
| R | 63.86 | 1.41 | 34.73 | ||
| Bcc | 82.10 | 0.50 | 17.40 | ||
| A3 | 50Fe-30Co-20Mo | L | 49.27 | 29.10 | 21.63 |
| Fcc | 54.31 | 31.20 | 14.49 | ||
| A4 | 47Fe-20Co-33Mo | μ | 44.14 | 18.04 | 37.83 |
| Fcc | 59.70 | 24.92 | 15.38 | ||
| A5 | 60Fe-8Co-32Mo | μ | 55.60 | 9.28 | 35.12 |
| R | 58.91 | 6.06 | 35.03 | ||
| Fcc | 73.03 | 11.75 | 15.22 | ||
| A6 | 50Fe-25Co-25Mo | L | 50.67 | 26.90 | 22.43 |
| Fcc | 58.70 | 26.10 | 15.20 | ||
| μ | 42.19 | 20.40 | 37.41 | ||
| A7 | 60Fe-5Co-35Mo | μ | 57.27 | 2.15 | 40.58 |
| R | 61.03 | 2.40 | 63.43 | ||
| A8 | 10Fe-50Co-40Mo | L | 17.62 | 57.19 | 25.19 |
| μ | 11.5 | 46.10 | 42.40 | ||
| A9 | 10Fe-30Co-60Mo | μ | 13.52 | 41,84 | 44.64 |
| σ | 12.4 | 29.90 | 57.70 | ||
| A10 | 7Fe-25Co-68Mo | (Mo) | 0.85 | 2.93 | 96.22 |
| σ | 7.07 | 26.17 | 66.76 | ||
| A11 | 15Fe-25Co-60Mo | μ | 20.28 | 35.35 | 44.37 |
| (Mo) | 2.87 | 1.74 | 95.39 | ||
| σ | 9.75 | 23.22 | 67.03 | ||
Table 2.
Composition of alloys and phases in the Fe-Mo-Co ternary system at 800 °C (at.%).
| Sample | Designed Composition | Phase | Phase Composition (at.%) | ||
|---|---|---|---|---|---|
| Fe | Co | Mo | |||
| B1 | 86Fe-8Co-6Mo | μ | 56.09 | 5.13 | 38.78 |
| BCC | 90.12 | 8.26 | 1.62 | ||
| B2 | 50Fe-25Co-25Mo | μ | 39.43 | 20.99 | 39.58 |
| BCC | 66.45 | 32.61 | 0.94 | ||
| B3 | 8Fe-31Co-61Mo | Mo | 2.27 | 3.03 | 94.7 |
| μ | 10.75 | 42.82 | 46.43 | ||
| B4 | 70Fe-5Co-25Mo | μ | 57.36 | 3.88 | 38.76 |
| BCC | 92.35 | 5.97 | 1.68 | ||
| λ | 66.92 | 2.13 | 30.95 | ||
Table 3.
The data obtained with EPMA analyses for diffusion couples at 800 °C (at.%).
| Phase Equilibrium | Phase | Compositions (at.%) | ||
|---|---|---|---|---|
| Fe | Co | Mo | ||
| μ + BCC + K | μ | 18.89 | 41.35 | 39.76 |
| BCC | 44.99 | 54.82 | 0.19 | |
| K | 2.64 | 75.37 | 21.99 | |
| μ + BCC | μ | 20.41 | 40.02 | 39.57 |
| BCC | 46.14 | 53.45 | 0.41 | |
| K + FCC | K | 2.15 | 75.58 | 22.27 |
| FCC | 9.71 | 89.41 | 0.88 | |
Table 4.
Thermodynamic parameters of the Fe-Mo-Co ternary system.
| Phase | Model | Thermodynamic Parameters |
|---|---|---|
| Liquid | (Co,Fe,Mo)1 | |
| FCC_A1 | (Co,Fe,Mo)1(Va)1 | |
| HCP_A3 | (Co,Fe,Mo)1(Va)0.5 | |
| BCC_A2 | (Co,Fe,Mo)1(Va)3 | |
| σ | (Co,Fe)8(Mo)4(Co,Fe,Mo)18 | |
| R | (Co,Fe)27(Mo)14 (Co,Fe,Mo)12 | |
| Co3Mo | (Co,Mo,Fe)3(Co,Mo,Fe)1 |
Table 5.
Predicted invariant reactions involving the liquid phase in the Fe-Mo-Co system.
| T (°C) | Reaction | Type |
|---|---|---|
| 1581.40 | Liquid + BCC + C14 ↔ σ | P1 |
| 1478.99 | Liquid + σ ↔ μ + BCC | U1 |
| 1473.39 | Liquid + σ ↔ μ + R | U2 |
| 1461.11 | Liquid + BCC ↔ μ + σ | U3 |
| 1385.90 | Liquid + BCC ↔ FCC + R | U4 |
| 1372.79 | Liquid + R ↔ μ + FCC | U5 |
Disclaimer/Publisher’s Note: The statements, opinions and data contained in all publications are solely those of the individual author(s) and contributor(s) and not of MDPI and/or the editor(s). MDPI and/or the editor(s) disclaim responsibility for any injury to people or property resulting from any ideas, methods, instructions or products referred to in the content. |
© 2023 by the authors. Licensee MDPI, Basel, Switzerland. This article is an open access article distributed under the terms and conditions of the Creative Commons Attribution (CC BY) license (https://creativecommons.org/licenses/by/4.0/).
Share and Cite
MDPI and ACS Style
Li, M.; Peng, Z.; Shang, Y.; Liu, Y. Phase Equilibria in the Fe-Mo-Co System: Experimental Investigation and Thermodynamic Calculation. Coatings 2023, 13, 1215. https://doi.org/10.3390/coatings13071215
AMA Style
Li M, Peng Z, Shang Y, Liu Y. Phase Equilibria in the Fe-Mo-Co System: Experimental Investigation and Thermodynamic Calculation. Coatings. 2023; 13(7):1215. https://doi.org/10.3390/coatings13071215
Chicago/Turabian StyleLi, Minghuan, Zhiyong Peng, Yansong Shang, and Yongxiong Liu. 2023. "Phase Equilibria in the Fe-Mo-Co System: Experimental Investigation and Thermodynamic Calculation" Coatings 13, no. 7: 1215. https://doi.org/10.3390/coatings13071215
Note that from the first issue of 2016, this journal uses article numbers instead of page numbers. See further details here.