
Analysis of Surface Roughness during Surface Polishing of ITO Thin Film Using Acoustic Emission Sensor Monitoring

1
Department of Mechanical Design Engineering, Hanyang University, Seongdong-gu, Seoul 04763, Republic of Korea
2
Department of Mechanical Engineering, BK21 FOUR ERICA-ACE Center, Hanyang University, Gyeonggi, Ansan 15588, Republic of Korea
*
Author to whom correspondence should be addressed.
Coatings 2023, 13(12), 2086; https://doi.org/10.3390/coatings13122086
Submission received: 28 November 2023
/
Revised: 10 December 2023
/
Accepted: 13 December 2023
/
Published: 14 December 2023
(This article belongs to the Special Issue Manufacturing and Surface Engineering IV)
Abstract
:This study investigates the intricate process of surface polishing for ITO-coated Pyrex glass utilizing magnetic abrasive polishing (MAP) while employing acoustic emission (AE) sensors for real-time defect monitoring. MAP, known for its versatility in achieving nanoscale thickness processing and uniform surfaces, has been widely used in various materials. However, the complexity of the process, influenced by multiple variables like cutting conditions, material properties, and environmental factors, poses challenges to maintaining high surface quality. To address this, a sensor monitoring system, specifically one that uses AE sensors, was integrated into the MAP process to detect and confirm defects, providing real-time insights into machining conditions and outcomes. AE sensors excel in identifying material deterioration, microcrack formation, and wear, even in cases of minor damage. Leveraging AE sensor data, this study aims to minimize surface defects in ITO thin films during MAP while optimizing surface roughness. The investigation involves theoretical validation, magnetic density simulations, and force sensor pressure measurements to identify factors influencing surface roughness. ANOVA analysis is employed to determine optimal processing conditions. Additionally, this study compares the identified optimal roughness conditions with those predicted by AE sensor parameters, aiming to establish a correlation between predicted and achieved surface quality. The integration of AE sensor monitoring within the MAP process offers a promising avenue for enhancing surface quality by effectively identifying and addressing defects in real time. This comprehensive analysis contributes to advancing the understanding of surface polishing methodologies for ITO-coated Pyrex glass, paving the way for improved precision and quality in thin-film surface processes.
1. Introduction
Transparent conductive oxide (TCO) is a semiconductor material with both light-transmitting properties and electrical conductivity. TCO is mainly composed of indium and zinc oxide; ITO and ZnO are commonly utilized. Generally, metals possess high electrical conductivity due to the mobility of free electrons but suffer from an opaque characteristic caused by the narrow energy band gap that absorbs light. However, transparent conductive oxide (TCO) exhibits nonmetallic insulator and metallic conductor characteristics, including high transmittance and low electrical resistance [1,2]. These properties make TCO suitable for various industries, including liquid crystal displays, solar cells, and thin-film transistors [3,4,5,6]. These industries require high reflectivity in the infrared region, high transmittance in the visible spectral range, strong absorption in the UV region, and high electrical conductivity. To meet the requisite performance requirements, the surface must be uniform with low surface roughness [7,8,9,10,11]. Specifically, the high-performance organic light-emitting diode (OLED) display industry is significantly impacted by the surface roughness of the transparent conductive film utilized as the anode, affecting the current density and leakage current [12,13]. Among these materials, ITO possesses low resistivity and outstanding chemical stability [14]. Therefore, studying the surface improvement of TCO thin films is crucial for enhancing their performance, and the most renowned method of enhancing performance is by improving the surface of ITO thin films. Research focused on improving the surface roughness and surface properties of ITO thin films is ongoing to increase their transmittance. Kurdesau et al. successfully obtained high transmittance and low surface resistivity by refining surface properties through regulating the sputtering conditions [15]. Jung et al. (2018) conducted a study to determine the optimal conditions for transmittance and the lowest surface roughness by varying parameters during the sputtering process [16]. Moshabakiet et al. found optimal conditions to minimize surface roughness by controlling the flow rate and deposition rate of argon gas when sputtering an ITO thin film on a glass substrate with oxygen and argon gas. In addition, it was confirmed that surface roughness was reduced through ultrasonic polishing, thereby improving performance [17]. Liu (2019) utilized the Taguchi method to apply mechanical and chemical processing techniques to the ITO surface, aiming to achieve optimal luminous efficiency [18]. Jung et al. conducted a study on the impact of mechanically polished and annealed ITO substrates on tris-(8-hydroxyquinoline) aluminum (Alq3)-based light-emitting diodes. The findings demonstrated that mechanical polishing effectively improves display performance by reducing surface roughness [9]. Wu’s research revealed that electrochemical machining (ECM) reduces the root mean square of the surface roughness of ITO thin films to less than 1 nm by controlling the concentration of organic acids [19]. Lee utilized the high-frequency magnetron sputtering method to cultivate the ITO thin film on a glass substrate. This technique yielded optimal conditions of high removal rate, low resistivity, and high transmittance using the chemical mechanical polishing process [20]. Additionally, Lee and Gupta’s research indicated that CMP resulted in increased surface uniformity and improved transmittance of ITO thin films [21,22]. Li et al. confirmed that chemical polishing of a film can reduce film surface roughness, surface defects, and leakage current and improve photoelectric properties [23]. In addition, in the case of research on precision grinding, a representative surface processing method, Li et al. analyzed the gallium nitride (GaN) single-crystal ultraprecision machining process according to feed speed, tool rotation speed, and particle size through experiments and MD simulations [24]. Qu et al. conducted a study on the difference in quality of grinding materials depending on the optimal value of carbon in grinding oil [25]. Previous research demonstrated that polishing can enhance surface properties and improve efficiency in display applications. Thus, it is essential to utilize precision finishing techniques like the magnetic abrasive polishing (MAP) process for ultraprecise microabrasive machining to enhance the surface properties of ITO thin films [26,27].
The MAP process involves a brush made up of magnetic particles and abrasive particles to accomplish this task. Brushes made up of particles possess adaptable traits and can be utilized for processing purposes irrespective of the workpiece’s shape, including small crevices and free-form surfaces. The stimulation-driven interaction between the magnetic lines of force results in the formation of microsized magnetic particles, as depicted in Figure 1.
MAP offers several advantages, including the ability to process nanoscale thicknesses, no geometric limitations, and the production of high-precision surfaces [28,29,30,31]. Pashmforoush, F. et al. utilized MAP for the surface finishing of brittle optical glass and examined its impact on surface roughness with various process parameters [32]. Mosavat, M. et al. also used MAP for the surface finishing of brittle silicon wafers and investigated the material removal mechanism [33].
The MAP process is commonly employed as a surface-finishing method to achieve uniformity on the surfaces of different materials [34]. This demonstrates that the MAP process is appropriate for processing ITO thin films, which require surface uniformity to enhance their surface properties. The MAP process is an effective surface processing technique. However, the process’s complexity and several variables, including cutting conditions, material properties, environmental conditions, tool geometry, and vibration, could reduce surface quality [35]. Thus, to achieve high-quality thin-film surfaces, the influence of different variables must be considered. In addition, defects that occur during or after machining can result in surface deterioration that is difficult to identify with the naked eye. As a solution, a sensor monitoring system was implemented in the MAP process to confirm such defects through optical inspection. Sensor monitoring observes the process in real time, enabling the estimation of machining conditions and processing outcomes. This makes it feasible to anticipate surface quality findings in advance, granting it suitability for analyzing the influence of diverse variables.
Acoustic emission (AE) sensors, among other types, are capable of detecting material deterioration, friction, fracture, and damage. These sensors have been frequently used in monitoring studies, including for the surface and tool condition of machining specimens [36,37,38,39]. The signal data from AE sensors can yield information on the properties of materials and the causal factors behind their occurrence. Figure 2 displays the standard parameters of the AE signal in the time domain throughout signal processing. These parameters incorporate count, threshold, AE energy, and RMS (root mean square) and can be used to estimate the occurrence, location, and nature of a phenomenon.
Microscopic phenomena, such as the formation, growth, and wear of microcracks within the material, can be detected through the use of AE sensors [40,41]. This ability allows for monitoring even in cases of minor damage, such as in collisions or instances of limited destruction.
As a result, AE sensors were utilized as a monitoring mechanism in this study to minimize surface defects in ITO thin films during the MAP procedure while simultaneously achieving the smoothest possible surface roughness. The factors affecting the surface roughness of ITO-coated thin films during the MAP process were verified through theoretical confirmation, magnetic density simulation, and pressure measurement using a force sensor. Optimal processing conditions were subsequently determined through ANOVA analysis based on the processing conditions to confirm the results.
Additionally, the optimal processing conditions for roughness were compared with the optimal conditions obtained through the parameters of the AE sensor signal to determine if they can be accurately predicted and analyze the resulting correlation. Therefore, this study conducted theoretical verification in Section 2 through measured machining pressure and magnetic density simulation in the MAP process. In this section, we identified the factors that impact surface roughness and examined the correlation between machining pressure and surface quality using experimental results. This information was then used to determine the optimal conditions. Signal monitoring with the AE sensor in Section 3 facilitated real-time detection of defects and improved surface quality. In this section, the effect of signal parameters detected by the AE sensor was analyzed to predict surface roughness. The optimal conditions were derived using ANOVA analysis. Through coherent linkage between subsections, this study offers an approach to surface polishing and quality control in the MAP process. By using a blend of theoretical analysis, experiments, simulations, and signal monitoring with AE sensors, our method allows for the real-time evaluation and enhancement of surface quality.
2. Theoretical Validation
Assuming that the polishing surface of the ITO thin film has a uniform profile, as shown in Figure 3 in the MAP process, the true contact length between the workpiece and the magnetic abrasive can be defined as follows [42]:
In the equation, is the initial surface roughness, is the surface roughness, is the magnetic abrasive velocity, is the machining time, and is the average angle of surface roughness. The force applied by a magnetic abrasive can be expressed as
In the equation, F is the total force exerted on the machining region, N is the number of magnetic particles simultaneously acting on the machining region, D is the mean diameter of the magnetic particles, and P is the machining pressure. Meanwhile, the force applied by a cutting edge of a magnetic abrasive, denoted as , can be expressed as the following.
The amount of material removed by the cutting edge during processing time t can be calculated using Equation (4) as per the equation of the microcutting mechanism [43].
In the equation, represents the hardness of the workpiece. To determine the total material removal amount, multiply the removal amount of one cutting edge, , by the number of cutting edges, n, and the number of magnetic abrasives, N.
Thus, the surface roughness can be organized using the above equation as follows:
In terms of the initial surface roughness, machined workpiece length, and volume of material removed by a cutting edge—which can be disregarded due to their constant values in the same machining process—the magnetic abrasive’s force on one cutting edge and the total force acting on the machining area F have the greatest impact on surface roughness. Both forces and are predominantly influenced by machining pressure P, assuming the abrasive diameter remains constant.
MAP is a mechanical polishing process that uses brushes created by magnetic force. The pressure P [26] of the brush generated by the magnetic force lines can be expressed using the following equation.
In the theoretical Equation (7) for machining pressure, B represents flux density, denotes vacuum permeability, refers to the relative permeability of the magnetic particles, and stands for the volume fraction of pure iron present in one particle. It is evident that the magnetic flux density has the most significant impact on the machining pressure, given that it is directly proportional to the square of the flux density. To compare the effects of machining pressure and surface roughness values for each condition, we analyzed the flux density and measured the machining pressure for each machining condition.
2.1. Machining Pressure
Through the use of Equation (7), it was established that the machining pressure is the most significant factor in the MAP process. As a result, measurements of machining pressure were undertaken under various conditions during the MAP process of ITO thin films for validation against theoretical predictions and to analyze their correlation with MAP process parameters. To measure the machining pressures applied by the MAP tool on the ITO thin films, an experiment like that depicted in Figure 4 was conducted. Realistic conditions resembling those of the actual MAP process were replicated to evaluate the pressures exerted on ITO thin films. To ensure consistency with the genuine experiment, a force sensor (Kistler, 9257B, Winterthur, Switzerland) was implemented to secure the samples and maintain an unchanged quantity of abrasive particles. Subsequently, the machining pressure was assessed during the 30 s contact period when the magnetic abrasive particles met the predetermined gap for machining and came into contact with the samples. This study shows how machining pressure affects ITO thin films during the MAP process and confirms the agreement between experimental conditions and theoretical analysis.
Figure 5 displays the ITO-thin-film specimen utilized in the experiment, observed under an optical microscope, showcasing a thickness of 200 nm. Table 1 illustrates the characteristics of the sample, confirming that ITO bears crystalline properties akin to those of standard metals or minerals.
To determine the process parameters for this experiment, we reviewed the Preston equation (Equation (8)) [33] and the theoretical concepts of magnetic abrasive processes. As a result, we selected the rotational speed of the tool (A), the gap between the tool and the workpiece (B), and the particle size (C) as factors that influence the process.
is the depth of wear over time. Here, represents the contact area, represents the total pressure load during polishing, and refers to the relative moving distance between the area where wear occurred and the specimen surface, which can be expressed as the sliding distance. , known as Preston’s constant, depends on the properties of the abrasive grain and specimen. Key variables that can impact surface roughness were initially chosen from the various processing variables in the MAP process. The preliminary experiments determined the level of each selected factor, and the chosen factors and their levels are demonstrated in Table 2.
For the magnetic abrasive particles, we used bonded-type particles, which combined carbonyl iron powder and diamond powder in a ratio of 6:4, and the number of particles used in the experiment was 0.3 g. Figure 6 shows the magnetic polishing particles used in the experiment.
The processing pressure measurement results for the ITO thin film are displayed in Figure 7, Figure 8 and Figure 9, which detail the measurement results for the processing pressure based on processing gap, particle size, and RPM. Figure 7 illustrates the working gap with regard to rotation speed and abrasive grain conditions, revealing that the smaller the working gap, the higher the machining pressure. Figure 8 illustrates how the rotation speed and processing pressure conditions affect the processing pressure of each abrasive particle. For 25–75 μm size particles, the difference in machining pressure between processing gaps is minimal, while for 75–200 μm size particles, the difference in machining pressure is significant. Additionally, it is evident that there is no noteworthy alteration in the variation of machining pressure in the working gap, with the exception of the working gap at a diameter of 0.2 mm. When comparing the machining pressure based on the rotational speed under different abrasive particle and working gap conditions, there is usually no significant change in machining pressure (Figure 9). However, in the particle size range of 75–200 μm at 800 RPM, the machining pressure is relatively high. This observation confirms that the working gap is the main factor influencing the measurement of machining pressure. When combining all conditions for machining pressure, it was determined that the highest pressure occurs with a 0.4 mm working gap, a rotation condition of 400 RPM, and a particle size of 75–125 μm. These conditions can be denoted as A1B2C2.
Therefore, according to the theoretical equation, processing pressure is the key factor that has the most significant influence during MAP processing. If the theoretical predictions align with experimental results, the optimal processing conditions for MAP processing of ITO thin films can be assumed to be A1B2C2.
2.2. Magnetic Flux Density Simulation
Since the working pressure is proportional to the square of the flux density, it can be seen that the influence of the flux density is the largest. Therefore, since the working gap is the most decisive factor affecting the machining pressure in the previous experiment, we analyzed the flux density according to the working gap condition in Table 2. According to the theory, the smaller the working gap, the larger the machining pressure, so in this simulation, the smaller the working gap, the larger the magnetic flux density should be. Since the magnetic properties depend on the type and shape of the magnet, the magnet used in the previous machining pressure experiment was modeled and used. The simulation was performed using the software ANSYS Magnetostatic.
Using ANSYS, the magnetic tool was modeled as shown in Figure 10a. Figure 10b shows the mesh of the magnet. The magnet used in the modeling is a neodymium ANB10 with the physical properties of coercive force 4.4 × A/m and residual induction 0.7 T, and the cross-sectional area of the magnet is 15.9 . Figure 11 illustrates the analysis of flux density variation based on the geometry of a pure iron tool. The tool geometry plays a crucial role in transmitting the overall magnetic force, as flux density varies with it.
Figure 12 shows the distribution of magnetic flux density as a function of the working gap between the pure iron tool and the machined surface. The analyzed working gaps of 0.2 mm, 0.4 mm, and 0.6 mm are consistent with the previously tested parameters. The distribution of magnetic flux density alters with fluctuations in the working gap. The maximum flux density for each working gap is observed near 3 and 6 mm. As the working gap increases, the flux density appears to spread evenly. At the smallest working gap of 0.2 mm, the flux density is at its highest, but the distribution is uneven (refer to Figure 12a). The flux density is the lowest at a 0.6 mm working gap but it is evenly distributed (refer to Figure 12c). It is evident from the results that the magnetic flux density in the vertical direction varies slightly from that in the horizontal direction, indicating the effect of the working gap on flux density, which is not uniform in all directions. Additionally, we observe an inverse relationship between the magnetic flux density and the working gap. A narrower working gap results in a larger magnetic flux density. Therefore, this aligns with the theoretical expression derived previously and is in accordance with the experiments conducted earlier.
3. MAP Process Using the AE Sensor Monitoring System
In this study, a polishing system was designed by combining a magnetic particle polishing system and an AE sensor to minimize surface defects during the polishing of ITO thin film. A schematic diagram of the polishing system for the MAP process of an ITO-thin-film specimen is shown in Figure 13. The MM-250S3 model CNC milling machine from MANIX, commonly used for processing metal materials, was utilized in the experiment. The milling machine rotates the workpiece fixed on the table while a tool fixed on the main shaft cuts the material into the desired shape. In this experiment, a magnetic tool, with abrasive particles attached at the pure iron tip and a permanent magnet on the body, was used instead of the typical cutting tool.
The AE sensor was placed on a thin glass holder, as depicted in Figure 13. The holder is made of aluminum, which has a sound velocity of 6400 m/s, allowing for faster transmission of sound waves than steel [30]. Consequently, it enables quick AE transmission without direct contact with the glass. The signal detected by the acoustic emission (AE) sensor is transmitted to the AE Node, a portable and multifunctional system from MISTRAS. This system enables AE testing without requiring an external power source or preamplifier. The AE signals are viewable on the computer through the AEwin™ program. Please refer to Table 3 for monitoring conditions.
A design of experiments (DOE) was conducted to characterize each parameter with a minimal number of trials. To reduce the number of experiments, a three-level orthogonal array was utilized. To ensure surface measurements with constant machining time, surface roughness was measured with exclusion of the tool diameter at both ends, which could have been machined for a longer duration due to machine backlash. Table 4 presents the detailed experimental conditions utilizing basic parameters.
The processing time of 30 s for one cycle was determined based on the center line of the polished workpiece using the following equation for the feed.
This study evaluated the surface roughness S/N and the RMS value of the AE signal S/N to determine the ideal conditions for reducing defects in the MAP processing of ITO thin film.
3.1. S/N Results of Surface Roughness
When measuring surface roughness, a defect-free surface typically has a surface roughness with a similar average height, as demonstrated in Figure 14a. However, the presence of defects will create peaks above the average height, as illustrated in Figure 14b, resulting in a higher surface roughness value for the specimen. It is crucial to note that defects on the surface might include elevated protrusions or depressions. Hence, with the minimization of defects, the surface roughness value decreases in correspondence with the ‘the smaller is the better’ characteristic.
Therefore, the S/N ratio of the surface roughness value is calculated as shown in the following equation.
Table 5 was created to determine the main effects of the levels of the parameters in Table 2. It shows the average surface roughness and S/N ratio for the experimental conditions. The S/N ratio was calculated based on the surface roughness measurements and quantitatively measures the signal-to-noise ratio for each experimental setting. A higher S/N ratio indicates a more favorable surface roughness. Table 6 shows the SN averages for each level of the following parameters: rotational speed (A), working gap (B), and particle size (C). From Table 6, we can see that the parameter with the largest impact on Ra is the working gap (B) followed by the rotational speed (A).
However, the differences between the delta values of each parameter were not significant, so the difference in influence is not significant. The S/N ratio should have the maximum value to obtain the best polishing condition in the experimental data analysis using the surface roughness value from Equation (5). Therefore, the best polishing condition in Table 6 was A1B2C2.
Figure 15 shows the main effect of each parameter on the SN ratio. It can be seen that a lower rotational speed (A) results in a better surface roughness. For the working gap (B), we can see that a moderate working gap can have a higher surface roughness than a narrow working gap. For the particle size (C), we can see that it has a high surface roughness of up to 125 μm, and then it decreases. Therefore, the combination that can achieve the best surface roughness is A1B2C2, which is consistent with the maximum machining pressure condition experimented with earlier. It can be seen that the processing pressure is the most influential factor for achieving optimal surface roughness during MAP processing of ITO thin films.
3.2. S/N Results of AE ∆RMS
Acoustic emission (AE) is a transient elastic or elastic wave generated by the release of accumulated internal energy when a material undergoes microfracture, dynamic deformation, transformation, dislocation, or fracture. In the MAP process, AE resulting from the polishing process can be considered an energy outflow due to wear. As surface roughness caused by polishing is manifested through complex effects, it is necessary to analyze the continuous signal. To do so, the root mean square (RMS) is applied as the AE parameter in this study.
where represents the average time and V(t) stands for the signal function. RMS denotes the average sound output. If machining remains stable, the acoustic output remains constant. However, if there are any defects or particles breaking away during machining, signals outside a certain range will occur. Therefore, this can be expressed as a deviation from the overall RMS value when expressed as the AE RMS value.
signifies the root mean square value per hit, while denotes the average of the overall root mean square values. A greater ∆RMS value in Equation (12) indicates that the signal is outside of the average range, thereby implying that defects or particles have escaped, which suggests unstable machining. Conversely, a smaller ∆RMS value corresponds to a more stable signal, characterized by the reticular feature. Accordingly, the signal-to-noise ratio was determined using Equation (10). When gathering acoustic emission signals, the decibel level of the tool rotation prior to the machining process served as the threshold value. Additionally, all signals produced during the entire machining process were collected and analyzed. Table 7 shows RMS and SN ratio values for each experimental condition. A larger SN ratio indicates a more stable signal. Therefore, the most stable signal condition in Table 7 is A1B2C2. Table 8 shows the average SN ratio for each parameter level. Figure 16 is a main effect diagram, which intuitively shows the largest value for each parameter based on the values in Table 8.
Table 8 shows that the particle size (C) has the greatest impact on the stable signal in RMS. The next most influential parameter is the rotational speed (A). The analysis of Figure 16 reveals the relationship between the process parameters (rotational speed, working gap, and particle size) and the stability of the acoustic emission (AE) signal during the MAP machining of ITO thin film. This means that slow tool rotation contributes to better process stability during machining.
For the working gap (B), a moderate working gap distance shows a more stable signal compared to a narrow working gap. This implies that an optimal working gap is crucial for achieving stable machining conditions. Regarding the particle size (C), a stable signal was observed up to a particle size of 125 μm, after which it decreased. Therefore, the combination that gives the most stable signal is A1B2C2. This is consistent with the trend observed in the Ra (surface roughness) main effect plots and aligns with the optimal condition for achieving the desired surface finish. However, the influence of the parameters on the AE ∆RMS value (deviation from the overall RMS) and Ra (surface roughness) shows disagreement. For Ra, the working gap (B), rotational speed (A), and particle size (C) are the most influential, while for ∆RMS, the opposite is true. That is, particle size (C), rotational speed (A), and working gap (B) are the most influential. These results show that there is a correlation between the AE ∆RMS value and Ra during MAP machining of ITO-coated Pyrex glass. This correlation is that the AE ∆RMS value can potentially predict optimal surface roughness (Ra) without directly measuring Ra.
4. Discussion
The MAP procedure of the ITO thin film exhibited specific traits on the surface. Figure 17 demonstrates that the surface state of the ITO thin film conforms to the magnetic density trend observed and analyzed in the ANSYS simulation findings. A graphical depiction of the MAP machining pattern on the ITO thin film illustrates that the pattern gradually diminishes when the working gap grows wider.
MAP processing of ITO-coated Pyrex glass resulted in various defects on the surface of the specimen. Figure 18 shows defects in ITO thin films that machining events in the MAP process can cause. Figure 18a shows pitting, which is about 0.7 μm in size and has a very small groove shape. Figure 18b shows delamination, where particles that fell off the magnetic particle brush were pushed off the surface of the specimen. This figure shows the coating that was peeled off along with the path the particle traveled. In Figure 18c, we can see that fatigue caused the particles to make indentations and lift the thin film upward. This is caused by particles that fell off the magnetic particle brush and became embedded in the surface. In Figure 18d, evidence of the dislodged particles spreading and rolling over the surface irregularly can be seen. This appears as an irregular scratching phenomenon. This shows that the dropped particles from the magnetic particle brush mainly cause defects in the MAP process of ITO thin films.
The S/N ratio of each parameter shows the best and worst conditions for surface roughness and AE RMS. The analysis of surface roughness and AE RMS shows that the optimal condition is A1B2C2, and the worst condition is A3B1C3, but there is a difference in the influence of the factors. Machining pressure was largest for A1B2C2, which is the same as the optimal condition. Surface roughness is affected by the material removal rate of the specimen and is therefore most affected by the machining clearance, such as the machining pressure. However, for the AE RMS value, it can be seen that surface roughness is most affected by the particle size, as the movement of the abrasive particle generates the signal. In addition, the conditions of the machining pressure and flux density simulation in the optimal condition are consistent with the conditions of the surface roughness and AE RMS, which confirmed that the trend of the mean of the SN ratio of the surface roughness and AE RMS was predictable.
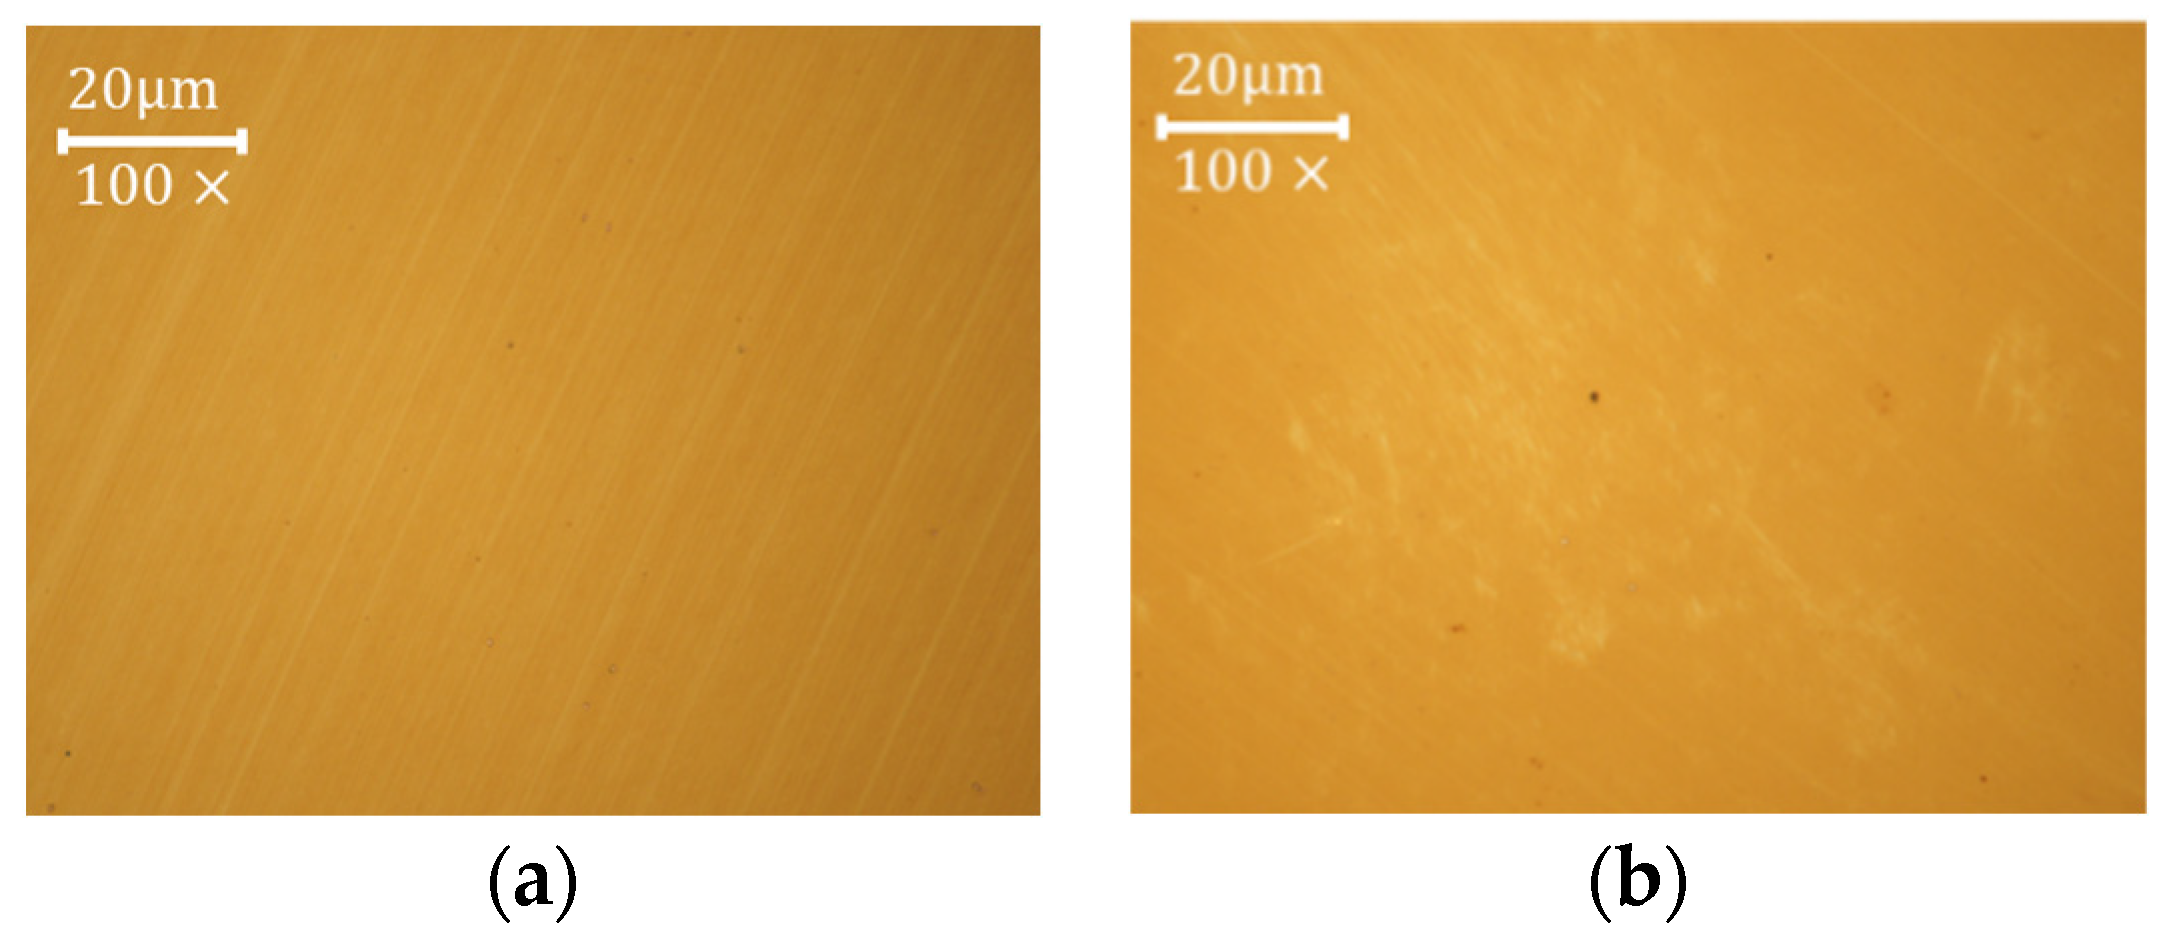
Figure 19a shows the surface condition of ITO thin film processed under the best and worst conditions. It can be seen that irregular scratches and other defects do not exist in the case of the optimal conditions. However, pitting and irregular scratch defects exist in the worst conditions, so defect occurrence can be predicted according to the SN ratio of surface roughness and AE RMS.
5. Conclusions
This study examined the surface polishing of ITO-coated Pyrex glass via MAP implemented with AE sensors, specifically for real-time defect monitoring. To detect and confirm defects during polishing and deliver an instant understanding of machinery conditions and outcomes, a real-time defect detection system featuring AE sensors was incorporated into the MAP procedure. Since AE sensors can detect many potential problems, including microscopic damage, friction, fracture, and material distortion, we used this sensor data to reduce defects and improve the surface roughness of ITO thin films during MAP.
This study demonstrates the significance of stable processing conditions in reducing surface wear and defects. The ΔRMS value can be used to forecast surface conditions. The ideal conditions for surface wear are at 400 rpm, 4 mm, and 75–125 μm, while the least optimal conditions occur at 800 rpm, 0.2 mm, and 125–200 μm. This highlights the alignment between the optimal and worst conditions for Ra and ΔRMS. Additionally, the Taguchi method identified the Ra and ΔRMS conditions that yielded the highest machining pressure for each parameter. This highlights the significant impact of machining pressure on both optimal surface wear and stable processing conditions. Ultimately, it is possible to derive optimal conditions that enhance surface quality through stable processing conditions. The importance of altering machining pressure is apparent, providing the opportunity to decrease defects or enhance surface wear. Furthermore, utilizing AE sensors is advantageous in detecting defects, offering technical insights that benefit MAP processing of other thin films. Additionally, this study confirmed that defects may arise due to particle dislodgment and uneven flux density distribution. Therefore, further research is necessary to develop devices that take into account both particle stability and flux density distribution.
The results of this study suggest methods for improving surface quality that can be used in a variety of industries. Through this research, we can learn how to improve the surface of ITO thin films and reduce defects. This can help improve the performance of electronic products such as OLED displays and solar cells. Additionally, this research can help optical equipment manufacturers improve the performance of lenses or optical sensors by improving the surfaces of optical materials. The semiconductor industry can also use these research results to improve the surface quality of semiconductor materials and increase production efficiency. This methodology can be used in a variety of industries and is expected to contribute to innovative manufacturing processes.
Author Contributions
All authors contributed to the study conception and design. Material preparation, data collection, and analysis were performed by H.-J.K., H.-H.L. and S.-H.L. The first draft of the manuscript was written by H.-J.K. and all authors commented on subsequent versions of the manuscript. All authors have read and agreed to the published version of the manuscript.
Funding
This work was supported by a Korea Evaluation Institute of Industrial Technology (KEIT) grant funded by the Korean government (MOTIE) (No. 20019223, Developing Automated Defect Repair AFM System with Detecting and Analyzing Defects of EUV Masks) and a National Research Foundation of Korea (NRF) grant funded by the Korea government (MSIT) (No. NRF-2020R1F1A1074814).
Informed Consent Statement
Not applicable.
Data Availability Statement
The data presented in this study are available on request from the corresponding author.
Conflicts of Interest
The authors declare no conflict of interest.
References
- Alam, M.J.; Cameron, D.C. Investigation of annealing effects on sol–gel deposited indium tin oxide thin films in different atmospheres. Thin Solid Film. 2002, 420, 76–82. [Google Scholar] [CrossRef]
- Wan, N.; Wang, T.; Sun, H.; Chen, G.; Geng, L.; Gan, X.; Guo, S.; Xu, J.; Xu, L.; Chen, K. Indium tin oxide thin films for silicon-based electro-luminescence devices prepared by electron beam evaporation method. J. Non-Cryst. Solids 2010, 356, 911–916. [Google Scholar] [CrossRef]
- Gwamuri, J.; Vora, A.; Mayandi, J.; Güney, D.Ö.; Bergstrom, P.L.; Pearce, J.M. A new method of preparing highly conductive ultra-thin indium tin oxide for plasmonic-enhanced thin film solar photovoltaic devices. Sol. Energy Mater. Sol. Cells 2016, 149, 250–257. [Google Scholar] [CrossRef]
- Siddiqui, M.S.; Saxena, A.K.; Singh, S.P. Deposition and characterization of ITO thin film over glass for defogger application and for solar photovoltaics. Int. J. Curr. Eng. Technol 2018, 8, 900–903. [Google Scholar] [CrossRef]
- Sarhaddi, R.; Shahtahmasebi, N.; Rokn-Abadi, M.R.; Bagheri-Mohagheghi, M.M. Effect of post-annealing temperature on nano-structure and energy band gap of indium tin oxide (ITO) nano-particles synthesized by polymerizing–complexing sol–gel method. Phys. E Low-Dimens. Syst. Nanostructures 2010, 43, 452–457. [Google Scholar] [CrossRef]
- Krasilnikova Sytchkova, A.; Grilli, M.L.; Boycheva, S.; Piegari, A. Optical, electrical, structural and microstructural characteristics of rf sputtered ITO films developed for art protection coatings. Appl. Phys. A 2007, 89, 63–72. [Google Scholar] [CrossRef]
- Wu, C.C.; Wu, C.I.; Sturm, J.C.; Kahn, A. Surface modification of indium tin oxide by plasma treatment: An effective method to improve the efficiency, brightness, and reliability of organic light emitting devices. Appl. Phys. Lett. 1997, 70, 1348–1350. [Google Scholar] [CrossRef]
- Fujita, S.F.S.; Sakamoto, T.S.T.; Ueda, K.U.K.; Ohta, K.O.K.; Fujita, S.F.S. Surface treatment of indium-tin-oxide substrates and its effects on initial nucleation processes of diamine films. Jpn. J. Appl. Phys. 1997, 36, 350. [Google Scholar] [CrossRef]
- Jung, S.; Park, N.G.; Kwak, M.Y.; Kim, B.O.; Choi, K.H.; Cho, Y.J.; Kim, Y.K.; Kim, Y.S. Surface treatment effects of indium–tin oxide in organic light-emitting diodes. Opt. Mater. 2003, 21, 235–241. [Google Scholar] [CrossRef]
- Krč, J.; Zeman, M.; Kluth, O.; Smole, F.; Topič, M. Effect of surface roughness of ZnO: Al films on light scattering in hydrogenated amorphous silicon solar cells. Thin Solid Film. 2003, 426, 296–304. [Google Scholar] [CrossRef]
- Jun, D.G.; Lee, Y.L.; Lee, K.M. Structural and electrical characteristics of IZO thin films with deposition temperature. J. Semicond. Disp. Technol. 2011, 10, 67–74. [Google Scholar]
- Hung, L.S.; Chen, C.H. Recent progress of molecular organic electroluminescent materials and devices. Mater. Sci. Eng. R Rep. 2002, 39, 143–222. [Google Scholar] [CrossRef]
- Lee, B.K.; Lee, K.M. Effect of the surface roughness of ITO thin films on the characteristics of OLED device. J. Semicond. Disp. Technol. 2009, 8, 49–52. [Google Scholar]
- Yang, S.; Sun, B.; Liu, Y.; Zhu, J.; Song, J.; Hao, Z.; Zeng, X.; Shu, Y.; Chen, J.; Yi, J.; et al. Effect of ITO target crystallinity on the properties of sputtering deposited ITO films. Ceram. Int. 2020, 46, 6342–6350. [Google Scholar] [CrossRef]
- Kurdesau, F.; Khripunov, G.; Da Cunha, A.F.; Kaelin, M.; Tiwari, A.N. Comparative study of ITO layers deposited by DC and RF magnetron sputtering at room temperature. J. Non-Cryst. Solids 2006, 352, 1466–1470. [Google Scholar] [CrossRef]
- Jung, Y.S.; Seo, J.Y.; Lee, D.W.; Jeon, D.Y. Influence of DC magnetron sputtering parameters on the properties of amorphous indium zinc oxide thin film. Thin Solid Film. 2003, 445, 63–71. [Google Scholar] [CrossRef]
- Moshabaki, A.; Kadivar, E.; Firoozifar, A. Influence of Process Parameters on Optical and Physical Properties of Ito Thin Film. Surf. Rev. Lett. 2020, 27, 1950183. [Google Scholar] [CrossRef]
- Liu, J.M.; Lu, P.Y.; Weng, W.K. Studies on modifications of ITO surfaces in OLED devices by Taguchi methods. Mater. Sci. Eng. B 2001, 85, 209–211. [Google Scholar] [CrossRef]
- Wu, Y.F.; Ru, Y.L. Electrochemical polishing of ITO films. Microelectron. Eng. 2010, 87, 2549–2554. [Google Scholar] [CrossRef]
- Lee, K.Y.; Choi, G.W.; Kim, Y.J.; Choi, Y.O.; Kim, N.O. Chemical mechanical polishing characteristics of ITO thin film prepared by RF magnetron sputtering. J. Korean Phys. Soc. 2012, 60, 388–392. [Google Scholar] [CrossRef]
- Lee, W.S.; Choi, G.W.; Seo, Y.J. Surface planarization of ZnO thin film for optoelectronic applications. Microelectron. J. 2009, 40, 299–302. [Google Scholar] [CrossRef]
- Gupta, S.; Kumar, P.; Chakkaravathi, A.A.; Craciun, D.; Singh, R.K. Investigation of chemical mechanical polishing of zinc oxide thin films. Appl. Surf. Sci. 2011, 257, 5837–5843. [Google Scholar] [CrossRef]
- Li, Y.; Wang, Y.; Zhang, W.; Cao, K.; Li, Y.; Zha, G.; Tan, T. The effect of chemical polishing treatment on the microstructure, photoelectric properties of CdZnTe polycrystalline films. Mater. Sci. Semicond. Process. 2021, 124, 105608. [Google Scholar] [CrossRef]
- Li, C.; Piao, Y.; Meng, B.; Hu, Y.; Li, L.; Zhang, F. Phase transition and plastic deformation mechanisms induced by self-rotating grinding of GaN single crystals. Int. J. Mach. Tools Manuf. 2022, 172, 103827. [Google Scholar] [CrossRef]
- Qu, S.; Yao, P.; Gong, Y.; Chu, D.; Yang, Y.; Li, C.; Wang, Z.; Zhang, X.; Hou, Y. Environmentally friendly grinding of C/SiCs using carbon nanofluid minimum quantity lubrication technology. J. Clean. Prod. 2022, 366, 132898. [Google Scholar] [CrossRef]
- Shinmura, T.; Takazawa, K.; Hatano, E.; Matsunaga, M.; Matsuo, T. Study on magnetic abrasive finishing. CIRP Ann. 1990, 39, 325–328. [Google Scholar] [CrossRef]
- Singh, D.K.; Jain, V.K.; Raghuram, V. Parametric study of magnetic abrasive finishing process. J. Mater. Process. Technol. 2004, 149, 22–29. [Google Scholar] [CrossRef]
- Lee, S.H. Surface finishing of nanoscratch patterns on coated pyrex glasses using MAF. Surf. Rev. Lett. 2017, 24, 1750043. [Google Scholar] [CrossRef]
- Jain, V.K. Magnetic field assisted abrasive based micro-/nano-finishing. J. Mater. Process. Technol. 2009, 209, 6022–6038. [Google Scholar] [CrossRef]
- Mori, T.; Hirota, K.; Kawashima, Y. Clarification of magnetic abrasive finishing mechanism. J. Mater. Process. Technol. 2003, 143, 682–686. [Google Scholar] [CrossRef]
- Lee, H.H.; Lee, S.H. Analysis of the Material Removal Rate in Magnetic Abrasive Finishing of Thin Film Coated Pyrex Glass. Surf. Rev. Lett. 2017, 24 (Supp. S1), 1850004. [Google Scholar] [CrossRef]
- Pashmforoush, F.; Rahimi, A. Nano-finishing of BK7 optical glass using magnetic abrasive finishing process. Appl. Opt. 2015, 54, 2199–2207. [Google Scholar] [CrossRef] [PubMed]
- Mosavat, M.; Rahimi, A. Numerical-experimental study on polishing of silicon wafer using magnetic abrasive finishing process. Wear 2019, 424, 143–150. [Google Scholar] [CrossRef]
- Shanbhag, V.V.; Naveen, K.; Balashanmugam, N.; Vinod, P. Modelling for evaluation of surface roughness in magnetic abrasive finishing of flat surfaces. Int. J. Precis. Technol. 2016, 6, 159–170. [Google Scholar] [CrossRef]
- Zhang, S.J.; To, S.; Wang, S.J.; Zhu, Z.W. A review of surface roughness generation in ultra-precision machining. Int. J. Mach. Tools Manuf. 2015, 91, 76–95. [Google Scholar] [CrossRef]
- Asiltürk, İ.; Tinkir, M.; El Monuayri, H.; Çelik, L. An intelligent system approach for surface roughness and vibrations prediction in cylindrical grinding. Int. J. Comput. Integr. Manuf. 2012, 25, 750–759. [Google Scholar] [CrossRef]
- Aguiar, P.R.; Cruz, C.E.; Paula, W.C.; Bianchi, E.C.; Thomazella, R.; Dotto, F.R. Neural network approach for surface roughness prediction in surface grinding. In Proceedings of the 25th IASTED International Multi-Conference: Artificial Intelligence and Applications, Innsbruck, Austria, 12–14 February 2007; pp. 96–101. [Google Scholar]
- Griffin, J.M.; Diaz, F.; Geerling, E.; Clasing, M.; Ponce, V.; Taylor, C.; Turner, S.; Michael, E.A.; Mena, F.P.; Bronfman, L. Control of deviations and prediction of surface roughness from micro machining of THz waveguides using acoustic emission signals. Mech. Syst. Signal Process. 2017, 85, 1020–1034. [Google Scholar] [CrossRef]
- Oh, J.H.; Lee, S.H. Prediction of surface roughness in magnetic abrasive finishing using acoustic emission and force sensor data fusion. Proc. Inst. Mech. Eng. Part B J. Eng. Manuf. 2011, 225, 853–865. [Google Scholar] [CrossRef]
- Hampton, J.; Gutierrez, M.; Matzar, L. Microcrack damage observations near coalesced fractures using acoustic emission. Rock Mech. Rock Eng. 2019, 52, 3597–3608. [Google Scholar] [CrossRef]
- Chen, M.; Li, M.; Zhao, L.; Liu, J. Tool wear monitoring based on the combination of machine vision and acoustic emission. Int. J. Adv. Manuf. Technol. 2023, 125, 3881–3897. [Google Scholar] [CrossRef]
- Kim, J.-D.; Choi, M.-S. Simulation for the prediction of surface-accuracy in magnetic abrasive machining. J. Mater. Process. Technol. 1995, 53, 630–642. [Google Scholar] [CrossRef]
- Rabinowicz, E.D.L.R.P.; Dunn, L.A.; Russell, P.G. A study of abrasive wear under three-body conditions. Wear 1961, 4, 345–355. [Google Scholar] [CrossRef]
Figure 1.
Schematic of magnetic abrasive polishing.
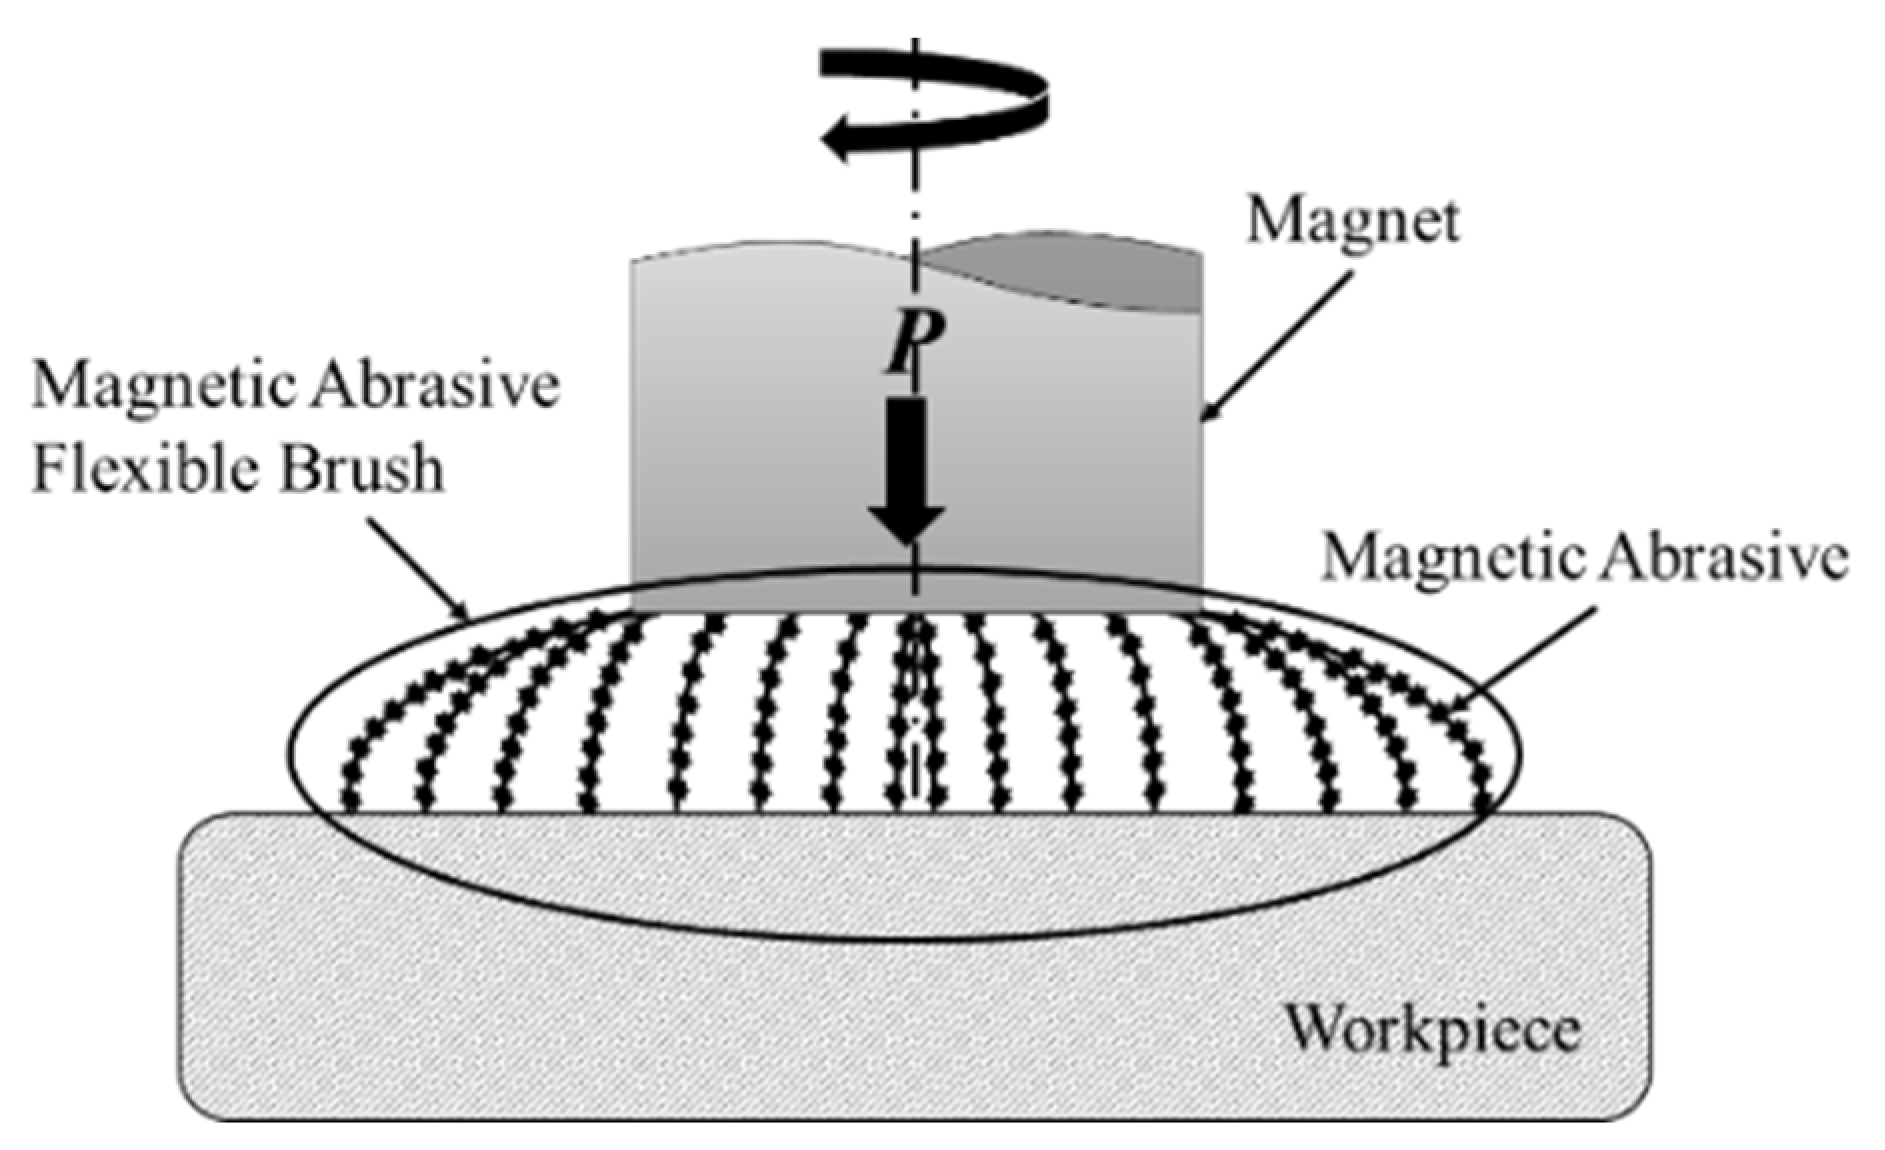
Figure 2.
Schematic of acoustic emission parameters.
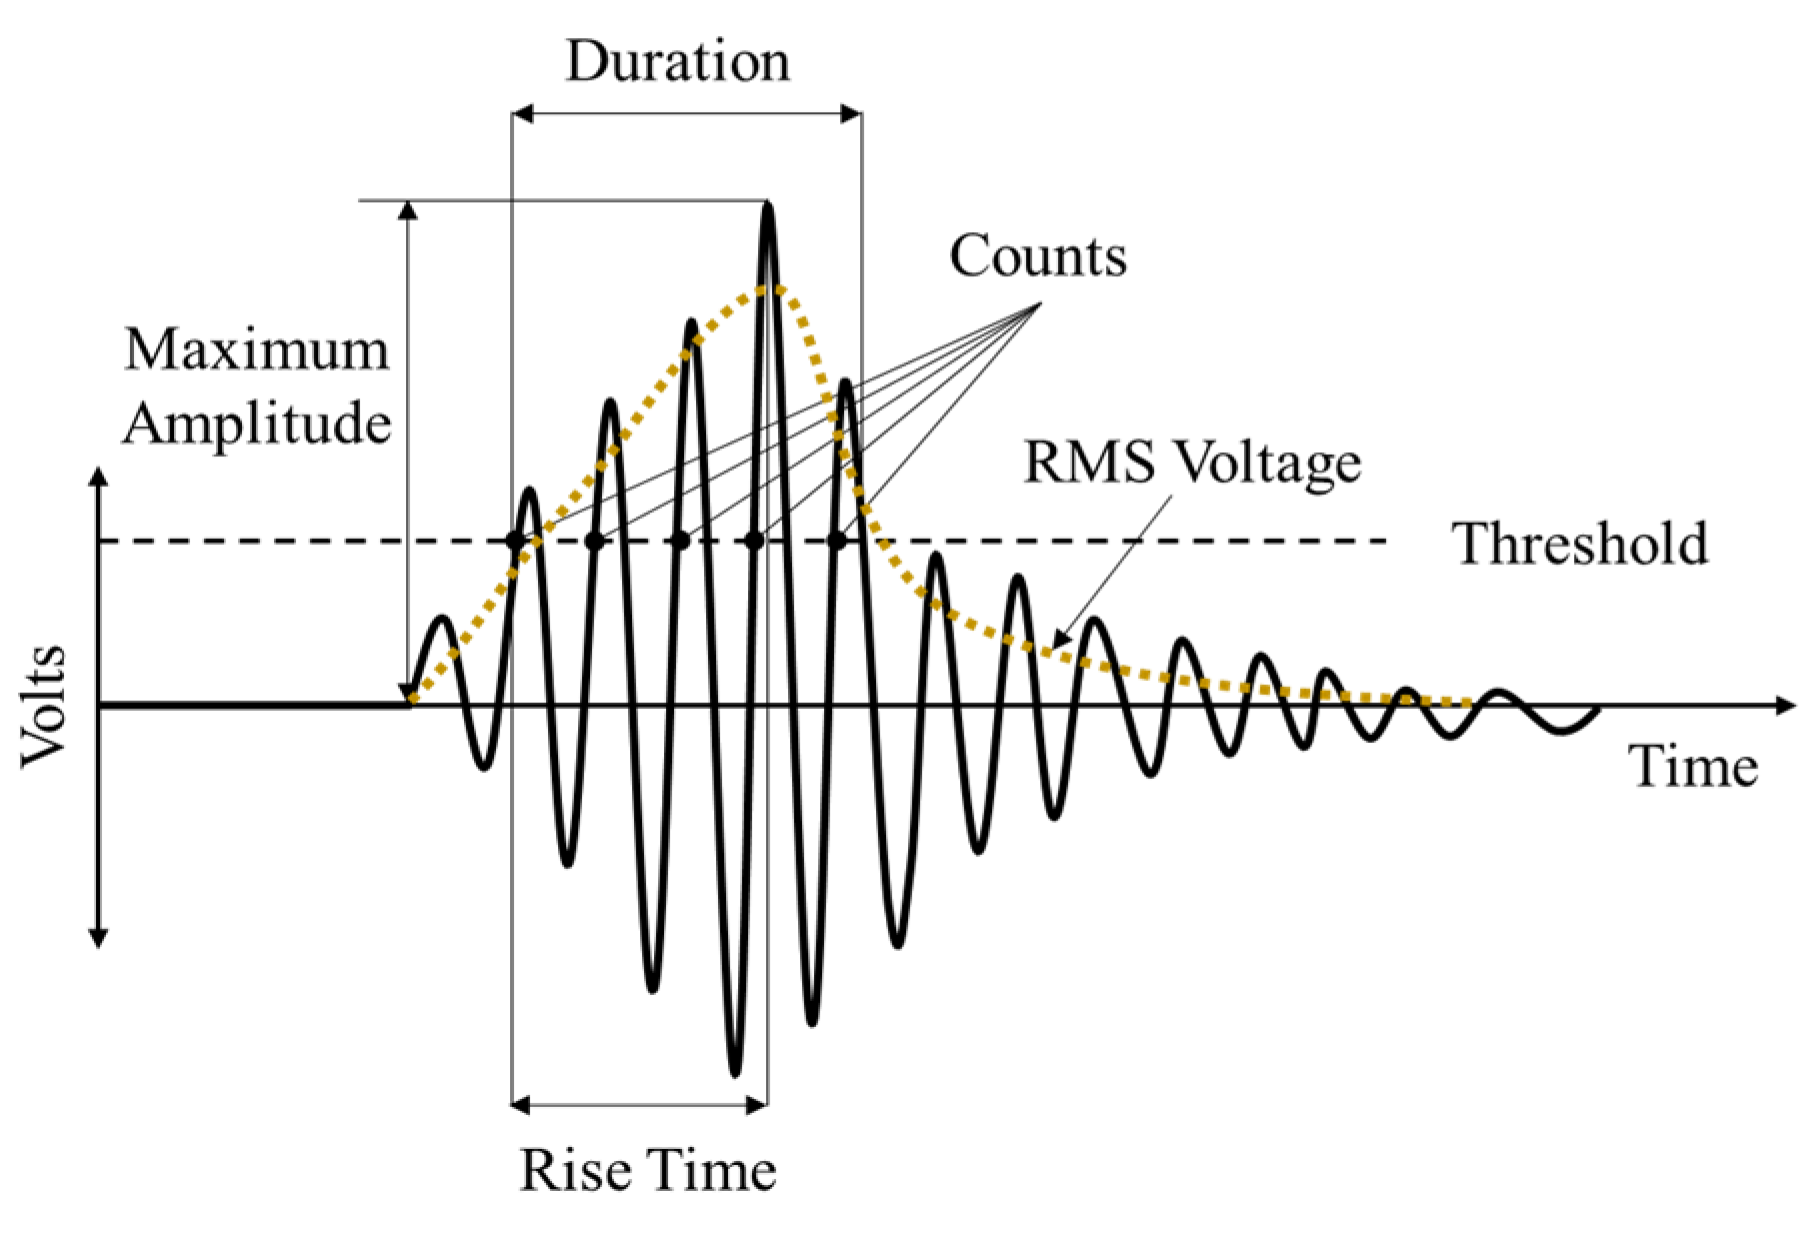
Figure 3.
Surface geometry: shape of the ideal polishing machined surface.
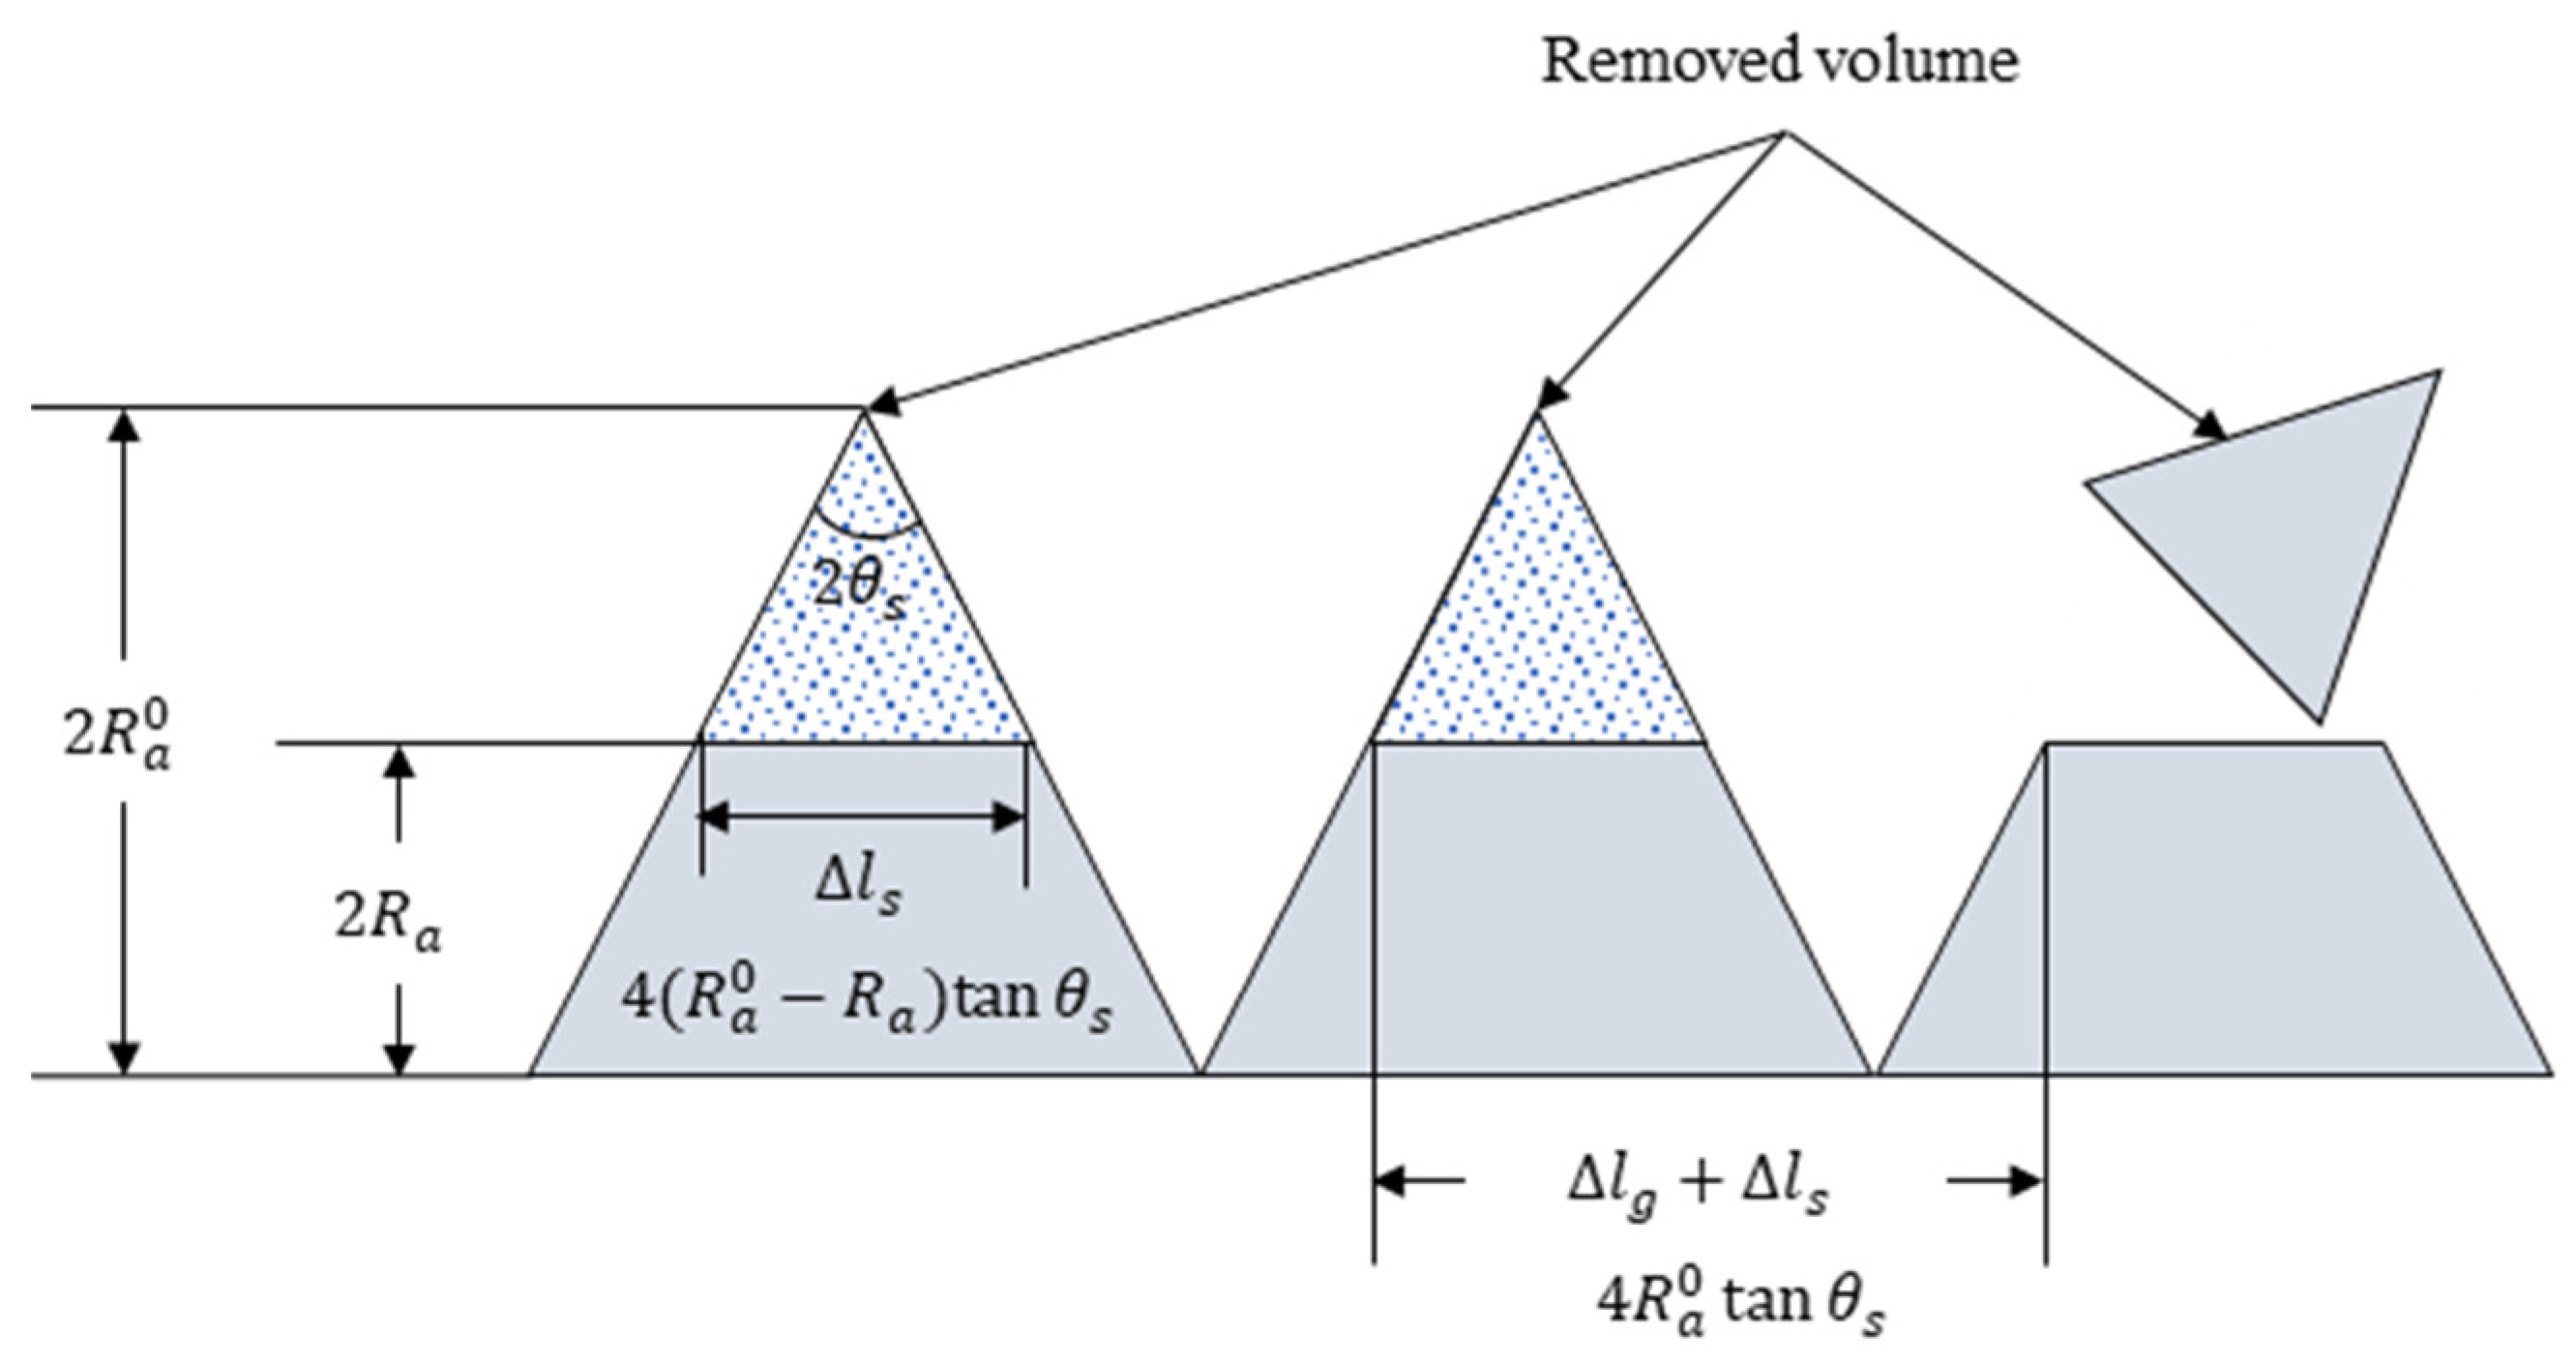
Figure 4.
Schematic of process pressure measurement.
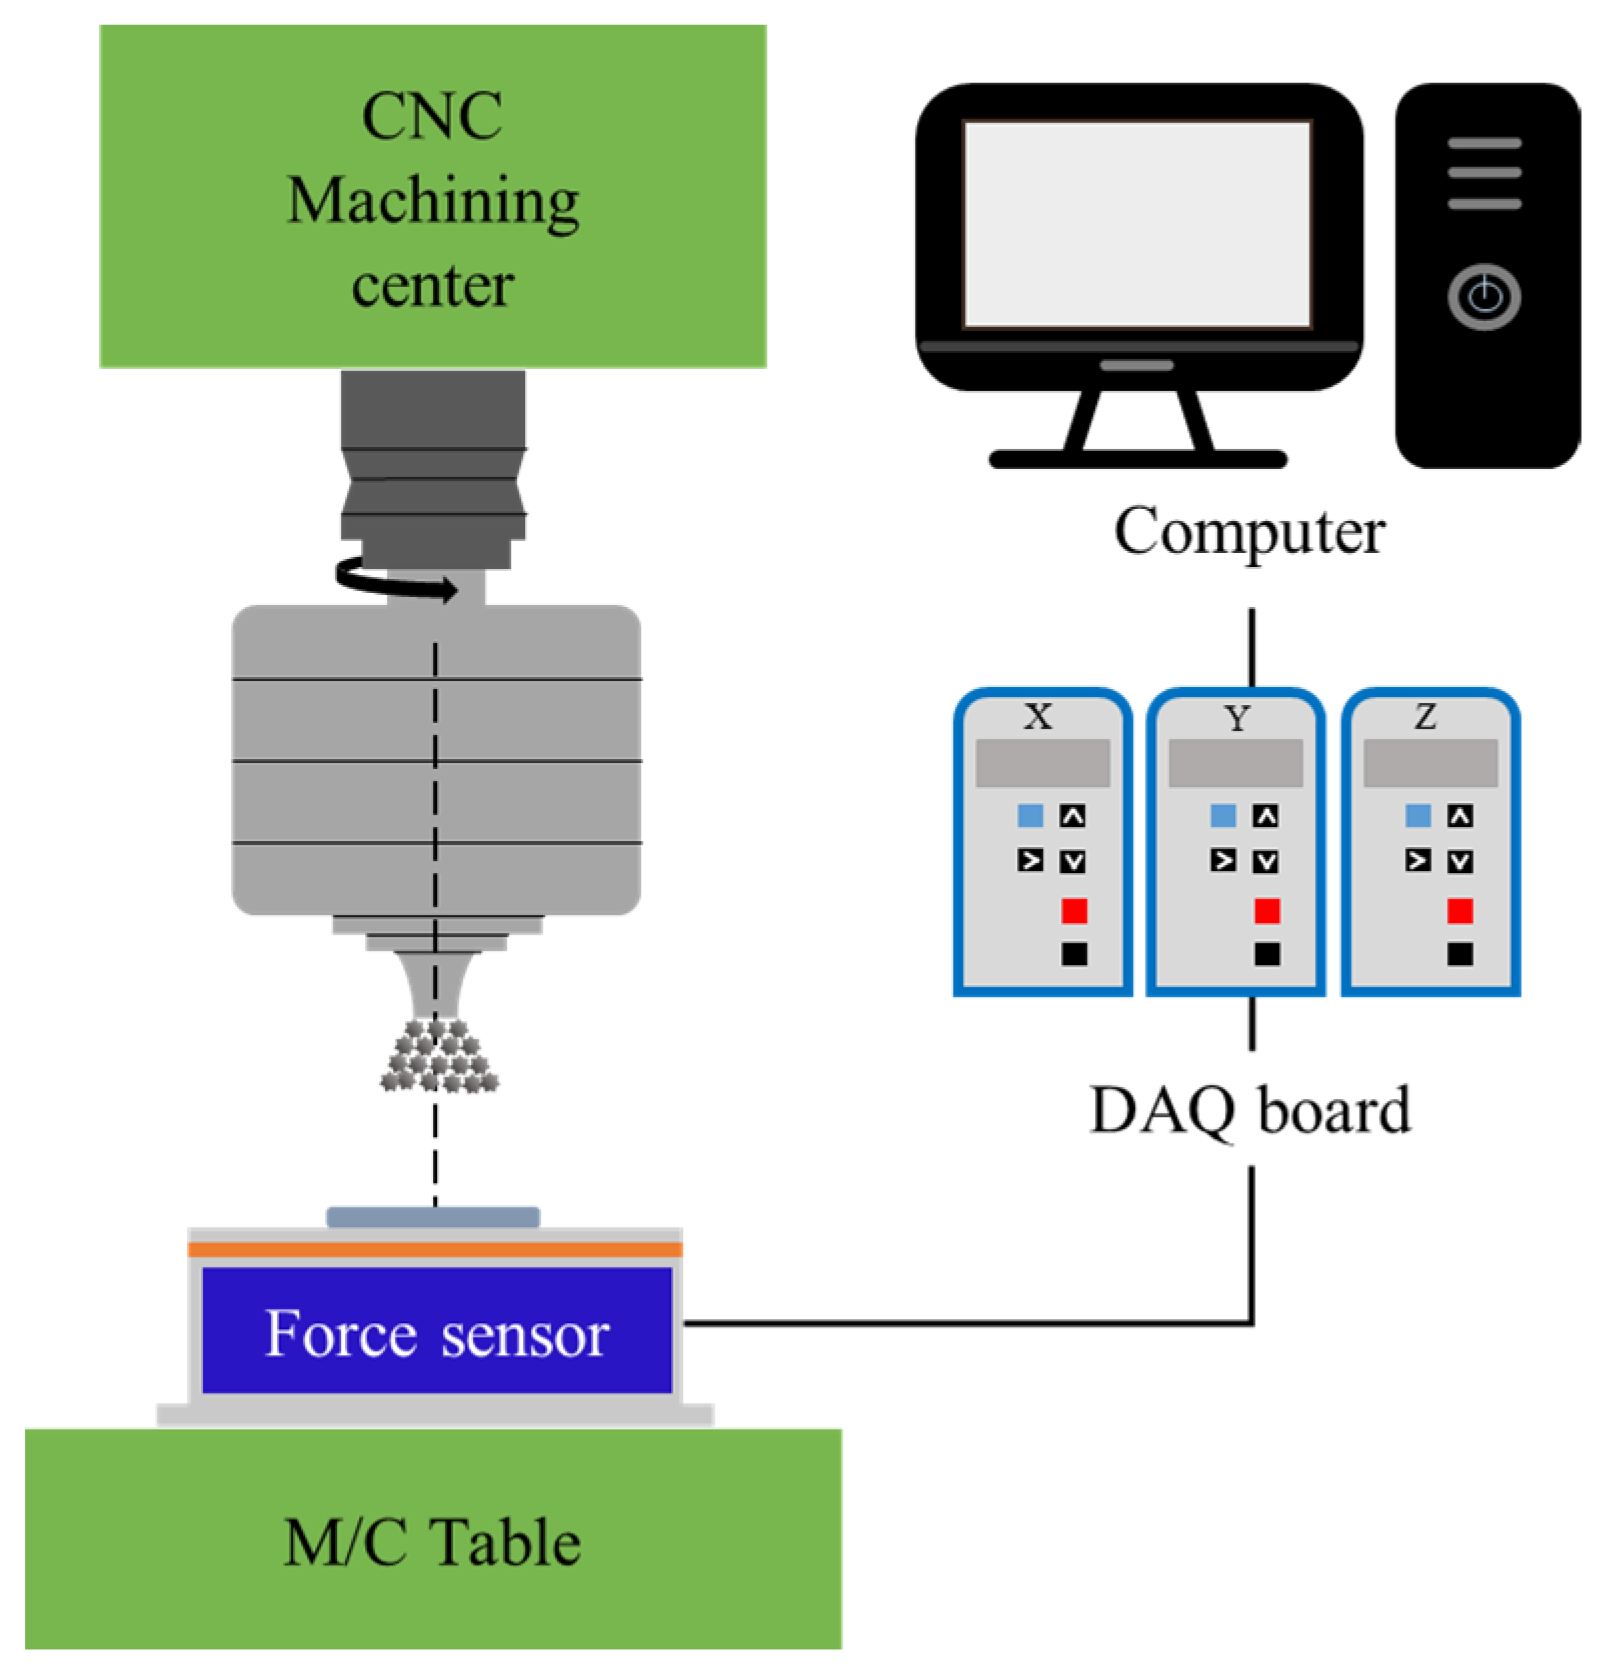
Figure 5.
TCO coating layer (thickness of about 200 nm, ITO-coated).
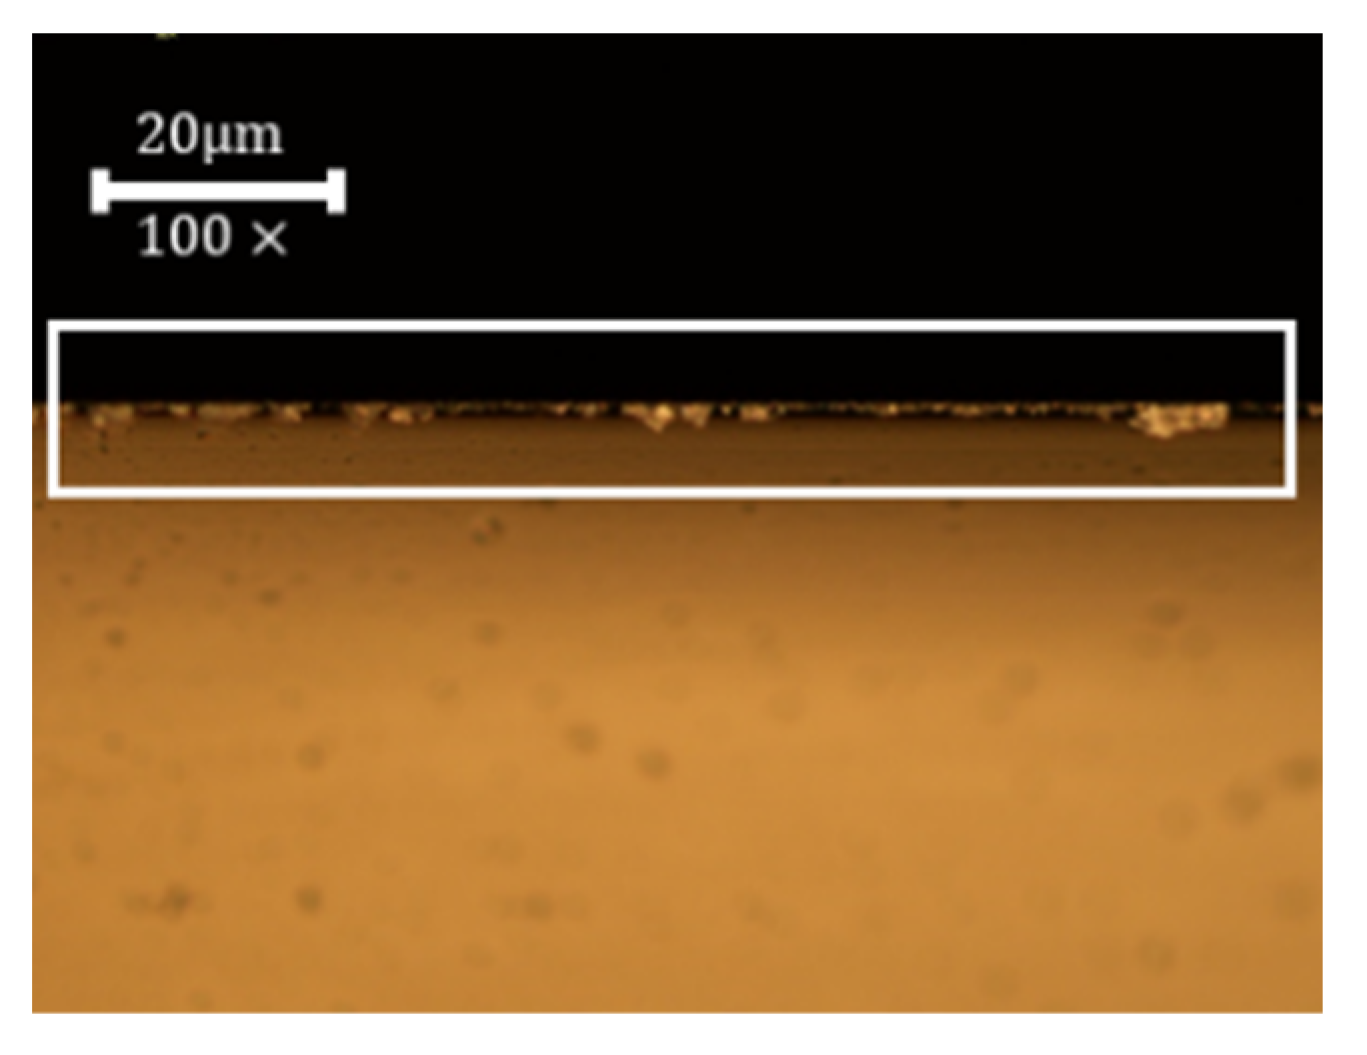
Figure 6.
Magnetic abrasive particle.
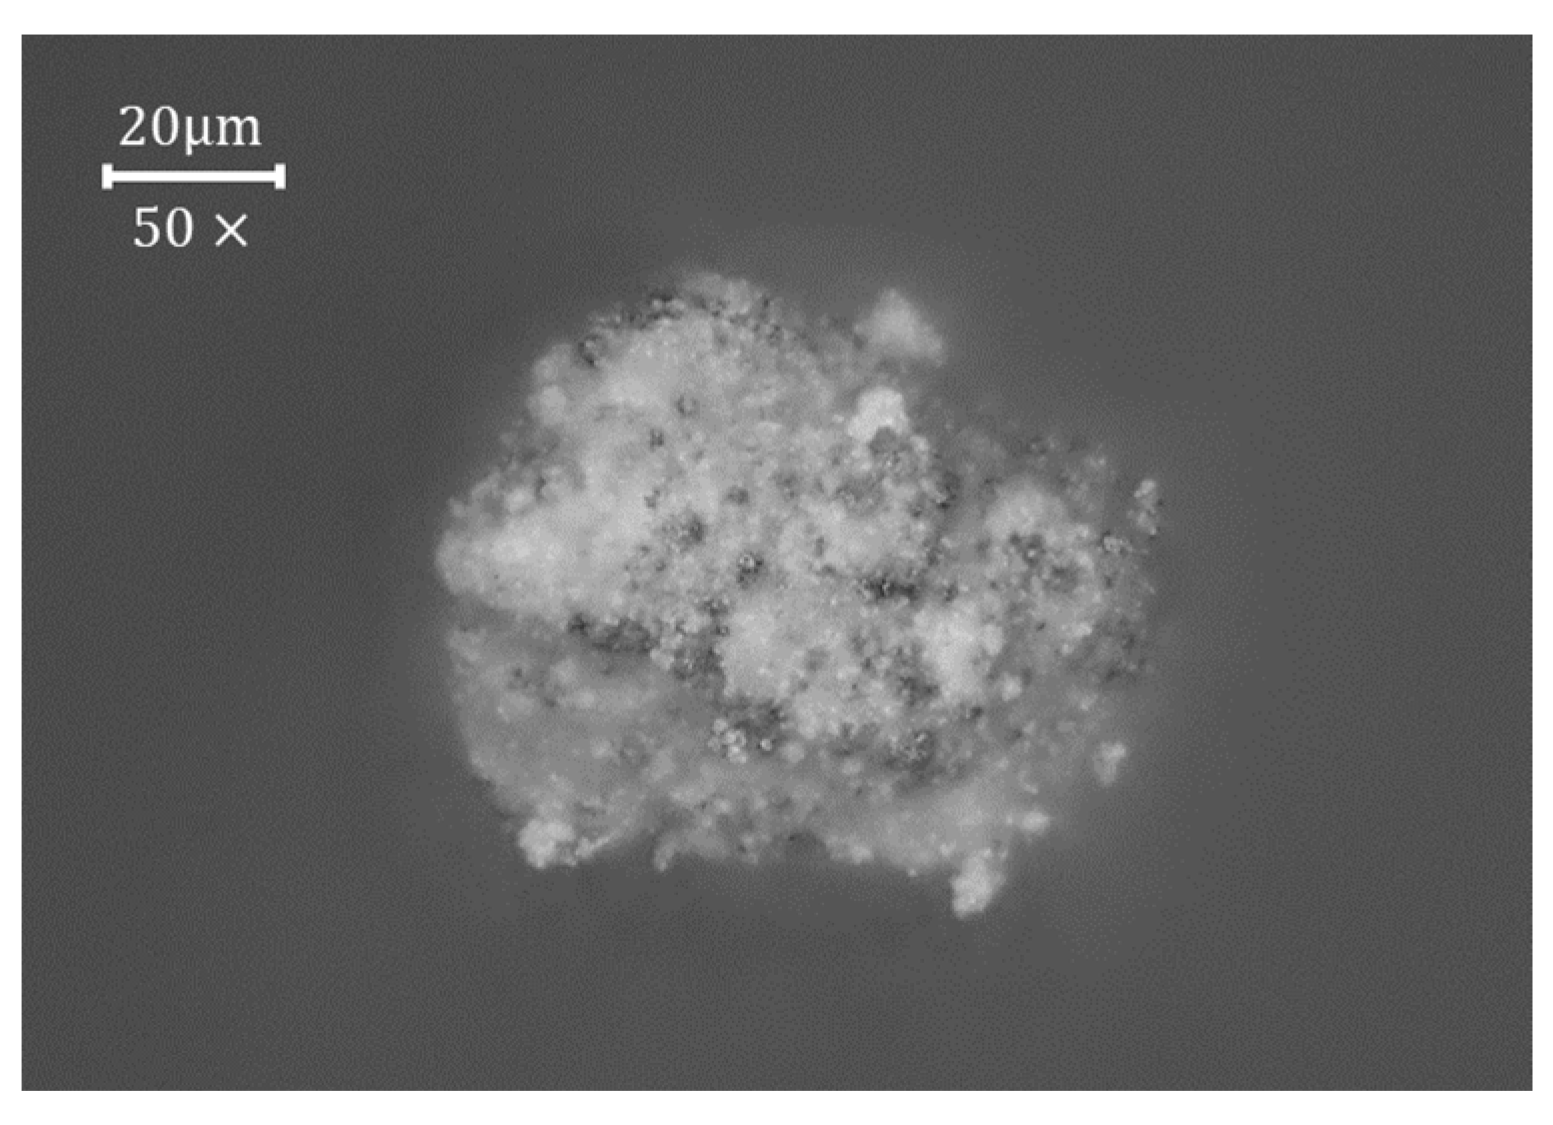
Figure 7.
Processing pressure due to working gap.

Figure 8.
Processing pressure due to particle size.
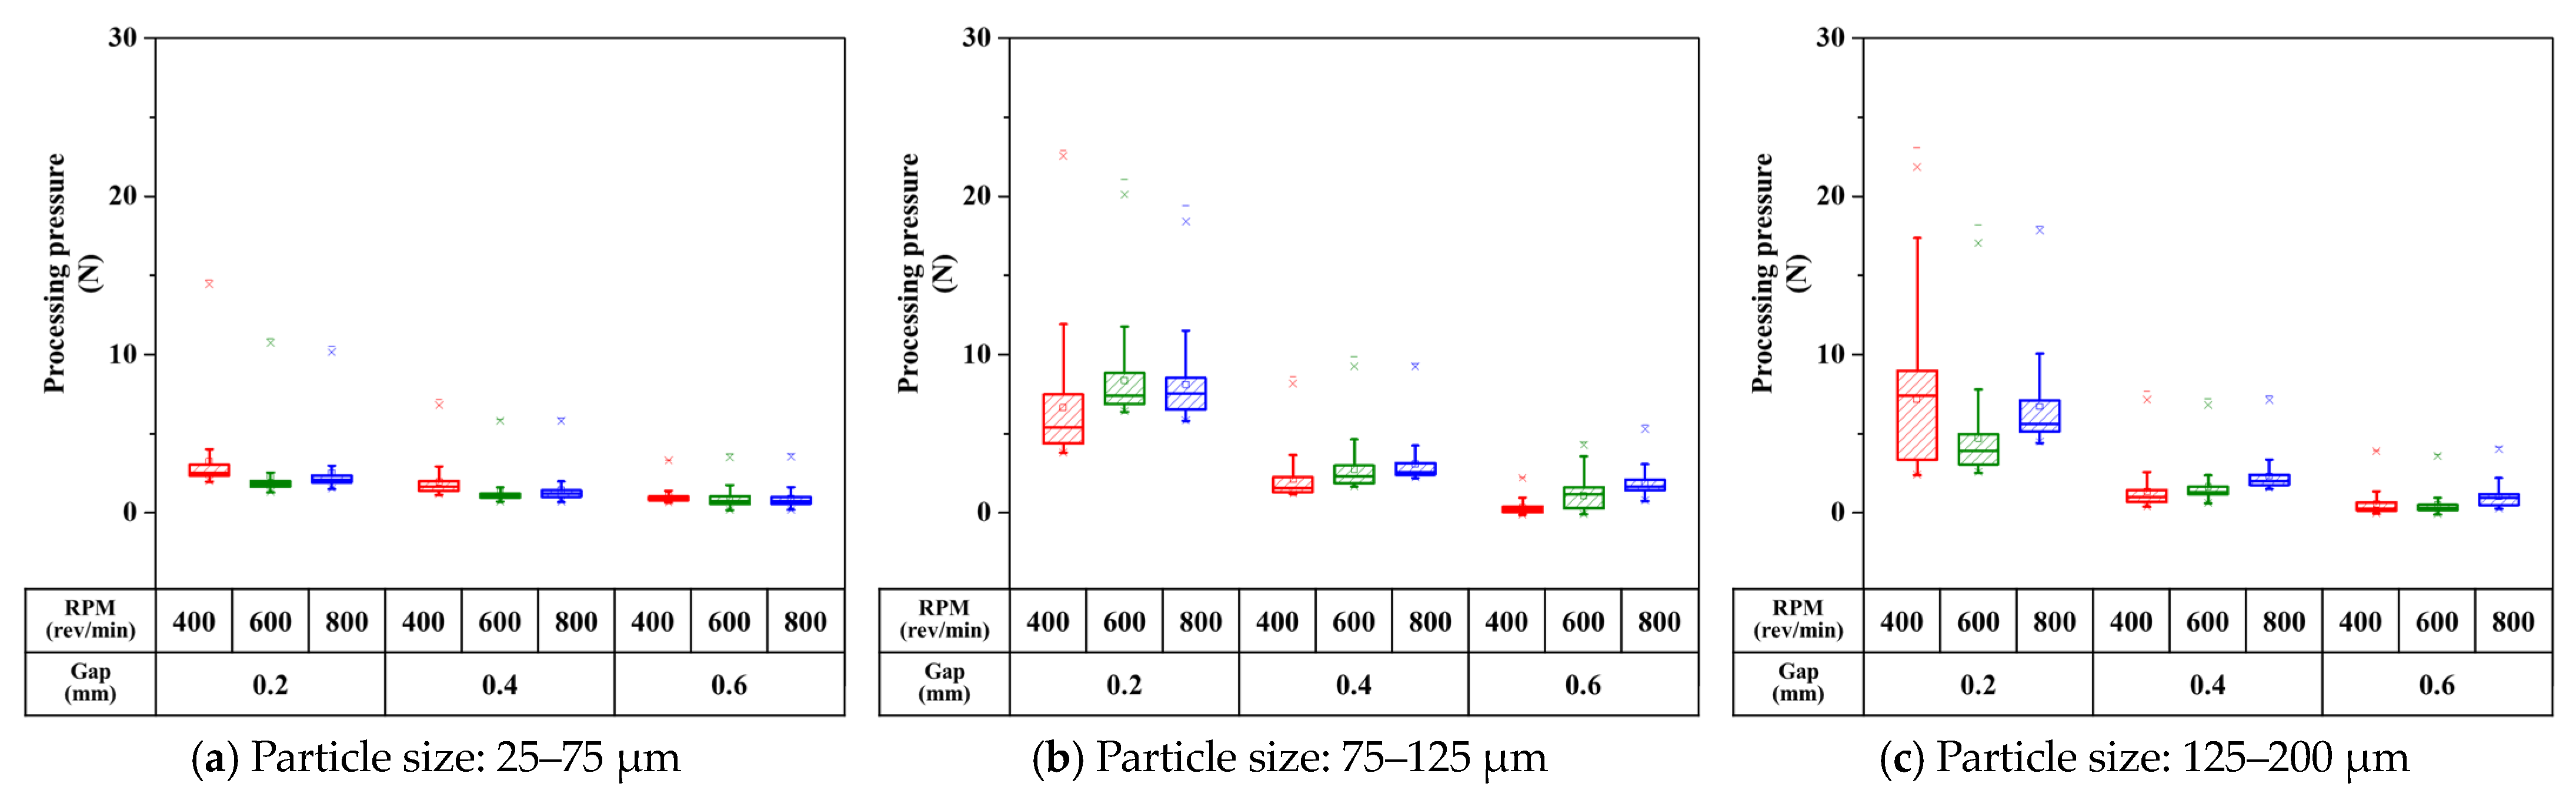
Figure 9.
Processing pressure due to RPM.
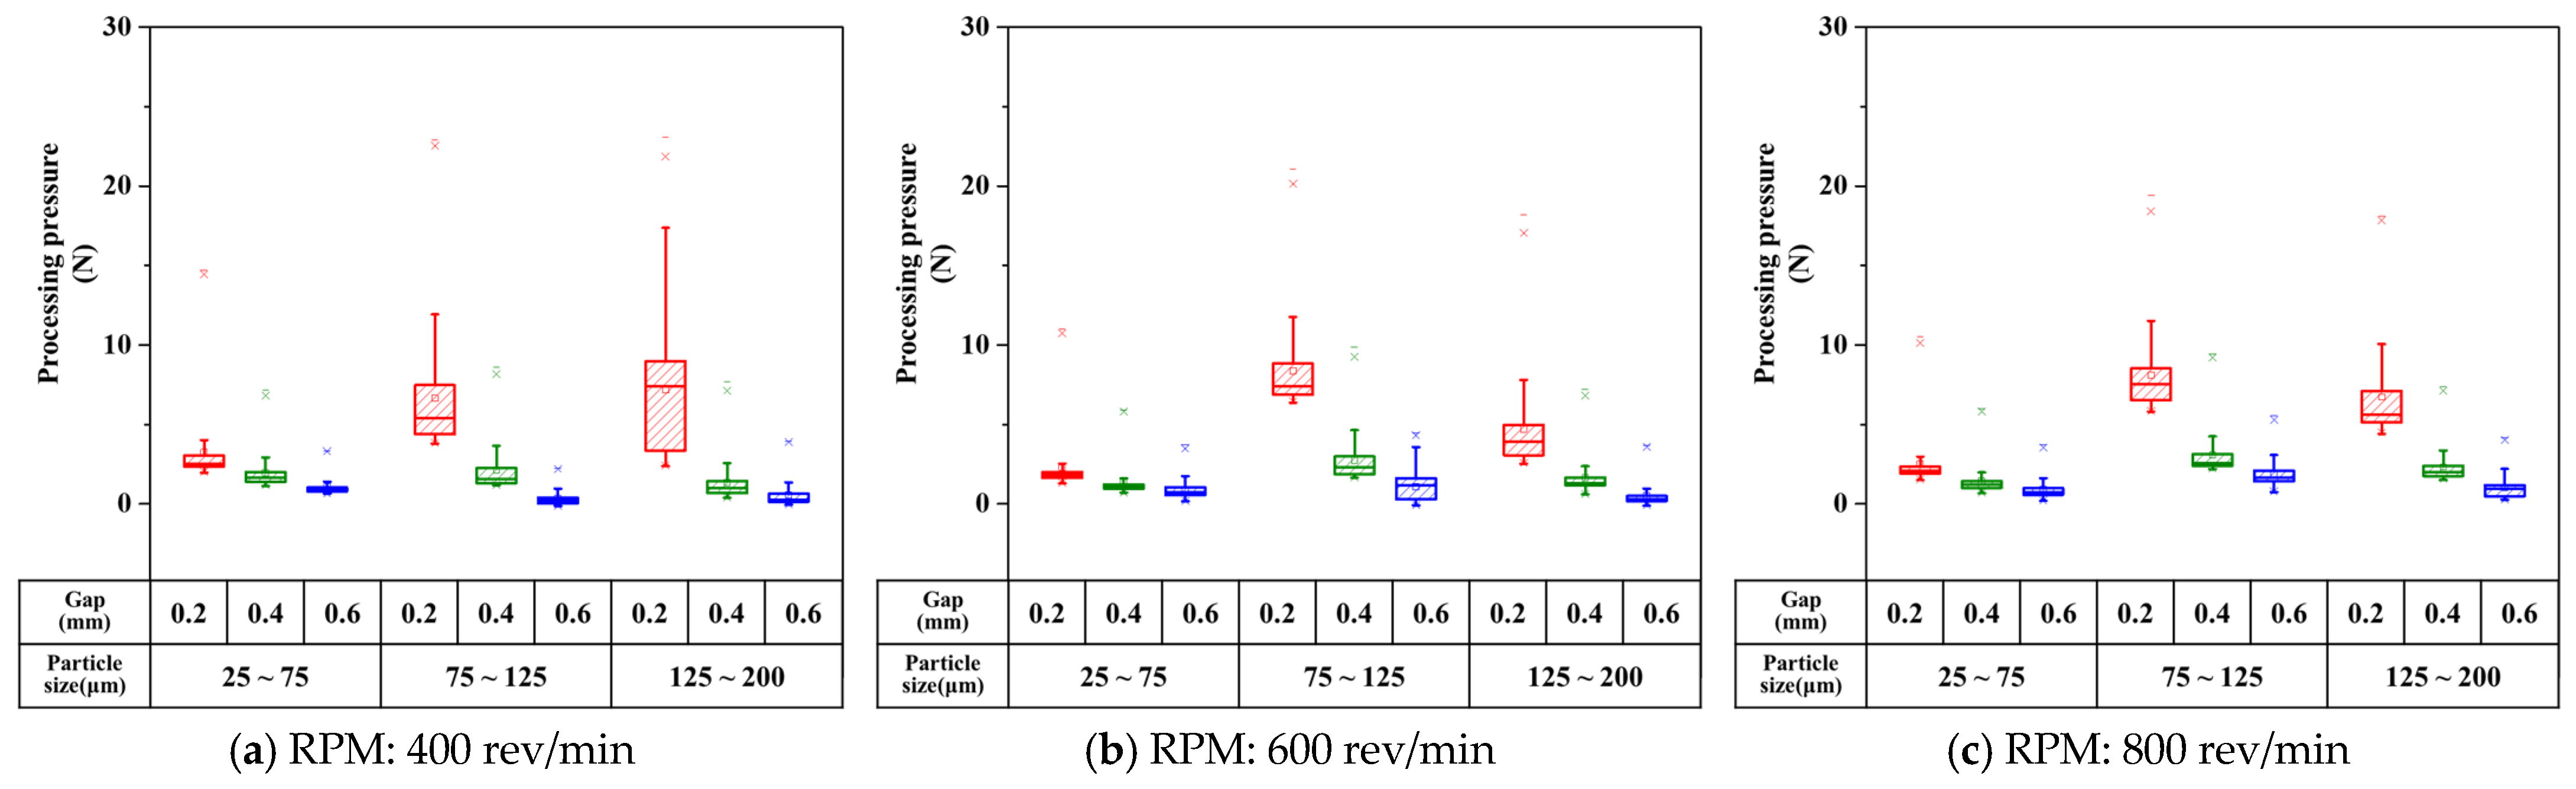
Figure 10.
Schematic of magnet and meshing: (a) modeling of magnets, (b) meshing.
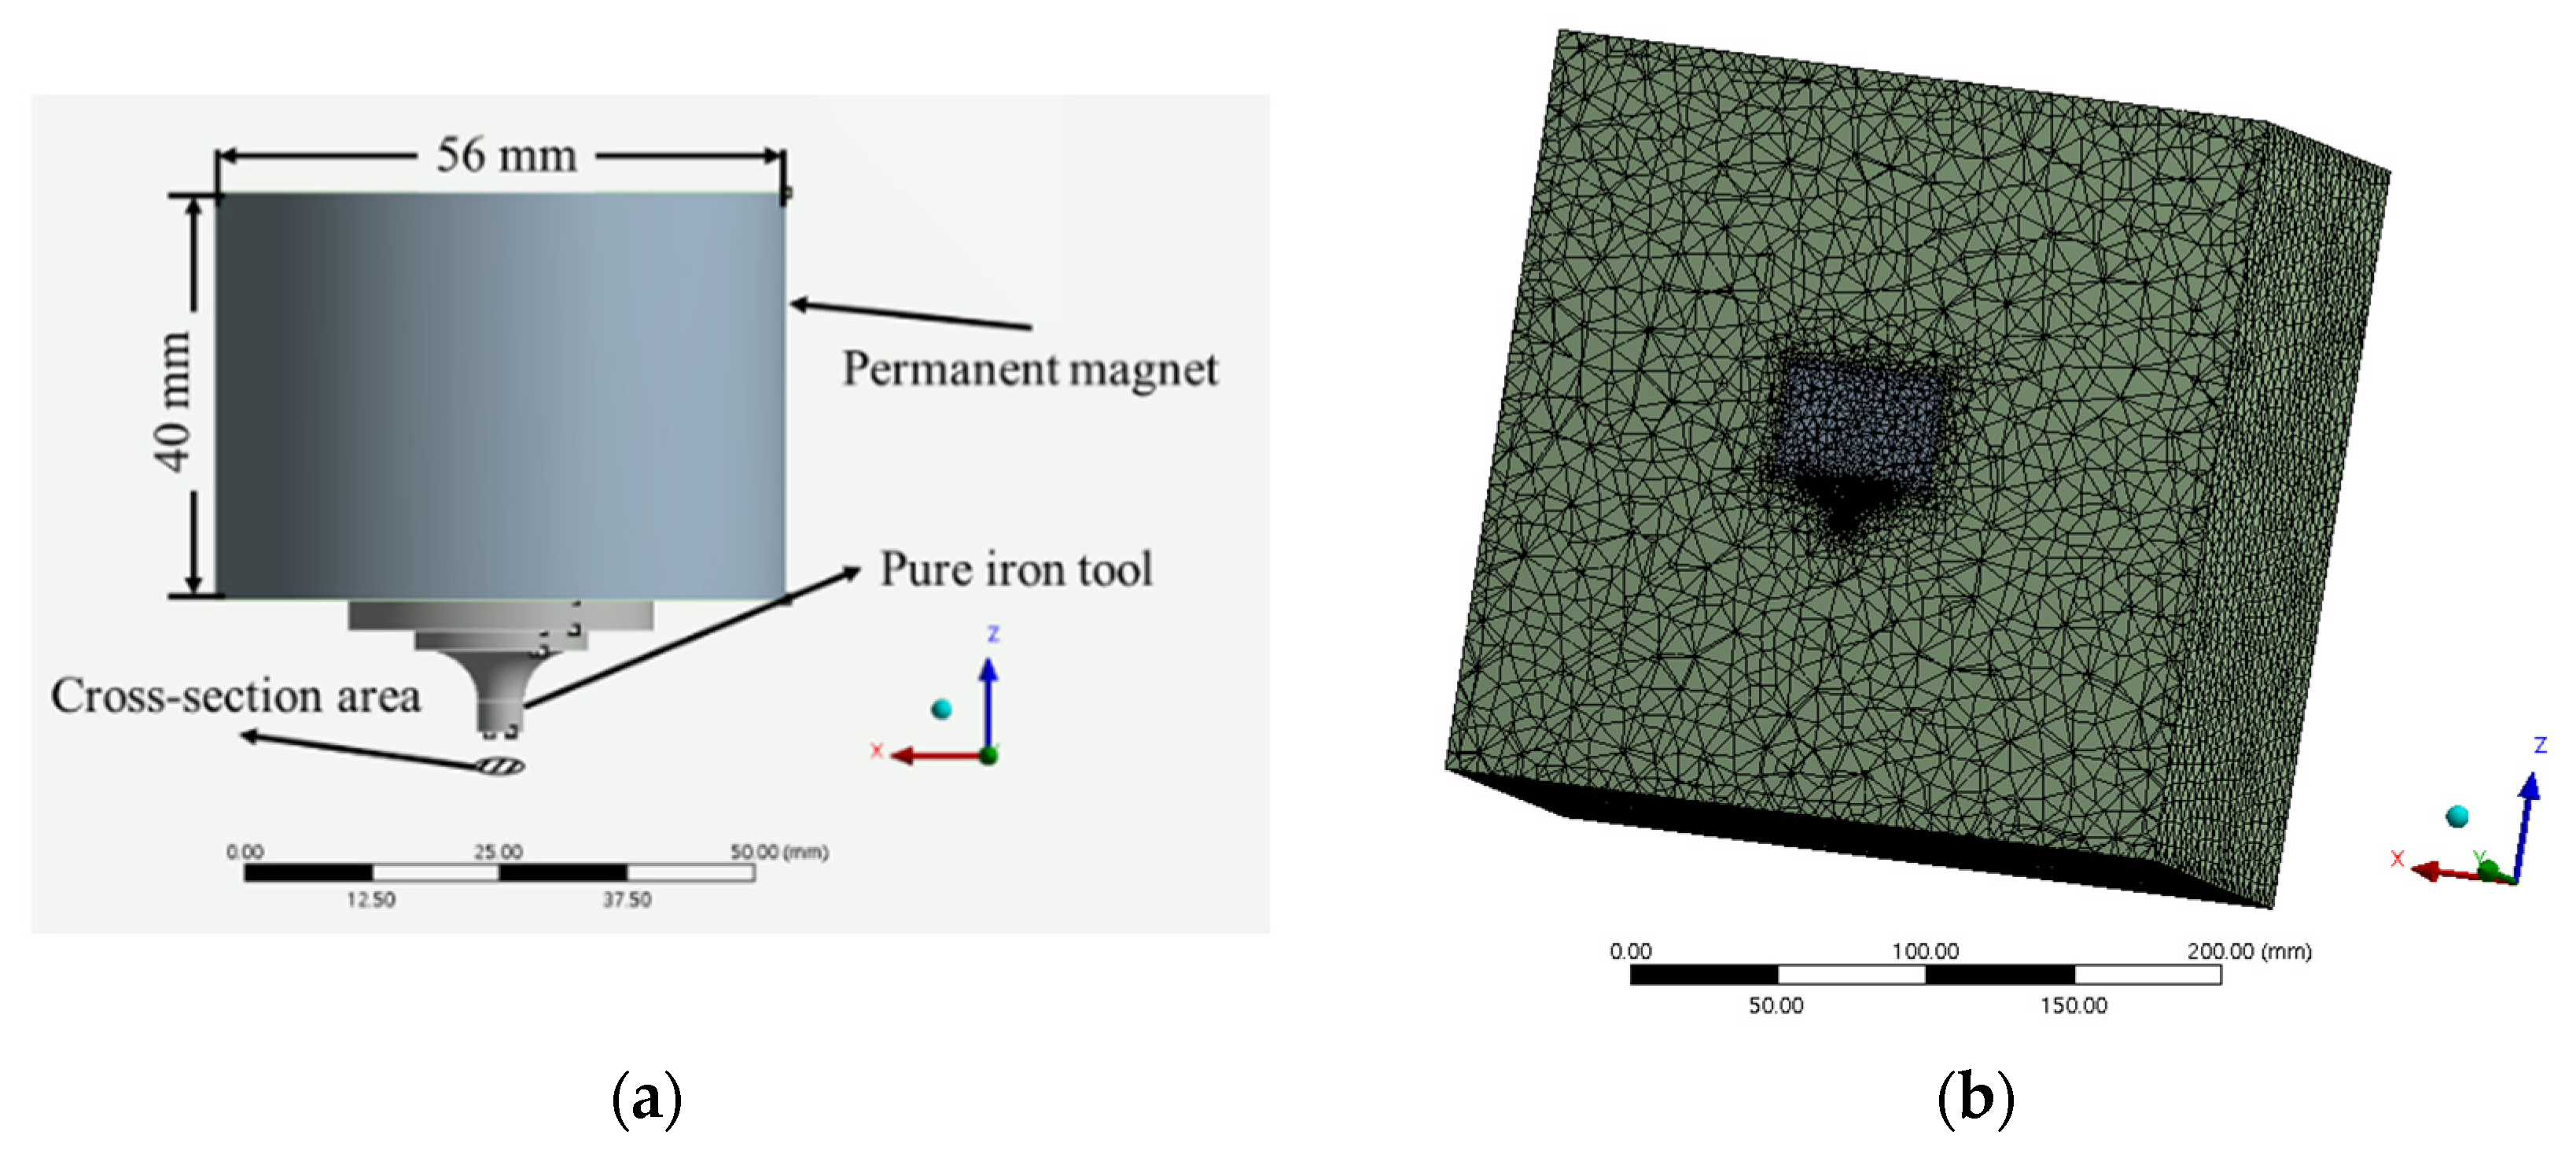
Figure 11.
Magnetic flux density of modeled magnets.

Figure 12.
Simulation results of flux density along the working gap: (a) working gap of 0.2 mm, (b) working gap of 0.4 mm, (c) working gap of 0.6 mm.
Figure 12.
Simulation results of flux density along the working gap: (a) working gap of 0.2 mm, (b) working gap of 0.4 mm, (c) working gap of 0.6 mm.

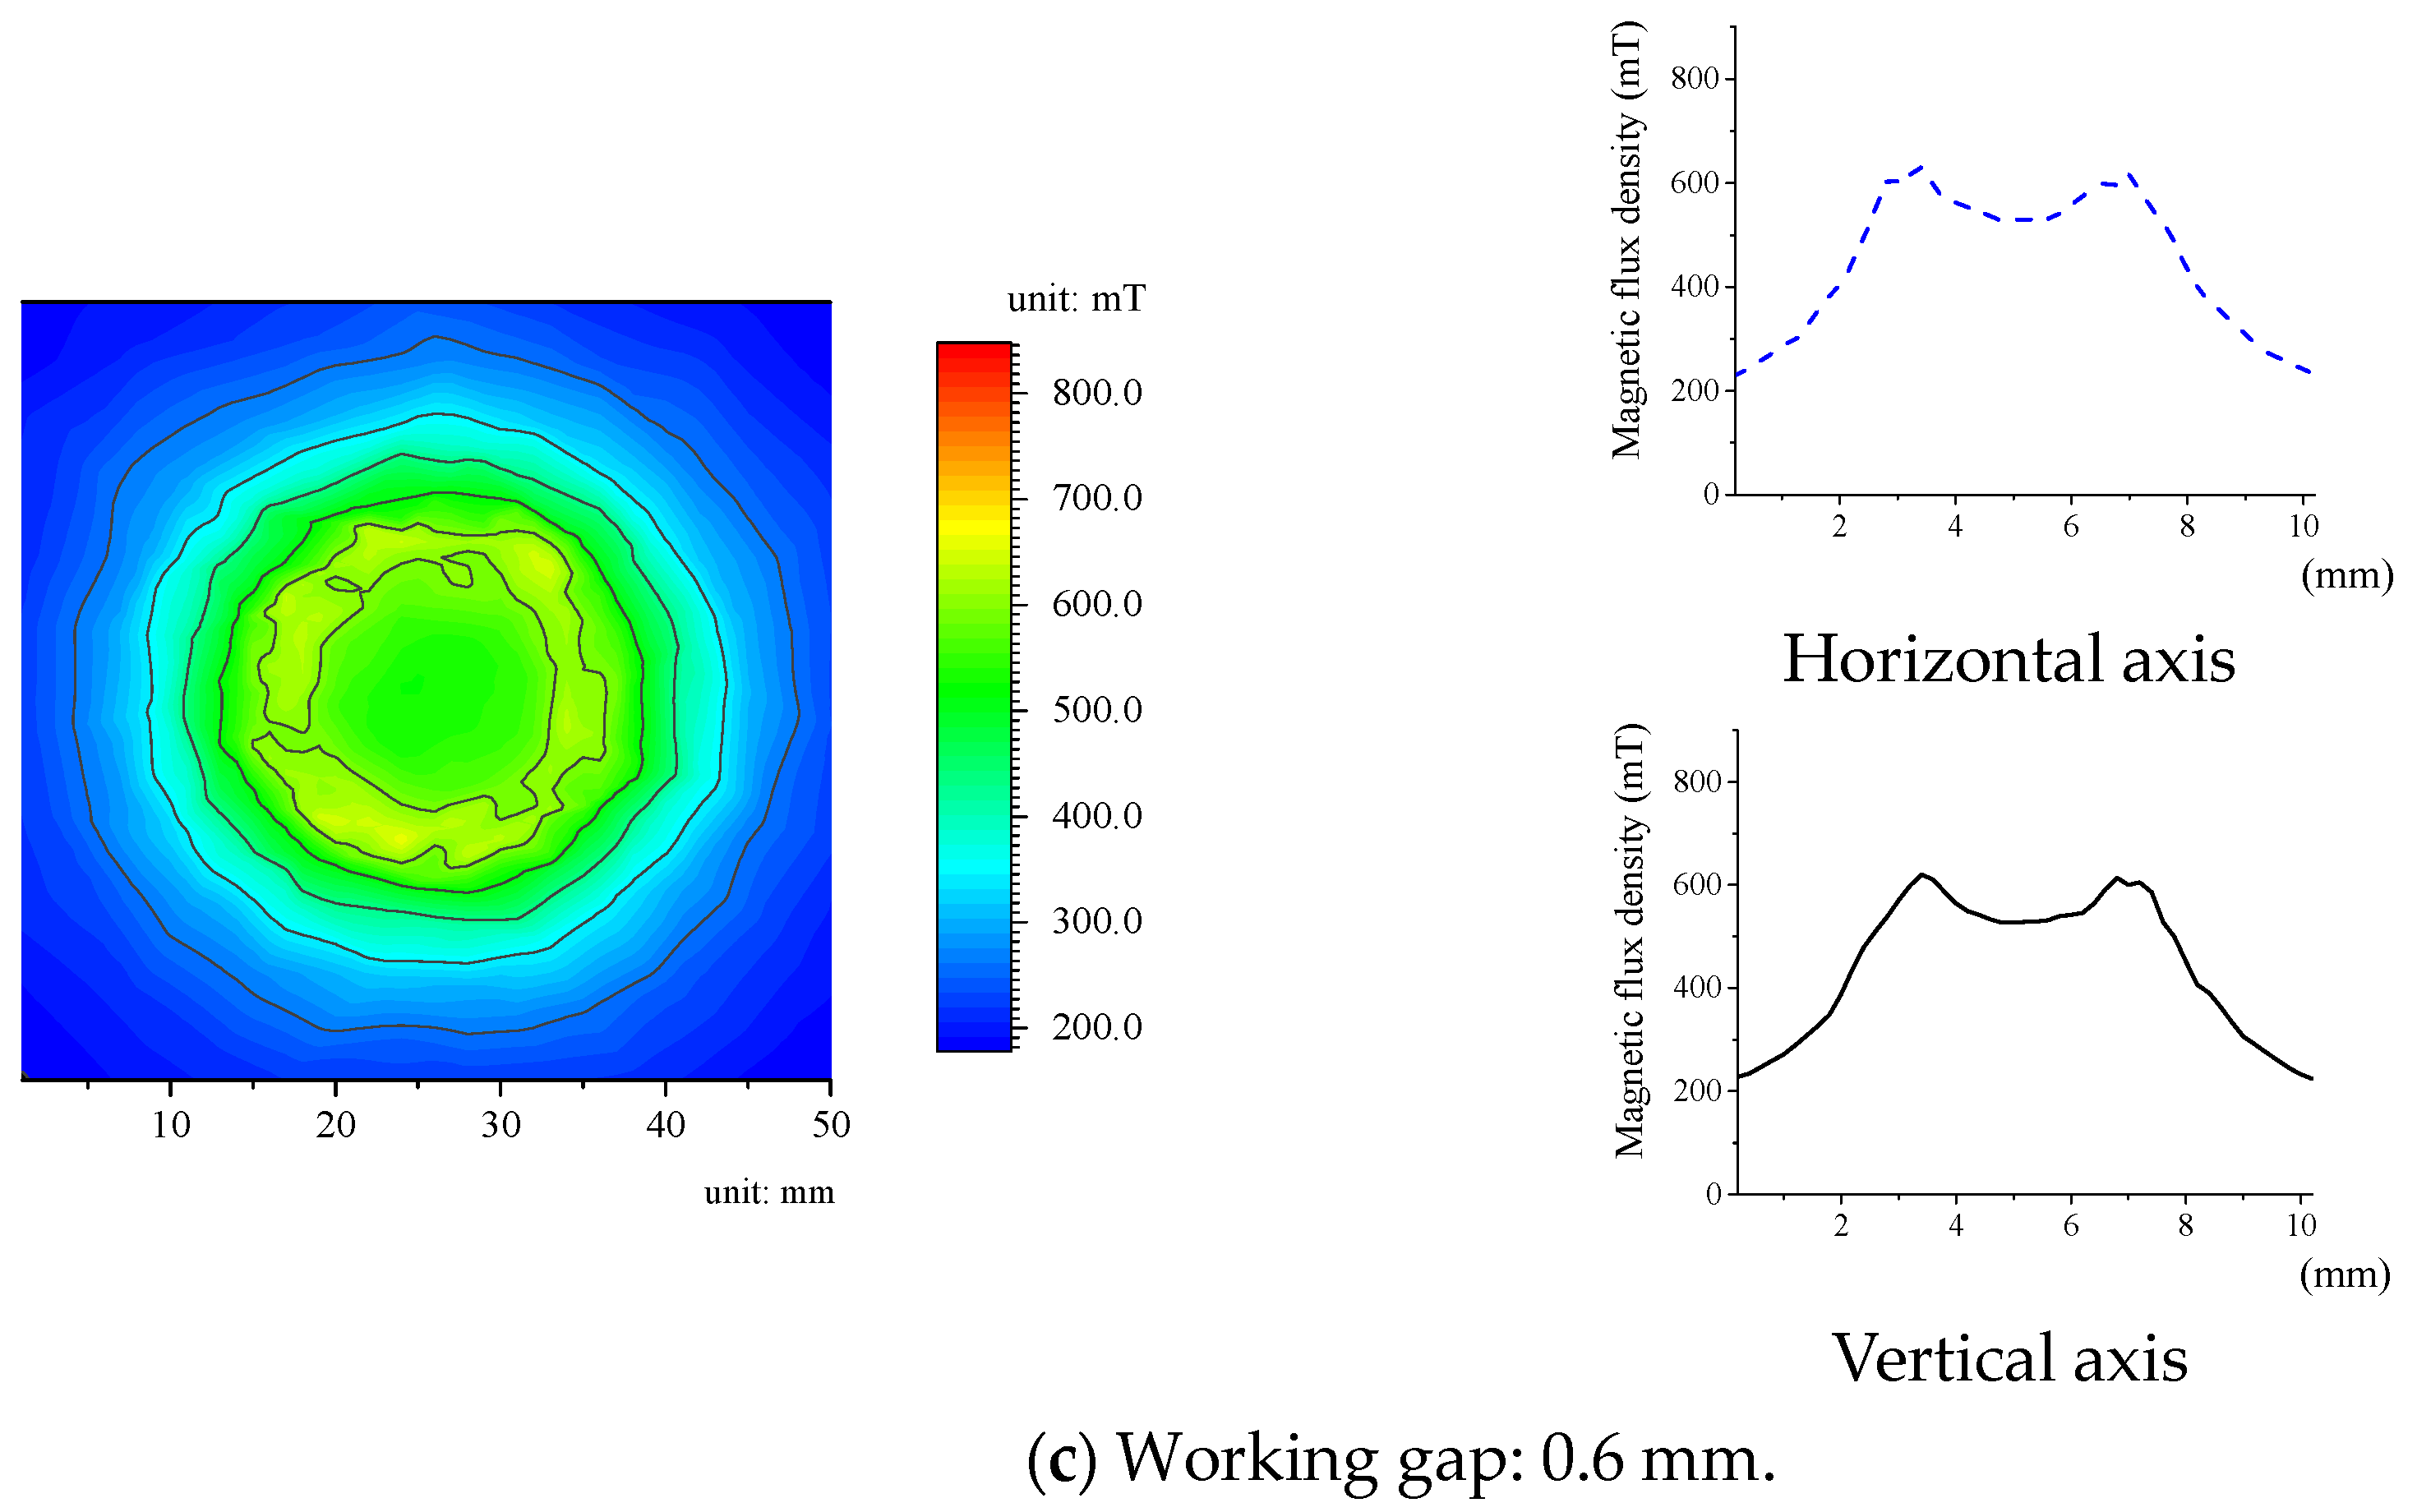
Figure 13.
Schematic of MAP.
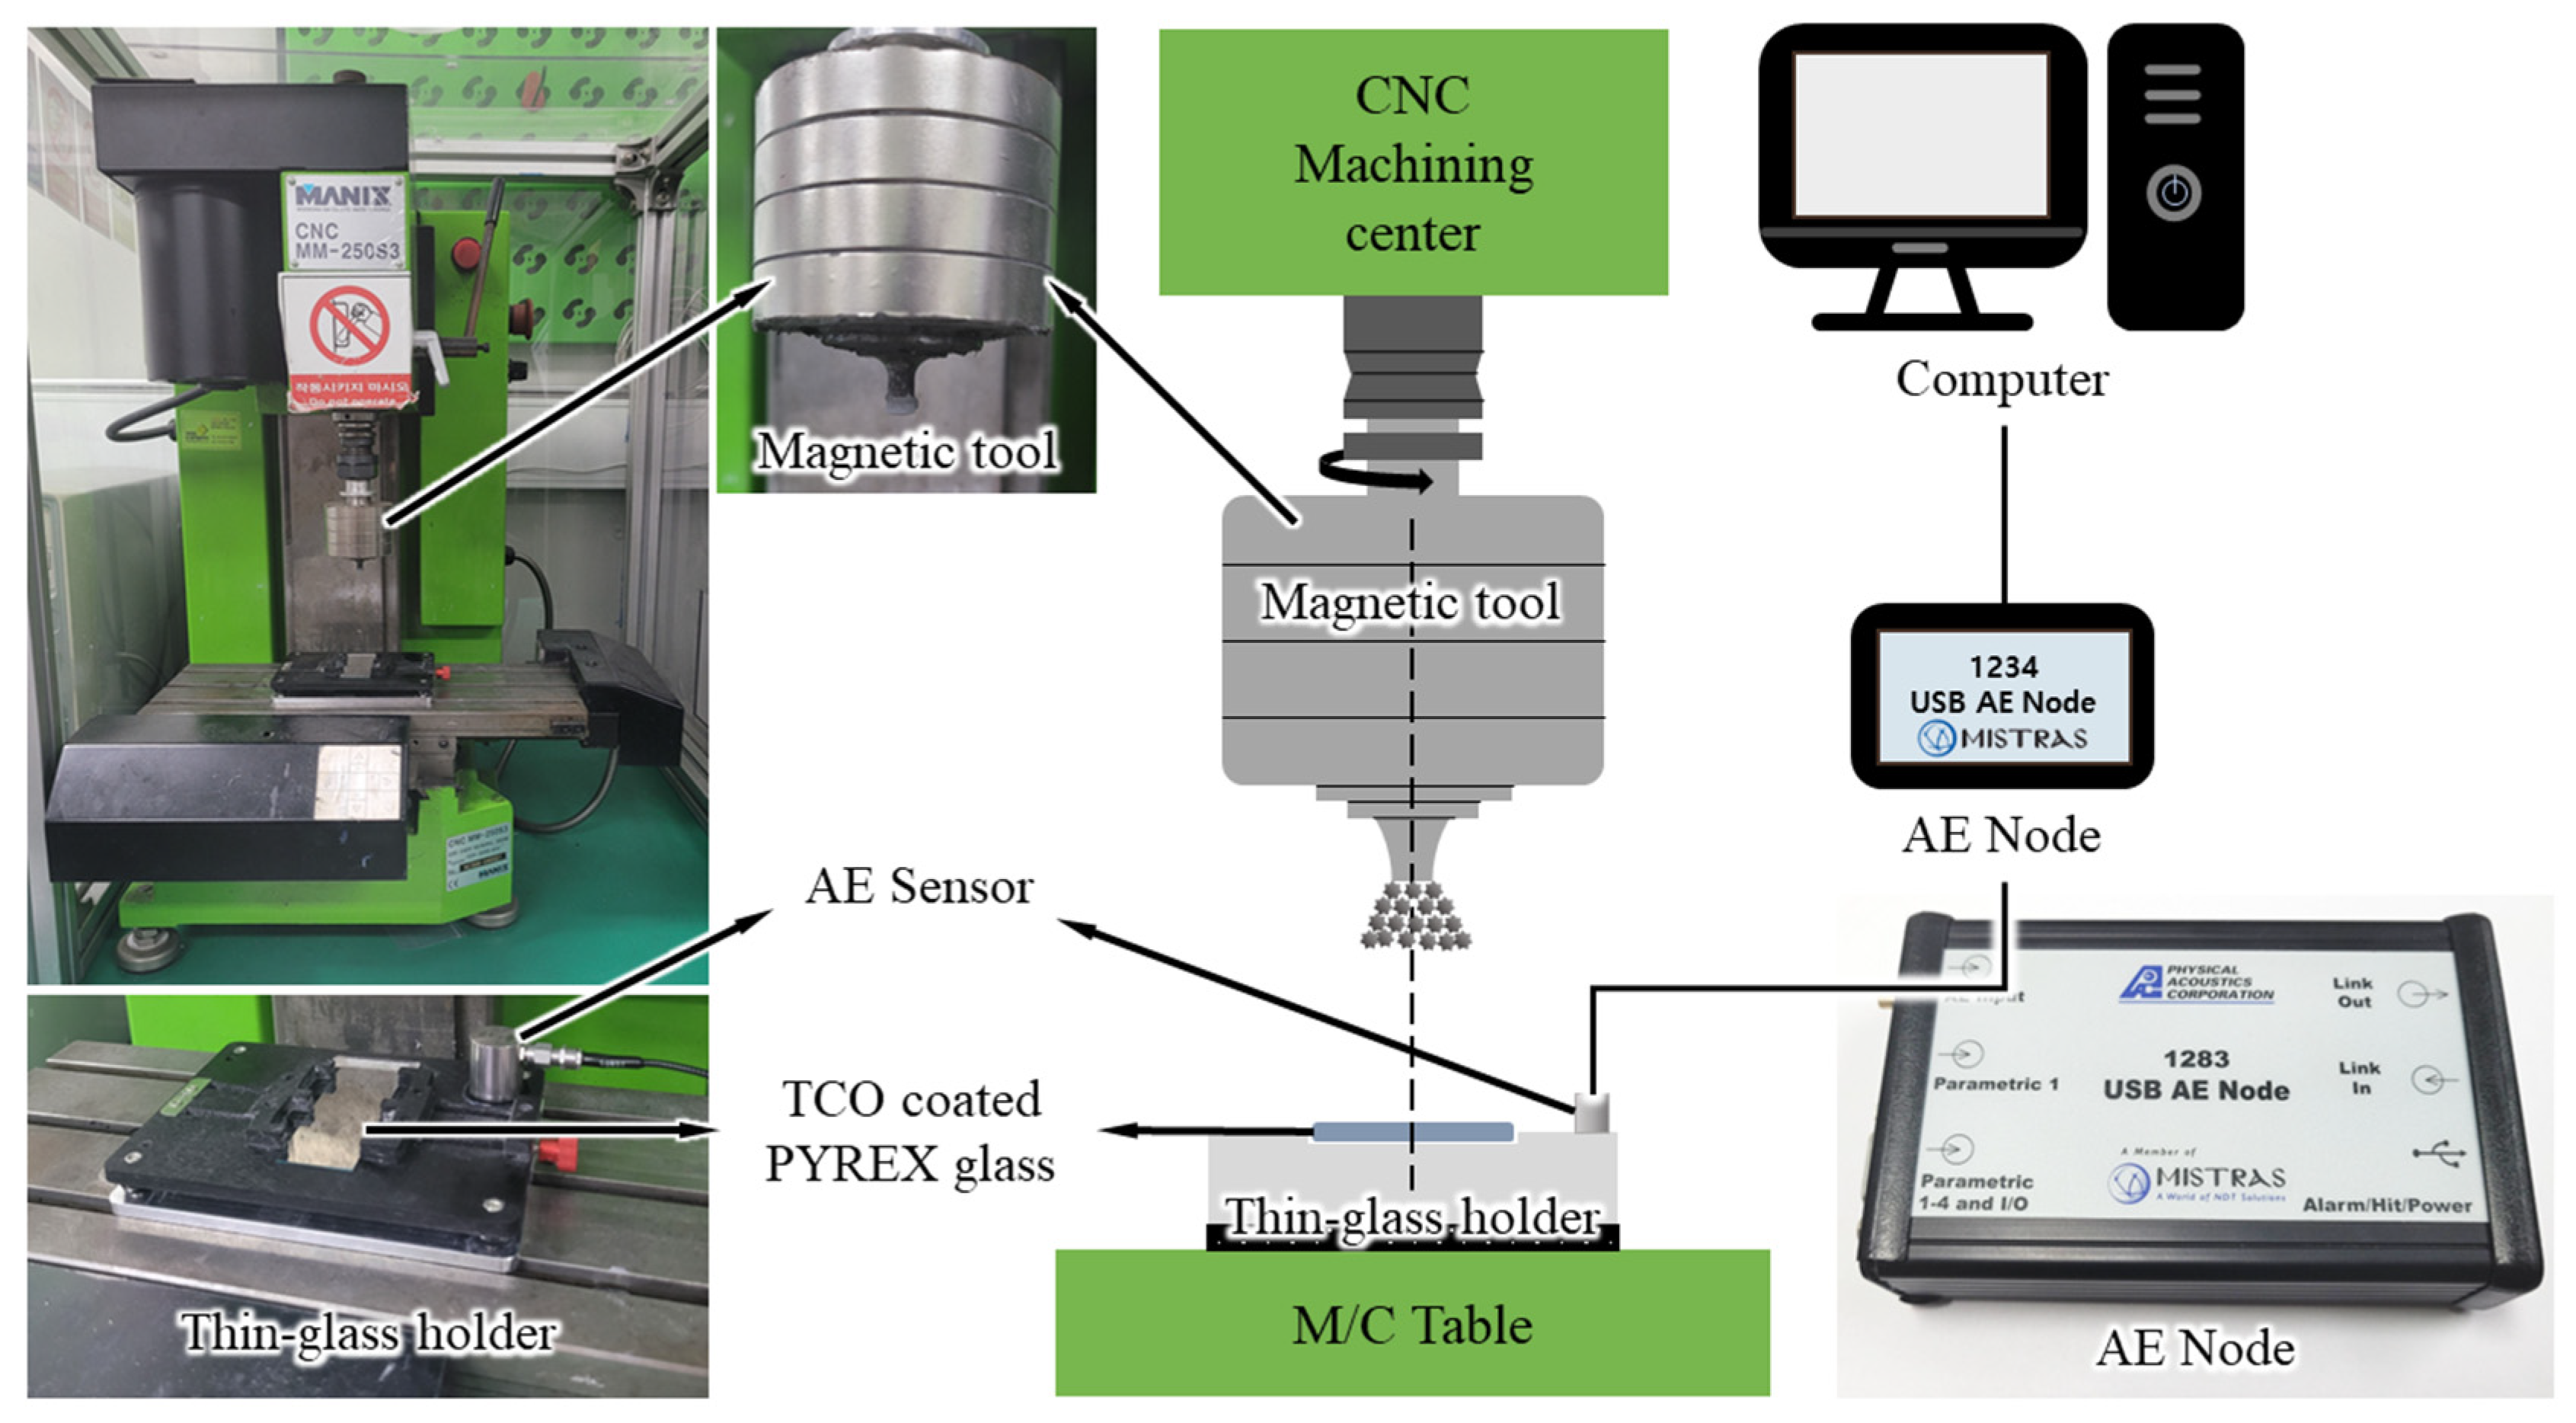
Figure 14.
Surface roughness with and without defects: (a) smooth surface roughness (no defects), (b) rough surface roughness (defective).
Figure 14.
Surface roughness with and without defects: (a) smooth surface roughness (no defects), (b) rough surface roughness (defective).

Figure 15.
Mean S/N ratios of average Ra.
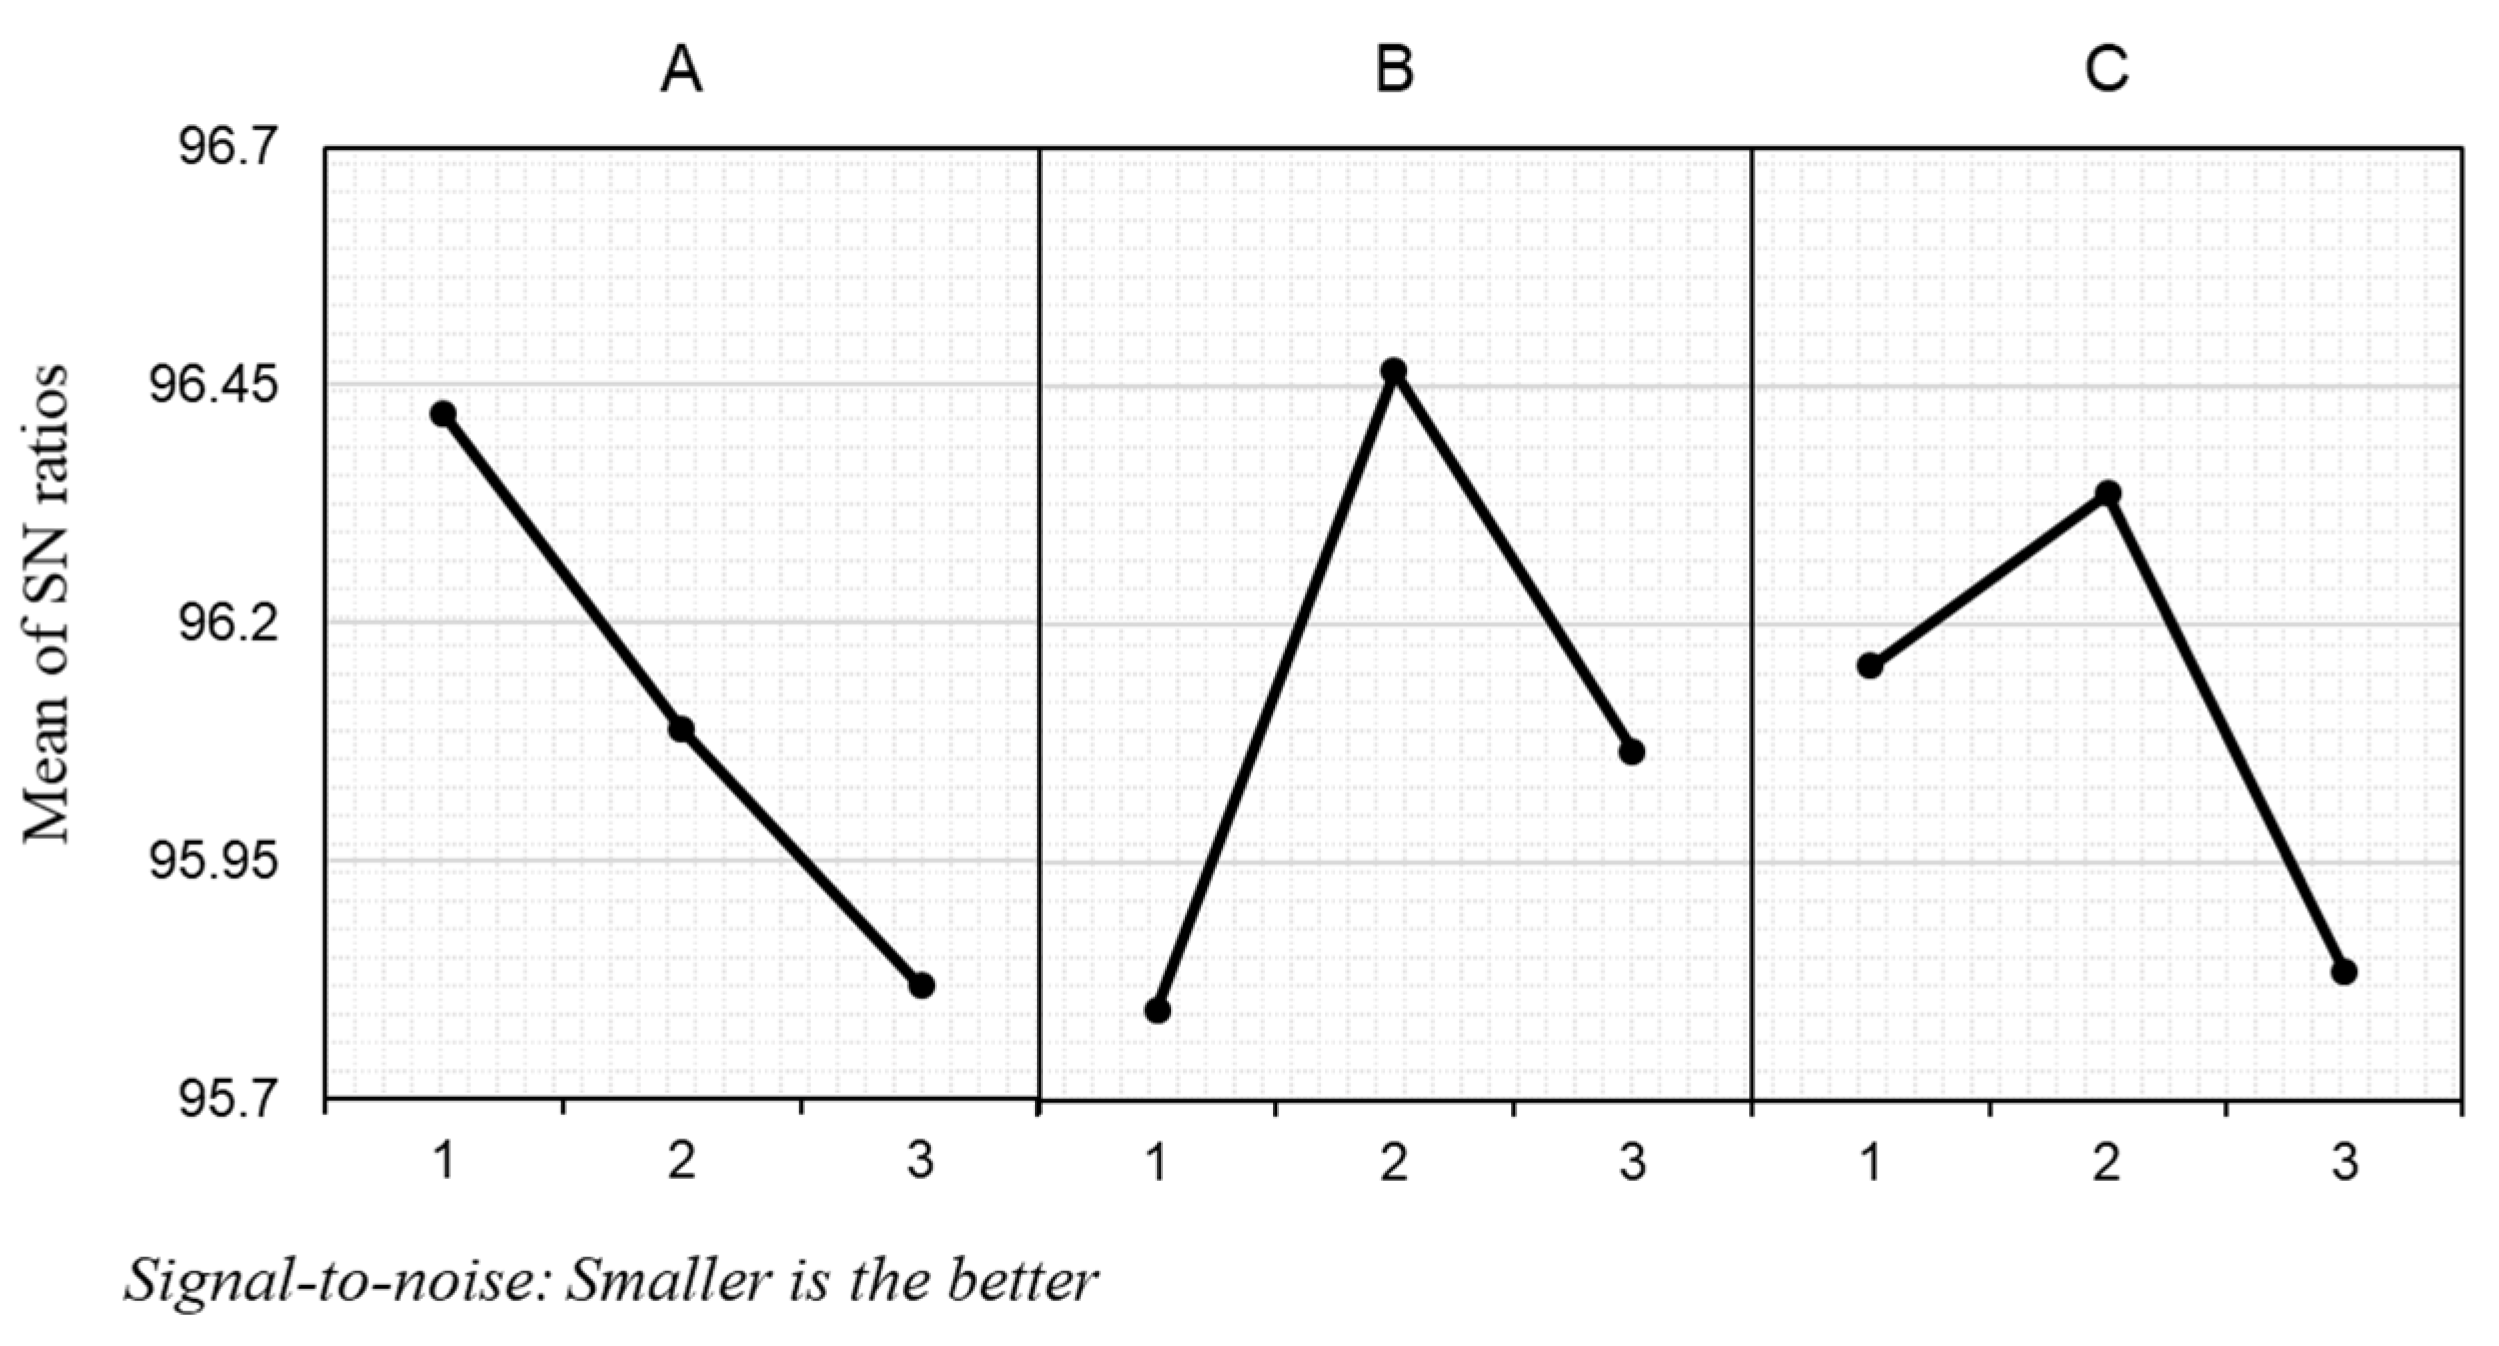
Figure 16.
Mean S/N ratios of ∆RMS.
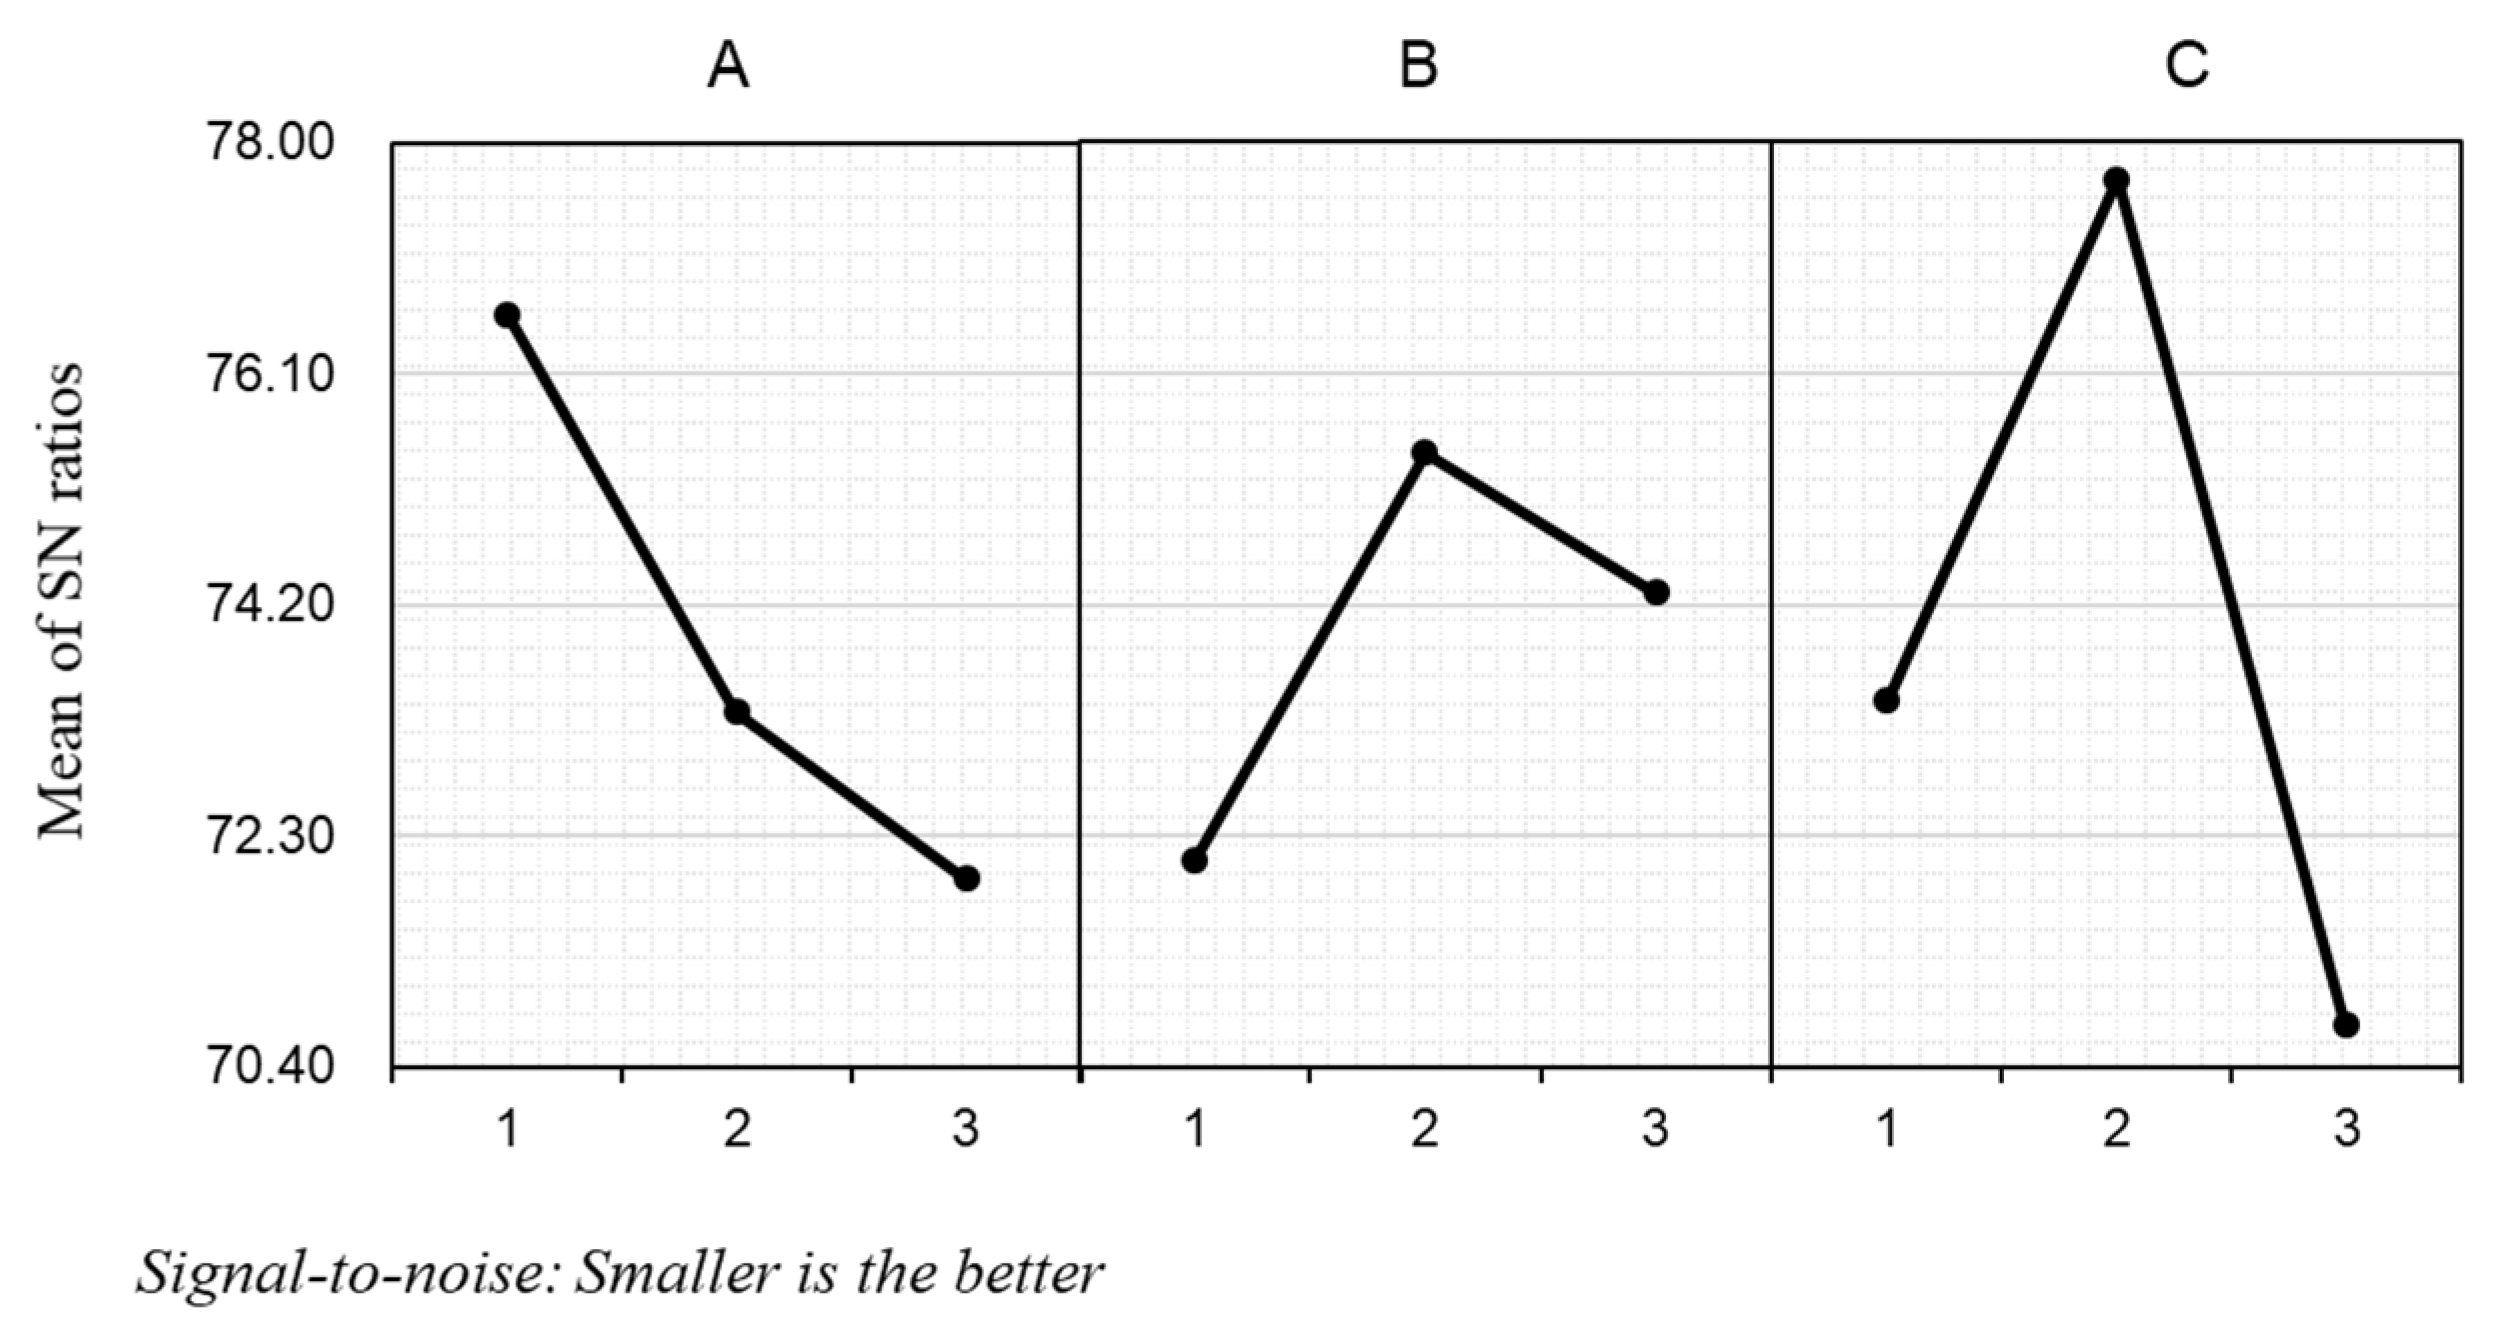
Figure 17.
Surface condition of ITO thin film after the MAP process according to the working gap: (a) working gap of 0.2 mm, (b) working gap of 0.4 mm, (c) working gap of 0.6 mm.
Figure 17.
Surface condition of ITO thin film after the MAP process according to the working gap: (a) working gap of 0.2 mm, (b) working gap of 0.4 mm, (c) working gap of 0.6 mm.

Figure 18.
Defects in ITO-coated Pyrex glass processing by MAP. (a) pitting; (b) delamination; (c) indentations; (d) irregular scratch.
Figure 18.
Defects in ITO-coated Pyrex glass processing by MAP. (a) pitting; (b) delamination; (c) indentations; (d) irregular scratch.
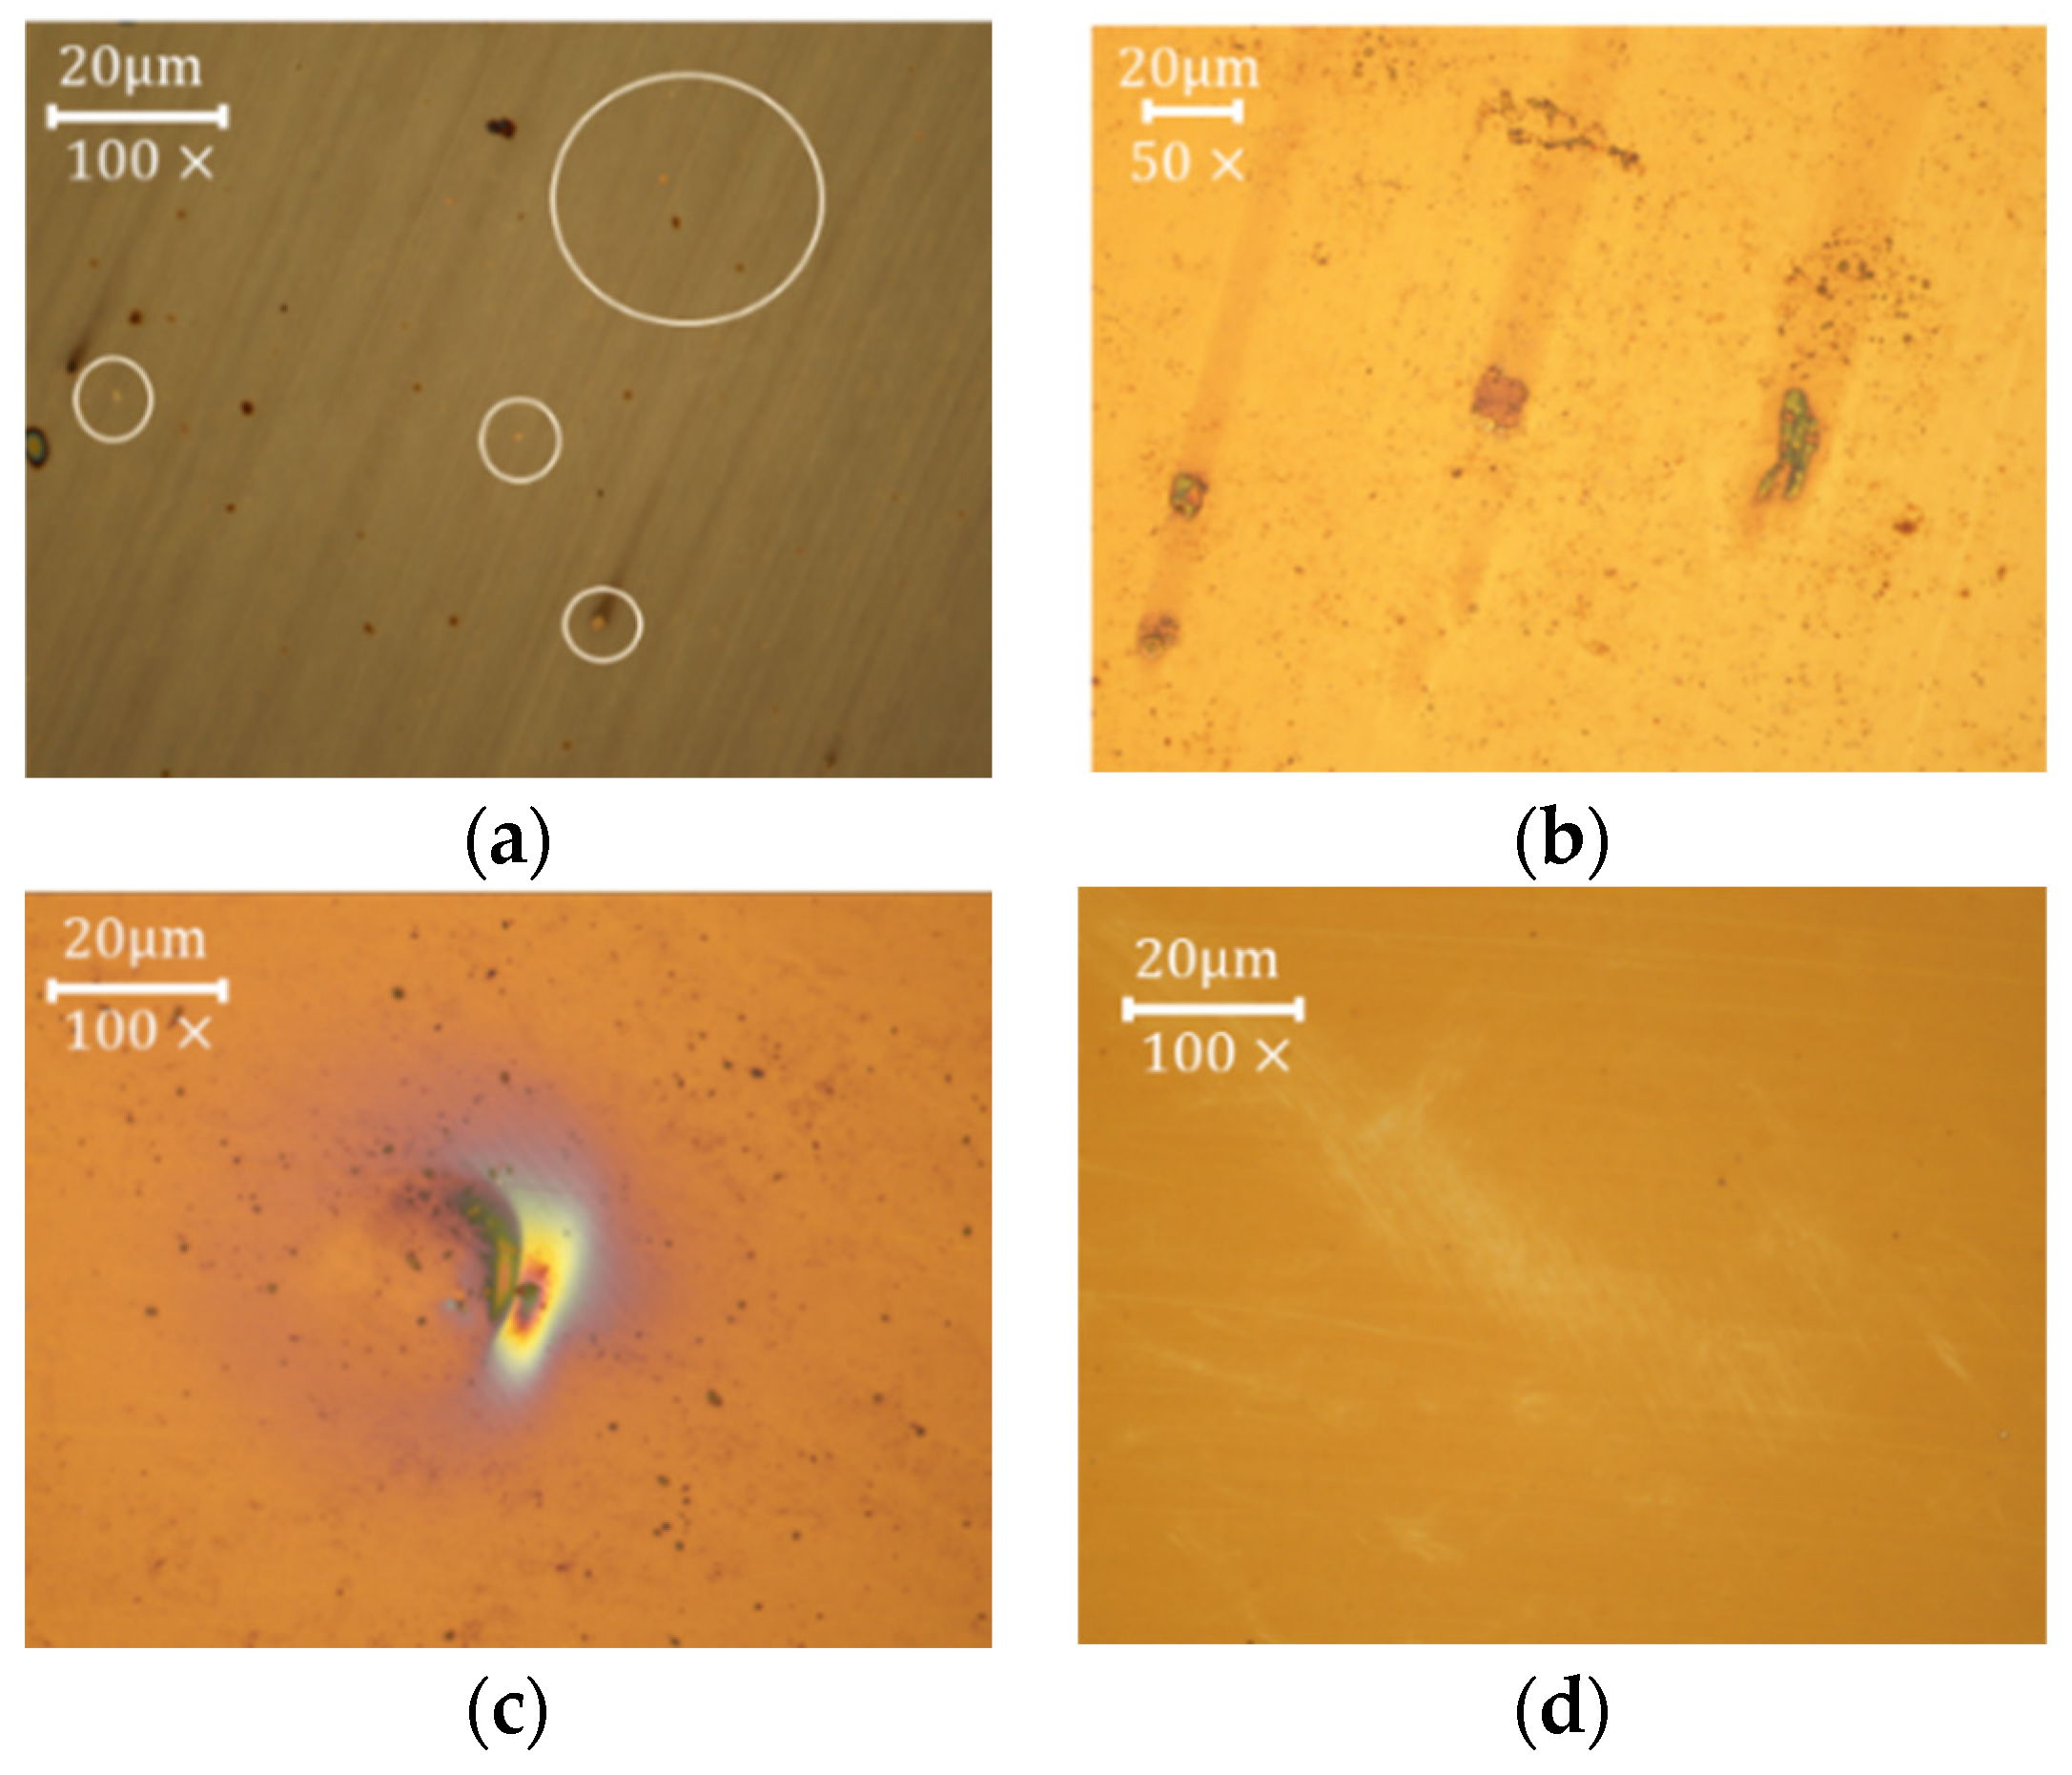
Figure 19.
Comparison of surface conditions under optimal and worst conditions: (a) optimal conditions (400 rpm, 0.4 mm, 75–125 μm, Ra: 13 nm); (b) worst conditions (800 rpm, 0.2 mm, 125–200 μm, Ra: 17 nm).
Figure 19.
Comparison of surface conditions under optimal and worst conditions: (a) optimal conditions (400 rpm, 0.4 mm, 75–125 μm, Ra: 13 nm); (b) worst conditions (800 rpm, 0.2 mm, 125–200 μm, Ra: 17 nm).

Table 1.
Properties of ITO thin films.
| Material | |
| Composition | 90:10 |
| Film properties | Partial crystalline/crystalline structure |
| Resistivity () | 600–800/100–200 |
| Young’s modulus () | 189 |
| Hardness () | 17.5 |
| Work function () | 5.0–5.1 |
| Transmittance (%) | 82 |
Table 2.
Level of value of polishing-process parameters.
| Factors | Levels | |||
|---|---|---|---|---|
| 1 | 2 | 3 | ||
| A | RPM (rev/min) | 400 | 600 | 800 |
| B | Gap (mm) | 0.2 | 0.4 | 0.6 |
| C | Particle size (μm) | 25–75 | 75–125 | 125–200 |
Table 3.
Acoustic emission setup (AE Node system).
| AE sensor | UT-1000 |
| Threshold value | 26 dB |
| High-pass filter | 20 kHz |
| Low-pass filter | 1 MHz |
| Sampling rate | 5 MSPS |
| Hit length | 2 K |
| Preamplifier | 40 dB |
Table 4.
Experimental details.
| Serial Number | Name of Parameter | Value of the Parameter |
|---|---|---|
| 1 | Workpiece material | ITO-coated Pyrex glass |
| 2 | Abrasive particle | Diamond powder |
| 3 | Magnetic abrasive | Carbonyl iron powder |
| 4 | Abrasive type | Bonded abrasive |
| 5 | Magnetic abrasive particle size | 25–75, 75–125, 125–200 |
| 6 | Weight of abrasive particle | 0.3 g |
| 7 | Polishing time | 600 s |
| 8 | Table feed rate | 40 |
| 9 | Tool rotational speed | 400, 600, 800 rpm |
| 10 | Working gap | 0.2, 0.4, 0.6 mm |
Table 5.
Experiment results for polishing-progress parameter (reaction data: surface roughness, Ra).
Table 5.
Experiment results for polishing-progress parameter (reaction data: surface roughness, Ra).
| A | B | C | Av. Ra (nm) | S/N (Ra) | |
|---|---|---|---|---|---|
| 1 | 1 | 1 | 1 | 15.15 | 96.287 |
| 2 | 1 | 2 | 2 | 14.3 | 96.860 |
| 3 | 1 | 3 | 3 | 15.5 | 96.112 |
| 4 | 2 | 1 | 2 | 15.75 | 96.011 |
| 5 | 2 | 2 | 3 | 15.25 | 96.305 |
| 6 | 2 | 3 | 1 | 15.5 | 95.548 |
| 7 | 3 | 1 | 3 | 17 | 95.086 |
| 8 | 3 | 2 | 1 | 15.4 | 96.231 |
| 9 | 3 | 3 | 2 | 15.3 | 96.140 |
Table 6.
Level of value of polishing-process parameters (reaction data: surface roughness, Ra).
| A | B | C | |
|---|---|---|---|
| 1 | 96.419 | 95.795 | 96.155 |
| 2 | 96.088 | 96.465 | 96.337 |
| 3 | 95.819 | 96.067 | 95.834 |
| Delta | 0.600 | 0.670 | 0.502 |
| Rank | 2 | 1 | 3 |
Table 7.
Experimental results for polishing-progress parameter (reaction data: AE RMS, ).
| A | B | C | Av. RMS | ||
|---|---|---|---|---|---|
| 1 | 1 | 1 | 1 | 0.001576 | 0.000133 |
| 2 | 1 | 2 | 2 | 0.001222 | 0.000092 |
| 3 | 1 | 3 | 3 | 0.001446 | 0.000133 |
| 4 | 2 | 1 | 2 | 0.001517 | 0.000114 |
| 5 | 2 | 2 | 3 | 0.002184 | 0.000164 |
| 6 | 2 | 3 | 1 | 0.002858 | 0.000256 |
| 7 | 3 | 1 | 3 | 0.002694 | 0.000351 |
| 8 | 3 | 2 | 1 | 0.00188 | 0.000143 |
| 9 | 3 | 3 | 2 | 0.00178 | 0.000106 |
Table 8.
Level of value of polishing-process parameters (reaction data: AE RMS, ).
| A | B | C | |
|---|---|---|---|
| 1 | 76.582 | 72.101 | 73.406 |
| 2 | 73.319 | 75.446 | 77.699 |
| 3 | 71.947 | 74.301 | 70.743 |
| Delta | 4.635 | 3.345 | 6.956 |
| Rank | 2 | 3 | 1 |
Disclaimer/Publisher’s Note: The statements, opinions and data contained in all publications are solely those of the individual author(s) and contributor(s) and not of MDPI and/or the editor(s). MDPI and/or the editor(s) disclaim responsibility for any injury to people or property resulting from any ideas, methods, instructions or products referred to in the content. |
© 2023 by the authors. Licensee MDPI, Basel, Switzerland. This article is an open access article distributed under the terms and conditions of the Creative Commons Attribution (CC BY) license (https://creativecommons.org/licenses/by/4.0/).
Share and Cite
MDPI and ACS Style
Kim, H.-J.; Lee, H.-H.; Lee, S.-H. Analysis of Surface Roughness during Surface Polishing of ITO Thin Film Using Acoustic Emission Sensor Monitoring. Coatings 2023, 13, 2086. https://doi.org/10.3390/coatings13122086
AMA Style
Kim H-J, Lee H-H, Lee S-H. Analysis of Surface Roughness during Surface Polishing of ITO Thin Film Using Acoustic Emission Sensor Monitoring. Coatings. 2023; 13(12):2086. https://doi.org/10.3390/coatings13122086
Chicago/Turabian StyleKim, Hyo-Jeong, Hee-Hwan Lee, and Seoung-Hwan Lee. 2023. "Analysis of Surface Roughness during Surface Polishing of ITO Thin Film Using Acoustic Emission Sensor Monitoring" Coatings 13, no. 12: 2086. https://doi.org/10.3390/coatings13122086
Note that from the first issue of 2016, this journal uses article numbers instead of page numbers. See further details here.