
Ship Painting Process Design Based on IDBSACN-RF
by
Henan Bu
1,*, 
Xin Yuan
1,
Jianmin Niu
2,
Wenjuan Yu
2,
Xingyu Ji
1,
Hongyu Lyu
1 and
Honggen Zhou
1 1
School of Mechanical Engineering, Jiangsu University of Science and Technology, Zhenjiang 212100, China
2
Shanghai Shipbuilding Technology Research Institute, Shanghai 200032, China
*
Author to whom correspondence should be addressed.
Coatings 2021, 11(12), 1458; https://doi.org/10.3390/coatings11121458
Submission received: 30 October 2021
/
Revised: 24 November 2021
/
Accepted: 26 November 2021
/
Published: 28 November 2021
(This article belongs to the Special Issue Manufacturing and Surface Engineering III)
Abstract
:The painting process is an essential part of the shipbuilding process. Its quality is directly related to the service life and maintenance cost of the ship. Currently, the design of the painting process relies on the experience of technologists. It is not conducive to scientific management of the painting process and effective control of painting cost. Therefore, an intelligent design algorithm for the ship painting process is proposed in this paper. Density-Based Spatial Clustering of Applications with Noise (DBSCAN) is used to form categories of painting objects by cluster analysis. The grey wolf optimization (GWO) is introduced to realize the adaptive determination of clustering parameters and avoid the deviation of clustering results. Then, a painting object classification model is constructed based on the random forest (RF). Finally, the recommendation of the painting process is realized based on the multi-objective evaluation function. Effectiveness is verified by taking the outer plate above the waterline of a shipyard H1127/7 as the object. The results show that the performance of DBSCAN is significantly improved. Furthermore, the accurate classification of painting objects by RF is achieved. The experiment proves that the dry film thickness qualification rate obtained by the painting process designed by IDBSCAN-RF is 92.3%, which meets the requirements of the performance standard of protective coatings (PSPC).
1. Introduction
Ship painting is one of the three pillars of modern shipbuilding and is used throughout ship construction [1]. The design of the ship painting process mainly includes the selection of coating matching, the development of surface treatment level, the development of secondary descaling grade and the design of the process routine [2]. A scientific and reasonable painting process is the key to ensure the quality of the ship’s construction. It is also an essential factor affecting the ship’s construction cycle and cost [3,4]. The design of the painting process requires an integrated consideration of many other factors, such as the corrosive environment in which the painting object is located, the available paintings and the available painting equipment. With the continuous development of technology, new coating matching have emerged and intelligent robots have been widely used in the field of ship construction [5,6]. At present, the design of the ship painting process mainly relies on the experience of technologists and no scientific process design flow and specification have been formed. Moreover, the amount of data in the painting process is huge, while the shipyard lacks effective management tools. Therefore, it is important to adopt the advanced concept and intelligent algorithm to realize accurate recommendations of the painting process for scientific management. This is also the way to promote the intelligent development of ship painting.
Painting, as an effective means of corrosion protection, is a key part of the product design and manufacturing process. Kern et al. developed a digital paint formulation design platform to improve the efficiency of paint formulation design [7]. Oliveira et al. combined hierarchical analysis and preference ranking organization enrichment assessment methods to evaluate vehicle painting schedules [8]. Bianco et al. provide a comprehensive life cycle inventory and life cycle assessment of the automotive painting process [9]. With the spread of data intelligence and data-driven thinking, process design technologies based on intelligent algorithms are widely used in various industries [10,11,12]. Li et al. reorganized the assembly plan based on the hierarchic subdivision and constructed a sequence of initial assembly using the ant colony algorithm [13]. Nurwahaa et al. performed a multi-objective optimization of electrospinning process parameters, including polyvinyl alcohol solution concentration, applied voltage, spinning distance and volume flow rate by using the gene algorithm [14]. Gao et al. constructed a mathematical model for manufacturing process planning. The process planning scheme with the lowest production cost is obtained by searching a limited space of feasible solutions with the intelligent water drop algorithm [15]. Thao et al. developed a predictive model of welding process parameters by using the genetic algorithm to improve the robot welding performance [16]. Jing et al. used the genetic algorithm to obtain the global optimal machining process route for parts [17]. To sum up, scholars have achieved certain research results in the development of paint formulations and evaluation of painting technology routes. Meanwhile, the process design based on intelligent algorithms has been widely applied in many fields. However, in the field of ship construction, there are few reports about the intelligent design of the painting process.
As a huge crop of steel structures sailing in the ocean, various parts of the ship are in different corrosive environments. Therefore, the paintings used in different parts need to have different anti-corrosion performance requirements. The diversity of paintings determines the construction conditions, the construction process and the painting equipment [2]. Therefore, a series of process routes, process methods need to be formulated. Furthermore, painting operations are carried out at different process stages. To improve the process design efficiency, the classification of large and redundant process data is a common method. Classification is an important form of data analysis. Common classification algorithms include decision tree, Bayes algorithm, association rule algorithm, neural network, support vector machine, random forest, etc. [18,19]. Among them, RF is a classification algorithm that uses a decision tree as a base learner. It has the advantages of high accuracy and is not easy to over-fit, so it is widely used to solve practical engineering problems [20]. Chen et al. conducted a classified evaluation of the security risk of large-scale group activities based on RF [21]. Han et al. used RF for intelligent diagnosis of rotating machinery [22]. Miraki et al. mapped the groundwater potential based on the classification prediction results of RF [23]. The above research results provide a good theoretical basis for the construction of the painting object classification model.
At present, the research of intelligent shipbuilding and intelligent shipyard is in the initial stage. In this paper, a painting process intelligent design algorithm is proposed to solve the problem of over-reliance on technologist’s experience for painting process design and the degree of intelligence is low in shipyards at the present stage. In order to obtain the best painting process, the painting objects are classified based on RF. However, supervised learning is not possible because painting objects do not have category labels. In this paper, the existing painting objects are firstly clustered and analyzed by IDBSCAN to realize the category classification of painting objects. In this paper, IDBSCAN based on GWO is proposed to solve the problem that the traditional DBSCAN is very sensitive to the initial clustering parameters. The adaptive determination of clustering parameters is realized to avoid the clustering bias caused by artificially set parameters. At the same time, a multi-objective evaluation function of the painting process is established with the single objective of painting quality, painting dosage and painting man-hour. In addition, the weight factors of each objective function are determined by using the analytical hierarchy process (AHP) and entropy method. The recommendation of the optimal painting process is achieved by the multi-objective evaluation of painting processes of similar objects.
2. Classification of Painting Objects Based on IDBSCAN-RF
2.1. Construction of RF-Based Classification Model for Painting Objects
In this paper, the classification model of painting objects is constructed by the trained RF. The object to be painted is classified into the most similar painting objects based on their characteristics. RF essentially belongs to ensemble learning, which is an important branch of machine learning. Ensemble learning efficiently fuses multiple base learners through strategies to obtain significantly better generalization performance than a single learner. The principle of RF is shown in Figure 1 and the key steps are as follows.
Step 1: For each decision tree, N training samples with P attributes are sampled N times with put-back repetitions using the bootstrap sampling method to construct the sample M, where some of the data are never drawn after N times of sampling and do not become training samples, which are called out-of-bag data.
Step 2: The decision tree T is generated for the training set samples. Randomly select p attributes from the P attributes () as the set of splitting attributes for the current tree node. In addition, find the optimal way to split this node among these p attributes.
Step 3: Repeat Step 1 and Step 2 a total of n times to obtain the training set . The RF model is composed of the corresponding generated decision tree .
Step 4: The prediction results of the samples to be predicted are obtained based on the generated RF model. The final category of the target sample is obtained using majority voting based on the classification results of each tree.
Step 5: The generated RF model is applied to the validation set to obtain the decision result and the prediction result is obtained according to Step 4. The prediction results are compared with the validation set labels to evaluate the generalization ability of the model. Then, parameter tuning is performed to obtain the best RF model.
2.2. Clustering of Painting Objects Based on IDBSCAN
Since painting objects do not possess category labels, RF cannot be directly used for classification. Therefore, cluster analysis is first performed on the painting objects to form categories. Clustering algorithm, as a type of unsupervised learning, is the process of dividing the sample set into k clusters based on the similarity between samples, so that the objects within the clusters have high similarity but are very dissimilar to the objects in other clusters [24]. In this paper, an improved DBSCAN is used to construct the clustering model for painting objects.
2.2.1. DBSCAN
DBSCAN, a typical density-based clustering algorithm, is based on a “neighborhood” parameter (ε, ) to characterize the closeness of the sample distribution [25,26]. For a given data set , the following concepts are available.
Definition 1
(ε-neighborhood). For , its ε-neighborhood contains samples in the sample set whose distance from is not greater than ε, that is Nε (xj) = {xi ∈ ℝ|dist(xi,xj) ≤ ε}.
Definition 2
(Core object). is a core object, if the ε-neighborhood of contains at least samples, that is .
Definition 3
(Directly density-reachable). is directly density-reachable from , if belongs to the ε-neighborhood of and is a core object.
Definition 4
(Density-reachable). is density-reachable from , if there is a sample sequence , where ,, and is directly density-reachable from .
Definition 5
(Density-connected). is density-connected to , if these exists that both and are density-reachable from .
DBSCAN defines a “cluster” as the largest set of density-connected samples derived from a density-reachable relation. If is the core object, the set consisting of all samples is density-reachable from is shown in Equation (1).
The clustering result obtained by DBSCAN is . The average distance between samples within its cluster is calculated by Equation (2) and the distance between its clusters is calculated by Equation (3).
where is used to calculate the distance between two samples.
where represents the center point of cluster C, .
The advantage of DBSCAN is that arbitrarily shaped clusters can be discovered without specifying the number of clusters. However, DBSCAN is sensitive to clustering parameters and traditional DBSCAN relies entirely on empirical settings of and . In order to avoid the bias caused by artificially set parameters, GWO is introduced to improve DBSCAN to realize adaptive determination of parameters and improve the quality of clustering.
2.2.2. Grey Wolf Optimization
GWO is a swarm intelligence optimization algorithm inspired by the predatory behavior of grey wolf groups [27]. GWO has the features of simple structure, few parameters to be adjusted, fast solving speed and convergence and is suitable for dealing with parametric optimization problems. The optimal solution in GWO is defined as , the second and third optimal solutions are and , respectively and the remaining candidate solutions are . The optimization process of GWO is the process of updating the position of , , and [28]. The specific process is as follows.
- (1)
- Encircling prey
When encircling the prey, the distance between the individual and the prey is calculated by Equation (4) and the position of the grey wolf is updated by Equation (5).
where t is the number of current iterations, and are the coefficient vectors, is the position vector of the prey and is the position vector of the grey wolf.
and are calculated as follows.
where decreases linearly from 2 to 0 during the iteration, and are random numbers between [0, 1].
- (2)
- Hunting
When the grey wolves identify the prey, the hunting process is guided by to and . In GWO, it is assumed that , and have a better understanding of the potential location of the prey. Based on the three optimal solutions that have been obtained, the location of the prey is determined and the remaining grey wolf individuals are forced to update their locations. The mathematical model of the hunting process is expressed as follows.
where , and denote the distances between , , and other individuals, respectively; , and are coefficient vectors; , and denote the current positions of , and , respectively; and is the current position of other grey wolves.
The formula for updating the position of the remaining wolves is as follows.
- (3)
- Attacking prey (exploitation)
After the prey stops moving, the grey wolves complete the hunt by attacking the prey. When approaching the prey, the value of is gradually smaller and the fluctuation range of decreases. When , the wolves attack the prey, at which time the algorithm falls into local optimum.
- (4)
- Search for prey (exploration)
The grey wolves search for prey based on the positions of , and . Grey wolves separate from each other to look for prey and then gather together to attack the prey. When , the grey wolves are forced to separate from their prey in order to find a more suitable prey, which means to find the global optimal solution.
2.2.3. Improved DBSCAN Based on GWO
In this paper, DBSCAN is improved based on GWO to obtain more accurate ε and and make the clustering results of painting objects more precise. The computational flow is shown in Figure 2.
The steps are as follows.
Step 1: Set the number of wolf groups n and the maximum number of iterations . The neighborhood parameters ε and of DBSCAN are used as two-dimensional coordinates of individual wolf positions. ε and are randomly initialized to generate clustering results.
Step 2: The clustering indicator DB index is used as the fitness indicator of GWO and wolf classes (, , and ) are classified according to the fitness values. Fitness is calculated as .
Step 3: The wolves position are updated according to Equations (8)–(10). The fitness values of the updated individuals are calculated and the optimal fitness value for the current generation is recorded. If , the adaptation value of wolf is updated to and the corresponding position is recorded. If , is assigned to wolf and the corresponding position is updated to wolf . If , then and the corresponding position are updated to wolf .
Step 4: The final position parameters of wolf are optimal clustering parameters. The optimal ε and are obtained when the maximum number of iterations or the global optimum is reached. Then, they are used as the parameters of DBSCAN to obtain the clustering results of the painting objects.
2.2.4. Feature Selection
Feature selection is the process of selecting a subset of relevant features from a given set of features. Due to a large number of feature dimensions of the painting objects, feature selection needs to be performed to avoid dimensional disasters in the clustering process. Before feature selection, the features need to be pretreatment. For numerical features, the min-max normalization method is used to normalize all features to the [0, 1] interval, calculated as follows.
where is the original value, is the maximum value of the data set, is the minimum value of the data set and is the transformed value.
In this paper, the Laplacian Score method is used to extract the features of painting objects. The method reflects the local information retention ability of features by calculating the Laplace score of each feature [29]. The concrete steps are as follows.
- (1)
- Construct the nearest neighbor graph GThe nearest neighbor graph G contains a total of n nodes and the ith node corresponds to the feature sample . If sample is contained in the p-nearest neighbor of sample , or sample is contained in the p-nearest neighbor of sample , nodes i and j will be connected together in the nearest neighbor graph G. where p is a pre-given value.
- (2)
- Construct the weight matrix Swhere t is a constant.
- (3)
- Generate Laplacian matrix Lwhere D is the diagonal stiffness matrix, .
- (4)
- Calculate Laplace scoreThe Laplace score for each feature is calculated as follows.where , , .
Feature score is inversely proportional to feature importance. The lower the feature score, the more influential the feature is. Therefore, after calculating the Laplace score of each feature, the d features with the lowest scores are the results of feature selection.
2.3. Overall Flow Based on IDBSCAN-RF
The classification method of painting objects based on IDBSCAN-RF is shown in Figure 3. Firstly, in order to avoid the phenomenon of dimensional disaster in the clustering and classification process, feature selection is performed on the painting object to extract important features. Then, to solve the problem that painting objects cannot be directly classified without the category label, the painting objects are clustered based on IDBSCAN to get the categories of painting objects. After that, RF is trained based on the clustering results. Finally, classification of the objects to be painted is performed based on the trained classification model to find the most similar painting object categories, so as to obtain the similar painting object set.
3. Multi-Objective Evaluation of Painting Processes
In the management of painting projects, the traditional evaluation method based on painting quality is no longer able to meet the increasing requirements of quality, specification and environmental protection [30]. While ensuring the quality of painting, controlling the economic cost of painting and improving the efficiency of painting operation are the prerequisites for achieving scientific management of ship painting. This is also the way to improve the competitiveness of the shipbuilding enterprise industry. For this purpose, a multi-objective evaluation function of the painting process is constructed to evaluate the painting process in a similar object set in order to recommend a high-quality, high-efficiency and low-cost painting process.
3.1. Establishment of Multi-Objective Evaluation Function for Painting Process
During the construction of the painting, the thickness of the painting film needs to meet the design requirements to ensure the painting performance. At the same time, painting defects caused by uneven film thickness need to be avoided. Good painting film thickness is an important guarantee of painting quality. Therefore, the painting film thickness is used as the evaluation index of painting quality. The objective function of painting quality is established as shown in Equation (15).
where is the rating dry film thickness; is the number of measurement areas, , S is the region of painting area; i is the number of the painting area; is the number of measurement points in area i; is the actual dry film thickness of each measurement point in the painting area; is the weighting factor related to the measurement area.
Painting dosage is an important basis for shipyards to make paint procurement plans. It is also the key to the cost control of ship construction [31]. In the actual construction process, the actual painting dosage is influenced by the construction environment, the surface roughness of the ship, construction process parameters and other factors. In addition, a certain degree of increase in the dosage of additional paint is due to touch-up operations caused by painting defects. Therefore, the established painting dosage objective function is shown in Equation (16).
where is the dosage of paint used for the initial application, is the dosage of paint used for the touch-up operation and is the rating painting dosage.
In order to maximize the shipyard construction capacity and improve the efficiency of ship construction, the painting man-hour objective function is established. The painting man-hour objective function is aimed at the deviation of the actual painting man-hour from the rating painting man-hour. The objective function of painting man-hours is established as shown in Equation (17).
where is the actual painting man-hour, is the auxiliary preparation time, is the make-up painting man-hour and is the rating painting man-hour.
Based on the above target conditions, a comprehensive multi-objective evaluation function of the painting process based on painting quality, painting dosage and painting man-hour is established, as shown in Equation (18).
where is the multi-objective evaluation function; , and are the painting quality objective function, painting dosage objective function and painting man-hour objective function, respectively; , and are the weight coefficients related to painting quality, painting dosage and painting man-hour, respectively.
3.2. Determination of Weight Coefficients Based on the Combination Weighting Method
In multi-objective evaluation, the determination of weight coefficients is directly related to the reliability and validity of the evaluation results. The methods of determining the weight coefficients are divided into subjective empowerment method, objective empowerment method and combination weighting method [32]. In order to reduce the arbitrariness of subjective empowerment and the limitation of objective empowerment, the combination weighting method is used to determine the weight coefficients for the multi-objective evaluation of the painting process.
3.2.1. Calculation of Subjective Weights Based on AHP
AHP can mathematize the thinking process of decision-making by using less amount of information. The construction of the judgment matrix is a prerequisite for determining the index weights by using AHP. The elements of each layer are compared two by two to construct the judgment matrix [33], as shown in Equation (19).
where , , reflects the degree of importance of factor and factor relative to the target; , is the number of indicators.
To ensure the reasonableness of the evaluation results, the judgment matrix is subjected to a consistency test. The negative average of the remaining eigenvalues other than the largest eigenvalue of the judgment matrix is calculated by Equation (20).
where indicates the maximum characteristic root of the judgment matrix, is the order of the judgment matrix.
The consistency ratio of the judgment matrix is calculated by Equation (21).
where is the average random consistency index and the value of is shown in Table 1. When , the judgment matrix is considered to have satisfactory consistency.
The summation method is used to perform the solution of the eigenvectors of the judgment matrix to obtain the index weights based on AHP, as shown in Equation (22).
3.2.2. Calculation of Objective Weights Based on Entropy Method
Information entropy is a measure of the degree of system disorder. The utility value of system information is objectively reflected by information entropy. The decision matrix and the output entropy of each indicator are used by the entropy method to determine the weighting coefficients of each indicator. For m ship painting process cases with n evaluation indicators, the initial data matrix is defined as follows.
where represents the value of the jth evaluation index for the ith sample.
The specific steps to achieve the objective weight calculation by using the entropy method are as follows [34].
- (1)
- Normalize the raw data using Equation (24).where is the average value of the jth indicator, ; is the standard deviation of the jth indicator, .
- (2)
- Calculate the weight of the indicator value of the ith item under the jth indicator.
- (3)
- The information entropy value e and information utility value d of the th indicator are calculated as follows.where .
- (4)
- Calculate the entropy weight coefficient of each objective.
3.2.3. Calculation of Combination Weights
In order to avoid the disadvantages of each of the AHP and entropy method, the combination weighting method is used to calculate the combination weight [35], as shown in Equation (29).
where is the subjective weight calculated by AHP, is the objective weight calculated by the entropy method.
4. Experimental Validation and Results Analysis
In this paper, the outer plate above the waterline of a shipyard H1127/7 type ship is used as the verification object for painting process design, as shown in Figure 4. In the process of integrated hull-outfitting-painting shipbuilding, the segments are the initial stage of painting. In the segment painting stage, the outer plate above the waterline is split into segments for painting. The outer plate above the waterline is mainly corroded by the marine atmosphere, sea spray, rain and snow, seawater used for washing the deck and condensation water. To prevent corrosion, the corresponding coating matching for this part is shown in Table 2 [2]. At present, the painting equipment that can be used for the outer plate above the waterline in the shipyard mainly includes side suspension painting robots, rail painting robots, high-pressure airless sprayers, internal rail painting robots.
4.1. Feature Selection for the Painting Objects
The selection of the painting process equipment and the determination of the process parameters are directly influenced by various factors. These include the basic attributes of the object to be painted, such as material, area, descaling grade, surface roughness, etc., as well as the coating matching used for the part. Therefore, the basic attributes of the painting object and the selected coating matching are selected as the features of the painting object, as shown in Table 3.
A total of 1200 painting history data from a shipyard between 2010 and 2020 are selected for feature selection of painting objects using the Laplace scoring method. The Laplacian scores of the 12 features are arranged in descending order and the results are shown in Equation (30).
In this paper, the five features with the lowest Laplacian scores are used as the result of feature selection for subsequent classification model construction.
4.2. Analysis of Clustering Results for Painting Objects
In this paper, the Davies–Bouldin index (DBI) and the Silhouette index (SI) are used to evaluate the clustering performance. DBI calculates the ratio of the sum of the internal distance of the cluster to the external distance. The smaller the DBI value, the higher the quality of clustering. DBI is calculated as follows.
SI measures the difference between the similarity between a sample and samples within a cluster and the similarity of samples within other clusters. The value of SI is between −1 and 1. The compactness of the cluster to which belongs is reflected by the value of SI. It is calculated as follows.
where , represents the average distance between sample in the cluster and other objects in the cluster; , represents the minimum average distance of the sample within a cluster from all other clusters.
For the evaluation of the performance of the proposed method (IDBSCAN), the results have been compared to those of the DBSCAN, OPTICS and PAPC-DBSCAN [36,37,38]. Among them, in DBSCAN, set , ; in OPTICS, set , , ; in PAPC-DBSCAN, set , , , , ; in IDBSCAN, set the number of wolves as 30 and the number of iterations as 300. The clustering results of different models are shown in Table 4.
As can be seen from the table, the lowest DBI and SI are obtained by IDBSCAN, which verifies that IDBSCAN has better clustering performance.
4.3. Analysis of Classification Results for Painting Objects
The accurate classification of painting objects is achieved based on the results of cluster analysis. In order to obtain better classification performance, the parameters of RF are set and adjusted. To analyze the effect of the number of decision trees on the classification results, set the maximum depth of decision tree , the maximum number of features as 5, the minimum sample required for internal node re-division as 2, the minimum sample of leaf nodes as 1, the number of decision trees . The results of the decision tree quantity optimization are shown in Figure 4. As can be seen from the figure, there is a significant improvement in classification accuracy when the number of decision trees is increased from 10 to 40. The accuracy reaches the maximum when the number of decision trees is 70. In addition, when the number of decision trees increases, the accuracy rate fluctuates. However, the maximum error in accuracy is only 0.0024 when the number of decision trees is varied in the range [70, 200], indicating that the random forest algorithm has good robustness.
To analyze the effect of the maximum depth of decision tree on the classification results, set the minimum sample required for internal node re-division as 2, the minimum sample of leaf nodes as 1, the number of decision trees , the maximum depth of decision tree . The results of the maximum depth of decision tree optimization are shown in Figure 5. As can be seen from the figure, the classification accuracy varies significantly with the depth of the decision tree when . After that, the variation of the accuracy rate gradually smoothed out. When , the accuracy rate reaches the maximum. When the decision tree depth is varied in the range of [4, 10], the accuracy fluctuates in the range of 0.001, indicating that the algorithm has good robustness.
The finalized parameter is , . In this paper, the primer spraying process of the outer plate above the waterline is used as an example for process design Its corresponding characteristic values are shown in Table 5.
The objects to be painted are classified based on the trained RF classification model. The set of similar painting objects for the outer plate above the waterline obtained is shown in Table 6.
Cases of painting processes corresponding to similar painting objects are shown in Table 7.
4.4. Multi-Objective Evaluation of Painting Processes
Field experts in ship painting are invited to compare the indicators of painting process evaluation. 1~9 scale method is used to construct the judgment matrix [39]. The consistency test is performed on the judgment matrix according to Equations (20) and (21). The weights are calculated using Equation (22) and the results are shown in Table 8.
The deviation degree and the weight coefficient of the entropy value for each index are calculated by Equations (24)–(28) and the results are shown in Table 9.
The combination weights calculated by Equation (29) are as follows.
The values of the single-objective evaluation function for the painting process in Table 7 are calculated by Equations (15)–(17). On this basis, the value of the multi-objective evaluation function of the painting process is obtained by combining the combined weights of Equation (33) and weighted by Equation (18). The calculation results are shown in Table 10.
4.5. Painting Experiment
Based on the results of the multi-objective evaluation, the highest scoring set of process parameters is selected and recommended to the painting process designer. The specific painting parameters are shown in Table 11.
Based on the recommended results, the gun type, nozzle type, nozzle diameter and the number of nozzles are set for the side suspension painting robot. Moreover, painting process parameters such as paint spraying pressure and travelling speed are fed into the side suspension painting robot. The outer plate above the waterline is tested with primer paint, as shown in Figure 6.
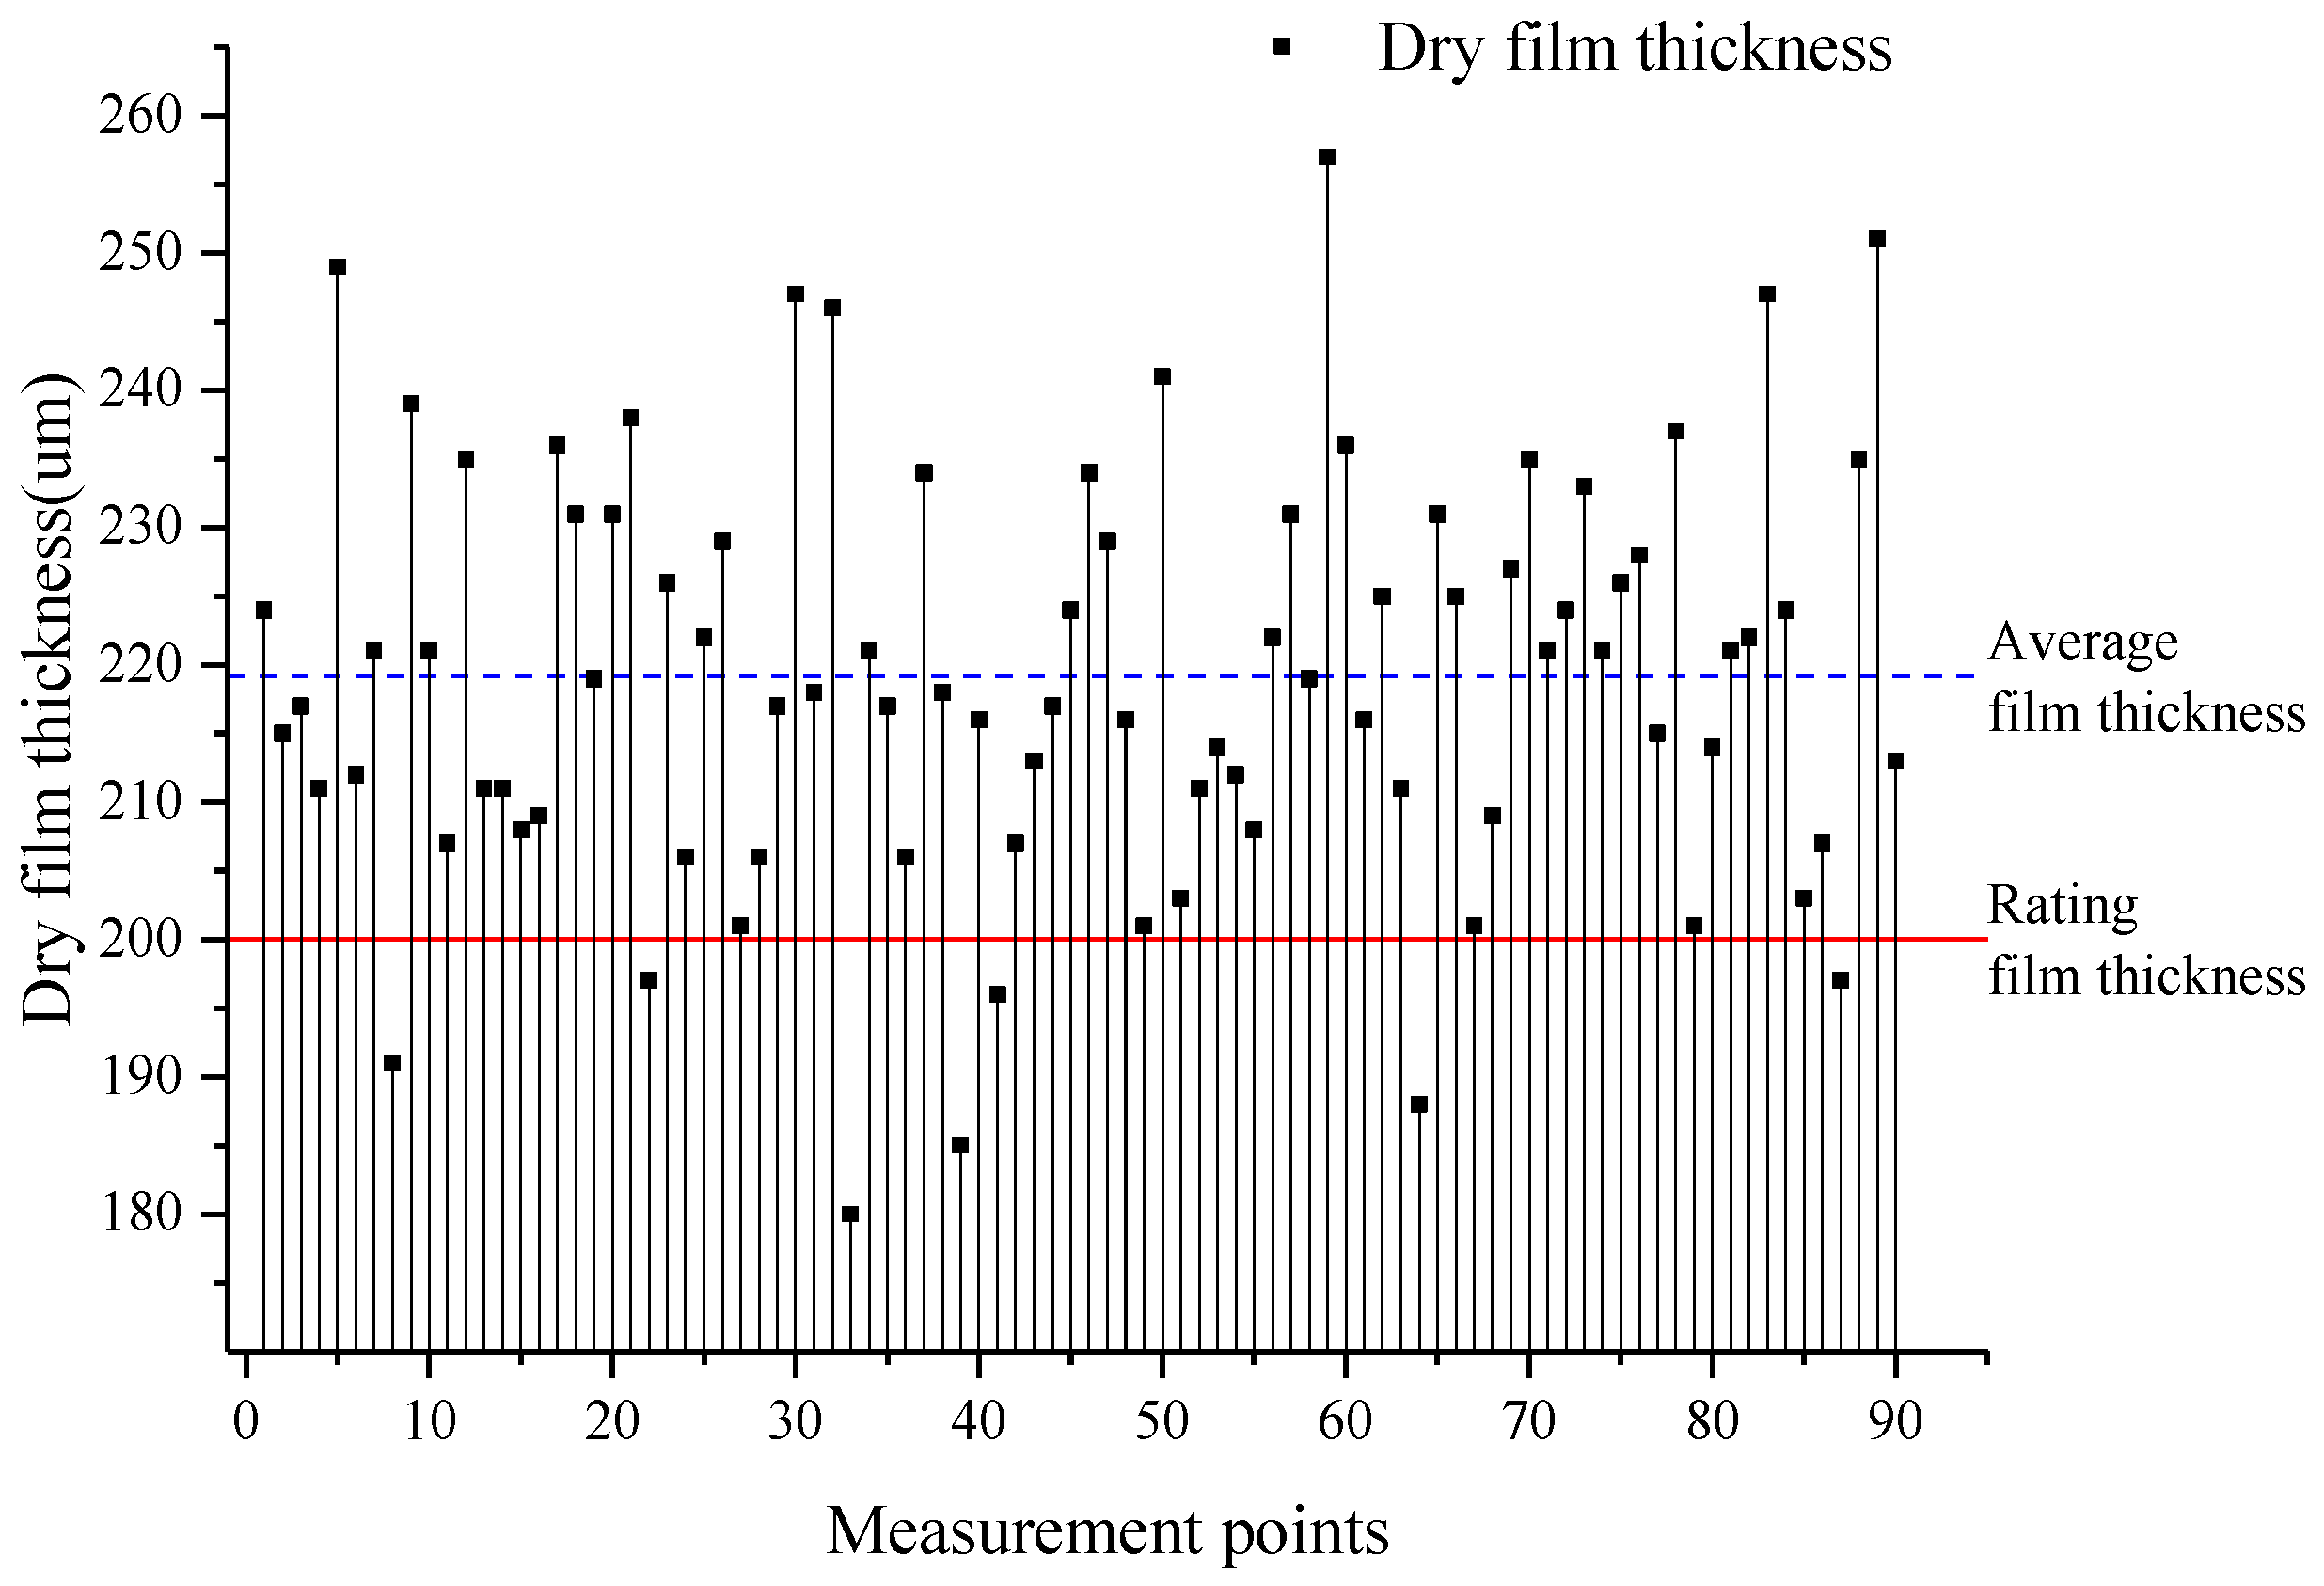
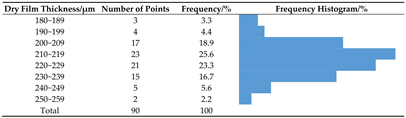
The dry film thickness gauge is used to measure the dry film thickness after the painting has completely dried. The painting area of the outer plate above the waterline is 183 m2 and is divided into ten measurement areas. Within each area, the dry film thickness is measured at nine randomly selected points. The measurement results of dry film thickness are shown in Figure 7 and the distribution of film thickness is shown in Table 12.
As can be seen from the Figure 8, the average film thickness is 219.19 µm and the maximum film thickness deviation is 77 µm. The rating film thickness of the primer for the outer plate above the waterline is 200 µm, as specified in the coating matching table for the H1127/7 type ship. According to the PSPC standard, the dry film thickness should satisfy the 90/10 principle [40]. That is, the dry film thickness of more than 90% of the test points is not less than the specified film thickness and the dry film thickness of the remaining test points is not less than 90% of the specified film thickness. As can be seen from the table, 92.3% of the measurement points achieved the rating dry film thickness. Moreover, the dry film thickness of seven measurement points failed to reach the rating film thickness. However, the dry film thickness of these seven points also reached 90% of the rating film thickness, which is in accordance with the PSPC standard. Therefore, the dry film thickness of these seven points also meet the construction requirements of the shipyard.
5. Conclusions
In this paper, a painting process intelligent design method is introduced and verified by actual painting tests. To improve the efficiency of process design, RF is used to construct a classification model for painting objects. A hybrid classification algorithm of DBSCAN and RF is proposed to solve the problem that RF cannot be directly used to construct a classification model because painting objects do not have category labels. DBSCAN is used to perform clustering to form painting object category labels. Meanwhile, GWO is introduced to optimize DBSCAN for the adaptive determination of clustering parameters to improve the clustering quality. The evaluation function is established with the evaluation criteria of painting quality, painting dosage and painting man-hour by considering the dry film thickness, economic cost and painting efficiency. Furthermore, the weight coefficients of each objective function are determined based on the AHP and entropy method to realize the objective evaluation of the painting process in the painting object set. The primer painting process of the outer plate above the waterline is used as an example for process recommendation. In addition, the actual painting test is carried out according to the recommended process parameters. The results show that the average dry film obtained by painting based on the recommended process parameters is 219.19 µm. The dry film thickness qualification rate is 92.3%, which met the PSPC standard.
In the actual painting process of ships, the quality of the painting is affected by various factors. The final painting effect is affected by environmental factors such as temperature, humidity and wind speed. The actual painting operation cannot fully achieve the desired process design. Therefore, the establishment of an accurate painting quality prediction model and a dynamic adjustment strategy of process parameters based on real-time measurement of film thickness are important directions to be explored in the next step.
Author Contributions
H.B. revised the paper and completed it; X.Y. wrote the first draft of the paper; J.N. and W.Y. assisted in the experimental verification of the paper; X.J. and H.L. collected and sorted the data; H.Z. provided funding for the paper. All authors have read and agreed to the published version of the manuscript.
Funding
This study was financially supported by Ministry of Industry and Information Technology High-Tech Ship Research Project: Research on Development and Application of Digital Process Design System for Ship Coating (No.: MC-202003-Z01-02), the National Natural Science Foundation of China (No.: 51804133) and the Natural Science Foundation of Jiangsu Province (No.: BK20180977).
Institutional Review Board Statement
Not applicable.
Informed Consent Statement
Not applicable.
Data Availability Statement
The data presented in this study are available on request from the corresponding author. The data are not publicly available because they are also part of ongoing research.
Conflicts of Interest
The authors declare that there is no conflict of interest regarding the publication of this work.
References
- Dev, A.K.; Saha, M. Analysis of Hull Coating Renewal in Ship Repairing. J. Ship Prod. Des. 2017, 33, 197–211. [Google Scholar] [CrossRef]
- Xin, Y.; Henan, B.; Jianmin, N.; Wenjuan, Y.; Honggen, Z.; Xingyu, J.; Pengfei, Y. Coating matching recommendation based on improved fuzzy comprehensive evaluation and collaborative filtering algorithm. Sci. Rep. 2021, 11, 1–14. [Google Scholar] [CrossRef]
- Hunsucker, K.Z.; Vora, G.J.; Hunsucker, J.T.; Gardner, H.; Leary, D.H.; Kim, S.; Lin, B.; Swain, G. Biofilm community structure and the associated drag penalties of a groomed fouling release ship hull coating. Biofouling 2018, 34, 162–172. [Google Scholar] [CrossRef] [PubMed]
- Broderick, D.; Wright, P.; Kattan, R. Minimizing the Cost of Coating Ships. J. Ship Prod. Des. 2013, 29, 142–149. [Google Scholar] [CrossRef]
- Muthugala, M.V.J.; Samarakoon, S.B.P.; Elara, M.R. Toward energy-efficient online Complete Coverage Path Planning of a ship hull maintenance robot based on Glasius Bio-inspired Neural Network. Expert Syst. Appl. 2022, 187, 115940. [Google Scholar] [CrossRef]
- Muthugala, M.A.V.J.; Le, A.V.; Cruz, E.S.; Elara, M.R.; Veerajagadheswar, P.; Kumar, M. A Self-Organizing Fuzzy Logic Classifier for Benchmarking Robot-Aided Blasting of Ship Hulls. Sensors 2020, 20, 3215. [Google Scholar] [CrossRef]
- Kern, T.; Krhač, E.; Senegačnik, M.; Urh, B. Digitalizing the Paints and Coatings Development Process. Processes 2019, 7, 539. [Google Scholar] [CrossRef] [Green Version]
- Oliveira, M.; Fontes, D.B.M.M.; Pereira, T. Evaluating vehicle painting plans in an automobile assembly plant using an integrated AHP-PROMETHEE approach. Int. Trans. Oper. Res. 2015, 25, 1383–1406. [Google Scholar] [CrossRef]
- Bianco, I.; Panepinto, D.; Blengini, G.A.; Onofrio, M.; Zanetti, M. Inventory and life cycle assessment of an Italian automotive painting process. Clean Technol. Environ. Policy 2020, 22, 247–258. [Google Scholar] [CrossRef]
- Li, Y.J.; Li, Y.J.; Miao, G.K.; Zhang, P.Q. Tourism Crafts Design System and Intelligent Technology Based on Virtual Design and Genetic Algorithm. Fresenius Environ. Bull. 2020, 29, 6518–6525. [Google Scholar]
- Choudhary, A.; Kumar, M.; Gupta, M.K.; Unune, D.K.; Mia, M. Mathematical modeling and intelligent optimization of submerged arc welding process parameters using hybrid PSO-GA evolutionary algorithms. Neural Comput. Appl. 2019, 32, 5761–5774. [Google Scholar] [CrossRef]
- Wang, Y.; Liu, J. Chaotic particle swarm optimization for assembly sequence planning. Robot. Comput. Manuf. 2010, 26, 212–222. [Google Scholar] [CrossRef]
- Li, S.; Liu, Y.; Wang, J.; Zeng, H. An intelligent interactive approach for assembly process planning based on hierarchical classification of parts. Int. J. Adv. Manuf. Technol. 2013, 70, 1903–1914. [Google Scholar] [CrossRef]
- Nurwaha, D.; Wang, X. Optimization of electrospinning process using intelligent control systems. J. Intell. Fuzzy Syst. 2013, 24, 593–600. [Google Scholar] [CrossRef]
- Gao, B.; Hu, X.; Peng, Z.; Song, Y. Application of intelligent water drop algorithm in process planning optimization. Int. J. Adv. Manuf. Technol. 2020, 106, 5199–5211. [Google Scholar] [CrossRef]
- Thao, D.T.; Kim, I.S.; Na, H.H.; Jung, S.M.; Shim, J.Y. Development of mathematical model with a genetic algorithm for automatic GMA welding process. Int. J. Adv. Manuf. Technol. 2014, 73, 837–847. [Google Scholar] [CrossRef]
- Jing, X.; Zhu, Y.; Liu, J.; Zhou, H.; Zhao, P.; Liu, X.; Tian, G.; Ye, H.; Li, Q. Intelligent generation method of 3D machining process based on process knowledge. Int. J. Comput. Integr. Manuf. 2019, 33, 38–61. [Google Scholar] [CrossRef]
- Yan, R.; Xia, Z.; Xie, Y.; Wang, X.; Song, Z. Research on Sentiment Classification Algorithms on Online Review. Complexity 2020, 2020, 1–6. [Google Scholar] [CrossRef]
- Sherwani, F.; Ibrahim, B.; Asad, M.M. Hybridized classification algorithms for data classification applications: A review. Egypt. Inform. J. 2021, 22, 185–192. [Google Scholar] [CrossRef]
- Mantas, C.J.; Castellano, J.G.; Moral-García, S.; Abellán, J. A comparison of random forest based algorithms: Random credal random forest versus oblique random forest. Soft Comput. 2018, 23, 10739–10754. [Google Scholar] [CrossRef]
- Chen, Y.; Zheng, W.; Li, W.; Huang, Y. Large group activity security risk assessment and risk early warning based on random forest algorithm. Pattern Recognit. Lett. 2021, 144, 1–5. [Google Scholar] [CrossRef]
- Han, T.; Jiang, D.; Zhao, Q.; Wang, L.; Yin, K. Comparison of random forest, artificial neural networks and support vector machine for intelligent diagnosis of rotating machinery. Trans. Inst. Meas. Control. 2018, 40, 2681–2693. [Google Scholar] [CrossRef]
- Miraki, S.; Zanganeh, S.H.; Chapi, K.; Singh, V.P.; Shirzadi, A.; Shahabi, H.; Pham, B.T. Mapping Groundwater Potential Using a Novel Hybrid Intelligence Approach. Water Resour. Manag. 2019, 33, 281–302. [Google Scholar] [CrossRef]
- Ezugwu, A.E.; Shukla, A.K.; Agbaje, M.B.; Oyelade, O.N.; José-García, A.; Agushaka, J.O. Automatic clustering algorithms: A systematic review and bibliometric analysis of relevant literature. Neural Comput. Appl. 2021, 33, 6247–6306. [Google Scholar] [CrossRef]
- Azhir, E.; Navimipour, N.J.; Hosseinzadeh, M.; Sharifi, A.; Darwesh, A. An efficient automated incremental density-based algorithm for clustering and classification. Futur. Gener. Comput. Syst. 2021, 114, 665–678. [Google Scholar] [CrossRef]
- Luchi, D.; Rodrigues, A.L.; Varejão, F.M. Sampling approaches for applying DBSCAN to large datasets. Pattern Recognit. Lett. 2019, 117, 90–96. [Google Scholar] [CrossRef]
- Mirjalili, S.; Mirjalili, S.M.; Lewis, A. Grey Wolf Optimizer. Adv. Eng. Softw. 2014, 69, 46–61. [Google Scholar] [CrossRef] [Green Version]
- Faris, H.; Aljarah, I.; Al-Betar, M.A.; Mirjalili, S. Grey wolf optimizer: A review of recent variants and applications. Neural Comput. Appl. 2018, 30, 413–435. [Google Scholar] [CrossRef]
- Nguyen, B.H.; Xue, B.; Zhang, M. A survey on swarm intelligence approaches to feature selection in data mining. Swarm Evol. Comput. 2020, 54, 100663. [Google Scholar] [CrossRef]
- Park, J.; Lee, C. Parameter Analysis for the Lateral Thickness of the Coated Layer to Improve Product Quality in Large Area Roll-to-Roll Slot-Die Coating Process. J. Korean Soc. Precis. Eng. 2015, 32, 159–166. [Google Scholar] [CrossRef]
- Bu, H.; Ji, X.; Yuan, X.; Han, Z.; Li, L.; Yan, Z. Calculation of coating consumption quota for ship painting: A CS-GBRT approach. J. Coatings Technol. Res. 2020, 17, 1597–1607. [Google Scholar] [CrossRef]
- Chang, Y.; Liu, C.; Liu, M.; Liu, W.; Liu, Z.; Zhang, H.; Zheng, Y. Differentiation degree combination weighting method for investment decision-making risk assessment in power grid construction projects. Glob. Energy Interconnect. 2019, 2, 465–477. [Google Scholar] [CrossRef]
- Liu, W.; Hui, L.; Lu, Y.; Tang, J. Developing an evaluation method for SCADA-Controlled urban gas infrastructure hierarchical design using multi-level fuzzy comprehensive evaluation. Int. J. Crit. Infrastruct. Prot. 2020, 30, 100375. [Google Scholar] [CrossRef]
- Li, H.; Huang, J.; Hu, Y.; Wang, S.; Liu, J.; Yang, L. A new TMY generation method based on the entropy-based TOPSIS theory for different climatic zones in China. Energy 2021, 231, 120723. [Google Scholar] [CrossRef]
- Liu, Z.-C.; Wang, C.; Bi, R.-T.; Zhu, H.-F.; He, P.; Jing, Y.-D.; Yang, W.-D. Winter wheat yield estimation based on assimilated Sentinel-2 images with the CERES-Wheat model. J. Integr. Agric. 2021, 20, 1958–1968. [Google Scholar] [CrossRef]
- Kim, J.-H.; Choi, J.-H.; Yoo, K.-H.; Loh, W.-K.; Nasridinov, A. A Fast Algorithm for Identifying Density-Based Clustering Structures Using a Constraint Graph. Electronics 2019, 8, 1094. [Google Scholar] [CrossRef] [Green Version]
- Rad, M.H.; Abdolrazzagh-Nezhad, M. A new hybridization of DBSCAN and fuzzy earthworm optimization algorithm for data cube clustering. Soft Comput. 2020, 24, 15529–15549. [Google Scholar] [CrossRef]
- Jiang, H.; Li, J.; Yi, S.; Wang, X.; Hu, X. A new hybrid method based on partitioning-based DBSCAN and ant clustering. Expert Syst. Appl. 2011, 38, 9373–9381. [Google Scholar] [CrossRef]
- An, Z.; Song, L. Research on the role of AHP- entropy method in the identification and evaluation of China tariff source risk. J. Intell. Fuzzy Syst. 2018, 34, 1053–1060. [Google Scholar] [CrossRef]
- Zimmermann, C.A.; Koslowski, L.A.D.; Araújo, M.I.S.; Silveira, M.L.L. The influence of soluble salts content on the performance of an epoxy coating system via accelerated corrosion tests. Matéria 2020, 25, 1048. [Google Scholar] [CrossRef]
Figure 1.
The principle of RF.

Figure 2.
Algorithm flow of clustering model based on IDBSCAN.
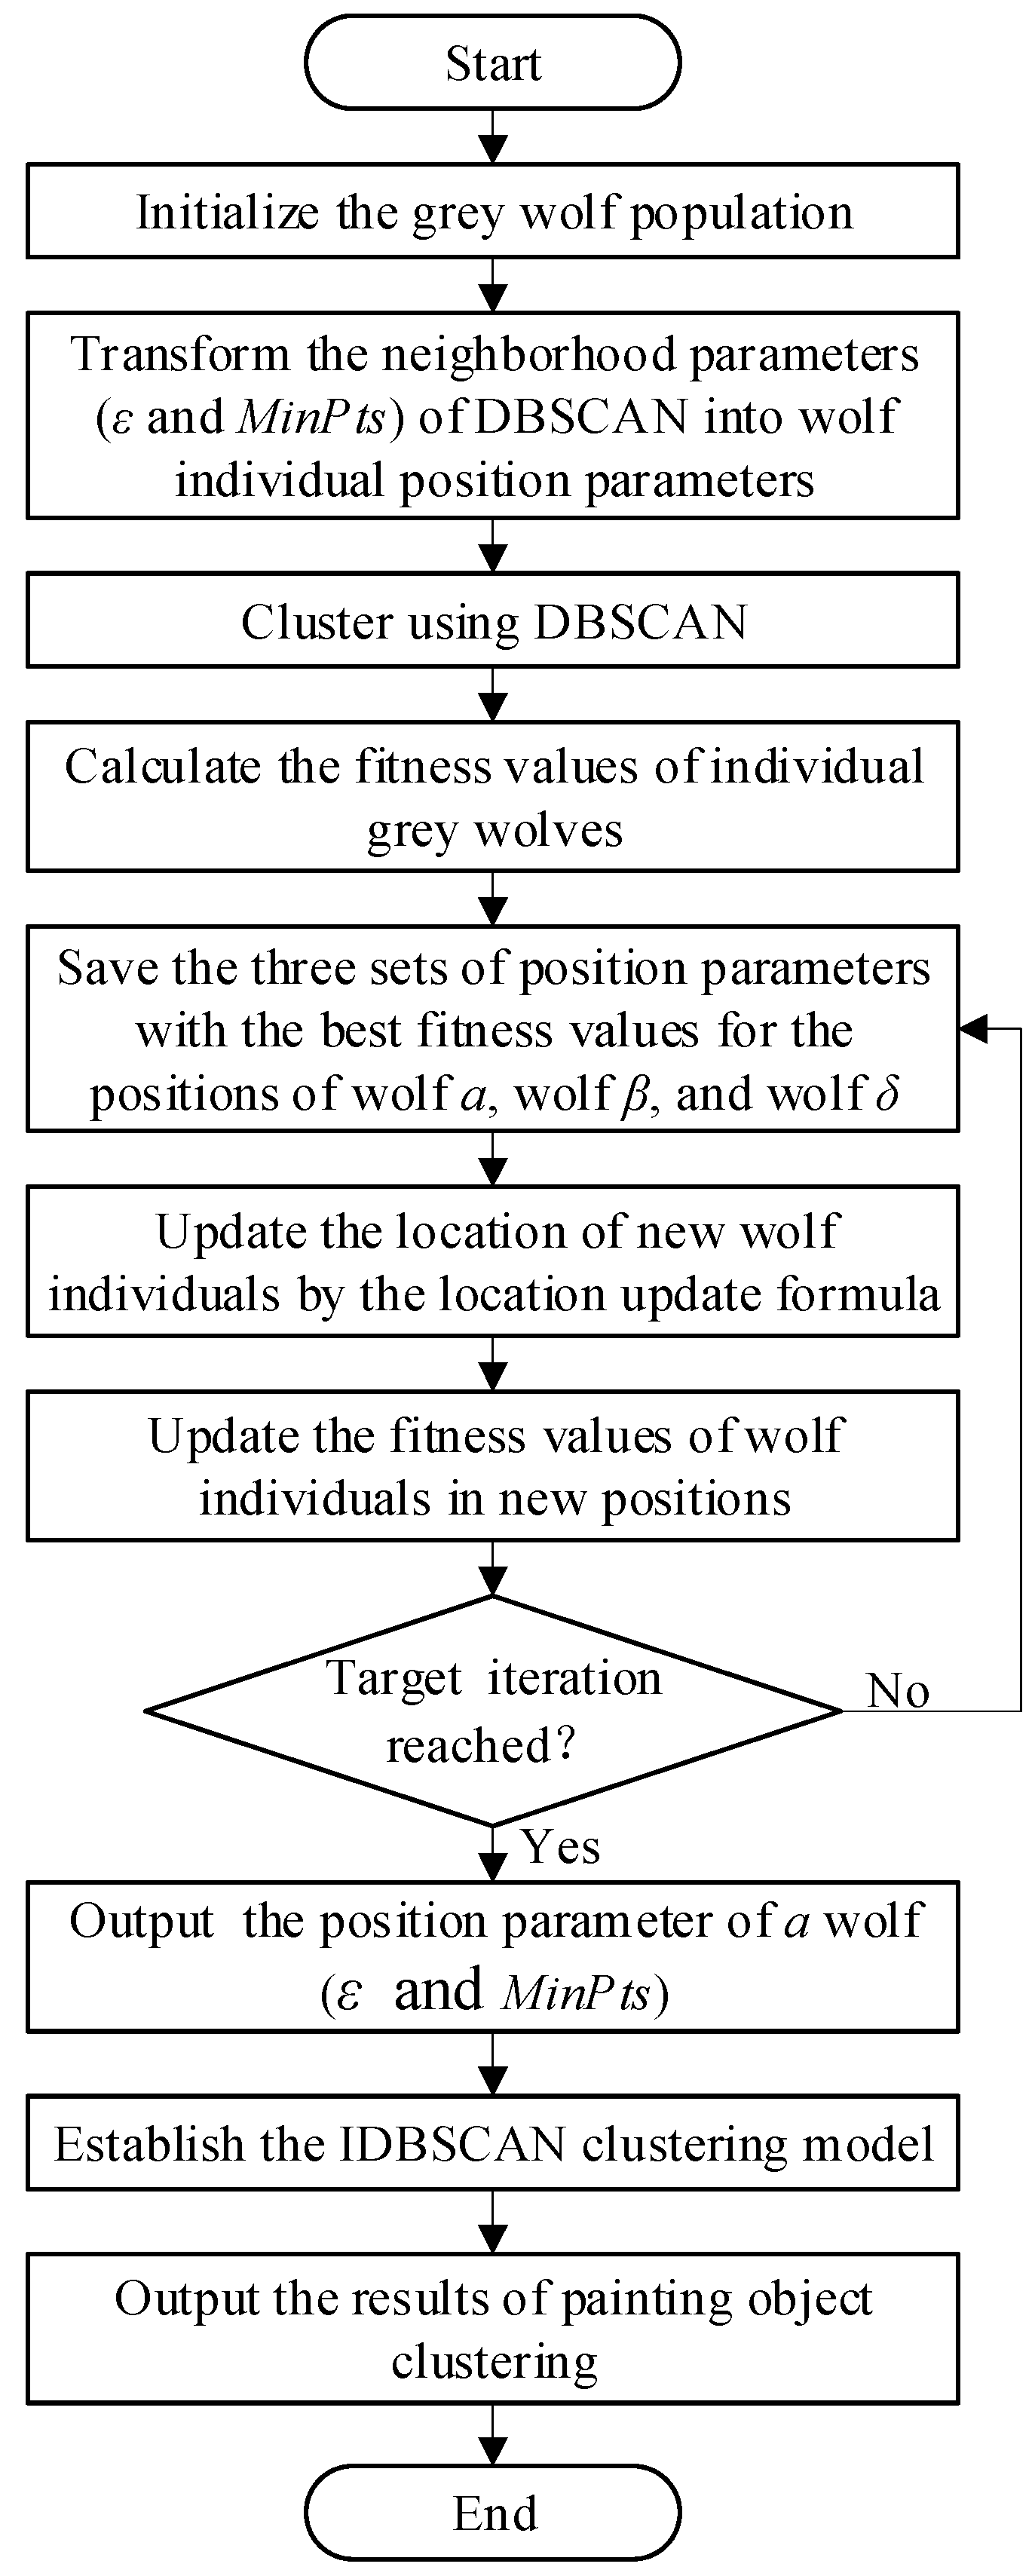
Figure 3.
Flow of painting object classification.

Figure 4.
Location of the outer plate above the waterline.
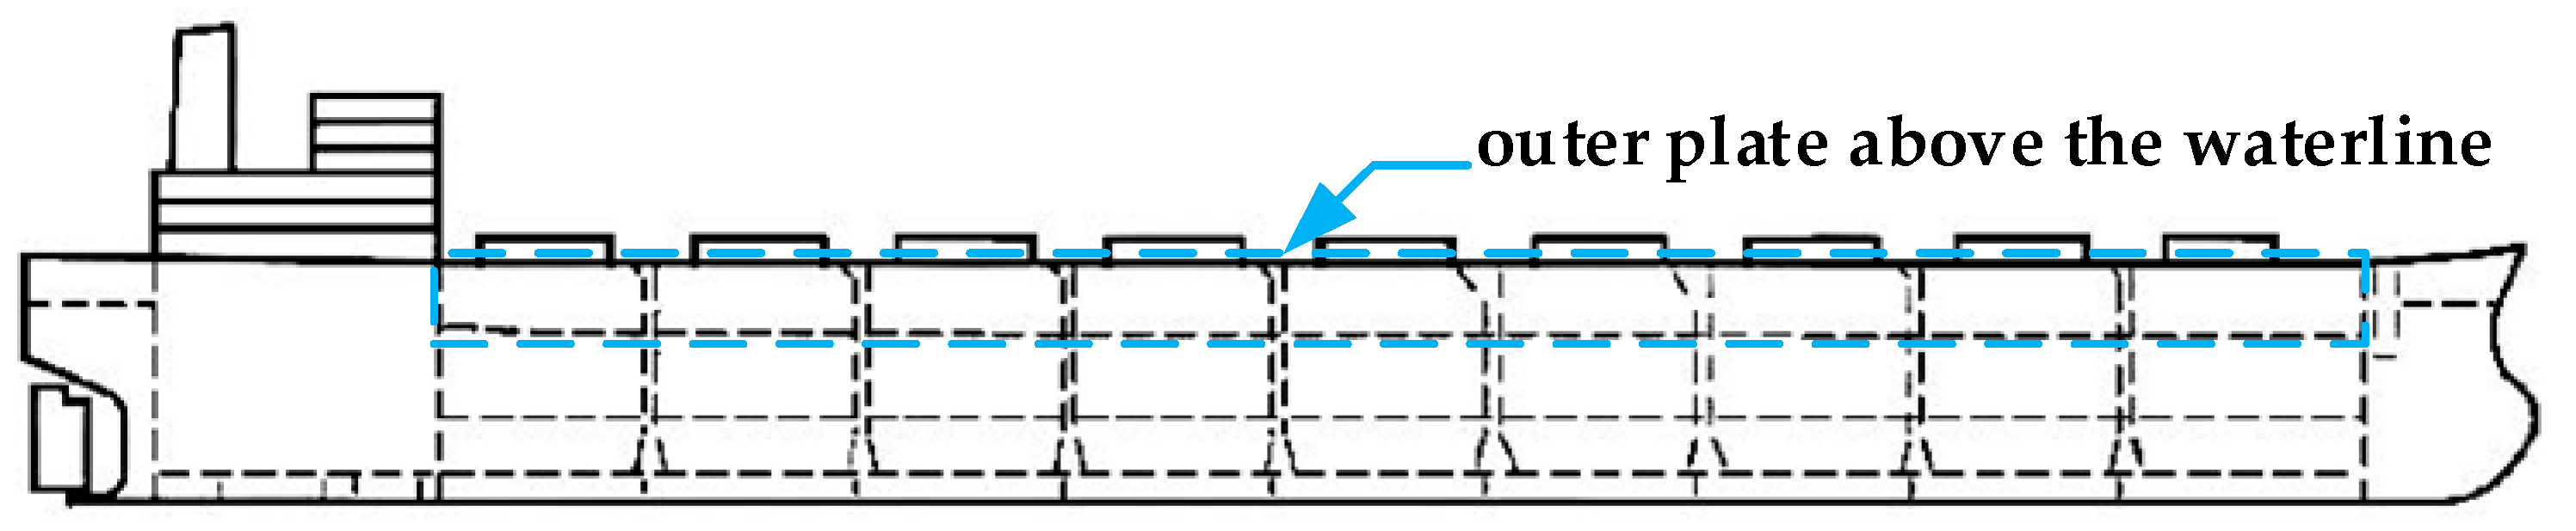
Figure 5.
Optimization of the number of decision trees .
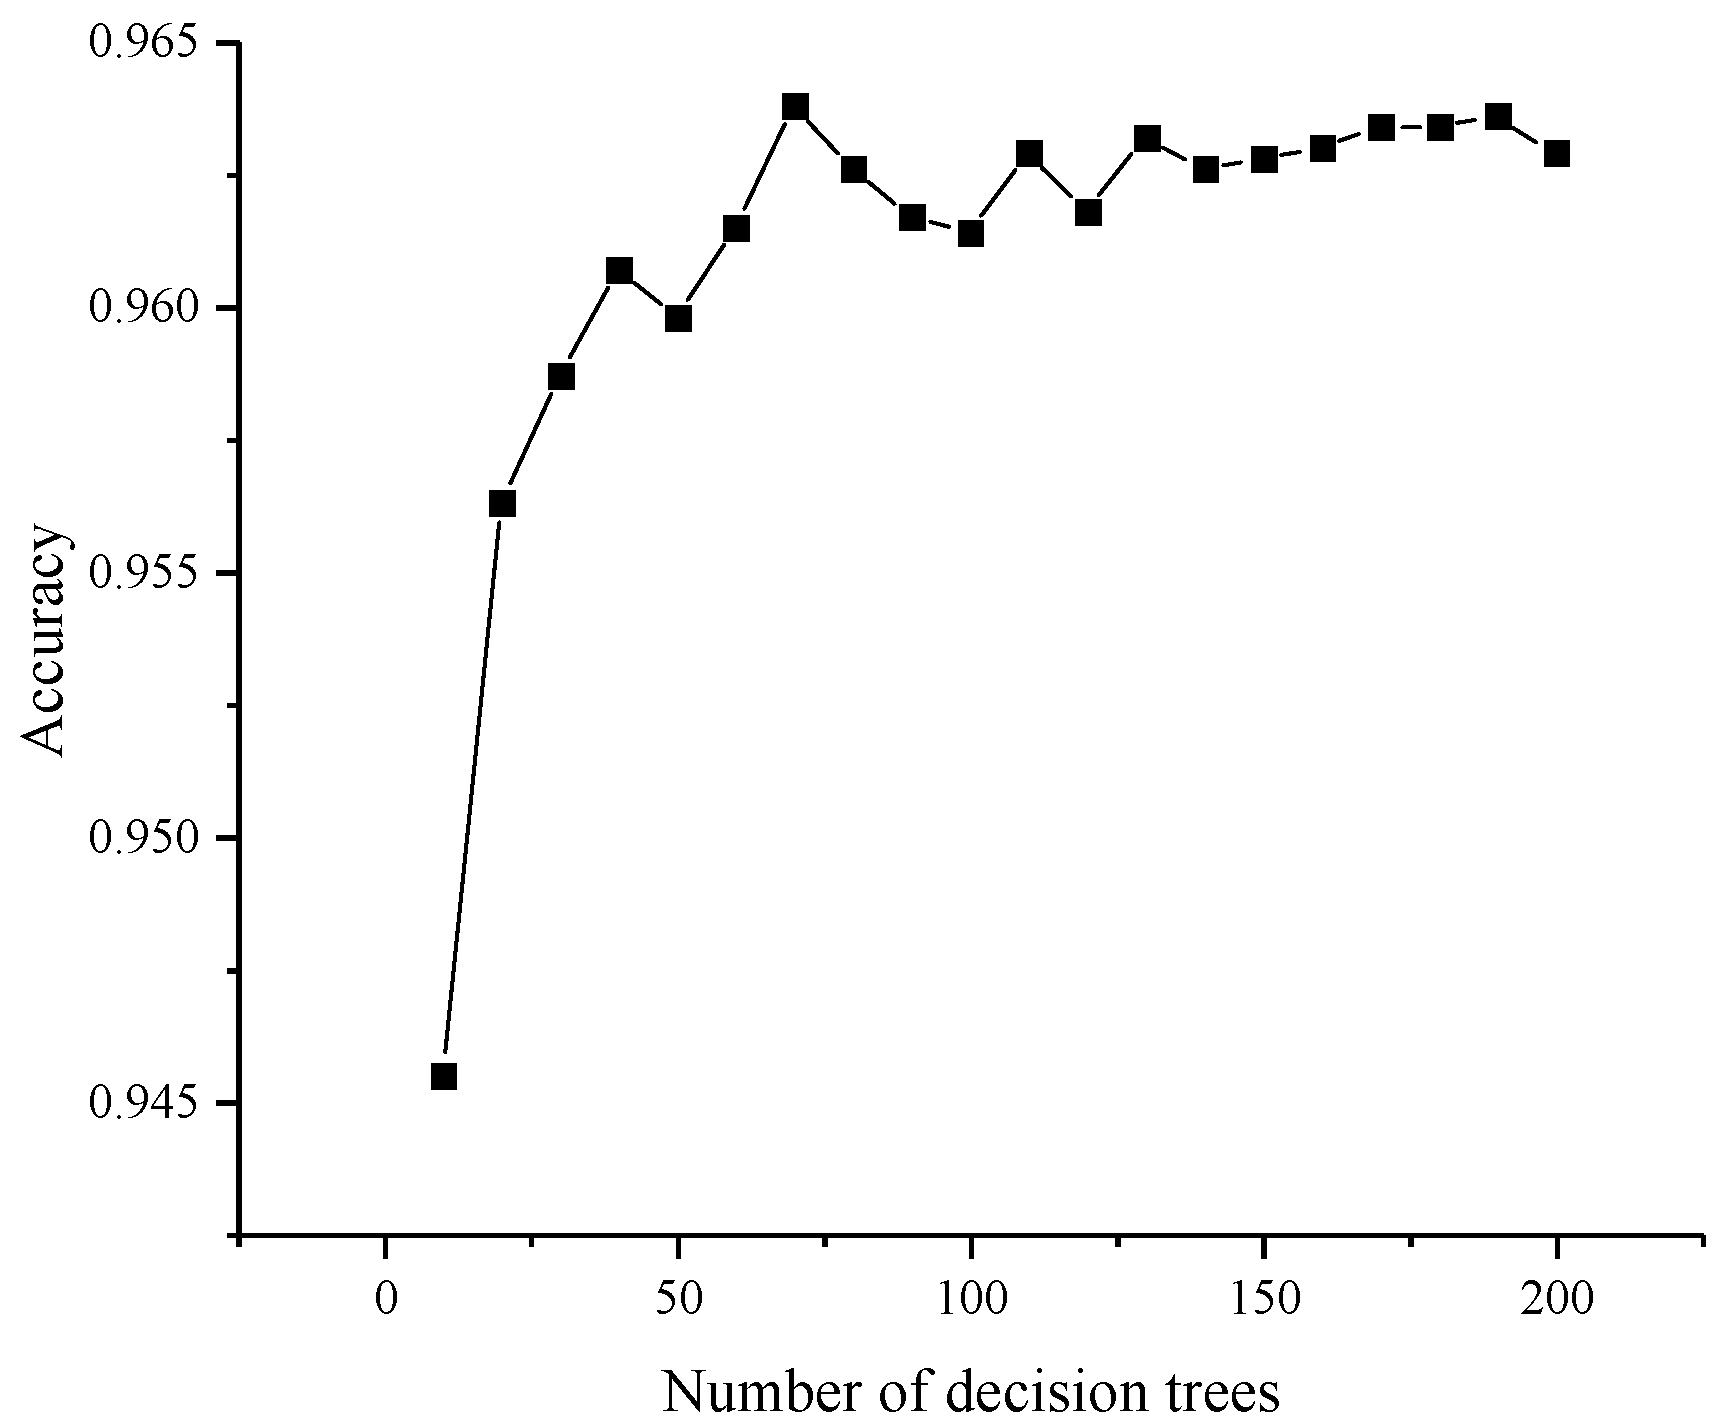
Figure 6.
Optimization of decision tree depth.
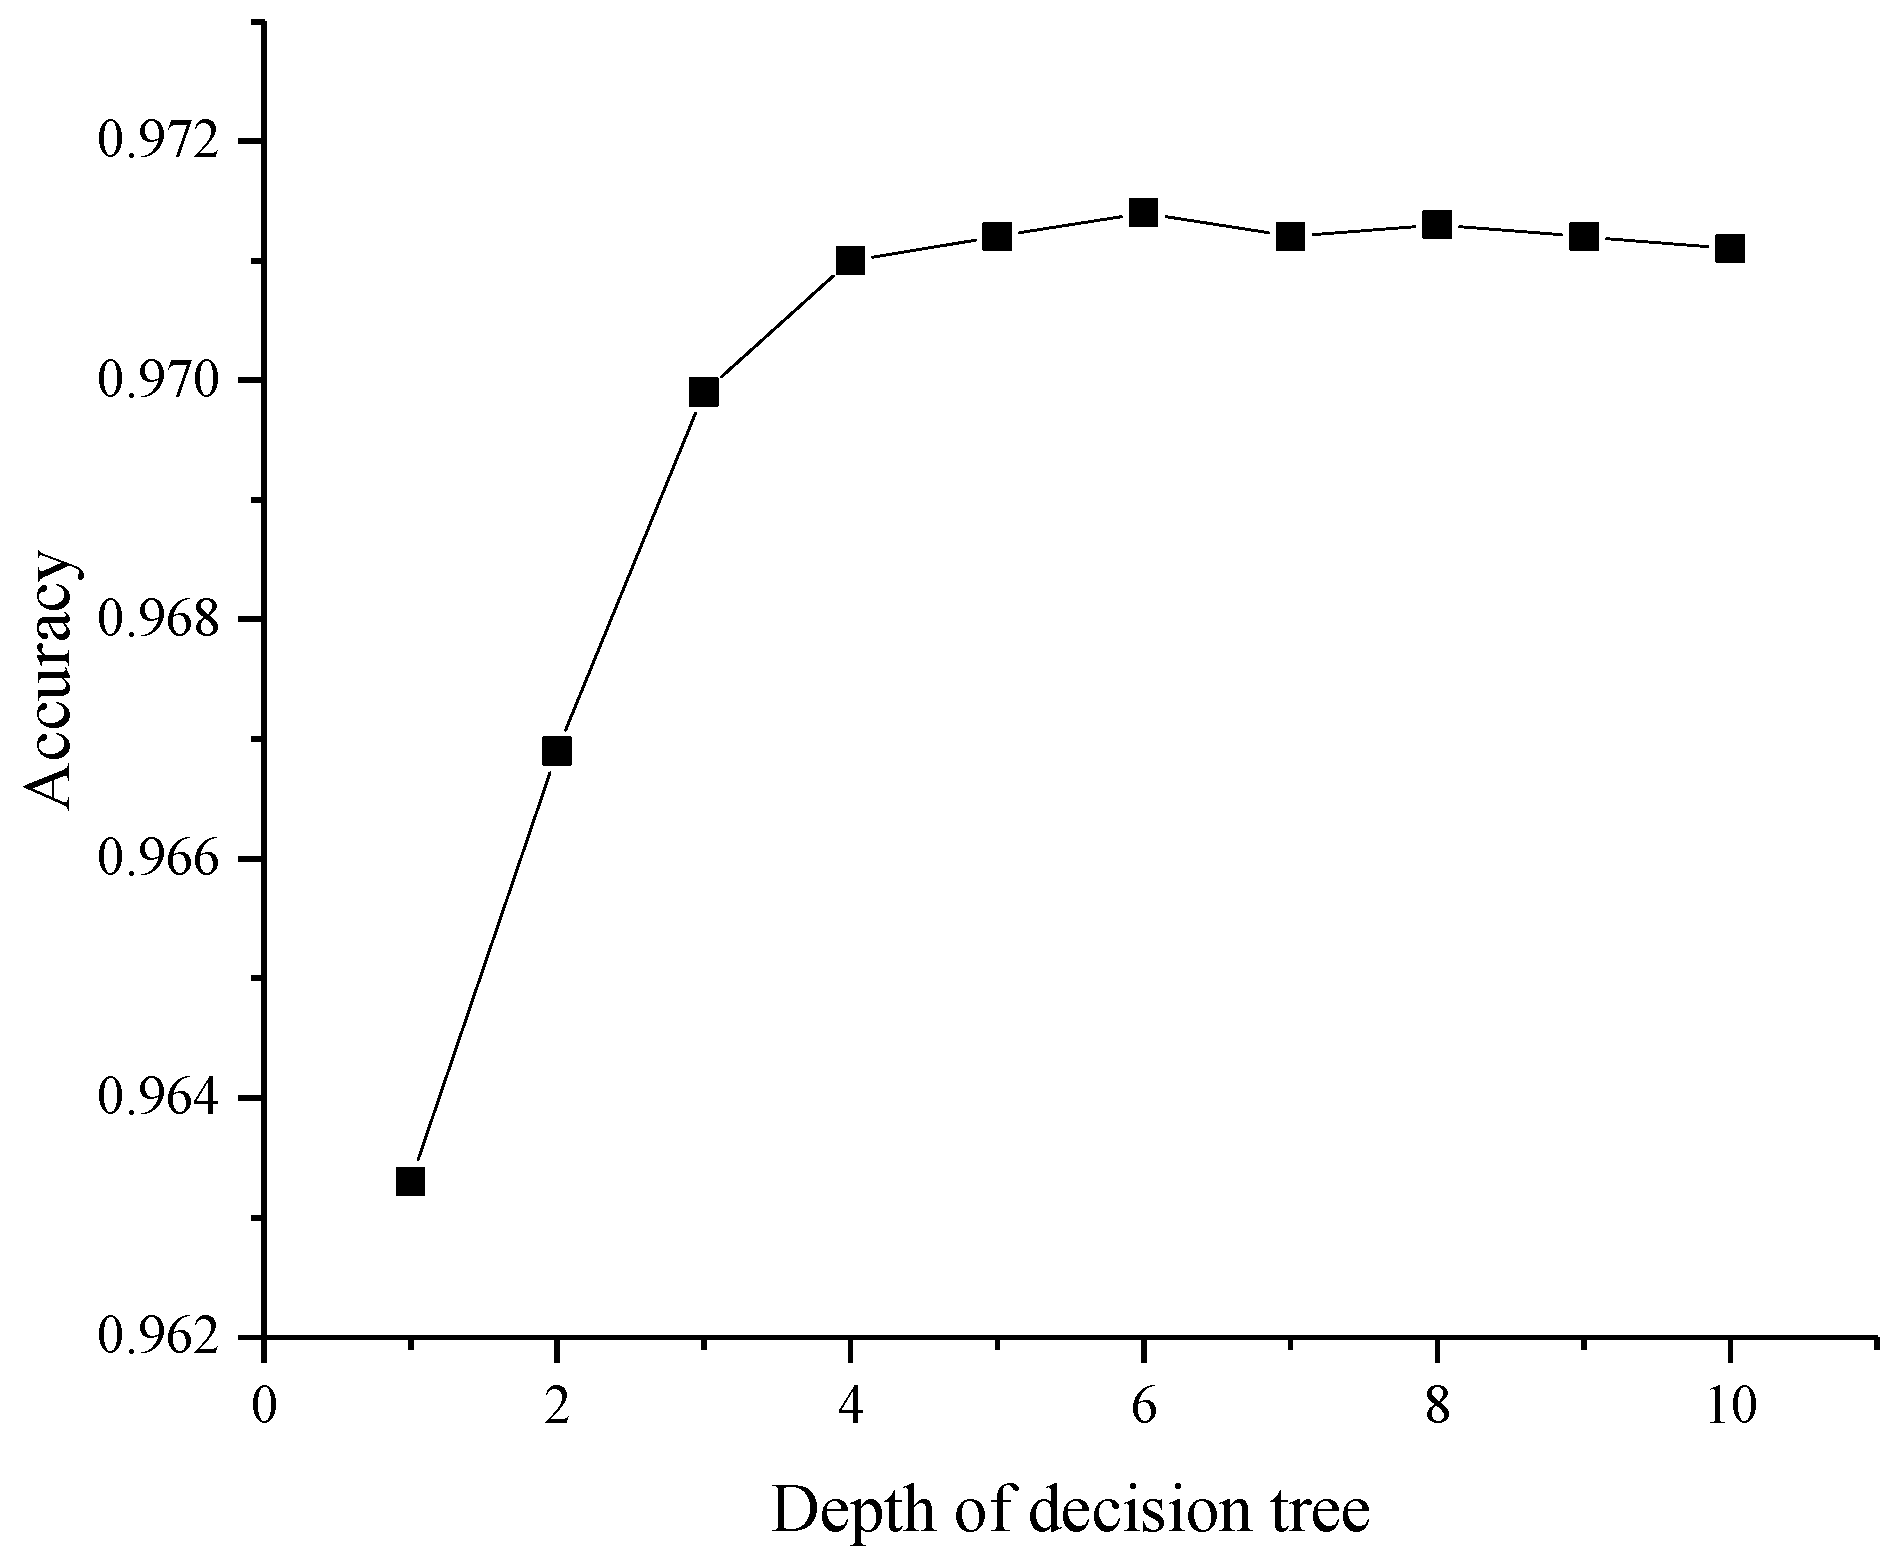
Figure 7.
Painting operation by side suspension painting robot.
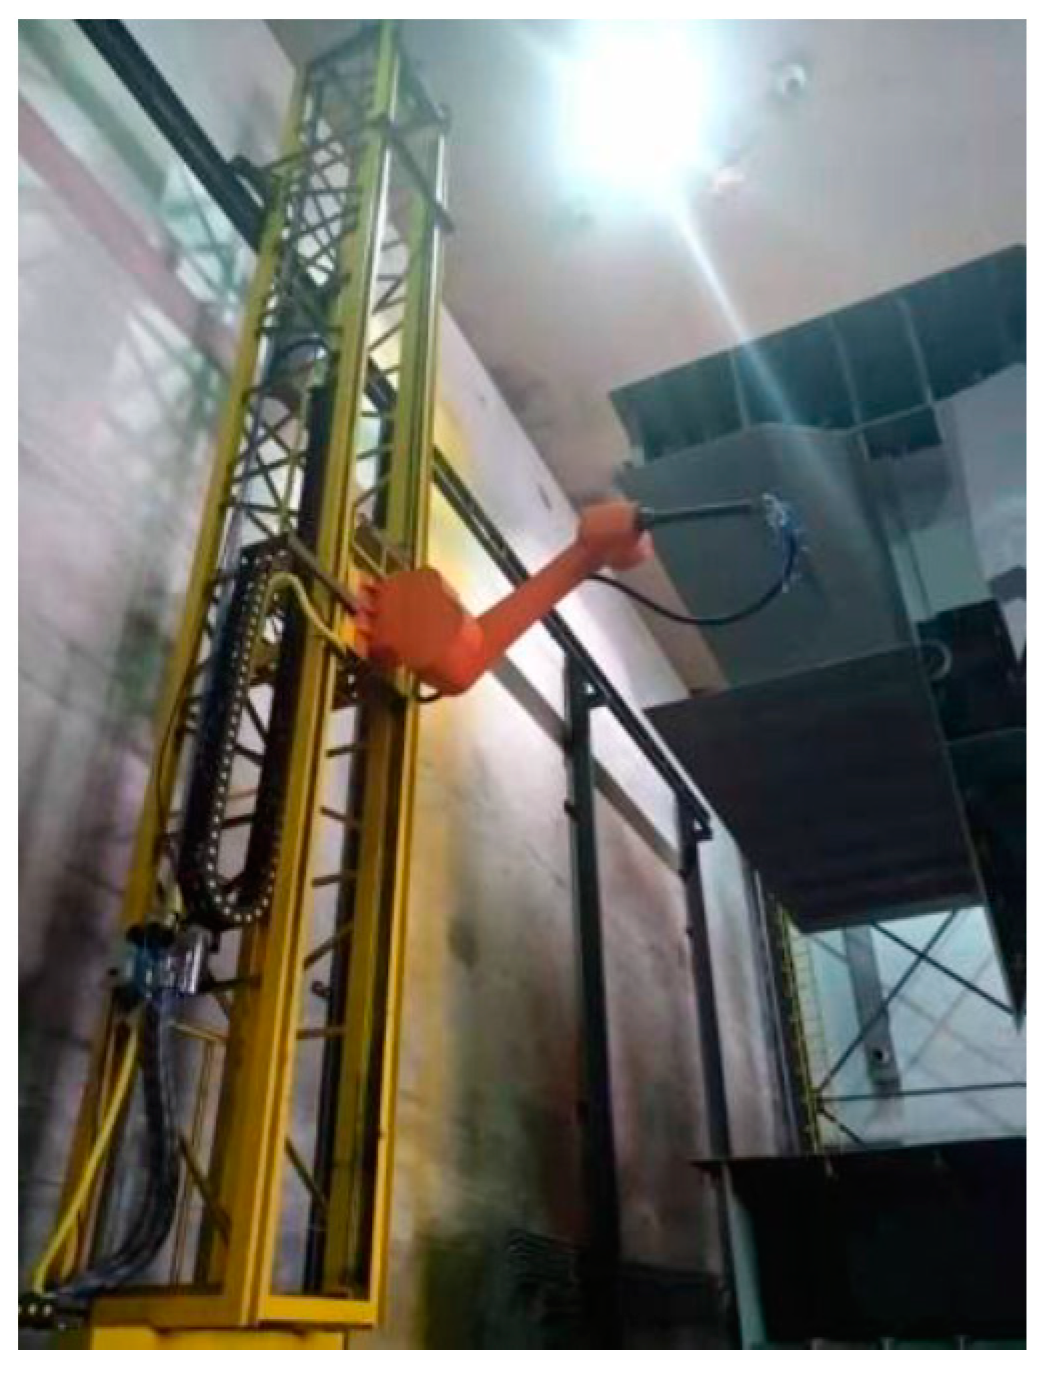
Figure 8.
Measurement results of dry film thickness.

Table 1.
Average random consistency index.
| Order of Matrix | 1 | 2 | 3 | 4 | 5 | 6 | 7 | 8 | 9 |
|---|---|---|---|---|---|---|---|---|---|
| RI | 0.00 | 0.00 | 0.58 | 0.90 | 1.12 | 1.24 | 1.32 | 1.41 | 1.45 |
Table 2.
Coating matching used for outer plate above the waterline.
| Coating Name | Matching System | Paint Color | Thickness of Dry Film/µm | Solid Content/% | Minimum Painting Interval/h | Maximum Painting Interval/d |
|---|---|---|---|---|---|---|
| Priming paint | Modified epoxy paint | Aluminium red | 200 | 75 | 4 | 30 |
| Intermediate paint | Modified epoxy paint | Grey | 200 | 75 | 4 | 14 |
| Finishing paint | Polyurethane resin paint | White | 100 | 63 | 7 | 14 |
Table 3.
Feature attributes of the painting object.
| Feature No. | Feature Name | Explanation |
|---|---|---|
| F1 | Material | 1 indicates carbon steel, 2 indicates low-alloy high strength steel, 3 indicates heat-resistant steel, 4 indicates corrosion-resistant steel, 5 indicates low-temperature steel, 6 indicates aluminum alloy, 7 indicates copper, 8 indicates titanate |
| F2 | Plate shape | 1 indicates straight board, 2 indicates bent plate, 3 indicates irregular slab |
| F3 | Painting area | 1 indicates the bottom area, 2 indicates the water-line area, 3 indicates the atmospheric exposure area, 4 indicates the liquid tank area, 5 indicates the cabin area and pump room area, 6 indicates the living cabin area |
| F4 | Surface roughness | Unit is µm |
| F5 | Painting area | Unit is m2 |
| F6 | Derusting grade | 1 indicates Sa1, 2 indicates Sa2, 3 indicates Sa2.5, 4 indicates Sa3, 5 indicates St2, 6 indicates St3 |
| F7 | Paint type | 1 indicates conventional paint, 2 indicates bituminous paint, 3 indicates pure epoxy paint, 4 indicates epoxy bituminous paint, 5 indicates vinyl asphalt paint, 6 indicates polyurethane paint, 7 indicates inorganic zinc silicate paint, 8 indicates self-polishing paint, 9 indicates bleached epoxy asphalt paint, 10 indicates modified epoxy paint |
| F8 | Paint color | 1 indicates aluminum red, 2 indicates grey, 3 indicates yellow, 4 indicates dark red, 5 indicates white, 6 indicates medium green, 7 indicates black, 8 indicates brown... |
| F9 | Solid content | Unit is % |
| F10 | Thickness of dry film | Unit is µm |
| F11 | Minimum painting interval | Unit is h |
| F12 | Maximum painting interval | Unit is d |
Table 4.
Comparison of clustering performance.
| Model Name | DBI | SI |
|---|---|---|
| DBSCAN | 1.9275 | −0.431 |
| OPTICS | 1.9097 | −0.439 |
| PAPC-DBSCAN | 1.8806 | −0.443 |
| IDBSCAN | 1.8743 | −0.445 |
Table 5.
Feature value of the object to be painted.
| Painting Area | Surface Roughness/µm | Painting Area/m2 | Solid Content/% | Thickness of Dry Film/µm |
|---|---|---|---|---|
| Water-line area | 25 | 183 | 75 | 200 |
Table 6.
Set of similar painting objects (partial).
| No. | Name of the Painting Object | Painting Area | Surface Roughness/µm | Painting Area/m2 | Solid Content/% | Thickness of Dry Film/µm |
|---|---|---|---|---|---|---|
| 1 | Outer plate above the waterline 1 | Water-line area | 30 | 196 | 62 | 200 |
| 2 | Outer plate above the waterline 2 | Water-line area | 25 | 312 | 75 | 233 |
| 3 | Outer plate inside the bowsprit 1 | Water-line area | 30 | 286 | 75 | 200 |
| 4 | Outer plate inside the bowsprit 2 | Water-line area | 20 | 156 | 58 | 204 |
| 5 | Outer plate inside the bowsprit 3 | Water-line area | 25 | 168 | 75 | 230 |
| 6 | Open-air exterior plate 1 | Atmospheric exposure area | 30 | 175 | 68 | 205 |
| ⋮ | ⋮ | ⋮ | ⋮ | ⋮ | ⋮ | ⋮ |
Table 7.
Painting process cases (partial).
| No. | Equipment Name | Nozzle Diameter/mm | Nozzle Number | Travelling Speed/(mm/min) | Air Pressure/Mpa | Paint Spraying Pressure/Mpa | Construction Temperature/ | Rating Dry Film Thickness/μm | Rating Dosage/L | Dosage Used for Initial Application/L | Dosage Used for Touch-up Operation/L | Rating Painting Man-Hour/h | Actual Painting Man-Hour/h | Auxiliary Preparation Time/h | MAKE-up Man-Hour/h |
|---|---|---|---|---|---|---|---|---|---|---|---|---|---|---|---|
| 1 | Side suspension painting robot | 0.45 | 1 | 180 | 0.5 | 16 | 23 | 200 | 13.8 | 14.6 | 1.6 | 2.35 | 2.25 | 0.2 | 0.3 |
| 2 | Rail painting robot | 0.65 | 2 | 160 | 0.5 | 16 | 23 | 233 | 12.5 | 13 | 0.5 | 3 | 0.8 | 0.3 | 0.2 |
| 3 | High-pressure airless sprayer | 0.5 | 2 | 220 | 0.5 | 16 | 23 | 200 | 7.6 | 8.2 | 0.8 | 2 | 2.26 | 0.25 | 0.2 |
| 4 | Internal rail painting robot | 0.5 | 2 | 200 | 0.5 | 16 | 23 | 204 | 10.8 | 11.1 | 0.6 | 2.25 | 2.5 | 0.15 | 0.15 |
| 5 | Side suspension painting robot | 0.6 | 1 | 200 | 0.5 | 16 | 23 | 230 | 14.5 | 14.3 | 1.2 | 2.5 | 2.55 | 0.2 | 0.4 |
| 6 | Side suspension painting robot | 0.55 | 1 | 180 | 0.5 | 16 | 23 | 205 | 12.8 | 13 | 0.7 | 2.4 | 2.45 | 0.2 | 0.35 |
| ⋮ | ⋮ | ⋮ | ⋮ | ⋮ | ⋮ | ⋮ | ⋮ | ⋮ | ⋮ | ⋮ | ⋮ | ⋮ | ⋮ | ⋮ | ⋮ |
Table 8.
Evaluation index weights based on AHP.
| B1 | B2 | B3 | Consistency Test | |
|---|---|---|---|---|
| B1 | 1 | 3 | 2 | = 3.0092 |
| B2 | 1/3 | 1 | 1/2 | = 0.0046 |
| B3 | 1/2 | 2 | 1 | = 0.0079 < 0.1 |
Table 9.
Evaluation index weights based on entropy method.
| dj | µj | |
|---|---|---|
| B1 | 0.291 | 0.3862 |
| B2 | 0.199 | 0.2641 |
| B3 | 0.2635 | 0.3497 |
Table 10.
Multi-objective evaluation value of the painting processes (partial).
| No. | YH | YV | YT | Yeval |
|---|---|---|---|---|
| 1 | 3.956 | 5.75 | 5.875 | 4.736 |
| 2 | 6.864 | 12.5 | 10 | 8.467 |
| 3 | 5.635 | 5.429 | 2.817 | 4.786 |
| 4 | 9.652 | 12 | 4.091 | 8.311 |
| 5 | 19.413 | 14.5 | 3.846 | 14.262 |
| 6 | 12.307 | 14.222 | 4 | 10.11 |
| ⋮ | ⋮ | ⋮ | ⋮ | ⋮ |
Table 11.
Optimal painting parameters.
| Equipment Name | Gun Type | Nozzle Type | Nozzle Diameter /mm | Nozzle Number | Paint Spraying Pressure /mpa | Air Pressure /Mpa | Travelling Speed /(mm/min) | Gun Height /mm | Construction Temperature /°C |
|---|---|---|---|---|---|---|---|---|---|
| Side suspension painting robot | Chang Jiang Y | YCK | 0.65 | 1 | 16 | 0.5 | 200 | 450 | 23 |
Table 12.
Distribution of dry film thickness.
 |
Publisher’s Note: MDPI stays neutral with regard to jurisdictional claims in published maps and institutional affiliations. |
© 2021 by the authors. Licensee MDPI, Basel, Switzerland. This article is an open access article distributed under the terms and conditions of the Creative Commons Attribution (CC BY) license (https://creativecommons.org/licenses/by/4.0/).
Share and Cite
MDPI and ACS Style
Bu, H.; Yuan, X.; Niu, J.; Yu, W.; Ji, X.; Lyu, H.; Zhou, H. Ship Painting Process Design Based on IDBSACN-RF. Coatings 2021, 11, 1458. https://doi.org/10.3390/coatings11121458
AMA Style
Bu H, Yuan X, Niu J, Yu W, Ji X, Lyu H, Zhou H. Ship Painting Process Design Based on IDBSACN-RF. Coatings. 2021; 11(12):1458. https://doi.org/10.3390/coatings11121458
Chicago/Turabian StyleBu, Henan, Xin Yuan, Jianmin Niu, Wenjuan Yu, Xingyu Ji, Hongyu Lyu, and Honggen Zhou. 2021. "Ship Painting Process Design Based on IDBSACN-RF" Coatings 11, no. 12: 1458. https://doi.org/10.3390/coatings11121458
Note that from the first issue of 2016, this journal uses article numbers instead of page numbers. See further details here.