Electronic and Thermoelectric Properties of V2O5, MgV2O5, and CaV2O5


1
School of Materials Science and Engineering, Hubei University of Automotive Technology, Shiyan 442002, China
2
Institute of Functional Nano & Soft Materials (FUNSOM), Jiangsu Key Laboratory for Carbon-Based Functional Materials & Devices, Soochow University, 199 Ren’ai Road, Suzhou 215123, China
3
Key Laboratory of Organic Synthesis of Jiangsu Province and the State and Local Joint Engineering Laboratory for Novel Functional Polymeric Materials, College of Chemistry, Chemical Engineering and Materials Science, Soochow University, Suzhou 215123, China
4
Department of Materials Science and Engineering, KTH Royal Institute of Technology, SE-100 44 Stockholm, Sweden
*
Author to whom correspondence should be addressed.
Coatings 2020, 10(5), 453; https://doi.org/10.3390/coatings10050453
Submission received: 15 April 2020
/
Revised: 6 May 2020
/
Accepted: 6 May 2020
/
Published: 7 May 2020
(This article belongs to the Special Issue Micro- and Nanoscale Surface Engineering for Thermal Transport and Harvesting)
Abstract
:Developing new thermoelectric materials with high performance can broaden the thermoelectric family and is the key to fulfill extreme condition applications. In this work, we proposed two new high-temperature thermoelectric materials—MgV2O5 and CaV2O5—which are derived from the interface engineered V2O5. The electronic and thermoelectric properties of V2O5, MgV2O5, and CaV2O5 were calculated based on first principles and Boltzmann semi-classical transport equations. It was found that although V2O5 possessed a large Seebeck coefficient, its large band gap strongly limited the electrical conductivity, hence hindering it from being good thermoelectric material. With the intercalation of Mg and Ca atoms into the van der Waals interfaces of V2O5, i.e., forming MgV2O5 and CaV2O5, the electronic band gaps could be dramatically reduced down to below 0.1 eV, which is beneficial for electrical conductivity. In MgV2O5 and CaV2O5, the Seebeck coefficient was not largely affected compared to V2O5. Consequently, the thermoelectric figure of merit was expected to be improved noticeably. Moreover, the intercalation of Mg and Ca atoms into the V2O5 van der Waals interfaces enhanced the anisotropic transport and thus provided a possible way for further engineering of their thermoelectric performance by nanostructuring. Our work provided theoretical guidelines for the improvement of thermoelectric performance in layered oxide materials.
1. Introduction
Due to the limited Carnot efficiency, most of the world’s input energy has been wasted, and the major part of the wasted energy is in the form of heat. As a result, harvesting wasted heat energy is a promising strategy for solving the global energy problem. Thermoelectric (TE) materials, which can convert heat energy into electricity and vice versa, have received wide attention in the past two decades due to their potential applications in energy harvesting [1,2,3]. By applying the TE devices, waste heat originating from various sources, such as factories, home cooking, automobiles, etc., can be converted to electrical powers. On the contrary, solid-state refrigeration devices can be made with TE materials, which is much more environmentally friendly compared to conventional refrigeration systems. The efficiency of TE materials is characterized in terms of the dimensionless figure of merit ZT, defined as , where T, S, σ are the absolute temperature, the Seebeck coefficient, and the electrical conductivity, respectively. κe and κl are thermal conductivity of electrons and phonons, respectively. During the last decade, significant progress on TE materials has been achieved with ZT larger than 1 [4]. For example, the ZT of the binary material SnSe can reach beyond 2 at the temperatures higher than 700 K [5,6]. By using a high-density 2-dimensional electron gas confined within a unit cell thick layer in SrTiO3, Ohta et al. [7] obtained ZT ~ 2.4 at room temperature. ZT value of 1.48 at 705 K was achieved in a binary crystalline n-type In4Se3−δ by Rhyee et al. [8]. Using a low-temperature growth process, the p-type Bi2Te3/Sb2Te3 superlattice device is fabricated, and a ZT value of 2.4 is observed at room temperature [9]. With the doping of LiI or codoping of Ga and Sb, Srinivasan et al. achieved significant improvement of ZT in GeTe, and a maximum ZT of ~2.0 was realized [10,11]. Besides the above materials, an excellent figure of merit has also been obtained in half-heusler compounds [12,13] and caged materials [14,15,16]. Currently, most of the achievements have been done in small scales (such as superlattices, nanostructures), which is still difficult for large scale synthesis. Although the performance of TE materials has been improved dramatically in the past decade, the efficiency is still far below the Carnot limit, and there is still a large space for improvement. Moreover, the application field of TE materials can be very different, from low temperatures to ultrahigh temperatures or in some other severe conditions. Thus, it is essential to find new TE materials with high ZT values to broaden the TE families so that they can fulfill different application requirements.
Due to the strong chemical bonding, oxide materials are known to have good thermal stabilities at high temperatures. Besides, they are also known for their wide availability and property tunability. Oxide materials have been studied for high temperature (>900 K) TE materials. The high operating temperature ensures a high Carnot efficiency. In complex structured oxides, it is easier to achieve the phonon glass-electron crystal paradigm [4,17,18,19]. Thus, the electron and phonon transport can be optimized separately in the corresponding building module. Divanadium pentoxide (V2O5) and its corresponding compounds have attracted numerous studies in recent decades because of their important applications in modern science. For example, at about 275 °C, V2O5 undergoes an insulator-metal transition, which makes it a candidate of a critical temperature sensor, optical switching, light detector, and so on [20,21]. Because of the layered structure and the rechargeable high energy densities and capacities, V2O5 is also a promising candidate for active cathode material in thin-film intercalation batteries [22,23]. More importantly, V2O5 thin film has been found to be a TE material with a relatively high Seebeck coefficient [24,25]. However, due to the large electronic band gap, the electrical conductivity for pure V2O5 is very low (~4 × 10⁻² S/m), which limits its ZT value. To improve the TE performance, Iwanaga et al. [24] fabricated β-NaxV2O5 and found that by increasing the concentration of Na, the electrical conductivity could be increased by a factor of up to ~104, whereas the Seebeck coefficient decreased only by a half. Using the vapor deposition technique, Ferreira et al. [26,27] deposited V2O5 into thin films and found that the Seebeck coefficient could reach up to 690 μV/K. They further fabricated nanostructured p-type CrV2O5 thin films with the dramatical improvement of electrical conductivity compared to pure V2O5, and eventually, a ZT value of 0.16 was achieved at room temperature [28]. The promising figure of merit obtained in CrV2O5 indicates that it is possible to improve the TE performance of V2O5 by intercalating other elements into the van der Waals interfaces. To broaden the TE family based on V2O5, in this paper, we chose magnesium and calcium elements to intercalate into the van der Waals interfaces in V2O5. The engineered van der Waals interfaces in MgV2O5 and CaV2O5 not only improved the charge transportation but also introduced scattering centers for phonons. Thus, it was possible to improve the TE performance of V2O5. These two compounds have very low thermal conductivities (both lower than 2 Wm−1·K−1 at room temperature) [29], which is also beneficial for achieving high ZT.
The crystal structures of V2O5, MgV2O5, and CaV2O5 are presented in Figure 1. All the compounds are orthorhombic structure with a space group of Pmmn [30], Cmcm [31], and Pmmn [32], respectively. There are 4 vanadium atoms and 10 oxygen atoms in the primitive cell of V2O5, which corresponds to two formula units. The structure of V2O5 can be regarded as a series of layers perpendicular to (001) direction with weak interaction (mainly van der Waals) between layers. Each layer consists of a periodic edge- and corner-sharing distorted VO5 square pyramids, where pyramids sharing an edge have an opposite orientation in the c direction, while corner-sharing pyramids have the same orientation. The O atoms can be classified into three types with the notation of O1, O2, and O3, respectively. O1 forms a double bond with a vanadium atom, which is almost perpendicular to the (001) plane. O2 is the bridge, which connects two adjacent vanadium atoms, while O3 is three-fold coordinated oxygen. As V2O5 is a layer structure, the weakly interacted interface plays an important role in determining its properties. More importantly, it can be intercalated with other atoms and form different compounds. As a result, the properties of V2O5 can be tuned by the van der Waals interface engineering. With the intercalation of Ca/Mg atoms between layers, new compounds—CaV2O5 and MgV2O5—can be formed. The crystal structures of CaV2O5 and MgV2O5 don’t change compared to that of V2O5 but with an increased puckering of the layers (more distorted VO5 pyramids). In each unit cell of V2O5, the Ca/Mg atoms are located between the layers and are surrounded by eight O atoms. For the compound MgV2O5, the layers are more puckered than that in CaV2O5. Besides, one slab over two is shifted by half a unit cell parameter alone the b direction in MgV2O5, leading to the doubling of the c parameter [33].
The electronic properties of V2O5 have been studied by density functional theory (DFT) by previous researchers. The early DFT calculations on V2O5 have mostly focused on pure LDA (Local Density Approximation) or GGA (Generalized Gradient Approximation) method [34,35,36,37]. However, due to the layered structure of V2O5 along the c direction, the interaction between layers is mainly ascribed to the weak van der Waals (vdW) forces. As a result, the normal LDA and GGA methods usually overestimate the c parameter. Later on, the Hubbard term U was added to the orbitals of vanadium atoms, and/or the dispersion correction method was taken into account in the normal DFT method [36,38,39,40]. It has been reported that the inclusion of U and/or dispersion correction can largely improve the c lattice parameter. For example, by applying the vdW-DF method to various exchange-correlation functionals, Londero et al. [39] found the agreement between predicted interlayer distances, with largely improved experimental values in V2O5. Jovanovic et al. [40] found that the PBE + U + D2 method could accurately reproduce the experimental lattice structure and band gap of V2O5.
2. Methods
The electronic properties were calculated with the periodic DFT code ABINIT [41,42], where the projector-augmented wave (PAW) method [43] was employed for the description of the interactions between the core (V:(Ne), O:(He), Mg:(He), and Ca:(Ne)) and valence electrons. The valence electron orbitals were expanded in the plane-wave basis set up to a very safe cut off energy of 38 Ha (about 1034 eV) for all the compounds. Electron exchange and correlation energy were treated with generalized gradient approximation with Perdew–Burke–Ernzerhof functional [44] for MgV2O5 and CaV2O5. For V2O5, due to the weak van der Waals interactions in the c direction, the LDA + U method [45], in combination with the dispersion correction of Tkatchenko and Scheffler [46], was adopted to calculate the electronic properties. A 2.5 eV U term was used for 3d states of vanadium atoms. In all the calculations, all orbitals were fully spin-polarized. The structure relaxations were started from experimental positions [30,31,32] and finished when the force on every atom was less than 0.01 eV/Å. The k-point sampling of 4 × 6 × 6 was found to be sufficient for all compounds. After relaxation, a large number of k-points (828, 732, and 828 k-points for V2O5, MgV2O5, and CaV2O5, respectively) were used to obtain a dense mesh of the energy eigenvalues required for the calculation of the temperature-dependent transport coefficients. After that, the transport properties were calculated in terms of the Boltzmann semi-classical theory, as implemented in the BOLTZTRAP code [47].
3. Results and Discussions
Table 1 shows the relaxed lattice parameters of V2O5, MgV2O5, and CaV2O5 with the comparison to the experimental data. For V2O5, the interaction between ab layers is weak van der Waals interaction, and standard DFT methods cannot treat this weak interaction properly [31,32]. As a result, we needed to adopt the Hubbard U term, as well as the dispersion correction, to correctly predict the geometry and electronic properties of V2O5. With this method, the predicted lattice parameter for a, b, and c agreed well with the experimental values of V2O5. When Mg and Ca atoms were intercalated between the layers, the interaction between ab layers was not only van der Waals forces, but in some places, there were also chemical bonds linked through Mg or Ca atoms. As a result, the pure DFT approach gave reasonable results for MgV2O5 and CaV2O5. We noted that the DFT result for CaV2O5 was better than that of MgV2O5. This might be ascribed to the large radius of Ca atoms; as a result, it had stronger interactions with V atoms compared with Mg atoms. The agreement of our predicted lattice parameters with experimental values for all compounds revealed the validity of our chosen methods.
To check the electronic property of V2O5, we calculated its electronic density of states (DOS), which is presented in Figure 2. The width of the valance band is about 4.8 eV, and it is characterized as a mixture of O-2p and V-3d states [35]. The conductance band was separated into two parts with a small gap of 0.53 eV. The first part is formed by V-3d states with a small admixture of O-2p orbitals [35]. The predicted band gap was 2.23 eV (Table 2), which agreed well with previous DFT calculations [40], and was close to the measured results from photodesorption (2.35 eV [48]), from optical adsorption (2.30 eV [49]), and from optical reflectance data (2.38 eV [50]). If no Hubbard U term and dispersion correction were considered in DFT calculations, the band gap predicted in V2O5 was only 1.95 eV, which was much smaller than the experimental values.
With the intercalation of Mg and Ca atoms into the van der Waals interfaces of V2O5, i.e., forming new compounds—MgV2O5 and CaV2O5, the electronic properties could be modified significantly. Figure 3 reveals the electronic band structures and corresponding DOS for MgV2O5 and CaV2O5. As illustrated in Table 2, the band gap of these two compounds was fairly narrow; even there was nearly no gap for MgV2O5. These small band gaps for the two systems correspond very well with other ab-initio calculations [38]. The band structure of CaV2O5 also agreed well with previous LDA+U calculations [53], where U = 3.6 eV was chosen. Compared to V2O5, the Fermi energies (the uppermost occupied level) shifted to the top of the first part of the conductance band, which was composed of two bands, as shown in the band structures. However, the shape of this band changed a lot, and the gap decreased from 0.38 eV to less than 0.1 eV. In this situation, the electrical conductivity should be increased dramatically compared to that of V2O5 as it is fairly easy to excite the electrons from valance bands to conductance bands due to the small gaps. The band structures (shapes and band gaps) at different points were much different. For example, in the case of MgV2O5, the band gap at Z point was about 1.4 eV, while it decreased to about 0.9 eV at Y point, which meant large anisotropy existed in the band structures. This phenomenon led to the anisotropy for the properties that depend on band structures, such as electrical conductivity, Seebeck coefficient, and so on. In order to perform a quantitative theoretical analysis of the anisotropic transport properties, we calculated the thermoelectric properties of the three compounds.
Figure 4 illustrates the anisotropy of temperature-dependent transport properties of V2O5, MgV2O5, and CaV2O5. In Boltzmann transport theory, the electrical conductivity and the electronic contribution to the total thermal conductivity are relaxation time (τ)-dependent. Here, we did not calculate the relaxation time due to calculation complexes. However, we could compare the electrical conductivity and electronic thermal conductivity normalized by τ qualitatively in V2O5, MgV2O5, and CaV2O5. The comparisons of τ normalized electrical and electronic thermal conductivities have also been conducted in the literature [25]. It is worth noting that such comparisons could only get qualitative trends. For the Seebeck coefficient, the relaxation time dropped out from the expressions, and the absolute values could be obtained.
The Seebeck coefficient of V2O5 showed large anisotropy below 600 K, while the anisotropy became much smaller above 600 K. Above 150 K, the values in three directions changed between 190 μV/K to 400 μV/K, and they became to be around 200 μV/K at high temperatures. In the present calculations, positive values were obtained, while experimentally, negative values are usually observed, indicating V2O5 is an n-type semiconductor. This disagreement might result from the existence of oxygen vacancies in experimental samples. It is reported that the sign of the Seebeck coefficient is directly related to the energy slope of the electronic density of states at Fermi energy level Ef [54]. More precisely, the sign of the Seebeck coefficient is the opposite of the energy slope of DOS at Ef. In our case, Ef was located at the top of the valance band, where the slope of DOS was negative, corresponding to positive Seebeck coefficients, as shown in Figure 4a. However, Xiao and Guo [36] studied the electronic structures of V2O5 with oxygen vacancies, where they found different from perfect V2O5, the Fermi energy of V2O5 with oxygen vacancies shifted to the bottom of conductance band, similar to an n-type-doped semiconductor. As a result, the energy slope of DOS at Ef changed to positive, resulting in negative Seebeck coefficients. In experimental V2O5 samples, it is very hard to avoid the formation of oxygen vacancies. Since the Seebeck coefficients of V2O5 at high temperatures show small anisotropy, if downsize it to low dimensional materials, such as thin films or nanowires, similar Seebeck values should be measured. In other words, V2O5 thin films or nanowires should have the same Seebeck coefficient with bulk materials at high temperatures when the film thickness is not too small. Besides, Surnev et al. [55] reported that the V-oxide thin-film phases had more or less a bulk-type character, i.e., a lot of physical and chemical properties were similar to those of bulk oxide samples. So, it was reasonable to compare our theoretical results with the values obtained from thin films. Figure 4a also displays the absolute values of the Seebeck coefficient of V2O5 thin films from experiments. The comparison showed that the present DFT and Boltzmann semi-classical theory predictions agreed with experimental results. The Seebeck coefficients of MgV2O5 and CaV2O5 exhibited large anisotropy in the entire temperature range considered, especially for MgV2O5, where the Seebeck along the a direction was largely different from that along the b and c directions. In the case of MgV2O5, the anisotropic appeared in the order Sc < Sb <Sa (absolute value) at low temperatures. There was also a cross between Sb and Sc at T = 520 K, and the anisotropy changed to the order Sb < Sc < Sa when T > 520 K. This cross over between Sb and Sc might be related to the relative magnitude of electron effective mass along the b and c directions at different energy levels. At lower temperatures, the excited electrons occupied the lower energy levels of the conduction band. At this low energy levels, the effective mass of electrons along the b direction might be smaller than that along the c direction, resulting in the absolute value of Sb larger than Sc. With the increase of temperature, more electrons would be populated to higher energy levels, where possibly the electron effective mass along the b direction becomes larger than that along the c direction. The reversed electron effective mass with the increase of energy eventually led to the cross over of Sb and Sc. At high temperatures, MgV2O5 owned a large absolute Seebeck coefficient along the a direction at T > 600 K, and it resulted in a reasonable average value of −75 to −80 μV/K in this temperature range. For CaV2O5, the Seebeck coefficient changed from positive to negative with the increase of temperature. The change of the Seebeck coefficient sign with temperature has also been reported in InP experimentally [56]. The sign change with temperature might originate from the different relative contributions of the Seebeck coefficient by electrons and holes at different temperatures. For undoped CaV2O5, the Seebeck coefficient was contributed by both electrons and holes as the excitation of an electron by temperature would also create a hole. At lower temperatures, the electrons were excited to the bottom of the conduction band and left holes at the top of the valance band. At such energy levels for electrons and holes, the effective mass of electrons was larger than that of holes-mh*/me* = 0.502, i.e., electron mobility was smaller than hole mobility, and the material showed p-type character. With the increase of temperature, there would be more electrons moving to the higher energy levels of the conduction band and more holes moving to the lower energy levels of the valance band. If the mobility of electrons at higher energy levels was larger than the mobility of holes at lower energy levels, the sign of the Seebeck coefficient could be changed at a higher temperature. For example, at the energy level of 0.2 eV above/below the conduction band bottom/valance band top, we had mh*/me* = 1.171. At high temperatures, the Seebeck coefficient anisotropic in CaV2O5 followed Sb < Sa < Sc (absolute value), and the average value ranged from −70 to −110 μV/K when T > 600 K.
The electrical conductivity of all the three compounds showed large anisotropies. The electrical conductivity increased with the increase of temperature in all the directions, indicating the semiconductor behavior. Due to the large band gap, experimental results showed very low electrical conductivity for V2O5. However, DFT calculations showed that MgV2O5 and CaV2O5 owned very narrow band gaps, so they might have large electrical conductivities. Narrow band gap semiconductors are potentially good thermoelectric materials [57]. Since the electronic thermal conductivity was proportional to the electrical conductivity, it possessed the same anisotropy with electrical conductivity for all compounds.
From the discussions above, we knew that although V2O5 owned very large thermal power, it was not a good thermoelectric material due to the low electrical conductivity resulted from the large band gap. With the intercalation of Ca and Mg atoms between the layers, the Seebeck coefficient decreased but still had relatively large values at high temperatures. Experiments showed that MgV2O5 and CaV2O5 had low thermal conductivity, both less than 2 Wm−1·K−1 at room temperature [29]. More importantly, these two compounds might have good electrical conductivity because of the very narrow band gaps. They might act as phonon glass and electron crystal. So, these two compounds could be potential high-temperature (500–1000 K) thermoelectric materials.
To characterize the TE property of MgV2O5 and CaV2O5, the dimensionless figure of merit need to be obtained. Due to the limited information on the electron relaxation time and the lattice thermal conductivity, we were not able to obtain the absolute value of ZT. However, in order to characterize the relative TE performance of the two compounds, we defined an f factor, which was expressed as , where κ is the total thermal conductivity, including the contributions from both electrons and phonons. f represents the fraction of thermal conductivity contributed by electrons. With the defined f factor, ZT could be expressed as . In this way, τ got away from the ratio of σ/κel, and thus the figure of merit only depended on factor f. With different values of f, we could get the temperature-dependent figure of merit. The accurate prediction of ZT relied on the accuracy of f. Normally, one might know the range of f value for a specific material; as a result, the ZT could be estimated with the uncertainty of the f. This strategy could give a rough estimation of ZT for a specific material. Figure 5 shows the variation of ZT values as a function of temperature with different f values for MgV2O5 and CaV2O5. Since oxide materials are usually regarded as high-temperature TE materials due to their good thermal stability, we only discussed ZT in the temperature range of 500 K to 1000 K. For MgV2O5, ZT was almost unchanged with the variation of temperature. When f = 100%, i.e., all the thermal conductivity was contributed by electrons, ZT could reach up to 0.13. With the decrease of electron contribution to the total thermal conductivity, ZT reduced gradually. When electrons contributed only 10% of total thermal conductivity, ZT reduced to about 0.01. For CaV2O5, ZT was strongly dependent on temperature, which was different from the case of MgV2O5. At lower temperatures (~500 K), the maximum ZT (f = 100%) was below 0.02. However, the maximum ZT could increase up to 0.23 at 1000 K, which was larger than that of MgV2O5. Considering the band gap of MgV2O5 and CaV2O5 was very small (<0.1 eV), as well as the small lattice thermal conductivity of the two compounds, we argued that the thermal conductivity contributed by electrons should be large. Although the ZT values were much smaller than the traditional thermoelectric materials like Bi2Te3, they were new candidates, and the properties might be improved by some techniques. Doping and decreasing the dimensions are the most used ways. Here, we proposed that reducing the dimensions might be a good way to obtain better ZT values due to the large transport anisotropy in the two materials.
To characterize the anisotropic transport of MgV2O5 and CaV2O5, we calculated the lattice orientation-dependent ZT with f = 100%. Since electrons could not contribute 100% to the total thermal conductivity, the calculated ZT referred to the up-bound value that could be approached with the minimization of phonon thermal conductivity. The corresponding results are illustrated in Figure 6. In both materials, ZT was strongly dependent on the crystallographic orientations, i.e., large anisotropy existed. In MgV2O5, ZT along the lattice direction a was much larger than those along directions b and c. The up-bound ZT along a could be larger than 0.3 above 800 K, while the values along b and c were below 0.05 in the considered temperature range. For CaV2O5, the value of ZT along the c direction was much larger than those along the other two directions, which was different from the case of MgV2O5. The up-bound ZT along c could reach up to 0.6 at 1000 K, and it could also reach 0.25 along direction a at this temperature. For both compounds, the ZT along direction b was almost zero at high temperatures, which was due to the close to zero Seebeck coefficient in the b direction. Based on the strong anisotropic transport in MgV2O5 and CaV2O5, we proposed to further enhance the TE figure of merit by nanostructuring. For MgV2O5, we could grow nanowires along the direction a, while for CaV2O5, we could grow nanowires along the direction c or grow thin films in the a–c plane. Besides, in nanostructures, the lattice thermal conductivity can be further reduced due to the boundary scattering, while the Seebeck coefficient can also be further improved due to the confinement effect in nanostructures [58,59]. As a result, the thermoelectric figure of merit is expected to be improved by nanostructuring.
4. Conclusions
The electronic and thermoelectric properties of V2O5, MgV2O5, and CaV2O5 were calculated based on the density functional theory and Boltzmann transport theory. The results showed that the Seebeck coefficient of V2O5 was relatively large and could reach up to 200 μV/K. The anisotropy of the Seebeck coefficient in V2O5 at high temperatures was small, while the anisotropy of electrical conductivity was large due to the structure anisotropies. The large electronic band gap in V2O5 eventually led to low electrical conductivity and hindered its thermoelectric performance. By intercalating Mg and Ca atoms into the van der Waals interfaces of V2O5, i.e., forming the compounds—MgV2O5 and CaV2O5, the electronic band gap was reduced dramatically down to below 0.1 eV. As a result, the electrical conductivity was expected to be improved extensively. In the meantime, the Seebeck coefficient was only reduced slightly compared to V2O5. Consequently, the thermoelectric figure of merit could be largely improved by the interface intercalations. Moreover, the intercalation of Mg and Ca atoms into the V2O5 van der Waals interfaces enhanced the anisotropic transport and eventually provided a possible way to further enhance their thermoelectric performance by nanostructuring.
Author Contributions
Conceptualization, Y.C.; Data curation, X.S.; Formal analysis, X.S.; Investigation, Z.L. and Y.C.; Methodology, X.S. and Y.C.; Software, X.S. and Y.C.; Writing—original draft, X.S.; Writing—review and editing, Y.C. All authors have read and agreed to the published version of the manuscript.
Funding
This research was funded by the China Postdoctoral Science Foundation (Grant No. 2019M651945); Research Project of Hubei Provincial Education Department (Q20191802); Doctoral Research Startup Fund in Hubei University of Automotive Technology (K201802); Hubei Provincial Natural Science Foundation of China (2020CFBXXX).
Conflicts of Interest
The authors declare no conflict of interest.
References
- DiSalvo, F.J. Thermoelectric Cooling and Power Generation. Science 1999, 285, 703. [Google Scholar] [CrossRef]
- Xiong, S.; Latour, B.; Ni, Y.; Volz, S.; Chalopin, Y. Efficient phonon blocking in SiC antiphase superlattice nanowires. Phys. Rev. B 2015, 91, 224307. [Google Scholar] [CrossRef]
- Xiong, S.; Ma, J.; Volz, S.; Dumitrică, T. Thermally-Active Screw Dislocations in Si Nanowires and Nanotubes. Small 2014, 10, 1756–1760. [Google Scholar] [CrossRef]
- He, J.; Tritt, T.M. Advances in thermoelectric materials research: Looking back and moving forward. Science 2017, 357, eaak9997. [Google Scholar] [CrossRef] [Green Version]
- Chen, Z.-G.; Shi, X.; Zhao, L.-D.; Zou, J. High-performance SnSe thermoelectric materials: Progress and future challenge. Prog. Mater. Sci. 2018, 97, 283–346. [Google Scholar] [CrossRef] [Green Version]
- Shi, X.-L.; Tao, X.; Zou, J.; Chen, Z.-G. High-Performance Thermoelectric SnSe: Aqueous Synthesis, Innovations, and Challenges. Adv. Sci. 2020, 7, 1902923. [Google Scholar] [CrossRef] [Green Version]
- Ohta, H.; Kim, S.; Mune, Y.; Mizoguchi, T.; Nomura, K.; Ohta, S.; Nomura, T.; Nakanishi, Y.; Ikuhara, Y.; Hirano, M.; et al. Giant thermoelectric Seebeck coefficient of a two-dimensional electron gas in SrTiO3. Nat. Mater. 2007, 6, 129–134. [Google Scholar] [CrossRef]
- Rhyee, J.-S.; Lee, K.H.; Lee, S.M.; Cho, E.; Kim, S.I.; Lee, E.; Kwon, Y.S.; Shim, J.H.; Kotliar, G. Peierls distortion as a route to high thermoelectric performance in In4Se3-δ crystals. Nature 2009, 459, 965–968. [Google Scholar] [CrossRef]
- Venkatasubramanian, R.; Siivola, E.; Colpitts, T.; O’Quinn, B. Thin-film thermoelectric devices with high room-temperature figures of merit. Nature 2001, 413, 597–602. [Google Scholar] [CrossRef]
- Srinivasan, B.; Gellé, A.; Gucci, F.; Boussard-Pledel, C.; Fontaine, B.; Gautier, R.; Halet, J.-F.; Reece, M.J.; Bureau, B. Realizing a stable high thermoelectric zT ∼ 2 over a broad temperature range in Ge1−x−yGaxSbyTe via band engineering and hybrid flash-SPS processing. Inorg. Chem. Front. 2019, 6, 63–73. [Google Scholar] [CrossRef]
- Srinivasan, B.; Berthebaud, D.; Mori, T. Is LiI a Potential Dopant Candidate to Enhance the Thermoelectric Performance in Sb-Free GeTe Systems? A Prelusive Study. Energies 2020, 13, 643. [Google Scholar] [CrossRef] [Green Version]
- Zeier, W.G.; Schmitt, J.; Hautier, G.; Aydemir, U.; Gibbs, Z.M.; Felser, C.; Snyder, G.J. Engineering half-Heusler thermoelectric materials using Zintl chemistry. Nat. Rev. Mater. 2016, 1, 16032. [Google Scholar] [CrossRef]
- Fu, C.; Zhu, T.; Pei, Y.; Xie, H.; Wang, H.; Snyder, G.J.; Liu, Y.; Liu, Y.; Zhao, X. High Band Degeneracy Contributes to High Thermoelectric Performance in p-Type Half-Heusler Compounds. Adv. Energy Mater. 2014, 4, 1400600. [Google Scholar] [CrossRef]
- Tang, Y.; Hanus, R.; Chen, S.-w.; Snyder, G.J. Solubility design leading to high figure of merit in low-cost Ce-CoSb3 skutterudites. Nat. Commun. 2015, 6, 7584. [Google Scholar] [CrossRef] [Green Version]
- Olvera, A.A.; Moroz, N.A.; Sahoo, P.; Ren, P.; Bailey, T.P.; Page, A.A.; Uher, C.; Poudeu, P.F.P. Partial indium solubility induces chemical stability and colossal thermoelectric figure of merit in Cu2Se. Energy Environ. Sci. 2017, 10, 1668–1676. [Google Scholar] [CrossRef]
- Xiong, S.; Yang, K.; Kosevich, Y.A.; Chalopin, Y.; D’Agosta, R.; Cortona, P.; Volz, S. Classical to Quantum Transition of Heat Transfer between Two Silica Clusters. Phys. Rev. Lett. 2014, 112, 114301. [Google Scholar] [CrossRef] [Green Version]
- Zhang, T.; Wang, Z.; Srinivasan, B.; Wang, Z.; Zhang, J.; Li, K.; Boussard-Pledel, C.; Troles, J.; Bureau, B.; Wei, L. Ultraflexible Glassy Semiconductor Fibers for Thermal Sensing and Positioning. Acs Appl. Mater. Interfaces 2019, 11, 2441–2447. [Google Scholar] [CrossRef]
- Srinivasan, B.; Cui, S.; Prestipino, C.; Gellé, A.; Boussard-Pledel, C.; Ababou-Girard, S.; Trapananti, A.; Bureau, B.; Di Matteo, S. Possible Mechanism for Hole Conductivity in Cu–As–Te Thermoelectric Glasses: A XANES and EXAFS Study. J. Phys. Chem. C 2017, 121, 14045–14050. [Google Scholar] [CrossRef]
- Zhou, Y.; Xiong, S.; Zhang, X.; Volz, S.; Hu, M. Thermal transport crossover from crystalline to partial-crystalline partial-liquid state. Nat. Commun. 2018, 9, 4712. [Google Scholar] [CrossRef] [Green Version]
- Chain, E.E. Optical properties of vanadium dioxide and vanadium pentoxide thin films. Appl. Opt. 1991, 30, 2782–2787. [Google Scholar] [CrossRef]
- Scanlon, D.O.; Walsh, A.; Morgan, B.J.; Watson, G.W. An ab initio Study of Reduction of V2O5 through the Formation of Oxygen Vacancies and Li Intercalation. J. Phys. Chem. C 2008, 112, 9903–9911. [Google Scholar] [CrossRef]
- Park, H.K. V2O5 Xerogel Films as Intercalation Hosts for Lithium. J. Electrochem. Soc. 1995, 142, 1068. [Google Scholar] [CrossRef]
- Wu, Q.-H.; Thißen, A.; Jaegermann, W. Photoelectron spectroscopic study of Na intercalation into V2O5 thin films. Solid State Ion. 2004, 167, 155–163. [Google Scholar] [CrossRef]
- Iwanaga, S.; Marciniak, M.; Darling, R.B.; Ohuchi, F.S. Thermopower and electrical conductivity of sodium-doped V2O5 thin films. J. Appl. Phys. 2007, 101, 123709. [Google Scholar] [CrossRef]
- Chumakov, Y.; Santos, J.R.; Ferreira, I.; Termentzidis, K.; Pokropivny, A.; Xiong, S.Y.; Cortona, P.; Volz, S. Thermoelectric transport in V2O5 thin films. J. Phys. Conf. Ser. 2012, 395, 012016. [Google Scholar] [CrossRef]
- Bianchi, C.; Loureiro, J.; Duarte, P.; Marques, J.; Figueira, J.; Ropio, I.; Ferreira, I. V2O5 Thin Films for Flexible and High Sensitivity Transparent Temperature Sensor. Adv. Mater. Technol. 2016, 1, 1600077. [Google Scholar] [CrossRef]
- Santos, R.; Loureiro, J.; Nogueira, A.; Elangovan, E.; Pinto, J.V.; Veiga, J.P.; Busani, T.; Fortunato, E.; Martins, R.; Ferreira, I. Thermoelectric properties of V2O5 thin films deposited by thermal evaporation. Appl. Surf. Sci. 2013, 282, 590–594. [Google Scholar] [CrossRef]
- Loureiro, J.; Santos, J.R.; Nogueira, A.; Wyczisk, F.; Divay, L.; Reparaz, S.; Alzina, F.; Sotomayor Torres, C.M.; Cuffe, J.; Montemor, F.; et al. Nanostructured p-type Cr/V2O5 thin films with boosted thermoelectric properties. J. Mater. Chem. A 2014, 2, 6456–6462. [Google Scholar] [CrossRef]
- Kordonis, K. Wärmetransport in eindimensionalen Spinsystemen. Ph.D Thesis, Universität zu Köln, Köln, Germany, 2007. [Google Scholar]
- Shklover, V.; Haibach, T.; Ried, F.; Nesper, R.; Novák, P. Crystal Structure of the Product of Mg2+Insertion into V2O5Single Crystals. J. Solid State Chem. 1996, 123, 317–323. [Google Scholar] [CrossRef]
- Millet, P.; Satto, C.; Sciau, P.; Galy, J. MgV2O5 and δLixV2O5: A Comparative Structural Investigation. J. Solid State Chem. 1998, 136, 56–62. [Google Scholar] [CrossRef]
- Onoda, M.; Nishiguchi, N. LETTER TO THE EDITOR: Crystal Structure and Spin Gap State of CaV2O5. J. Solid State Chem. 1996, 127, 359–362. [Google Scholar] [CrossRef]
- Delmas, C.; Cognac-Auradou, H.; Cocciantelli, J.M.; Ménétrier, M.; Doumerc, J.P. The LixV2O5 system: An overview of the structure modifications induced by the lithium intercalation. Solid State Ion. 1994, 69, 257–264. [Google Scholar] [CrossRef]
- Chakrabarti, A.; Hermann, K.; Druzinic, R.; Witko, M.; Wagner, F.; Petersen, M. Geometric and electronic structure of vanadium pentoxide: A density functional bulk and surface study. Phys. Rev. B 1999, 59, 10583–10590. [Google Scholar] [CrossRef] [Green Version]
- Goclon, J.; Grybos, R.; Witko, M.; Hafner, J. Relative stability of low-index V2O5 surfaces: A density functional investigation. J. Phys. Condens. Matter 2009, 21, 095008. [Google Scholar] [CrossRef] [PubMed]
- Xiao, Z.R.; Guo, G.Y. Structural, electronic and magnetic properties of V2O5−x: An ab initio study. J. Chem. Phys. 2009, 130, 214704. [Google Scholar] [CrossRef]
- Ganduglia-Pirovano, M.V.; Sauer, J. Stability of reduced ${\mathrm{V}}_{2}{\mathrm{O}}_{5}(001)$ surfaces. Phys. Rev. B 2004, 70, 045422. [Google Scholar] [CrossRef]
- Spitaler, J.; Sherman, E.Y.; Ambrosch Draxl, C.; Hohenadler, M.; Michel, F.; Aichhorn, M.; Evertz, H.G. Ab-initio Studies of the Vanadium Ladder Compounds NaV2O5, CaV2O5 and MgV2O5. APS 2004, 2004, D25-002. [Google Scholar]
- Laubach, S.; Schmidt, P.C.; Thißen, A.; Fernandez-Madrigal, F.J.; Wu, Q.-H.; Jaegermann, W.; Klemm, M.; Horn, S. Theoretical and experimental determination of the electronic structure of V2O5, reduced V2O5−x and sodium intercalated NaV2O5. Phys. Chem. Chem. Phys. 2007, 9, 2564–2576. [Google Scholar] [CrossRef]
- Jovanović, A.; Dobrota, A.S.; Rafailović, L.D.; Mentus, S.V.; Pašti, I.A.; Johansson, B.; Skorodumova, N.V. Structural and electronic properties of V2O5 and their tuning by doping with 3d elements – modelling using the DFT+U method and dispersion correction. Phys. Chem. Chem. Phys. 2018, 20, 13934–13943. [Google Scholar] [CrossRef] [Green Version]
- Gonze, X.; Amadon, B.; Antonius, G.; Arnardi, F.; Baguet, L.; Beuken, J.-M.; Bieder, J.; Bottin, F.; Bouchet, J.; Bousquet, E.; et al. The Abinitproject: Impact, environment and recent developments. Comput. Phys. Commun. 2020, 248, 107042. [Google Scholar] [CrossRef]
- Gonze, X.; Jollet, F.; Abreu Araujo, F.; Adams, D.; Amadon, B.; Applencourt, T.; Audouze, C.; Beuken, J.M.; Bieder, J.; Bokhanchuk, A.; et al. Recent developments in the ABINIT software package. Comput. Phys. Commun. 2016, 205, 106–131. [Google Scholar] [CrossRef] [Green Version]
- Blöchl, P.E. Projector augmented-wave method. Phys. Rev. B 1994, 50, 17953–17979. [Google Scholar] [CrossRef] [PubMed] [Green Version]
- Perdew, J.P.; Burke, K.; Ernzerhof, M. Generalized Gradient Approximation Made Simple. Phys. Rev. Lett. 1996, 77, 3865–3868. [Google Scholar] [CrossRef] [Green Version]
- Anisimov, V.I.; Aryasetiawan, F.; Lichtenstein, A.I. First-principles calculations of the electronic structure and spectra of strongly correlated systems: The LDA+U method. J. Phys. Condens. Matter 1997, 9, 767–808. [Google Scholar] [CrossRef] [Green Version]
- Tkatchenko, A.; Scheffler, M. Accurate Molecular Van Der Waals Interactions from Ground-State Electron Density and Free-Atom Reference Data. Phys. Rev. Lett. 2009, 102, 073005. [Google Scholar] [CrossRef] [PubMed] [Green Version]
- Madsen, G.K.H.; Singh, D.J. BoltzTraP. A code for calculating band-structure dependent quantities. Comput. Phys. Commun. 2006, 175, 67–71. [Google Scholar] [CrossRef] [Green Version]
- Hieu, N.V.; Lichtman, D. Bandgap radiation induced photodesorption from V2O5 powder and vanadium oxide surfaces. J. Vac. Sci. Technol. 1981, 18, 49–53. [Google Scholar] [CrossRef]
- Cogan, S.F.; Nguyen, N.M.; Perrotti, S.J.; Rauh, R.D. Optical properties of electrochromic vanadium pentoxide. J. Appl. Phys. 1989, 66, 1333–1337. [Google Scholar] [CrossRef]
- Moshfegh, A.Z.; Ignatiev, A. Formation and characterization of thin film vanadium oxides: Auger electron spectroscopy, X-ray photoelectron spectroscopy, X-ray diffraction, scanning electron microscopy, and optical reflectance studies. Thin Solid Film. 1991, 198, 251–268. [Google Scholar] [CrossRef]
- Isobe, M.; Ueda, Y.; Takizawa, K.; Goto, T. Observation of a Spin Gap in MgV2O5 from High Field Magnetization Measurements. J. Phys. Soc. Jpn. 1998, 67, 755–758. [Google Scholar] [CrossRef]
- Iwase, H.; Isobe, M.; Ueda, Y.; Yasuoka, H. Observation of Spin Gap in CaV2O5 by NMR. J. Phys. Soc. Jpn. 1996, 65, 2397–2400. [Google Scholar] [CrossRef]
- Korotin, M.A.; Anisimov, V.I.; Saha-Dasgupta, T.; Dasgupta, I. Electronic structure and exchange interactions of the ladder vanadates CaV2O5and MgV2O5. J. Phys. Condens. Matter 1999, 12, 113–124. [Google Scholar] [CrossRef]
- Jones, E.C.; Christen, D.K.; Sales, B.C. Sign reversals in the vortex-state Hall effect in Y-Ba-Cu-O: Correlations with the normal-state Seebeck coefficient. Phys. Rev. B 1994, 50, 7234–7237. [Google Scholar] [CrossRef] [PubMed]
- Surnev, S.; Ramsey, M.G.; Netzer, F.P. Vanadium oxide surface studies. Prog. Surf. Sci. 2003, 73, 117–165. [Google Scholar] [CrossRef]
- Gorodynskyy, V.; Zdansky, K.; Pekárek, L.; Vacková, S. Temperature change of Hall and Seebeck coefficient sign in InP doped with transition metals. Semicond. Sci. Technol. 2003, 19, 203–207. [Google Scholar] [CrossRef]
- Yang, J.; Li, H.; Wu, T.; Zhang, W.; Chen, L.; Yang, J. Evaluation of Half-Heusler Compounds as Thermoelectric Materials Based on the Calculated Electrical Transport Properties. Adv. Funct. Mater. 2008, 18, 2880–2888. [Google Scholar] [CrossRef]
- Xiong, S.; Selli, D.; Neogi, S.; Donadio, D. Native surface oxide turns alloyed silicon membranes into nanophononic metamaterials with ultralow thermal conductivity. Phys. Rev. B 2017, 95, 180301. [Google Scholar] [CrossRef] [Green Version]
- Ouyang, B.; Xiong, S.; Yang, Z.; Jing, Y.; Wang, Y. MoS2 heterostructure with tunable phase stability: Strain induced interlayer covalent bond formation. Nanoscale 2017, 9, 8126–8132. [Google Scholar] [CrossRef] [Green Version]
Figure 1.
Crystal structures of (a) V2O5, (b) MgV2O5, and (c) CaV2O5. In all the figures, vanadium atoms are in white color, while oxygen atoms are in red color. Mg and Ca atoms are indicated in the corresponding figure.
Figure 1.
Crystal structures of (a) V2O5, (b) MgV2O5, and (c) CaV2O5. In all the figures, vanadium atoms are in white color, while oxygen atoms are in red color. Mg and Ca atoms are indicated in the corresponding figure.

Figure 2.
Electron density of states of V2O5, the uppermost occupied energy level is set to 0.

Figure 3.
Electronic band structures and density of states of (a,b) MgV2O5 and (c,d) CaV2O5. The uppermost occupied energy level was set to 0 and is indicated by the red horizontal line.
Figure 3.
Electronic band structures and density of states of (a,b) MgV2O5 and (c,d) CaV2O5. The uppermost occupied energy level was set to 0 and is indicated by the red horizontal line.
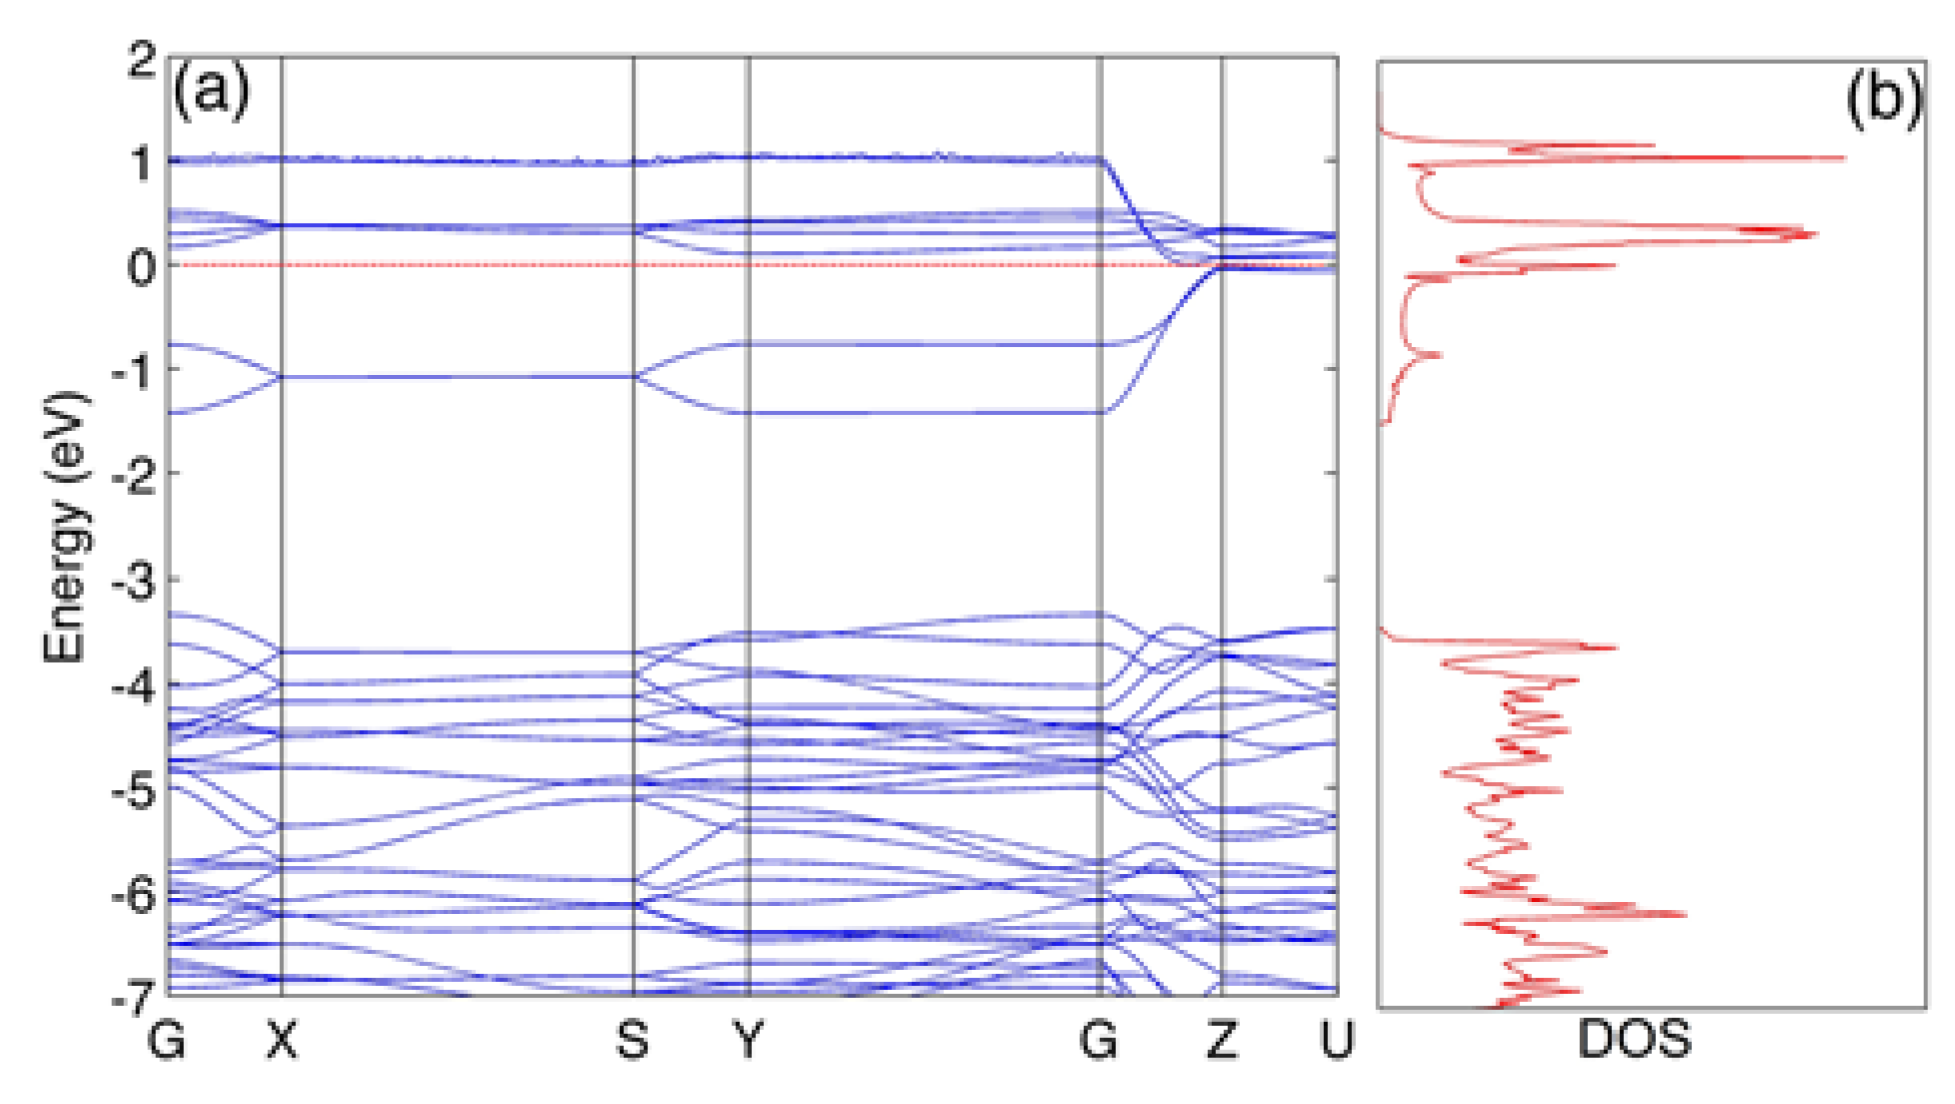

Figure 4.
Anisotropy of temperature-dependent Seebeck coefficient, electrical conductivity normalized by relaxation time τ, and electronic thermal conductivity normalized by τ for V2O5 (column 1), MgV2O5 (column 2), and CaV2O5 (column 3). Anisotropy of temperature-dependent Seebeck coefficient for V2O5 (a), MgV2O5 (b), CaV2O5 (c); Electrical conductivity normalized by relaxation time τ for V2O5 (d), MgV2O5 (e), CaV2O5 (f); Electronic thermal conductivity normalized by τ for V2O5 (g), MgV2O5 (h), CaV2O5 (i); The solid squares denote the experimental values of the Seebeck coefficient in V2O5 thin film [25]. As the anisotropy of Seebeck for V2O5 was small, it was comparable for the present predictions and the results from thin films. The a, b, and c directions corresponded to those of Table 1. Note that all figures share the same notation as in (a).

Figure 5.
The figure of merit changes with temperature at different f values for (a) MgV2O5 and (b) CaV2O5.
Figure 5.
The figure of merit changes with temperature at different f values for (a) MgV2O5 and (b) CaV2O5.
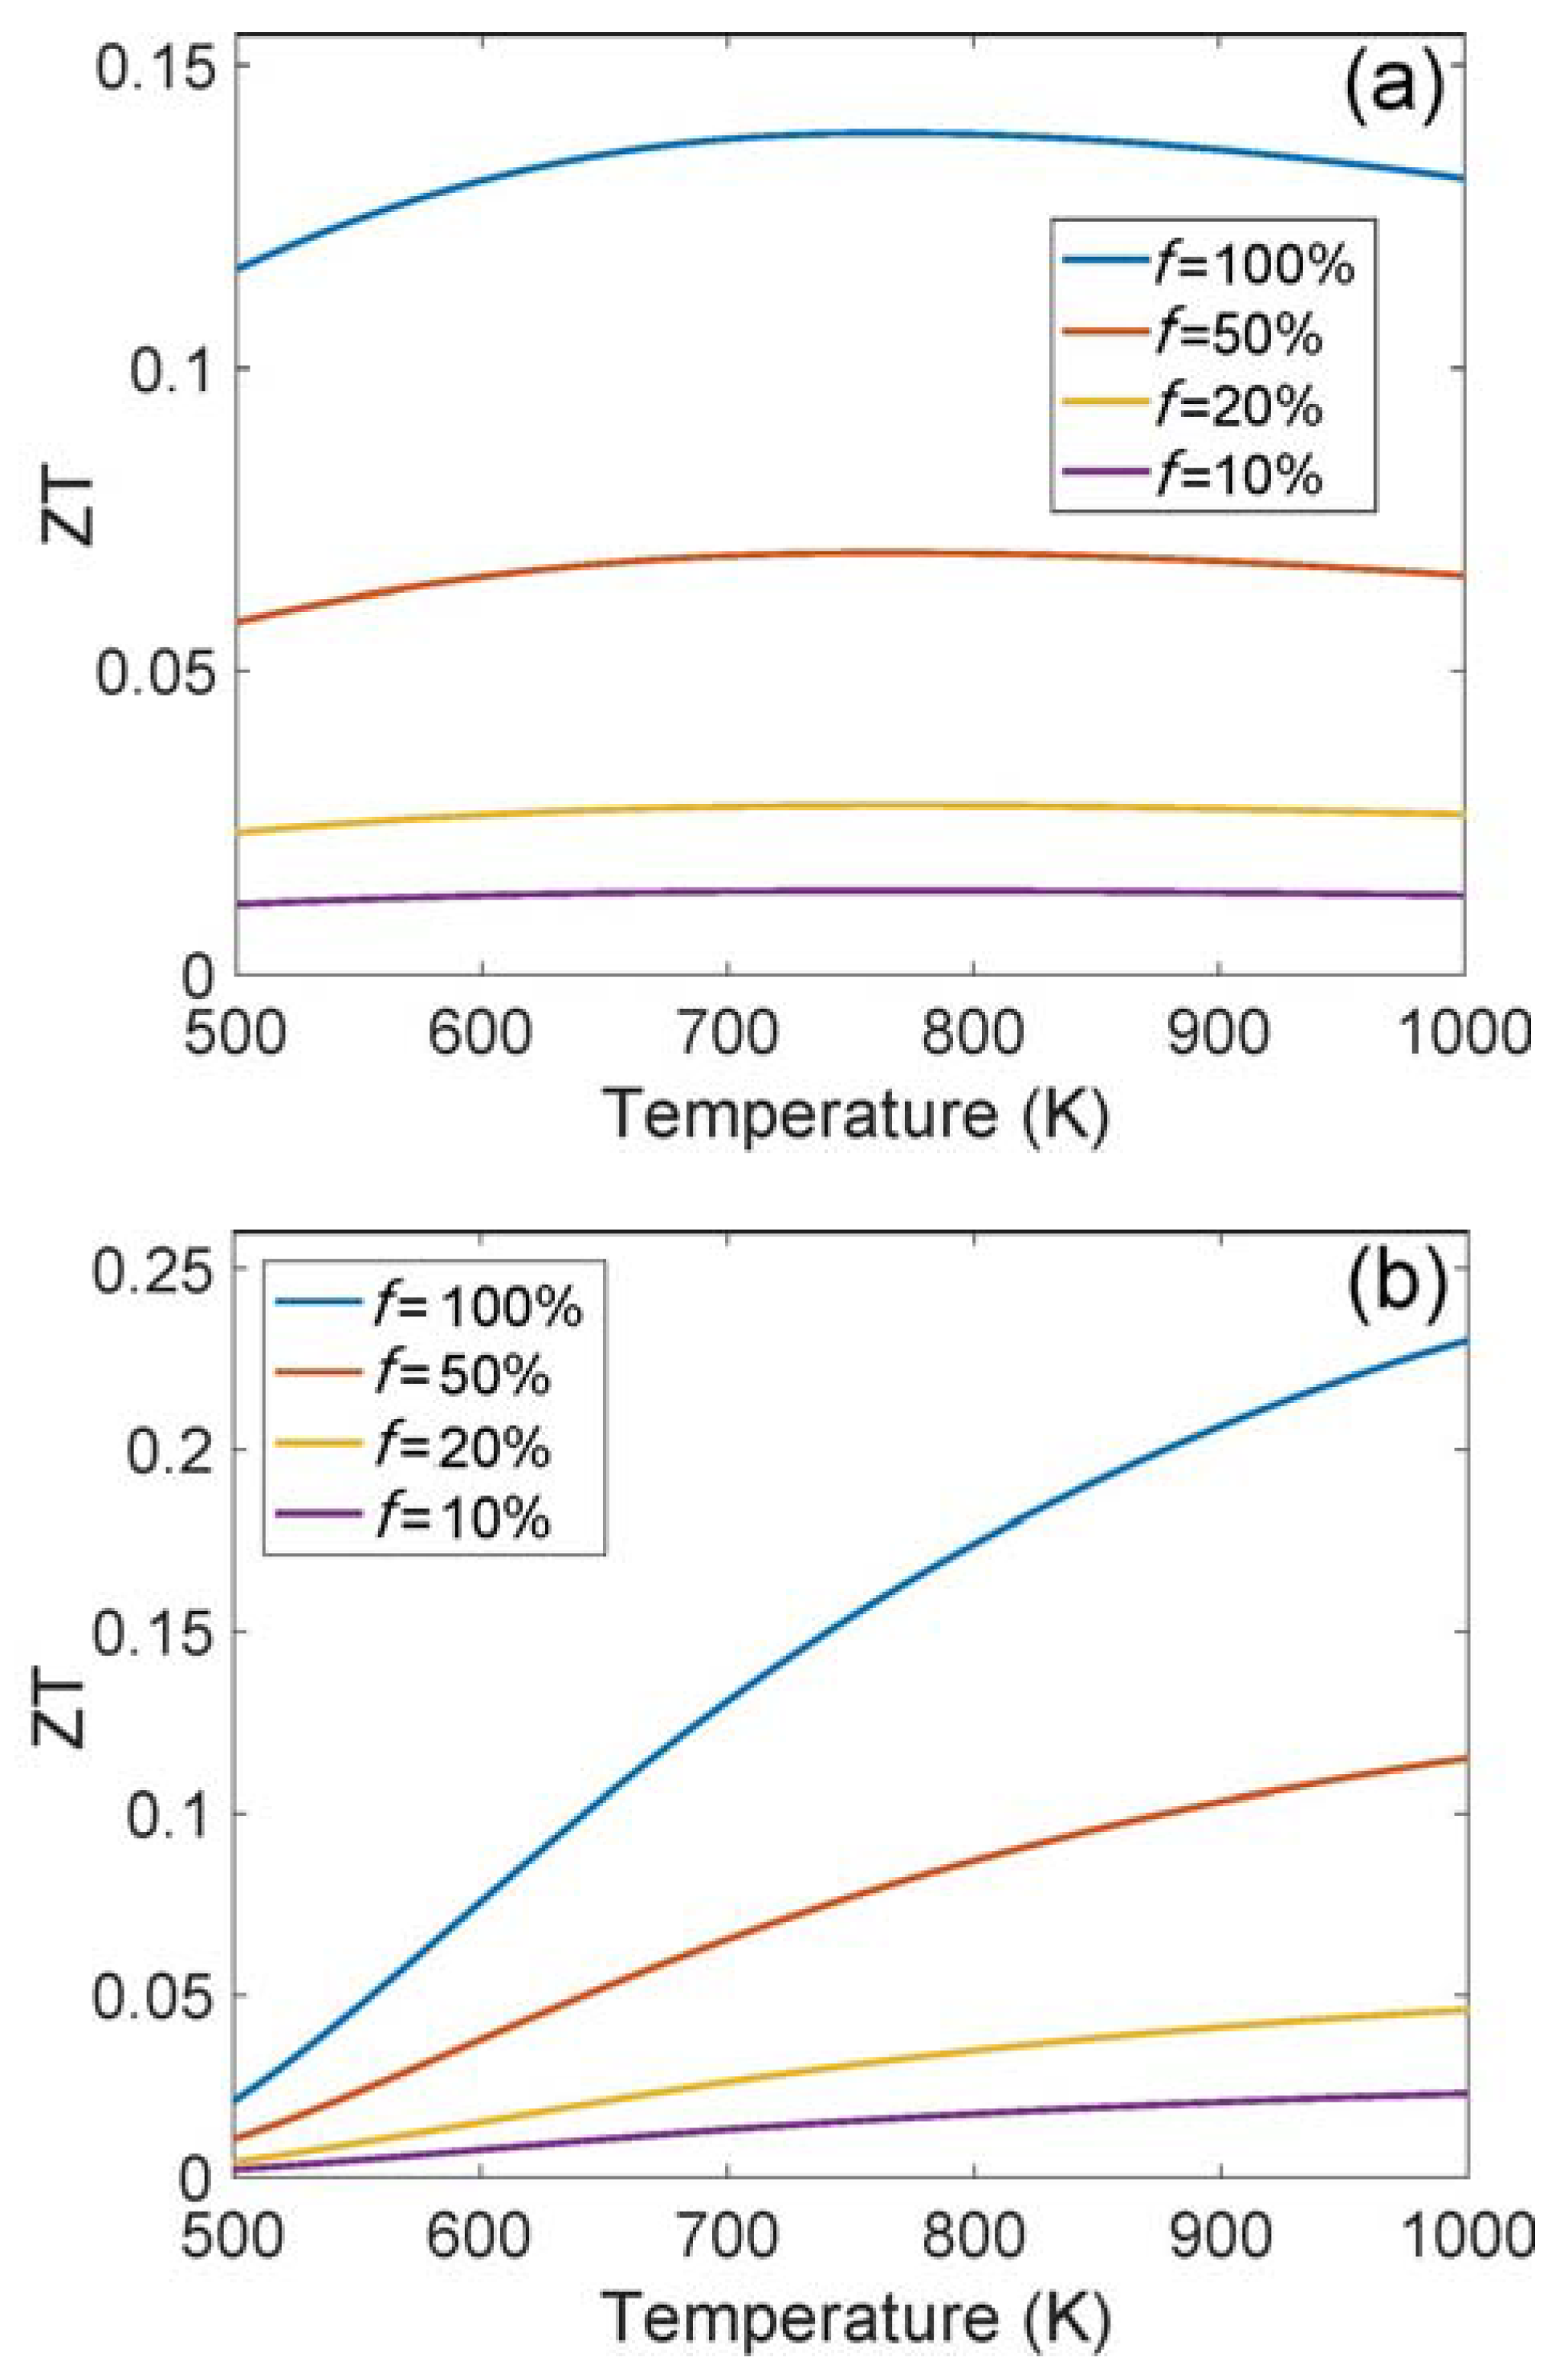
Figure 6.
The maximum figure of merit (f = 1) along the crystallographic directions a, b, and c varied with temperature: (a) MgV2O5 and (b) CaV2O5.
Figure 6.
The maximum figure of merit (f = 1) along the crystallographic directions a, b, and c varied with temperature: (a) MgV2O5 and (b) CaV2O5.


Table 1.
Comparisons of predicted lattice parameters and experimental values for V2O5, MgV2O5, and CaV2O5. The discrepancies are reported in parentheses after the predicted values. All lattice parameters are given in the unit of Å.
Table 1.
Comparisons of predicted lattice parameters and experimental values for V2O5, MgV2O5, and CaV2O5. The discrepancies are reported in parentheses after the predicted values. All lattice parameters are given in the unit of Å.
| Lattice Parameter | V2O5 | MgV2O5 | CaV2O5 | |||
|---|---|---|---|---|---|---|
| Exp. [30] | Current Work | Exp. [31] | Current Work | Exp. [32] | Current Work | |
| a | 11.544 | 11.530 (−0.12%) | 11.010 | 10.896 (−1.03%) | 11.351 | 11.525 (+1.53%) |
| b | 3.571 | 3.577 (+0.17%) | 3.693 | 3.789 (+2.06%) | 3.604 | 3.609 (+0.14%) |
| c | 4.383 | 4.483 (+2.28%) | 9.958 | 10.173 (+2.16%) | 4.893 | 4.962 (+1.41%) |
© 2020 by the authors. Licensee MDPI, Basel, Switzerland. This article is an open access article distributed under the terms and conditions of the Creative Commons Attribution (CC BY) license (http://creativecommons.org/licenses/by/4.0/).
Share and Cite
MDPI and ACS Style
Sheng, X.; Li, Z.; Cheng, Y. Electronic and Thermoelectric Properties of V2O5, MgV2O5, and CaV2O5. Coatings 2020, 10, 453. https://doi.org/10.3390/coatings10050453
AMA Style
Sheng X, Li Z, Cheng Y. Electronic and Thermoelectric Properties of V2O5, MgV2O5, and CaV2O5. Coatings. 2020; 10(5):453. https://doi.org/10.3390/coatings10050453
Chicago/Turabian StyleSheng, Xiaofei, Zhuhong Li, and Yajuan Cheng. 2020. "Electronic and Thermoelectric Properties of V2O5, MgV2O5, and CaV2O5" Coatings 10, no. 5: 453. https://doi.org/10.3390/coatings10050453
Note that from the first issue of 2016, this journal uses article numbers instead of page numbers. See further details here.