Plasma Electrolytic Oxidation of Titanium in H2SO4–H3PO4 Mixtures


1
Abteilung für Materialwissenschaft, Institut für Experimentelle Physik der kondensierten Materie, Heinrich-Heine-Universität Düsseldorf, Universitätsstraße 1, 40225 Düsseldorf, Germany
2
Raman Spectroscopic Services, FISCHER GmbH, Necklenbroicher Str. 22, 40667 Meerbusch, Germany
*
Author to whom correspondence should be addressed.
Coatings 2020, 10(2), 116; https://doi.org/10.3390/coatings10020116
Submission received: 19 December 2019
/
Revised: 20 January 2020
/
Accepted: 28 January 2020
/
Published: 30 January 2020
(This article belongs to the Special Issue Plasma Electrolytic Oxidation (PEO) Coatings)
Abstract
:Oxide layers on titanium foils were produced by galvanostatically controlled plasma electrolytic oxidation in 12.9 M sulfuric acid with small amounts of phosphoric acid added up to a 3% mole fraction. In pure sulfuric acid, the oxide layer is distinctly modified by plasma discharges. As the time of the process increases, rough surfaces with typical circular pores evolve. The predominant crystal phase of the titanium dioxide material is rutile. With the addition of phosphoric acid, discharge effects become less pronounced, and the predominant crystal phase changes to anatase. Furthermore, the oxide layer thickness and mass gain both increase. Already small amounts of phosphoric acid induce these effects. Our findings suggest that anions of phosphoric acid preferentially adsorb to the anodic area and suppress plasma discharges, and conventional anodization is promoted. The process was systematically investigated at different stages, and voltage and oxide formation efficiency were determined. Oxide surfaces and their cross-sections were studied by scanning electron microscopy and energy-dispersive X-ray spectroscopy. The phase composition was determined by X-ray diffraction and confocal Raman microscopy.
1. Introduction
The oxide layer of metals such as titanium can be tailored for specific applications. The most common technique used to artificially grow a passive layer is anodic oxidation, in which moderate voltages promote a denser and thicker oxide layer compared with the naturally formed oxide. With the increasing scope of applications, new demands on materials have evolved. To meet these needs, researchers have developed new techniques from classical anodic oxidation. One derived technique is plasma electrolytic oxidation (PEO), in which the applied voltage exceeds a critical point and causes the initial oxide layer to reform by characteristic breakdowns, which often induce plasma conditions. The complex interplay between chemical, electrochemical, and thermodynamic reactions creates unique oxide layers and enables versatile changes in these layers by slightly changing the process parameters. Therefore, PEO-treated titanium can be used for a variety of applications, such as biomedical prostheses, automotive components, and photocatalytic devices [1].
Furthermore, PEO-treated titanium has recently been used as a gas sensor material at room temperature for various gases [2]. In this case, HSO at an exceptionally high concentration of 12.9 M is used as an electrolyte and leads to a characteristic porous oxide structure with a layer thickness of approximately 5.5 . The morphology and thickness suggest a high surface-to-bulk ratio, which is beneficial for gas sensor technology. In general, breakdowns during PEO promote the formation of crystalline titanium dioxide phases, namely, anatase and the high-temperature phase rutile [3,4,5]. Both phases differ in significant properties (e.g., band-gap energy and electron–hole recombination rate) for potential application as a gas sensor material [6]. When investigating the effect of the crystal phase composition on the gas–oxide interaction, the ability to systematically control the rutile to anatase fraction is desirable. In 12.9 M HSO, the dominant crystal phase in the oxide is rutile, while the anatase fraction dominates in lower concentrations [7]. However, lower concentrations adversely affect the oxide layer by decreasing its thickness and porosity.
In recent studies on PEO for medical applications, electrolytes with phosphoric acid (HPO) have been frequently used, and oxide layers of comparable porosity and thickness can be formed [8,9,10]. Anatase is the dominant phase in these layers, and rutile is almost non-existent. When used as an electrolyte, phosphoric acid not only affects the phase composition but also drastically changes the outcome of the PEO process. The combination of both electrolytes provides an interesting approach to tailoring the properties of the oxide scale. Since the ratio of the two compounds in the mixture is critical for obtaining specific properties, we explored the effect of small amounts of HPO in concentrated HSO.
Our PEO experiment is based on a galvanostatic DC operation mode. The resulting constant current offers a simple method of treating and evaluating samples for a systematic PEO study. For instance, it can be split into several contributions and classified into ionic and electronic currents [8,11]. The ionic current reflects the migration of ions in the oxide layer and is the driving force in conventional anodic oxidation. The electronic current is mainly induced by breakdowns. In the course of the PEO process, a transition from ionic to electronic current can be observed.
Starting with concentrated sulfuric acid (12.9 M) as an electrolyte, we investigated the impact of adding HPO at molar fractions of 1% and 3%. Before and after PEO, the samples were analyzed for weight gain with a microbalance. Scanning electron microscopy and X-ray diffraction were used to systematically study oxide surfaces and cross sections at different stages of the process. We derived information about the phase distribution in the oxide layer from confocal Raman microscopy of cross sections, and elemental composition was investigated by energy-dispersive X-ray spectroscopy.
2. Materials and Methods
Samples (surface area of approx. 3.634 cm) were cut from titanium foil (thermally annealed, 99.6% purity; 125 thickness) by means of a laser (PowerLine F30, ROFIN-SINAR Laser GmbH, Hamburg, Germany). The samples were cleaned ultrasonically for approximately 10 min in acetone and 10 min in deionized water. The electrolytic cell consisted of a glass vessel with an integrated glass shell, which enabled the temperature regulation of the electrolyte by pumping cold thermal fluid through the shell. The thermal fluid temperature was kept constant at 15 C with a recirculating cooler (FL1201, JULABO GmbH, Seelbach, Germany). The reaction chamber was filled with 114 ± 5 of the electrolyte. The electrolyte was based on 12.9 M HSO (75 wt%). It was enriched with 25 wt% HPO, which resulted in molar fractions of n(HPO)/n(HSO) = 0%, 1%, and 3%. Specifically, the last two fractions corresponded to c(HPO) = 0.1 M plus c(HSO) = 12.3 M and c(HPO) = 0.3 M plus c(HSO) = 11.4 M. A magnetic stirrer prevented spatial temperature differences in the electrolyte and reduced the disturbance of gas accumulations on the electrode surfaces. The electrolytic system was completed by the titanium sample as the anode and a graphite rod as the cathode (area of immersion of 7.38 ± 0.6 ) at a distance of 23 ± 4 .
A constant current density of 55 / was applied by using a highly stable current power supply (FUG MCP 350-350). Voltage and current were adjusted and recorded in 250 ms intervals using an in-house developed LabVIEW program. After treatment, the sample was rinsed in deionized water and dried in air. The weight of the sample was measured before and after the process with an analytical balance (ABT 120-5DM, Kern und Sohn GmbH, Germany) with a repeatability of 0.02 mg.
The microstructure of the oxide layer was investigated by field emission scanning electron microscopy (SEM; JSM-7500F, JEOL Ltd., Tokyo, Japan). Surface images of secondary electrons were captured with 5 kV excitation. Cross sections were prepared by argon ion milling (Cross Section Polisher IB-09010CP, JEOL Ltd., Tokyo, Japan). For energy-dispersive X-ray spectroscopy (EDX), images were created with 15 kV excitation energy and detected with an XFlash Detector 5030 (Bruker AXS GmbH, Karlsruhe, Germany). Quantitative results of elemental composition were obtained by averaging over at least three comparable sections to minimize local fluctuations.
The phase composition was determined by X-ray diffraction (XRD). Diffraction data were collected on a Bruker D2 Phaser diffractometer with Cu-K radiation ( = 1.54184 Å, 30 kV, 10 mA) in Bragg–Brentano geometry and a LYNXEYE 1D detector. XRD patterns were measured with a flat silicon, low-background rotating sample holder (5.0 min) with 24.5, a scan speed of 2 s/step, and a step size of approximately 0.024.
Raman measurements were performed with a confocal Raman microscope alpha300 R (WITec GmbH, Ulm, Germany). A fiber-coupled single-mode DPSS laser with an excitation wavelength of 532 was used. The laser power applied to the sample was set to 20 . A Zeiss EC Epiplan-Neofluar DIC 100x/0.9 NA was selected as the microscope objective, and the samples were scanned with a step size of 200 . In this way, a spatial resolution of about 300 could be achieved. The system also featured real-time laser profilometry, so the sample surface remained in the focal plane during the entire measurement period. The spectrometer used was a WITec UHTS 300 combined with an Andor iDus Deep Depletion CCD detector, which was cooled to C. The Raman scattered light was spectrally dispersed by a reflection grating with 1200 . The average spectral resolution was about 2 /pixel. The software WITec FIVE version 5.2.4.81 was used to evaluate the measurement data and create Raman images, including cosmic ray removal and background subtraction by the implemented shape function.
3. Results
3.1. Voltage Response and Mass Change
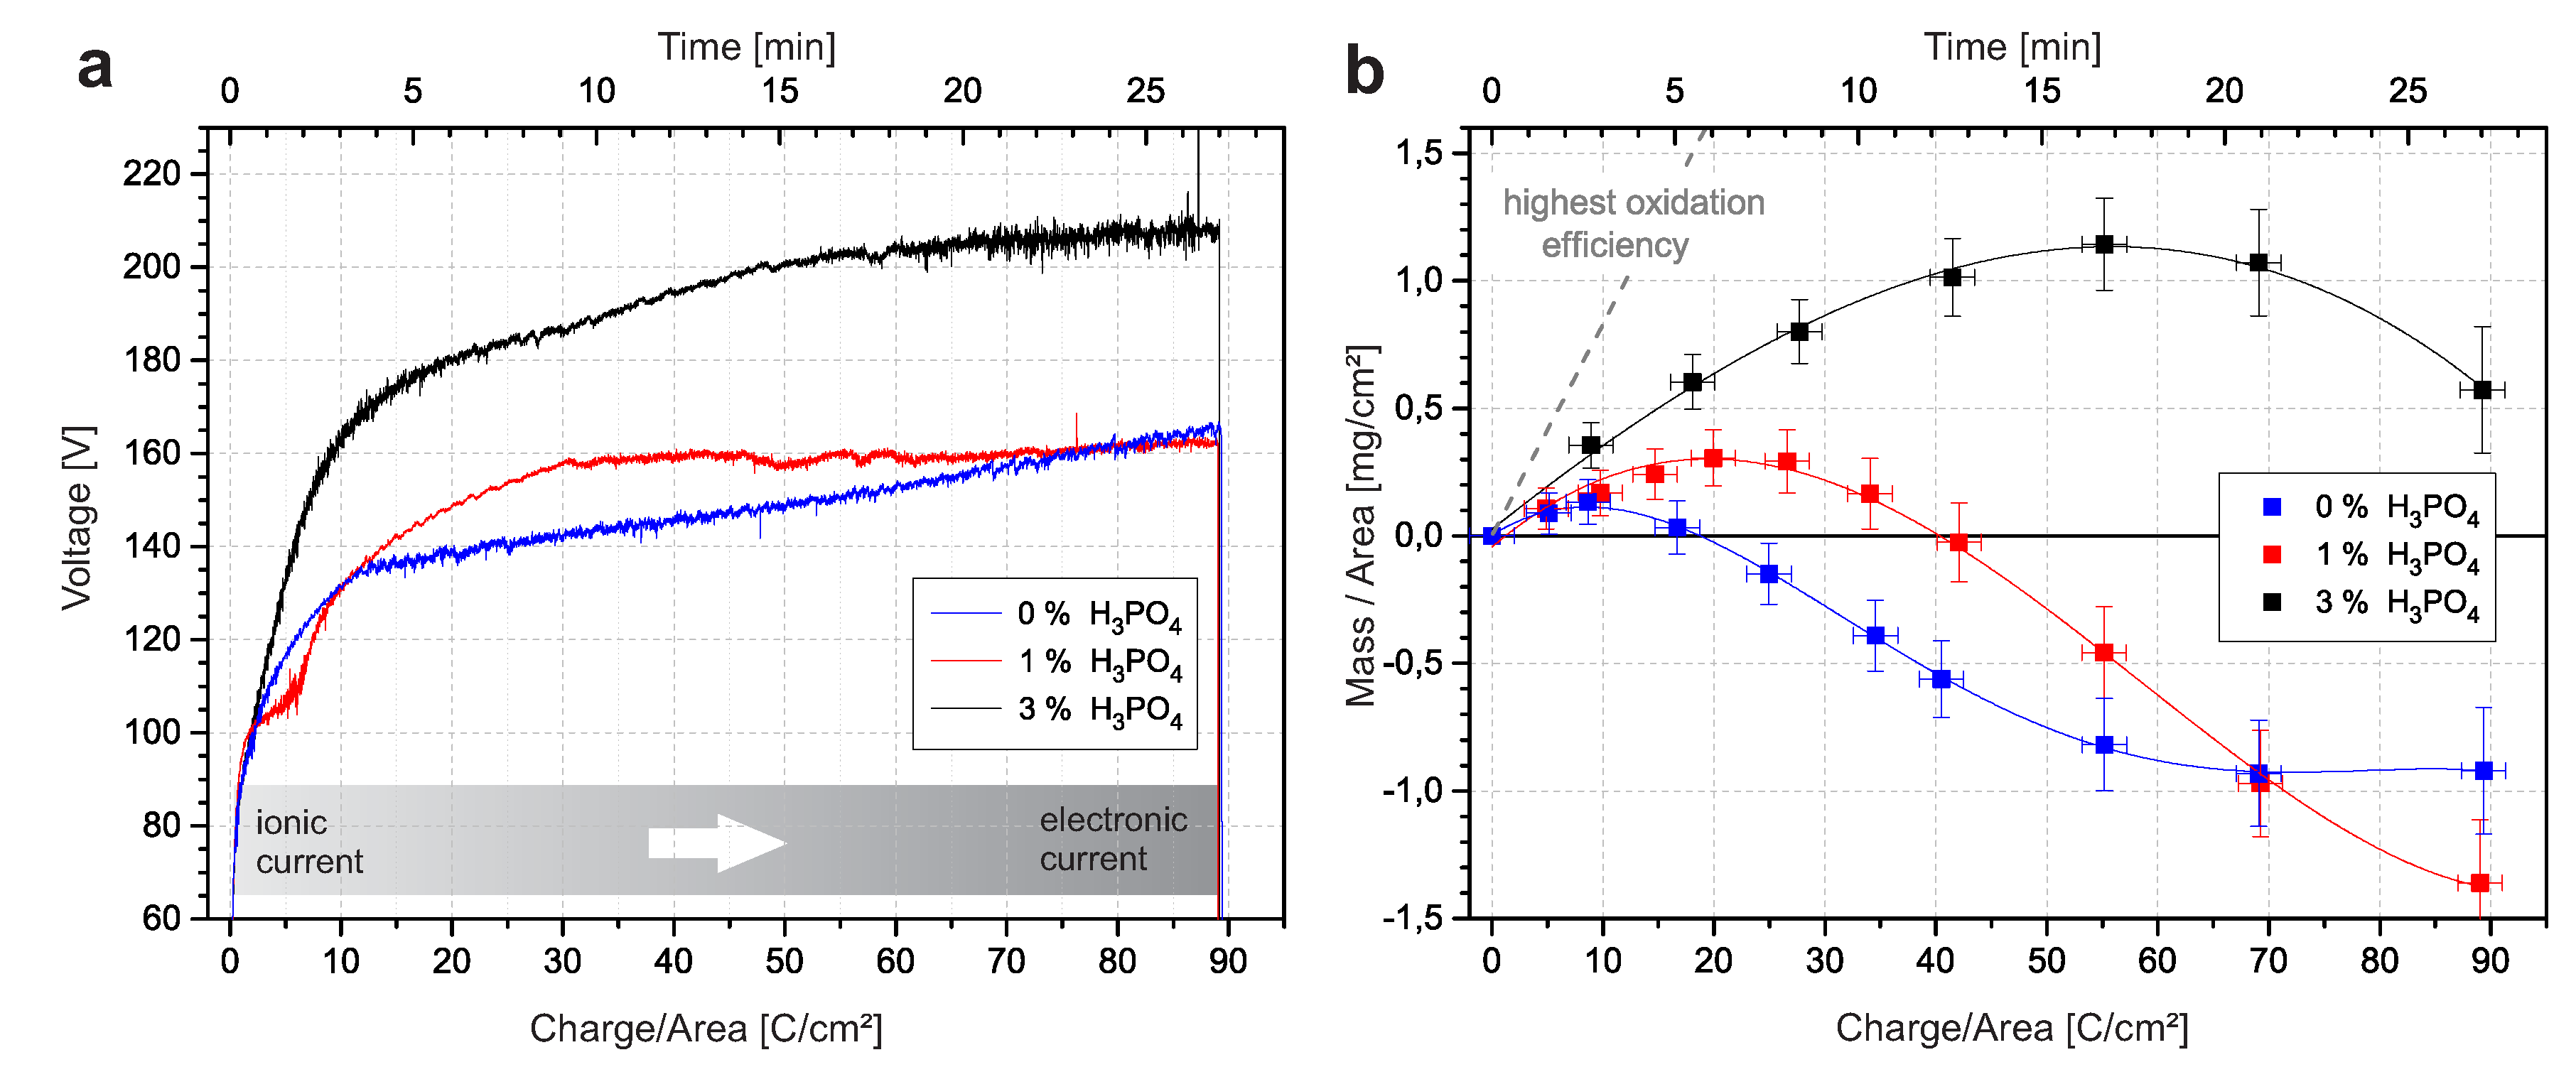
The voltage response of the PEO process in 12.9 M HSO, as shown in Figure 1a, reveals information about the current character. The ratio between electronic and ionic currents varies during the PEO process. In the beginning, the electric field was insufficient to cause electric breakdowns, and conventional anodic oxidation occurs. The ionic current predominated and promoted the formation of a dielectric oxide layer. Consequently, the cell resistance increased. The constant current was sustained by the rapid increase in applied voltage. Above a critical voltage, electrical breakdowns become visible by electroluminescence. The charge transfer by breakdowns represents an electronic current and is energetically favored compared with ion migration. The electronic current increasingly contributes to the total current. Eventually, a linear voltage region is reached, which indicates a mainly electronic current character. This linear stage is also known as the microarc stage [9,12].
The impact of breakdowns on oxide formation was further investigated by terminating the process at different charge densities and determining the mass change, presumably due to oxide formation, with an analytical balance. Figure 1b presents the mass change with varying charge densities. The slope of the polynomial fit represents the mass change per transferred charge, i.e., the oxide formation efficiency [13]. The efficiency for 0% HPO was positive until 8.4 C/cm, after which it was negative. This turning point corresponded to the beginning of the linear microarc stage. This indicates that breakdowns during the microarc stage in concentrated sulfuric acid cause mass loss of the oxide. The initial passivation by breakdowns transforms into a destructive reforming with combined mass loss.
The progress drastically changed by adding small amounts of HPO to concentrated sulfuric acid. The voltage response for n(HPO)/n(HSO) = 1% in Figure 1a already differed from the voltage response in pure HSO. The transition from ionic to electronic current was also observable by the subsequent decreasing voltage rate. However, it was less pronounced. The interruption of the steep increase between 1.5 and 7 C/cm is due to the previously reported transition from a grooved morphology to a porous morphology [13,14]. The mass loss in Figure 1b was suppressed compared with samples prepared in pure HSO. The efficiency was positive until 19.4 C/cm. Shortly after the efficiency changes to negative values, the microarc region started, and no noticeable voltage gain occurred. Hence, the applied voltage was sufficient to sustain the defined current density, even though the oxide formation efficiency in this region (Figure 1b) was negative. Therefore, a steady state between repassivation of the dielectric layer and its destruction by breakdowns can be assumed.
With 3% phosphoric acid, the trend continued more drastically. Higher voltages, even above 200 V, were necessary to sustain the given current density. The transition from ionic to electronic currents was completed even later, while the mass change was always positive. At approximately 55.8 C/cm, the efficiency changed from positive to negative values, and the microarc region started. However, above approximately 70 C/cm, inhomogeneities were visible on the oxide surface and restricted the process in 3% HPO at higher charge densities.
3.2. XRD Investigation
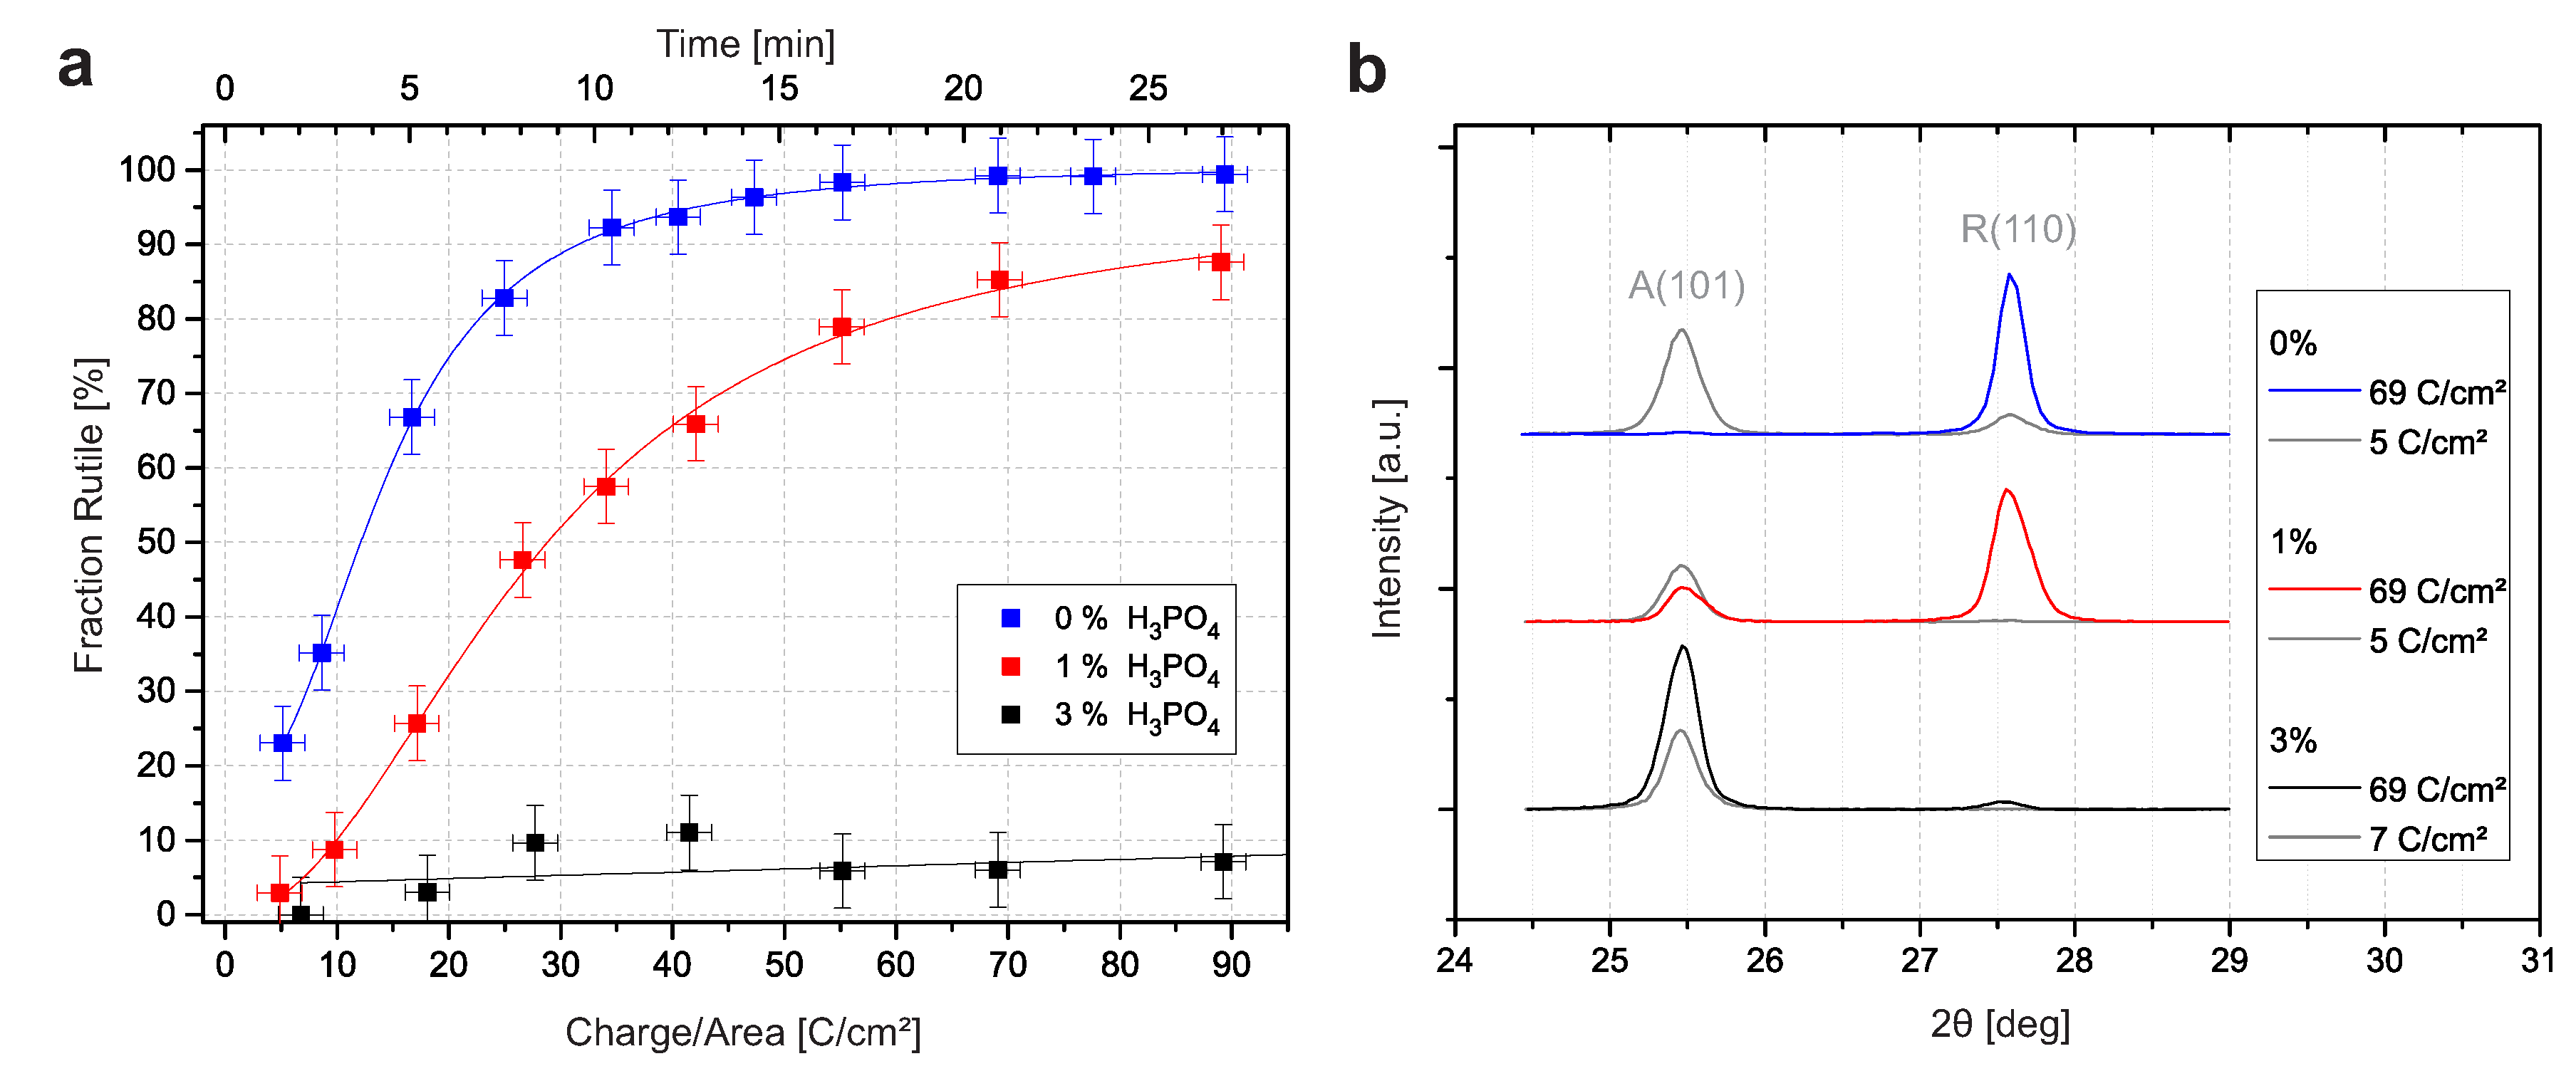
The crystallographic structure of the oxide was investigated by X-ray diffraction (XRD). The weight fraction of rutile can be estimated for each sample by using the (101) reflection of anatase and the (110) reflection of rutile [7,15]. Figure 2 presents the calculated rutile fraction for different charge densities. The rutile fraction in the sample prepared with 0% HPO increased continuously with the charge density until the sample was almost exclusively rutile. The titanium reflections of the titanium substrate decreased continuously as a result of the growing oxide layer [7]. The transition was similar in 1% HPO, but it was less pronounced. At a low charge density, mainly anatase was present, and the rutile fraction increased with increasing charge density. However, the maximum value and the slope of the fitted curve are smaller. For 3% HPO, our findings were remarkably different, and the typical increase in the rutile to anatase fraction was no longer identified. The fraction was below 11% for any charge density.
3.3. SEM Surface Images
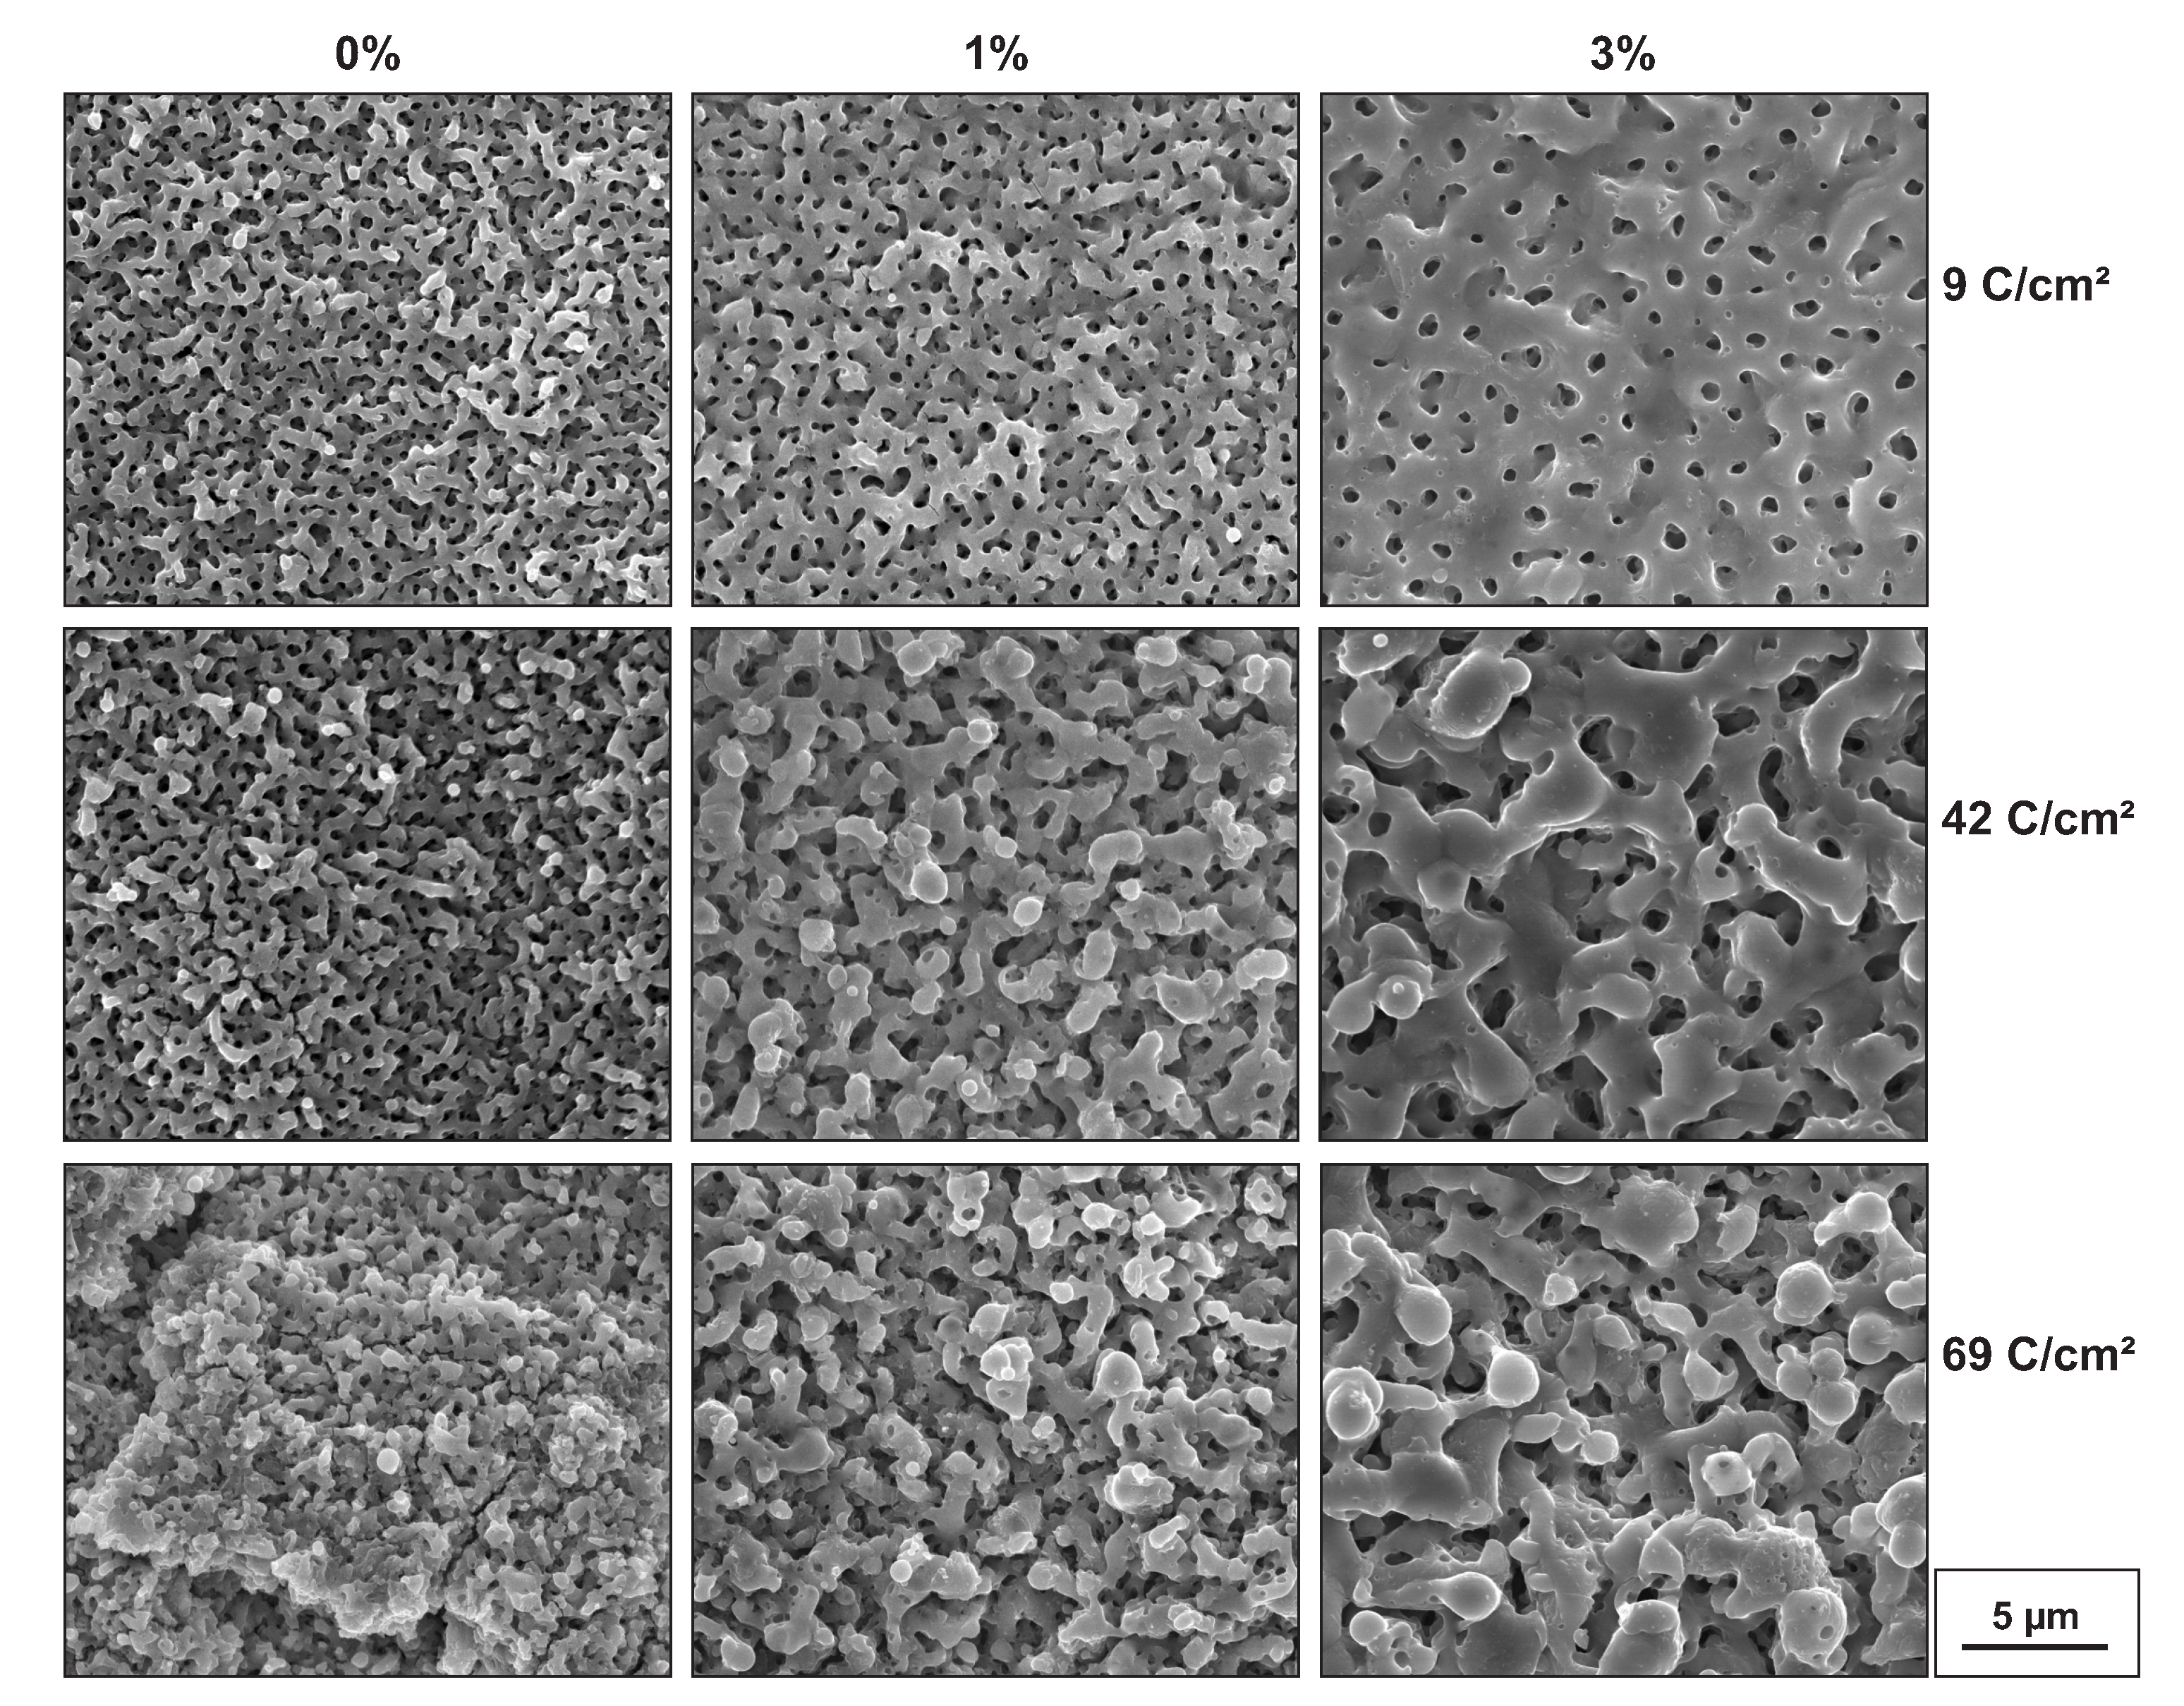
The scanning electron microscope (SEM) images of surfaces in Figure 3 demonstrate the modification of surfaces resulting from variations in the transferred charge and the amount of HPO. In the left column, the surfaces of samples prepared with 0% HPO are shown. Since the breakdown voltage was already exceeded for 9 C/cm, circular sinkholes of former discharge channels, i.e., micropores, were clearly visible. However, the even distribution caused the surface to appear regular and flat. With increasing charge transfer, the surface became rougher. At 41 C/cm, some minor plateaus and some cracks were noticeable. For 69 C/cm, plateaus and cracks were clearly visible and impaired the circular shape of pores.
In the second column, the surfaces of the samples prepared in 1% HPO are shown. The porous structure remained apparent. However, the pore size increased, and the pore density decreased. As observed previously, the pore network dissolved at a higher charge density, and different levels of depth evolved. In the right column, the surfaces of samples prepared in 3% HPO are presented. The pore size further increased, and the density further decreased. The destructive character of the breakdowns can be observed, although it was less pronounced compared with the samples prepared in 0% or 1% HPO.
3.4. SEM Cross Sections
The result of our SEM cross section investigation in Figure 4 shows the depth profile of the oxides. The total thickness distinctly increased with the fraction of phosphoric acid in the electrolyte. Values were approximately 5.0 for 0%, 7.3 for 1%, and 10.9 for 3% (±0.5 ). Different layers could be distinguished in the oxide layer because they abruptly changed in morphology or elemental composition. Two layers were as described for PEO in sulfuric acid: a compact layer beside the titanium substrate with a relatively small thickness and a porous layer with a major contribution to the total thickness [7,16]. Furthermore, in Figure 4c, a smooth area in the near the surface was clearly distinguishable from the porous layer below.
3.5. EDX Images
While the compact layer is rather difficult to resolve in the SEM cross section image, it is clearly identifiable by its elemental composition. This is shown in Figure 5 by the energy-dispersive X-ray spectroscopy (EDX) images. Remarkably, the compact layer in all samples exhibited an increased sulfur concentration of approximately 1.1 ± 0.3 at % (while it was below 0.3 ± 0.3 at % in the remaining oxide). In samples prepared with HPO, an increased phosphor concentration throughout the oxide could be detected. For 3% HPO, the value is approximately 1.9 ± 0.3 at %. In comparison, the phosphor concentration in a sample produced in 1% HPO amounted to 0.6 ± 0.3 at %. Another feature was detectable in the sample produced in 3% HPO and less pronounced in the sample produced in 0% HPO: a smooth area near the surface was observed in several samples and independent of the electrolyte composition. The EDX analysis in Figure 5a,c reveals that the region exhibited an increased titanium concentration, while the oxygen and phosphor concentration decreased.
3.6. Confocal Raman Microscopy
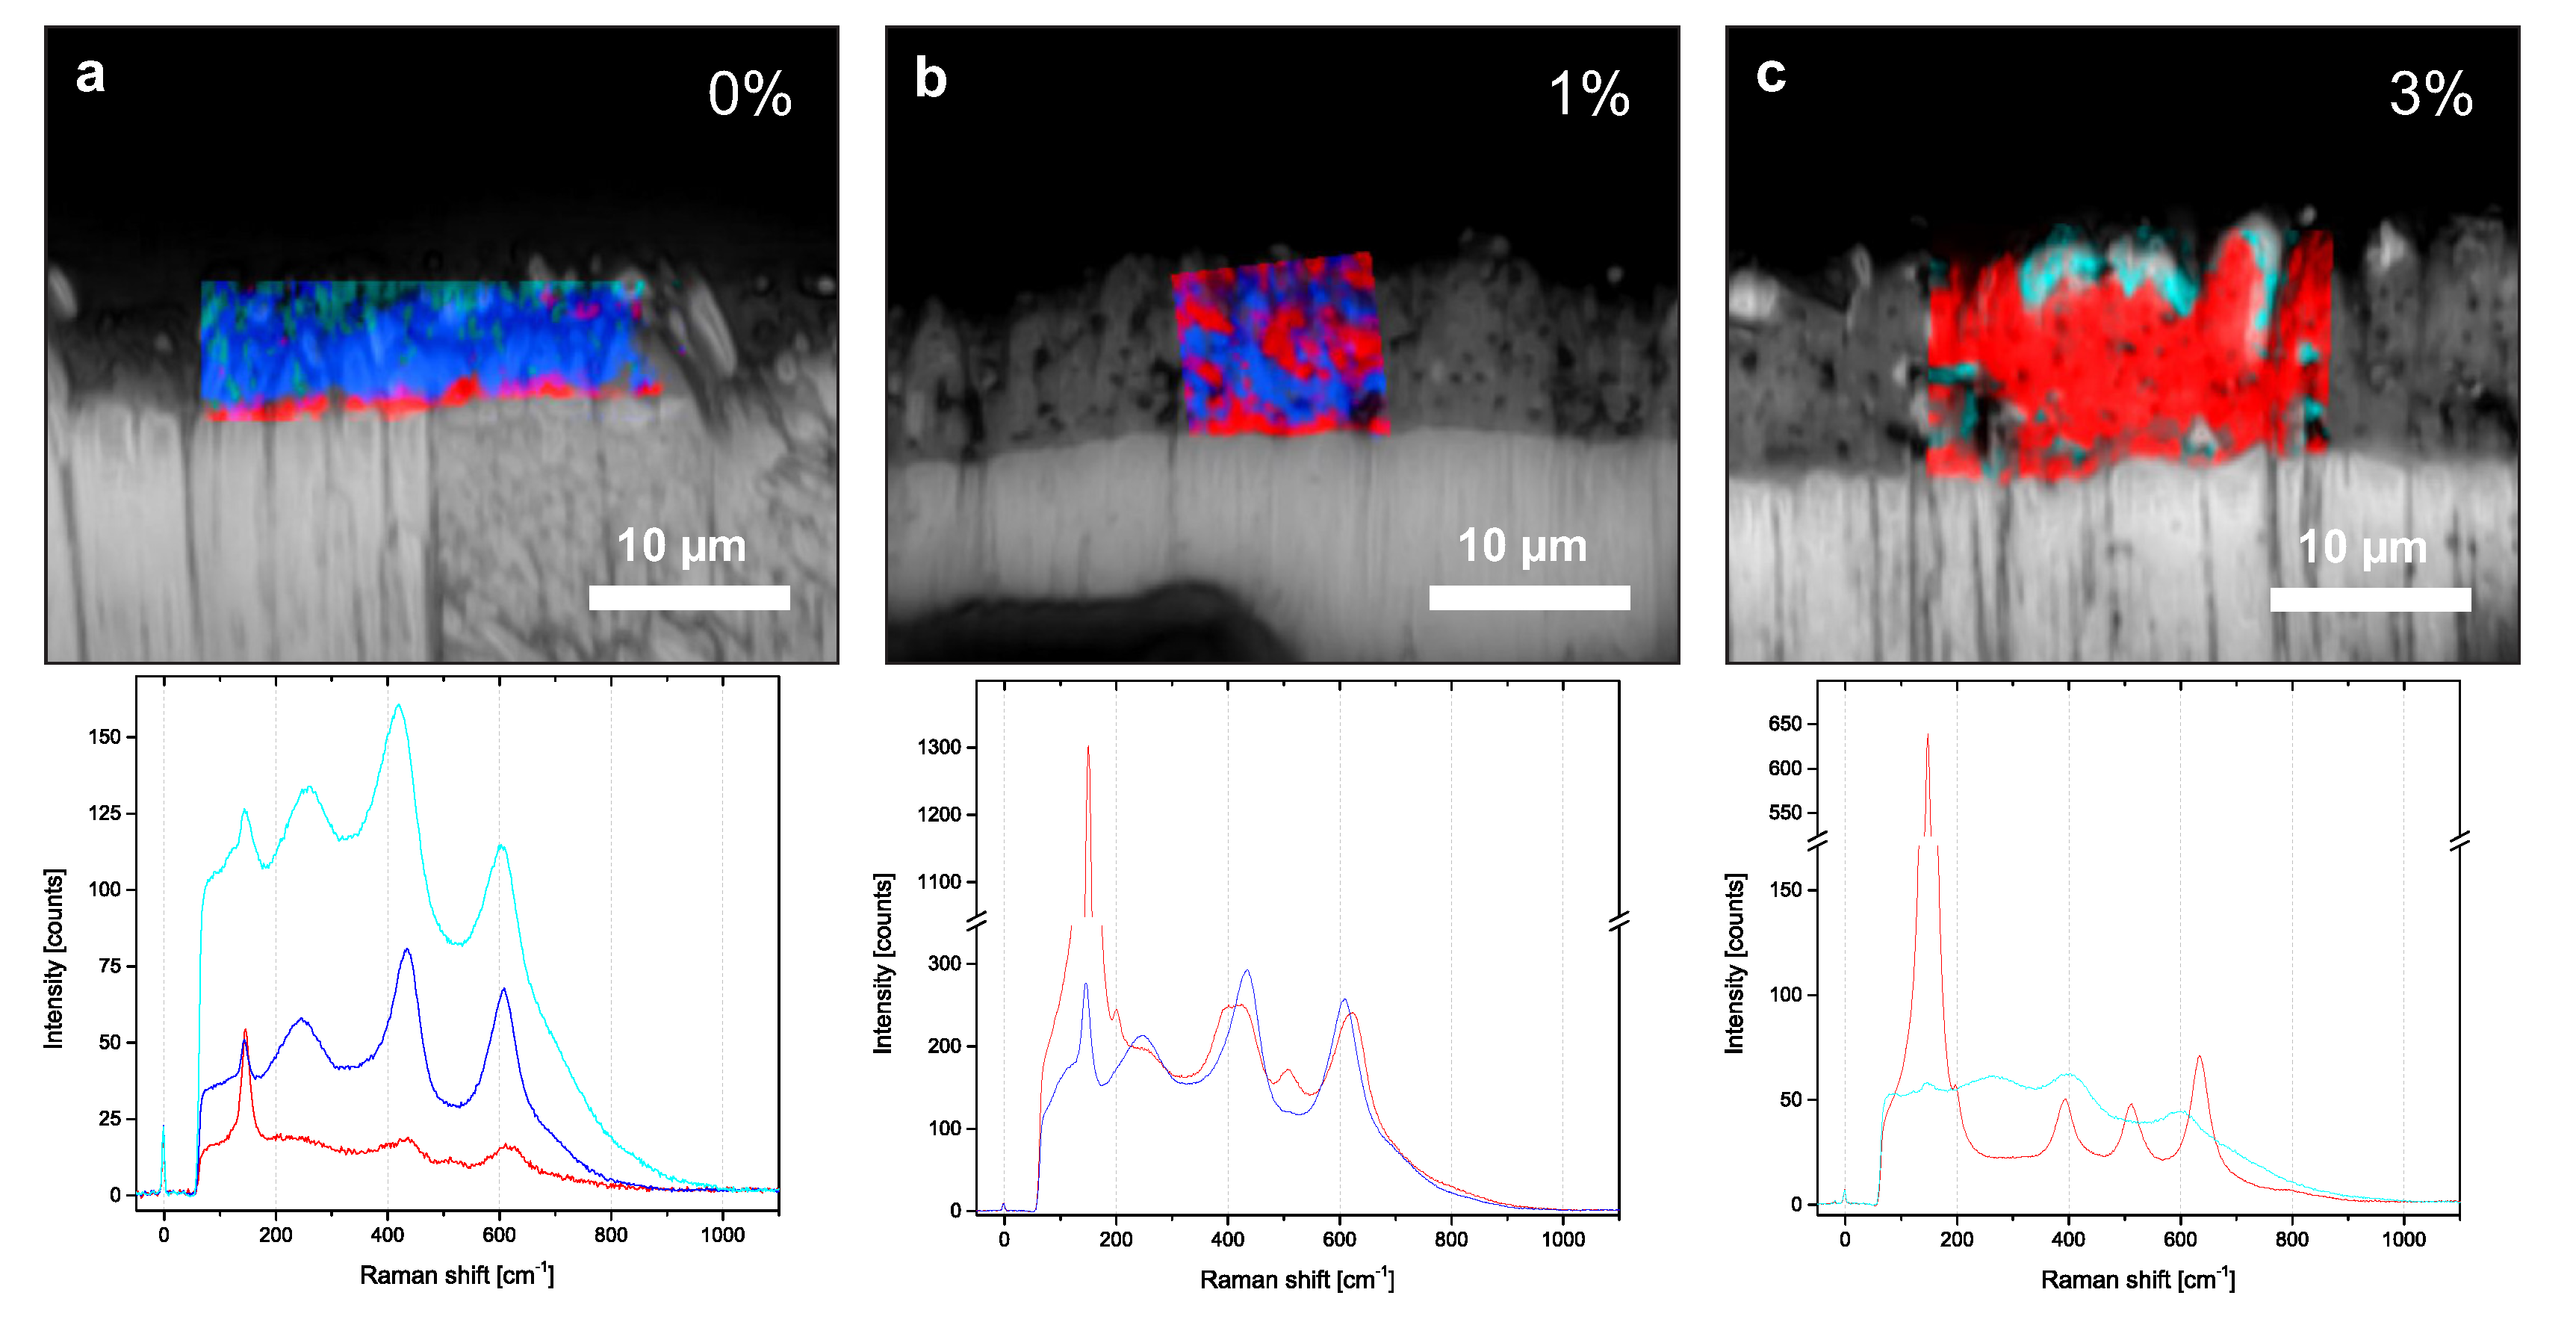
Since a common drawback of XRD phase analysis is the low spatial resolution, we additionally performed confocal Raman microscopy. Figure 6 shows false-color images, which are derived from Raman microscopy of cross sections prepared with 41.3 ± 1.0 C/ in mixtures with 0%, 1%, and 3% additional HPO. The surrounding background image is the result of light microscopy. The different colors in the false-color images indicate the types of Raman spectra, which are presented below. The anatase phase is recognized by an intense E mode around 147 cm[17]. Additionally, Raman-active modes derived from anatase around 395 cm (B), 515 cm (B and A), and 637 cm (E) are used for classification [7]. The rutile phase can be identified by two Raman modes around 442 cm (E) and 605 cm (A) [7].
Without HPO, the porous layer mainly exhibited rutile, while a distinct anatase fraction could be identified from the spectra of the compact layer. For 1% HPO, the colored areas, which indicate anatase and rutile, were similar in size and homogeneously distributed. For 3%, the intensities of the rutile modes in the spectra vanished. The entire oxide mainly exhibited anatase. For 0% and 3%, small areas near the surface were marked with cyan and fitted the previously mentioned smooth area in our SEM and EDX images. The corresponding cyan spectra resembled the spectra from rutile. However, it clearly differed by a frequency shift and an increased background signal, which may have originated from near-surface groups.
4. Discussion
Our results demonstrate that adding phosphoric acid to concentrated sulfuric acid as an electrolyte has a drastic influence on oxide formation in PEO. With 1% or 3% additional phosphoric acid, higher potentials are necessary to sustain the constant current density. This indicates an enhanced dielectric layer in terms of electrical resistance, with either increased thickness or higher electrical resistivity. The SEM cross sections confirm an increasing thickness. The promoted oxidation is associated with the mass gain in Figure 1b, which is mainly negative in 12.9 M HSO, partly positive with 1% HPO, and positive for all investigated charge densities with 3% HPO.
While oxide formation is promoted, breakdown effects are inhibited by adding HPO, which results in diminished breakdowns [10,14]. One indicator is the suppressed surface destruction, as shown in Figure 3. Breakdowns may cause plasma oxidation; however, almost all electric energy is used for ionization, water vaporization, joule heating, and gas evolution, especially in the microarc region [18]. As a consequence, plateaus and cracks evolve on the surface. After adding HPO to the electrolyte, these effects decrease. Closely related is the mentioned mass loss in Figure 1b. It is assumed that the mass loss is promoted by breakdowns. Since the mass change becomes positive with additional HPO, lower breakdown intensity is expected.
Furthermore, reduced breakdown intensity can be identified from the phase composition. Rutile is a high-temperature modification and formed from anatase in an irreversible, time-dependent transformation [6]. In PEO, the energy for transformation is brought into the system by electrical breakdowns. When breakdowns diminish in the process, transformation is reduced or even disabled [7]. Results derived from the XRD analysis in Figure 2 show that the rutile fraction decreases with an increasing amount of HPO. Confocal Raman microscopy data, as presented in Figure 6, confirm this observation. Our results suggest that the energy liberated by breakdowns decreases with an increasing amount of HPO. With even higher concentrations of HPO, it is assumed that the crystallization is further inhibited and that even the anatase fraction is reduced [19].
In our discussion of the impact of additional HPO, we must consider that the concentrations of both acids decrease if one mixes appropriate amounts of HSO (75 wt%) and HPO (25 wt%). For example, when adjusting a fraction of n(HPO)/n(HSO) = 3%, the resulting concentration of HSO is 11.4 M, while the concentration of HPO is 0.3 M. To understand the dilution influence of HSO, we conceived a PEO experiment with 11.4 M HSO. As a result, no significant change in the breakdown character was observed. In conclusion, the additional HPO causes the drastic change observed in the PEO process.
To rationalize our findings, we correlated the impact of additional HPO in 12.9 M HSO to the corrosion of titanium in the electrolyte. In pure HSO and the absence of an applied potential, the maximum corrosion rate is between 12.5 [20] and 13.7 M [21]. With an applied concentration of 12.9 M, a strong chemical etching can therefore be expected. In contrast, a simple corrosion experiment without applied potential in 12.9 M HSO with 3% HPO clearly demonstrates that the corrosion rate drastically decreases. A possible explanation is that solvated HPO anions preferentially adsorb onto the anodic area. A similar effect is known to occur for corrosion inhibitors in HSO[20]. As a consequence of the preferential adsorption, the active area is blocked for the more reactive HSO anions.
The concept of the described corrosion behavior can be applied to our PEO experiment. In 12.9 M, the breakdowns are exceptionally strong, whereas the breakdowns are suppressed in a mixture with 3% HPO. We assume that, during PEO, the preferential adsorption of HPO anions blocks the anodic surface for HSO anions, which tend to favor breakdowns instead of ion migration. Hence, destructive breakdowns and the related corrosion are suppressed, which directly reduces the mass loss in the process, as confirmed by our mass investigation in Figure 1b. Leach and Sidgwick proposed that the different behaviors of SO and PO are the result of their different molecular charges [22], which is plausible since the electrical field in PEO is exceptionally high.
Furthermore, the high HPO anion adsorption to the anodic surface leads to the preferred incorporation of HPO anions. This is in accordance with our EDX investigation, which reveals an increased concentration of phosphor species compared with the low sulfur concentration in the oxide. Similarly, earlier studies have confirmed that phosphorous or phosphate ions penetrate more easily through the titanium oxide layer during anodization compared with sulfur or sulfate ions [19]. Certainly, these phosphorous species contribute to the high mass gain in Figure 1b for electrolytes with additional HPO.
With the favored incorporation of HPO anions, enhanced ion migration can be assumed, which increases the fraction of the ionic current. Because of the constant current mode in our process, the total current density always remains constant. When ionic migration is promoted, the total current in the process comprises less electronic current, i.e., breakdowns. Therefore, the additional HPO reinforces the inhibition of breakdowns.
The reduced electronic current has a major impact on the oxide layer. According to the literature, two effects limit the lifetime of a discharge. On the one hand, the expansion of gases in the channel lead to cooling, and the plasma collapses [23]. On the other hand, the gas forms a bubble on top of the channel; thus, it increases the electrical resistivity of the channel and terminates the plasma [4,18]. The formation of a new plasma is prevented while the gas is inside and above the channel. When the gas escapes, the electrolyte fills the void [3]. As a consequence, the next discharge is created in the same channel. This hypothesis predicts that the current per channel per discharge is limited by the lifetime of the plasma channel.
According to our results, more charge compensation in the form of breakdowns occurs in pure HSO compared with mixtures containing 1% or 3% HPO. As a consequence of the limited charge transfer per discharge in a single channel, more channels are necessary for higher charge compensation. Hence, the pore density increases compared with surfaces prepared in mixtures with 1% or 3% HPO, as shown in the SEM images in Figure 3. On the other hand, fewer channels for charge compensation by breakdowns are necessary in mixtures with HPO. Hence, the pore density decreases. However, the pore size increases in mixtures with HPO because of recurring breakdowns in identical channels.
It should be noted that anatase is the predominant phase in the compact layer for all investigated samples. Previous studies confirm our conclusion that the thin compact layer is composed of nanocrystalline anatase [8,24]. The dense compact layer likely evolves from a temperature gradient [9]. The thermal mass of the titanium substrate enables the rapid cooling of the plasma. Hence, the time is too short and the temperature is too low for the phase transformation to rutile for an anatase-to-rutile transformation, and therefore, only a nanocrystalline anatase structure evolves. Also remarkable is the increased sulfur concentration in the compact layer, as seen in Figure 5. This may result from the electrolyte becoming trapped in interfacial nanopores during the fast cooling [14].
Another notable feature is apparent in the cross sections of several samples, which can be identified in our study in three ways. First, SEM cross section images, especially in Figure 4c, reveal a rather smooth morphology between the porous layer and the surface. Second, the EDX cross sections in Figure 5a,c show a different elemental composition compared with the porous layer in the previously mentioned region. Third, the Raman investigations in Figure 6a,c reveal a distinct change in the phase composition near the surface. We assume that this region originates from molten titanium, which is ejected from the channels and rapidly cools down in the vicinity of the electrolyte [25]. Because of quenching, oxide formation is suppressed, and consequently, oxide stoichiometry is not achieved. For this reason, we expect a predominant amorphous structure with small contributions of titanium dioxide phases.
5. Conclusions
Oxide coatings on titanium were produced in a galvanostatically controlled PEO process with a constant current density. With a concentrated 12.9 M HSO electrolyte as the starting material, small amounts of HPO were added to investigate the impact on oxide formation. Pure 12.9 M HSO is highly suitable for promoting breakdowns. With a higher charge density, breakdowns cause a destructive reforming and induce the phase transition from predominantly anatase to almost entirely rutile. Upon reaching 35 C/cm, the rutile to anatase fraction is over 90%.
By adding small amounts of HPO, i.e., 1% or 3%, breakdown effects are drastically reduced. The rutile fraction in the process does not exceed 11%, even for charge transfers as high as 89 C/cm. The drastic change is explained by the preferential adsorption of HPO anions to the anodic area. Therefore, the HPO anions block the surface for more reactive HSO anions and suppress breakdowns. The enhanced concentration of HPO anions at the surface reinforces their incorporation and, consequently, migration in the oxide layer. Therefore, the ionic current in the process increases, and the electronic current fraction, including breakdowns, decreases. With fewer breakdowns, the destructive reforming diminishes. Moreover, the increase in ion migration promotes oxide formation with increased thickness and mass gain of the oxide layers, which are produced in mixtures with HPO.
Author Contributions
B.F. designed, conceived, and performed the confocal Raman microscopy; B.E. designed, conceived, and performed the other experiments; B.E. validated and analyzed the results; K.S. supervised the project; B.E. wrote the paper. All authors have read and agreed to the published version of the manuscript.
Funding
We acknowledge support by the Heinrich Heine University Duesseldorf. This research was also supported by Bundesministerium für Wirtschaft und Energie (BMWi) under project no. ZF4185502ZG6.
Acknowledgments
We gratefully thank Denis Netschitailo for supplementary PEO experiments and related discussions.
Conflicts of Interest
The authors declare no conflict of interest.
References
- Diamanti, M.V.; Del Curto, B.; Pedeferri, M. Anodic oxidation of titanium: From technical aspects to biomedical applications. J. Appl. Biomater. Biomech. 2011, 9, 55–69. [Google Scholar] [CrossRef] [PubMed]
- El Achhab, M.; Schierbaum, K. Gas sensors based on plasma-electrochemically oxidized titanium foils. J. Sens. Syst. 2016, 5, 273–281. [Google Scholar] [CrossRef] [Green Version]
- Clyne, T.W.; Troughton, S.C. A review of recent work on discharge characteristics during plasma electrolytic oxidation of various metals. Int. Mater. Rev. 2018, 64, 1–36. [Google Scholar] [CrossRef] [Green Version]
- Rakoch, A.G.; Khokhlov, V.V.; Bautin, V.A.; Lebedeva, N.A.; Magurova, Y.V.; Bardin, I.V. Model concepts on the mechanism of microarc oxidation of metal materials and the control over this process. Prot. Met. 2006, 42, 158–169. [Google Scholar] [CrossRef]
- Yerokhin, A.; Nie, X.; Leyland, A.; Matthews, A.; Dowey, S. Plasma electrolysis for surface engineering. Surf. Coat. Technol. 1999, 122, 73–93. [Google Scholar] [CrossRef]
- Hanaor, D.A.H.; Sorrell, C.C. Review of the anatase to rutile phase transformation. J. Mater. Sci. 2011, 46, 855–874. [Google Scholar] [CrossRef] [Green Version]
- Engelkamp, B.; El Achhab, M.; Fischer, B.; Kökçam-Demir, I.; Schierbaum, K. Combined Galvanostatic and Potentiostatic Plasma Electrolytic Oxidation of Titanium in Different Concentrations of H2SO4. Metals 2018, 8, 386. [Google Scholar] [CrossRef] [Green Version]
- Mortazavi, G.; Jiang, J.; Meletis, E.I. Investigation of the plasma electrolytic oxidation mechanism of titanium. Appl. Surf. Sci. 2019, 488, 370–382. [Google Scholar] [CrossRef]
- Quintero, D.; Galvis, O.; Calderón, J.; Castaño, J.; Echeverría, F. Effect of electrochemical parameters on the formation of anodic films on commercially pure titanium by plasma electrolytic oxidation. Surf. Coat. Technol. 2014, 258, 1223–1231. [Google Scholar] [CrossRef]
- Friedemann, A.; Gesing, T.; Plagemann, P. Electrochemical rutile and anatase formation on {PEO} surfaces. Surf. Coat. Technol. 2017, 315, 139–149. [Google Scholar] [CrossRef]
- Schultze, J.; Lohrengel, M. Stability, reactivity and breakdown of passive films. Problems of recent and future research. Electrochim. Acta 2000, 45, 2499–2513. [Google Scholar] [CrossRef]
- Barati Darband, G.; Aliofkhazraei, M.; Hamghalam, P.; Valizade, N. Plasma electrolytic oxidation of magnesium and its alloys: Mechanism, properties and applications. J. Magnes. Alloy. 2017, 5, 74–132. [Google Scholar] [CrossRef]
- Galvis, O.; Quintero, D.; Castaño, J.; Liu, H.; Thompson, G.; Skeldon, P.; Echeverría, F. Formation of grooved and porous coatings on titanium by plasma electrolytic oxidation in H2SO4/H3PO4 electrolytes and effects of coating morphology on adhesive bonding. Surf. Coat. Technol. 2015, 269, 238–249. [Google Scholar] [CrossRef]
- Kern, P.; Zinger, O. Purified titanium oxide with novel morphologies upon spark anodization of Ti alloys in mixed H2SO4/H3PO4 electrolytes. J. Biomed. Mater. Res. 2007, 80A, 283–296. [Google Scholar] [CrossRef]
- Spurr, R.A.; Myers, H. Quantitative analysis of anatase-rutile mixtures with an X-ray diffractometer. Anal. Chem. 1957, 29, 760–762. [Google Scholar] [CrossRef]
- Fadl-Allah, S.A.; El-Sherief, R.M.; Badawy, W.A. Electrochemical formation and characterization of porous titania (TiO2) films on Ti. J. Appl. Electrochem. 2008, 38, 1459–1466. [Google Scholar] [CrossRef]
- Balachandran, U.; Eror, N.G. Raman spectra of titanium dioxide. J. Solid State Chem. 1982, 42, 276–282. [Google Scholar] [CrossRef]
- Troughton, S.C.; Nominé, A.; Nominé, A.V.; Henrion, G.; Clyne, T.W. Synchronised electrical monitoring and high speed video of bubble growth associated with individual discharges during plasma electrolytic oxidation. Appl. Surf. Sci. 2015, 359, 405–411. [Google Scholar] [CrossRef] [Green Version]
- Lee, J.H.; Kim, S.E.; Kim, Y.J.; Chi, C.S.; Oh, H.J. Effects of microstructure of anodic titania on the formation of bioactive compounds. Mater. Chem. Phys. 2006, 98, 39–43. [Google Scholar] [CrossRef]
- Abdel Hady, Z.; Pagetti, J. Anodic behaviour of titanium in concentrated sulphuric acid solutions. Influence of some oxidizing inhibitors. J. Appl. Electrochem. 1976, 6, 333–338. [Google Scholar] [CrossRef]
- Prando, D.; Brenna, A.; Diamanti, M.V.; Beretta, S.; Bolzoni, F.; Ormellese, M.; Pedeferri, M. Corrosion of titanium: Part 2: Effects of surface treatments. J. Appl. Biomater. Funct. Mater. 2018, 16, 3–13. [Google Scholar] [CrossRef] [Green Version]
- Leach, J.S.L.; Sidgwick, D.H. Anodix oxidation of Titanium. Metall. Corrosion Proc. 1981, 1, 82–85. [Google Scholar]
- Klapkiv, M.D. Simulation of synthesis of oxide-ceramic coatings in discharge channels of a metal-electrolyte system. Mater. Sci. 1999, 35, 279–283. [Google Scholar] [CrossRef]
- El Achhab, M.; Erbe, A.; Koschek, G.; Hamouich, R.; Schierbaum, K. A microstructural study of the structure of plasma electrolytically oxidized titanium foils. Appl. Phys. A 2014, 116, 2039–2044. [Google Scholar] [CrossRef]
- Mohedano, M.; Lu, X.; Matykina, E.; Blawert, C.; Arrabal, R.; Zheludkevich, M. Plasma electrolytic oxidation (PEO) of metals and alloys. Encycl. Interfacial Chem. 2018, 6, 423–438. [Google Scholar]
Figure 1.
Process information at different charge densities for 0%, 1%, and 3% additional HPO in 12.9 M HSO: (a) voltage response and (b) mass change with interpolation and marked highest oxidation efficiency.
Figure 1.
Process information at different charge densities for 0%, 1%, and 3% additional HPO in 12.9 M HSO: (a) voltage response and (b) mass change with interpolation and marked highest oxidation efficiency.

Figure 2.
(a) Rutile to anatase fractions (with interpolation) versus the charge density for samples prepared with 0%, 1%, and 3% additional HPO in 12.9 M HSO. The fractions are derived from XRD intensities. (b) Representative diffractograms of chosen samples with high and low current densities.
Figure 2.
(a) Rutile to anatase fractions (with interpolation) versus the charge density for samples prepared with 0%, 1%, and 3% additional HPO in 12.9 M HSO. The fractions are derived from XRD intensities. (b) Representative diffractograms of chosen samples with high and low current densities.

Figure 3.
SEM images of sample surfaces produced in HSO with the addition of 0%, 1%, or 3% HPO. Samples produced with similar charge densities (±1.0 C/) are presented in the same row.
Figure 3.
SEM images of sample surfaces produced in HSO with the addition of 0%, 1%, or 3% HPO. Samples produced with similar charge densities (±1.0 C/) are presented in the same row.

Figure 4.
SEM images of oxide cross sections produced in HSO with the addition of 0% (a), 1% (b), and 3% (c) HPO. The charge density in all plasma electrolyte oxidation (PEO) processes is 41.3 ± 1.0 C/.
Figure 4.
SEM images of oxide cross sections produced in HSO with the addition of 0% (a), 1% (b), and 3% (c) HPO. The charge density in all plasma electrolyte oxidation (PEO) processes is 41.3 ± 1.0 C/.

Figure 5.
Energy-dispersive X-ray spectroscopy (EDX) images of oxide cross sections produced in 12.9 M HSO with 0% (a), 1% (b), and 3% (c) HPO. The transferred charge density is around 41.3 ± 1.0 C/ for each sample. The color intensity in the analyzed segment is only comparable to other elemental maps for the same cross section.

Figure 6.
False-color images derived from confocal Raman microscopy with underlying light microscopy images of three cross sections. The transferred charge density is around 41.3 ± 1.0 C/ for all cross sections, while the fraction of HPO in the electrolyte changes, i.e., 0% (a), 1% (b), and 3% (c). Red represents anatase, blue represents rutile, and cyan corresponds to a signal with large background. The integration time of each single spectrum varies, with 0.2 in 0%, 0.1 in 1%, and 0.05 in 3%. Averaged spectra from the corresponding color-marked area are shown below each cross section.

© 2020 by the authors. Licensee MDPI, Basel, Switzerland. This article is an open access article distributed under the terms and conditions of the Creative Commons Attribution (CC BY) license (http://creativecommons.org/licenses/by/4.0/).
Share and Cite
MDPI and ACS Style
Engelkamp, B.; Fischer, B.; Schierbaum, K. Plasma Electrolytic Oxidation of Titanium in H2SO4–H3PO4 Mixtures. Coatings 2020, 10, 116. https://doi.org/10.3390/coatings10020116
AMA Style
Engelkamp B, Fischer B, Schierbaum K. Plasma Electrolytic Oxidation of Titanium in H2SO4–H3PO4 Mixtures. Coatings. 2020; 10(2):116. https://doi.org/10.3390/coatings10020116
Chicago/Turabian StyleEngelkamp, Bernd, Björn Fischer, and Klaus Schierbaum. 2020. "Plasma Electrolytic Oxidation of Titanium in H2SO4–H3PO4 Mixtures" Coatings 10, no. 2: 116. https://doi.org/10.3390/coatings10020116
Note that from the first issue of 2016, this journal uses article numbers instead of page numbers. See further details here.