Article

Aryl Diazonium Chemistry for the Surface Functionalization of Glassy Biosensors

1
Department of Electrical and Computer Engineering, University of Alberta, Edmonton, Alberta, AB T6G 2V4, Canada
2
Department of Chemistry and National Institute for Nanotechnology, University of Alberta, Edmonton, Alberta, AB T6G 2G2, Canada
3
Department of Experimental Oncology, Cross Cancer Institute, University of Alberta, Edmonton, Alberta, AB T6G 1Z2, Canada
4
Department of Chemical and Materials Engineering, University of Alberta, Edmonton, Alberta, AB T6G 1H9, Canada
*
Author to whom correspondence should be addressed.
Biosensors 2016, 6(1), 8; https://doi.org/10.3390/bios6010008
Submission received: 2 February 2016 / Revised: 7 March 2016 / Accepted: 9 March 2016 / Published: 14 March 2016
(This article belongs to the Special Issue Micro- and Nano-Bio-Interfaces)

Abstract

:
Nanostring resonator and fiber-optics-based biosensors are of interest as they offer high sensitivity, real-time measurements and the ability to integrate with electronics. However, these devices are somewhat impaired by issues related to surface modification. Both nanostring resonators and photonic sensors employ glassy materials, which are incompatible with electrochemistry. A surface chemistry approach providing strong and stable adhesion to glassy surfaces is thus required. In this work, a diazonium salt induced aryl film grafting process is employed to modify a novel SiCN glassy material. Sandwich rabbit IgG binding assays are performed on the diazonium treated SiCN surfaces. Fluorescently labelled anti-rabbit IgG and anti-rabbit IgG conjugated gold nanoparticles were used as markers to demonstrate the absorption of anti-rabbit IgG and therefore verify the successful grafting of the aryl film. The results of the experiments support the effectiveness of diazonium chemistry for the surface functionalization of SiCN surfaces. This method is applicable to other types of glassy materials and potentially can be expanded to various nanomechanical and optical biosensors.

1. Introduction

Biological detection is of importance in many fields such as disease biomarker diagnosis and monitoring, drug discovery, and molecular identification [1,2,3,4,5,6,7]. For instance, the multiplexed assaying of proteins enables the understanding and diagnosis of complex diseases where traditional genomic assays are somewhat inadequate. Prions play a significant role in diseases, such as the Creutzfeldt-Jakob disease and transmissible spongiform encephalopathies [8,9]. In turn, peptides, such as the amyloid-beta (Aβ), are recognized causative agent of degenerative conditions such as Alzheimer’s disease [9,10,11]. Protein microarrays enable multiplexed assays and have been employed to quantify cancer cells and biomarkers [12,13]. In addition, protein misfolding cyclic amplification is used for the testing of prions and the diagnosis of related diseases [14,15,16,17]. The technique however involves multiple steps and is inappropriate for large scale screening.
Label-free biosensors have been looked upon as alternative platforms for such assays [18,19]. Such biosensors typically integrate a bio-recognition probe with a transduction system, as well as electronic systems such as signal amplifiers, processors, and display. Transduction platforms, such as quartz crystal microbalance (QCM) [20,21,22,23], micromechanical resonators [24,25,26,27,28,29,30], flow cytometry [18,31,32,33], amperometry [34,35,36,37,38], surface plasmon resonance (SPR) [39,40,41,42,43,44,45,46], and planar optical waveguides [47,48,49], have been investigated. In turn, numerous biological probes such as DNA [50], RNA [51], monoclonal [52,53] polyclonal antibodies [54], bacteriophages [35,55,56,57,58,59] and their binding proteins [58,60] have been leveraged to impart specificity to the transduction. Most of these sensing platforms involve the immobilization of the probe/target system onto a metallic or semiconducting surface. The last few years have however seen the emergence of alternate transduction mechanisms that rather involve the interaction of the analyte with an optical field propagating in glassy waveguides [61,62,63,64,65,66,67,68,69,70]. More specifically, fiber-optic sensors offer the advantages of miniaturization, multiple detection, low loss remote monitoring, and large information contents [69]. Further, advancement in the nanomachining of glasses [71,72] has enabled the realization glassy sensing nanostrings [73,74] as narrow as 8 nm [75].
The use of stable interfacial moieties offering strong adhesion, biocompatibility, protection against corrosion and long term stability is crucial to the realization of reliable biosensors [76,77,78]. Chemical bonding is usually preferred over simple physisorption as it provides better coverage and more stable linkage. Electrochemistry is commonly employed to insure optimal coverage and reliability. Electrochemical approaches are however only suitable for conductive and semi-conductive materials and are thus not applicable to the functionalization of insulating glasses. Electrochemistry also requires complex apparatus, can involve harsh chemicals and lead to the deterioration of the biological system [79,80]. Hence, a simpler, milder, versatile and biocompatible process for the linking of biomolecules onto glasses would be required.
A recently reported diazonium salt reduction induced aryl film grafting process represents a potent candidate for such applications [79,80]. This diazonium chemistry involves a single salt redox process, is implemented in aqueous solution at room temperature and does not require complicated equipment. The mild conditions involved insure process compatibility with pre-existing biological layers. Furthermore, diaznonium chemistry forms covalent bonding onto the surface, thus offers high thermal, mechanical and ambient stability. Moreover, this chemical modification is applicable to all types of materials, from metals to insulator, organic to inorganic.
We here report a diazonium salt induced aryl film grafting process to modify a novel SiCN glassy material [28,72,81,82] (Figure 1). Various surfaces, ranging from metal [83], semi-conductor [84] carbon [85,86] and non-conductive materials [79,80] can be modified by the reduction of aryldiazonium salts by either electrochemically or chemically. As shown in Figure 1, the surface modification is based on radical reactions. Reduction of diazonium salts generates reactive aryl radicals, which then bind to SiCN surfaces. This attachment of the aryl film on substrate surface is very stable [83]. The covalent interface bonding on carbon [87,88,89], graphene [90,91], silicon [92,93], copper [94], and gold [95,96,97] surfaces has thus been reported.
In a prior report, we employed such grafting process for the functionalization of resonant SiCN nanostrings [98]. In that work, the grafting was employed to covalently attach anti-rabbit IgG as a molecular probe. Specific enumeration of rabbit IgG was successfully performed through observation of downshifts of the resonant frequencies. In the work reported here, a similar grafting process is rather used to enable a sandwhich assay. More specifically, rabbit IgG binding assays are performed on the diazonium treated SiCN surface. Fluorescently-labelled rabbit IgG and gold nanoparticles (AuNPs) conjugated with rabbit IgG were used individually as markers to demonstrate the absorption of anti-rabbit IgG and further verify the successful use of aryl films for the functionalization of SiCN surfaces (Figure 2).

2. Results and Discussion

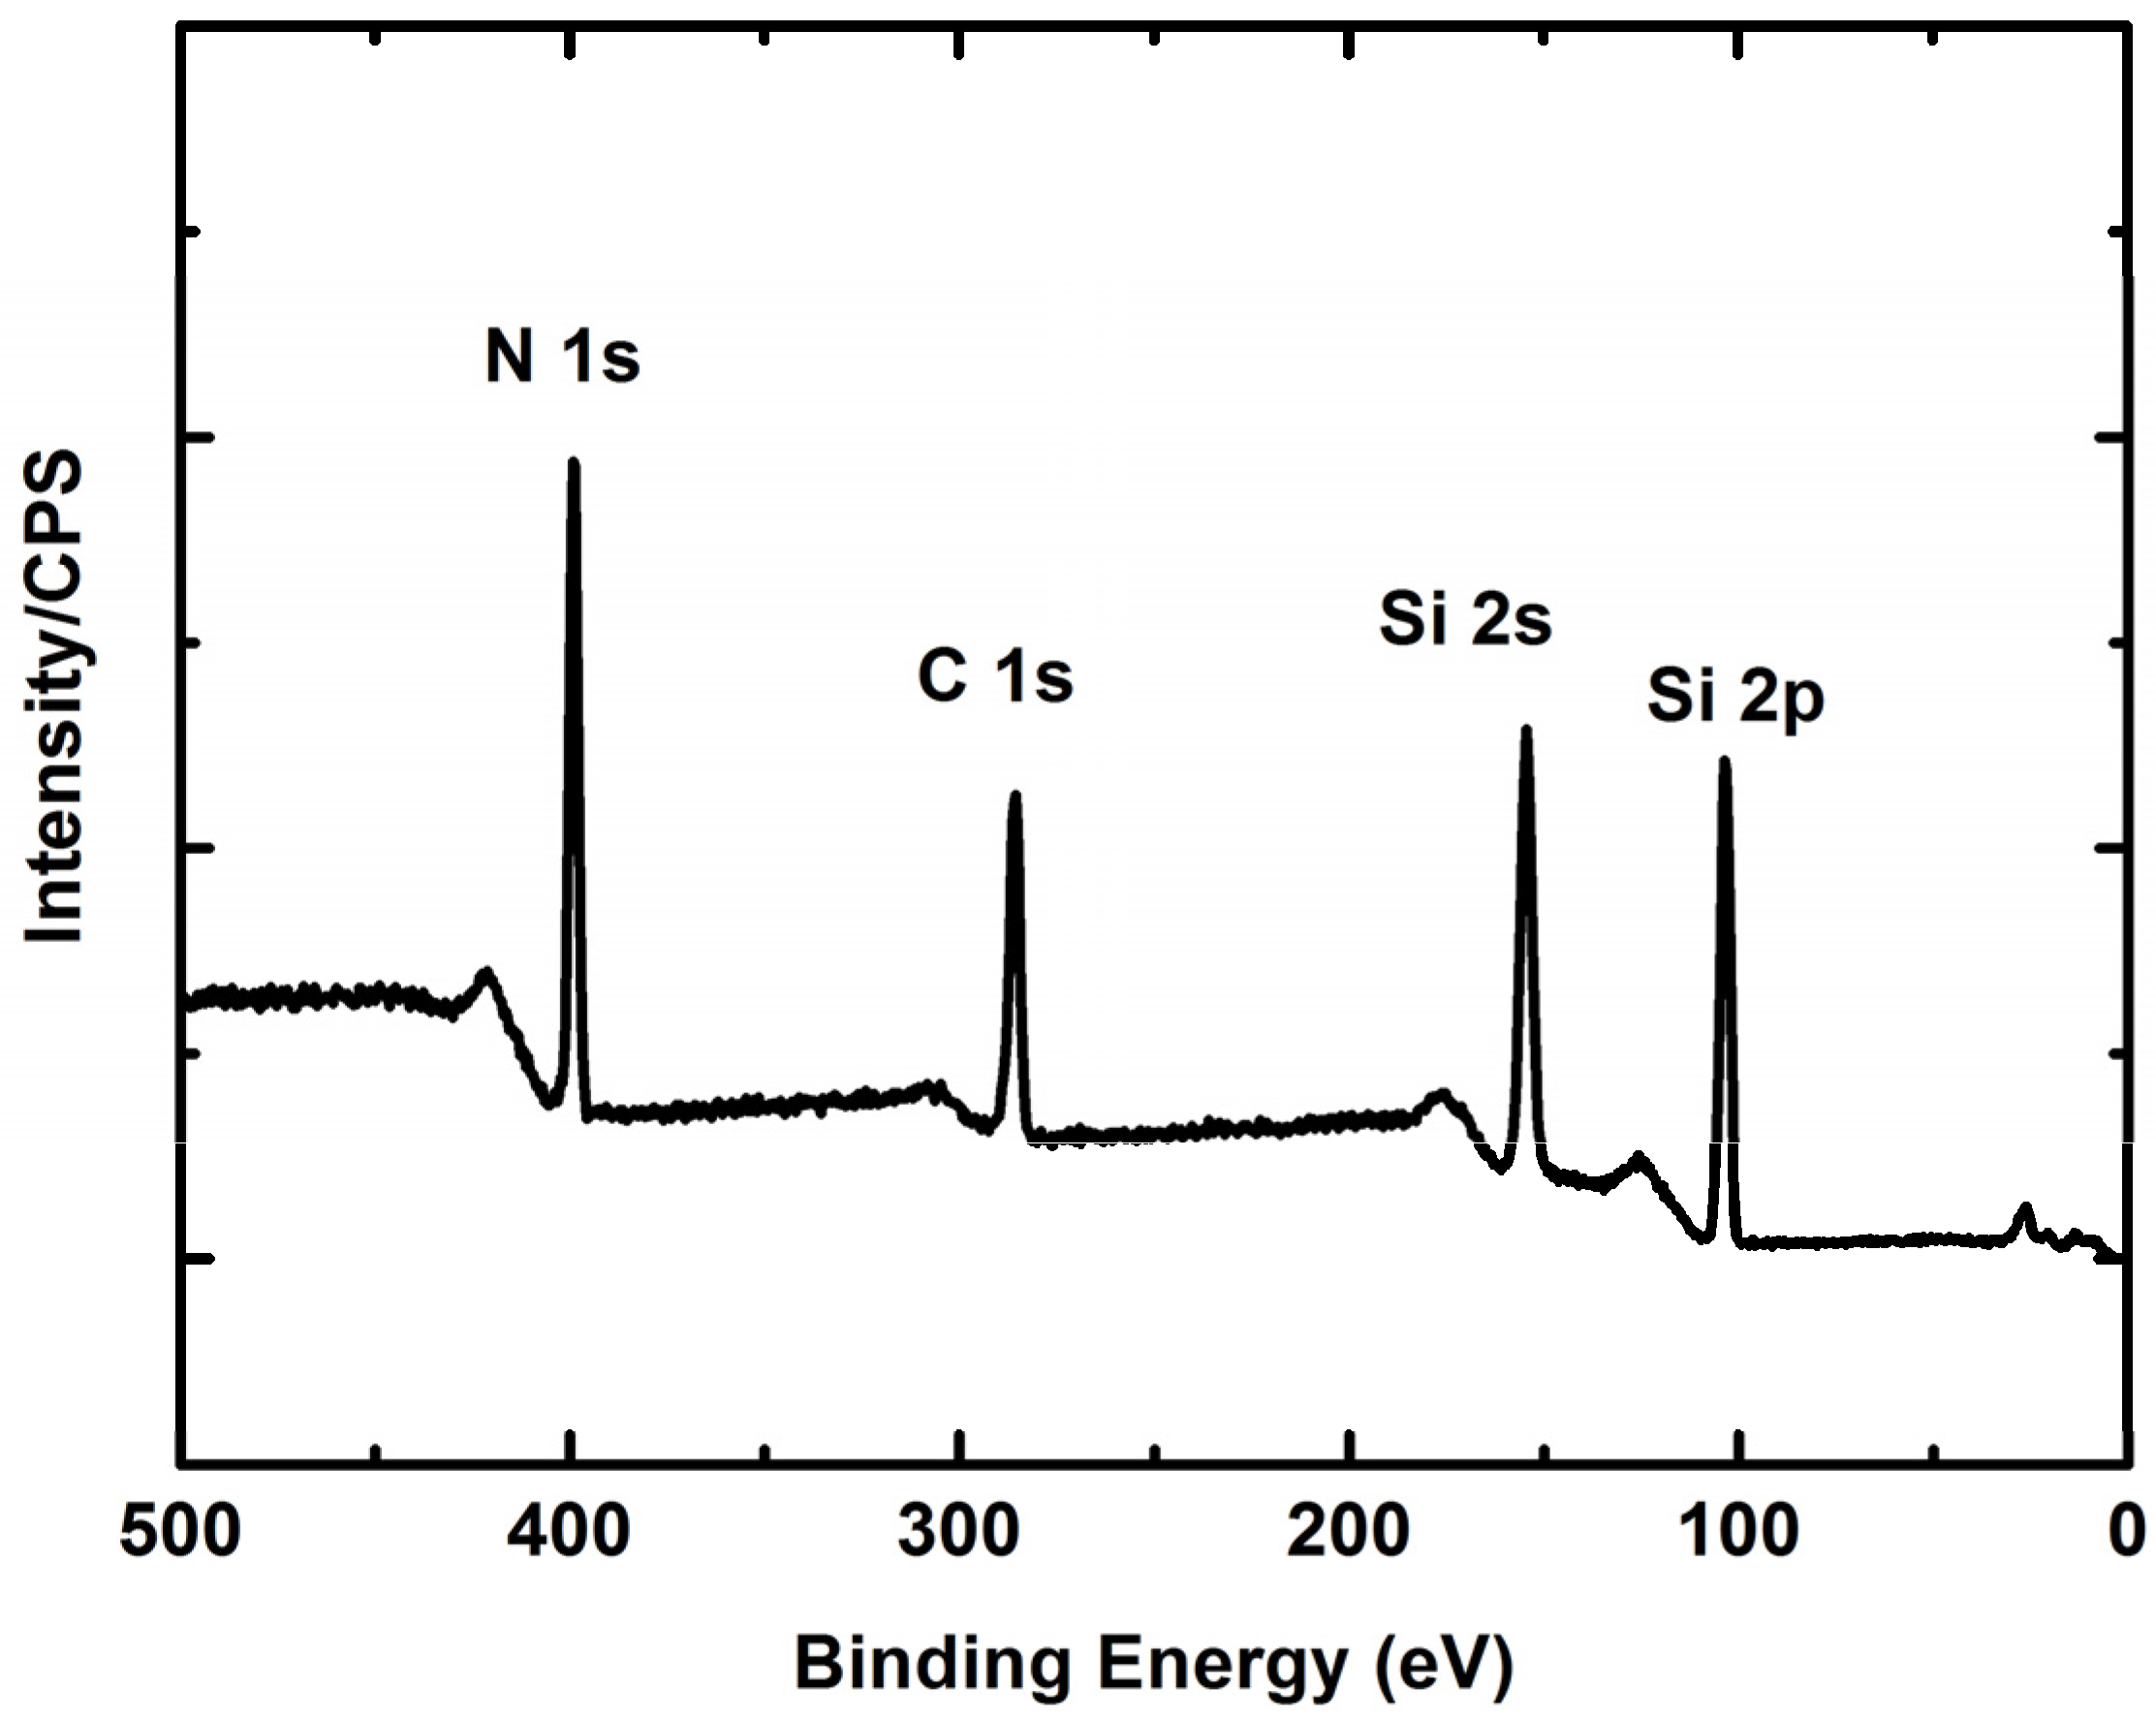
2.1. SiCN Film Composition

Figure 3 displays an X-ray photoelectron spectroscopy (XPS) survey of a typical SiCN film. Significant binding energy peaks are observed for silicon, carbon and nitrogen. Data analysis yields the quantitative elemental composition of the films (Table 1). The atomic Si:C:N composition ratio was roughly 4:3:3.

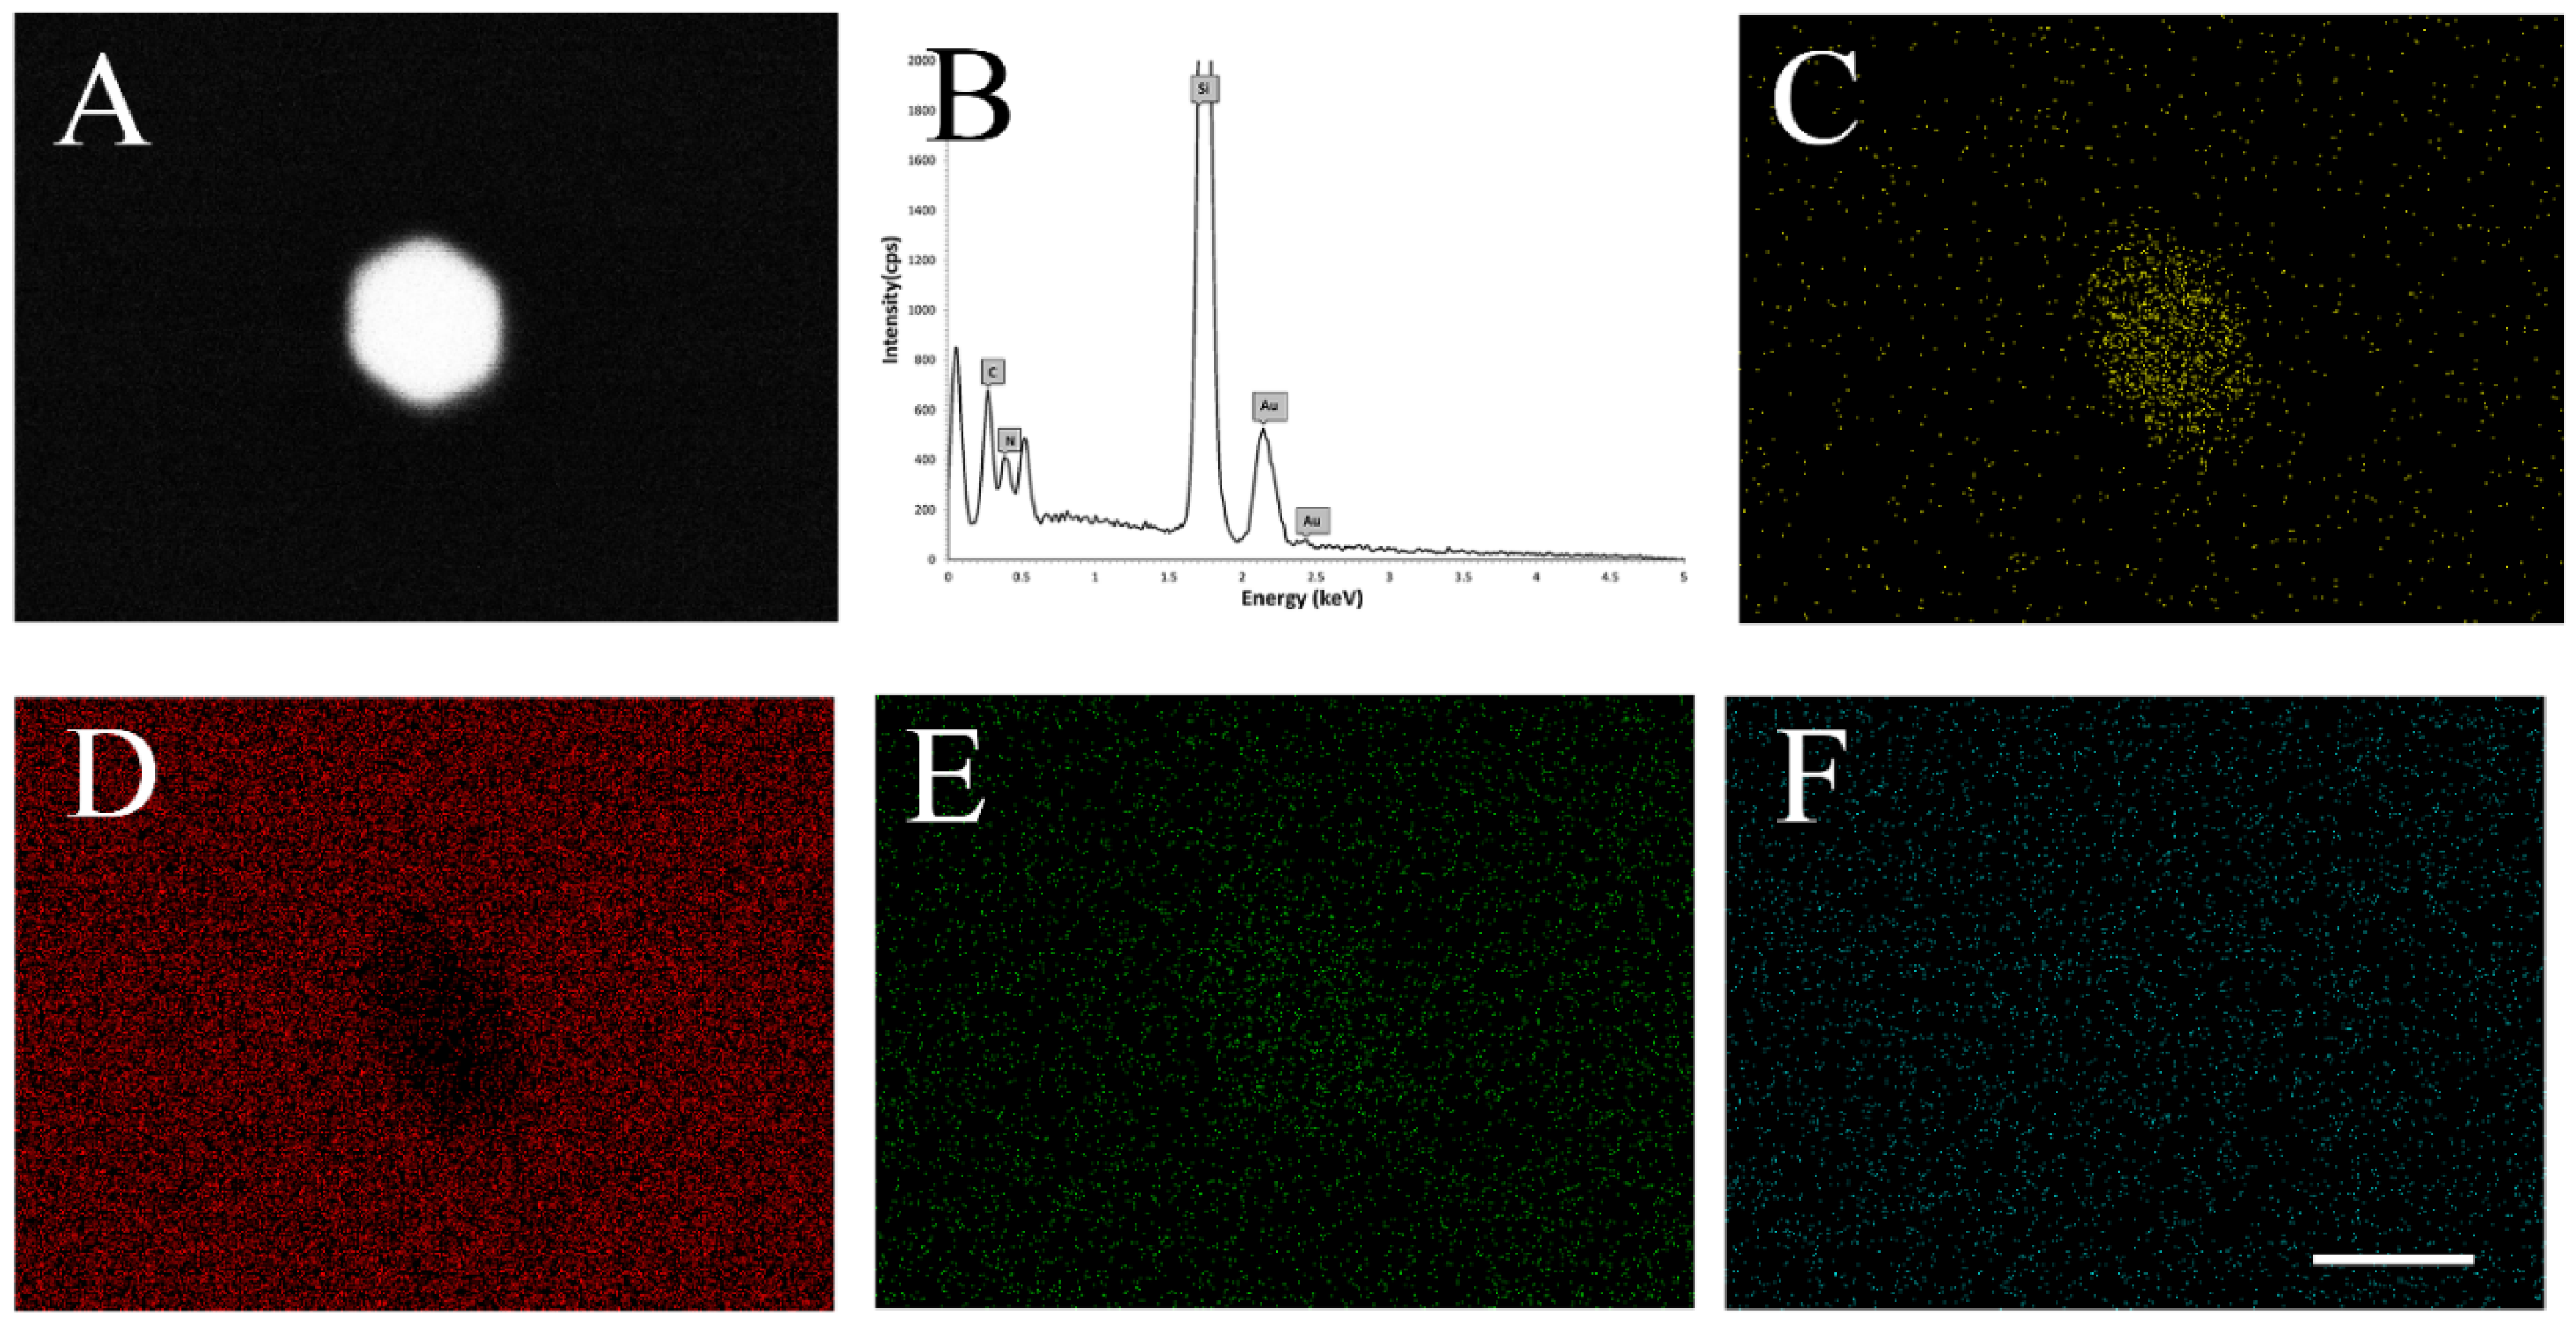
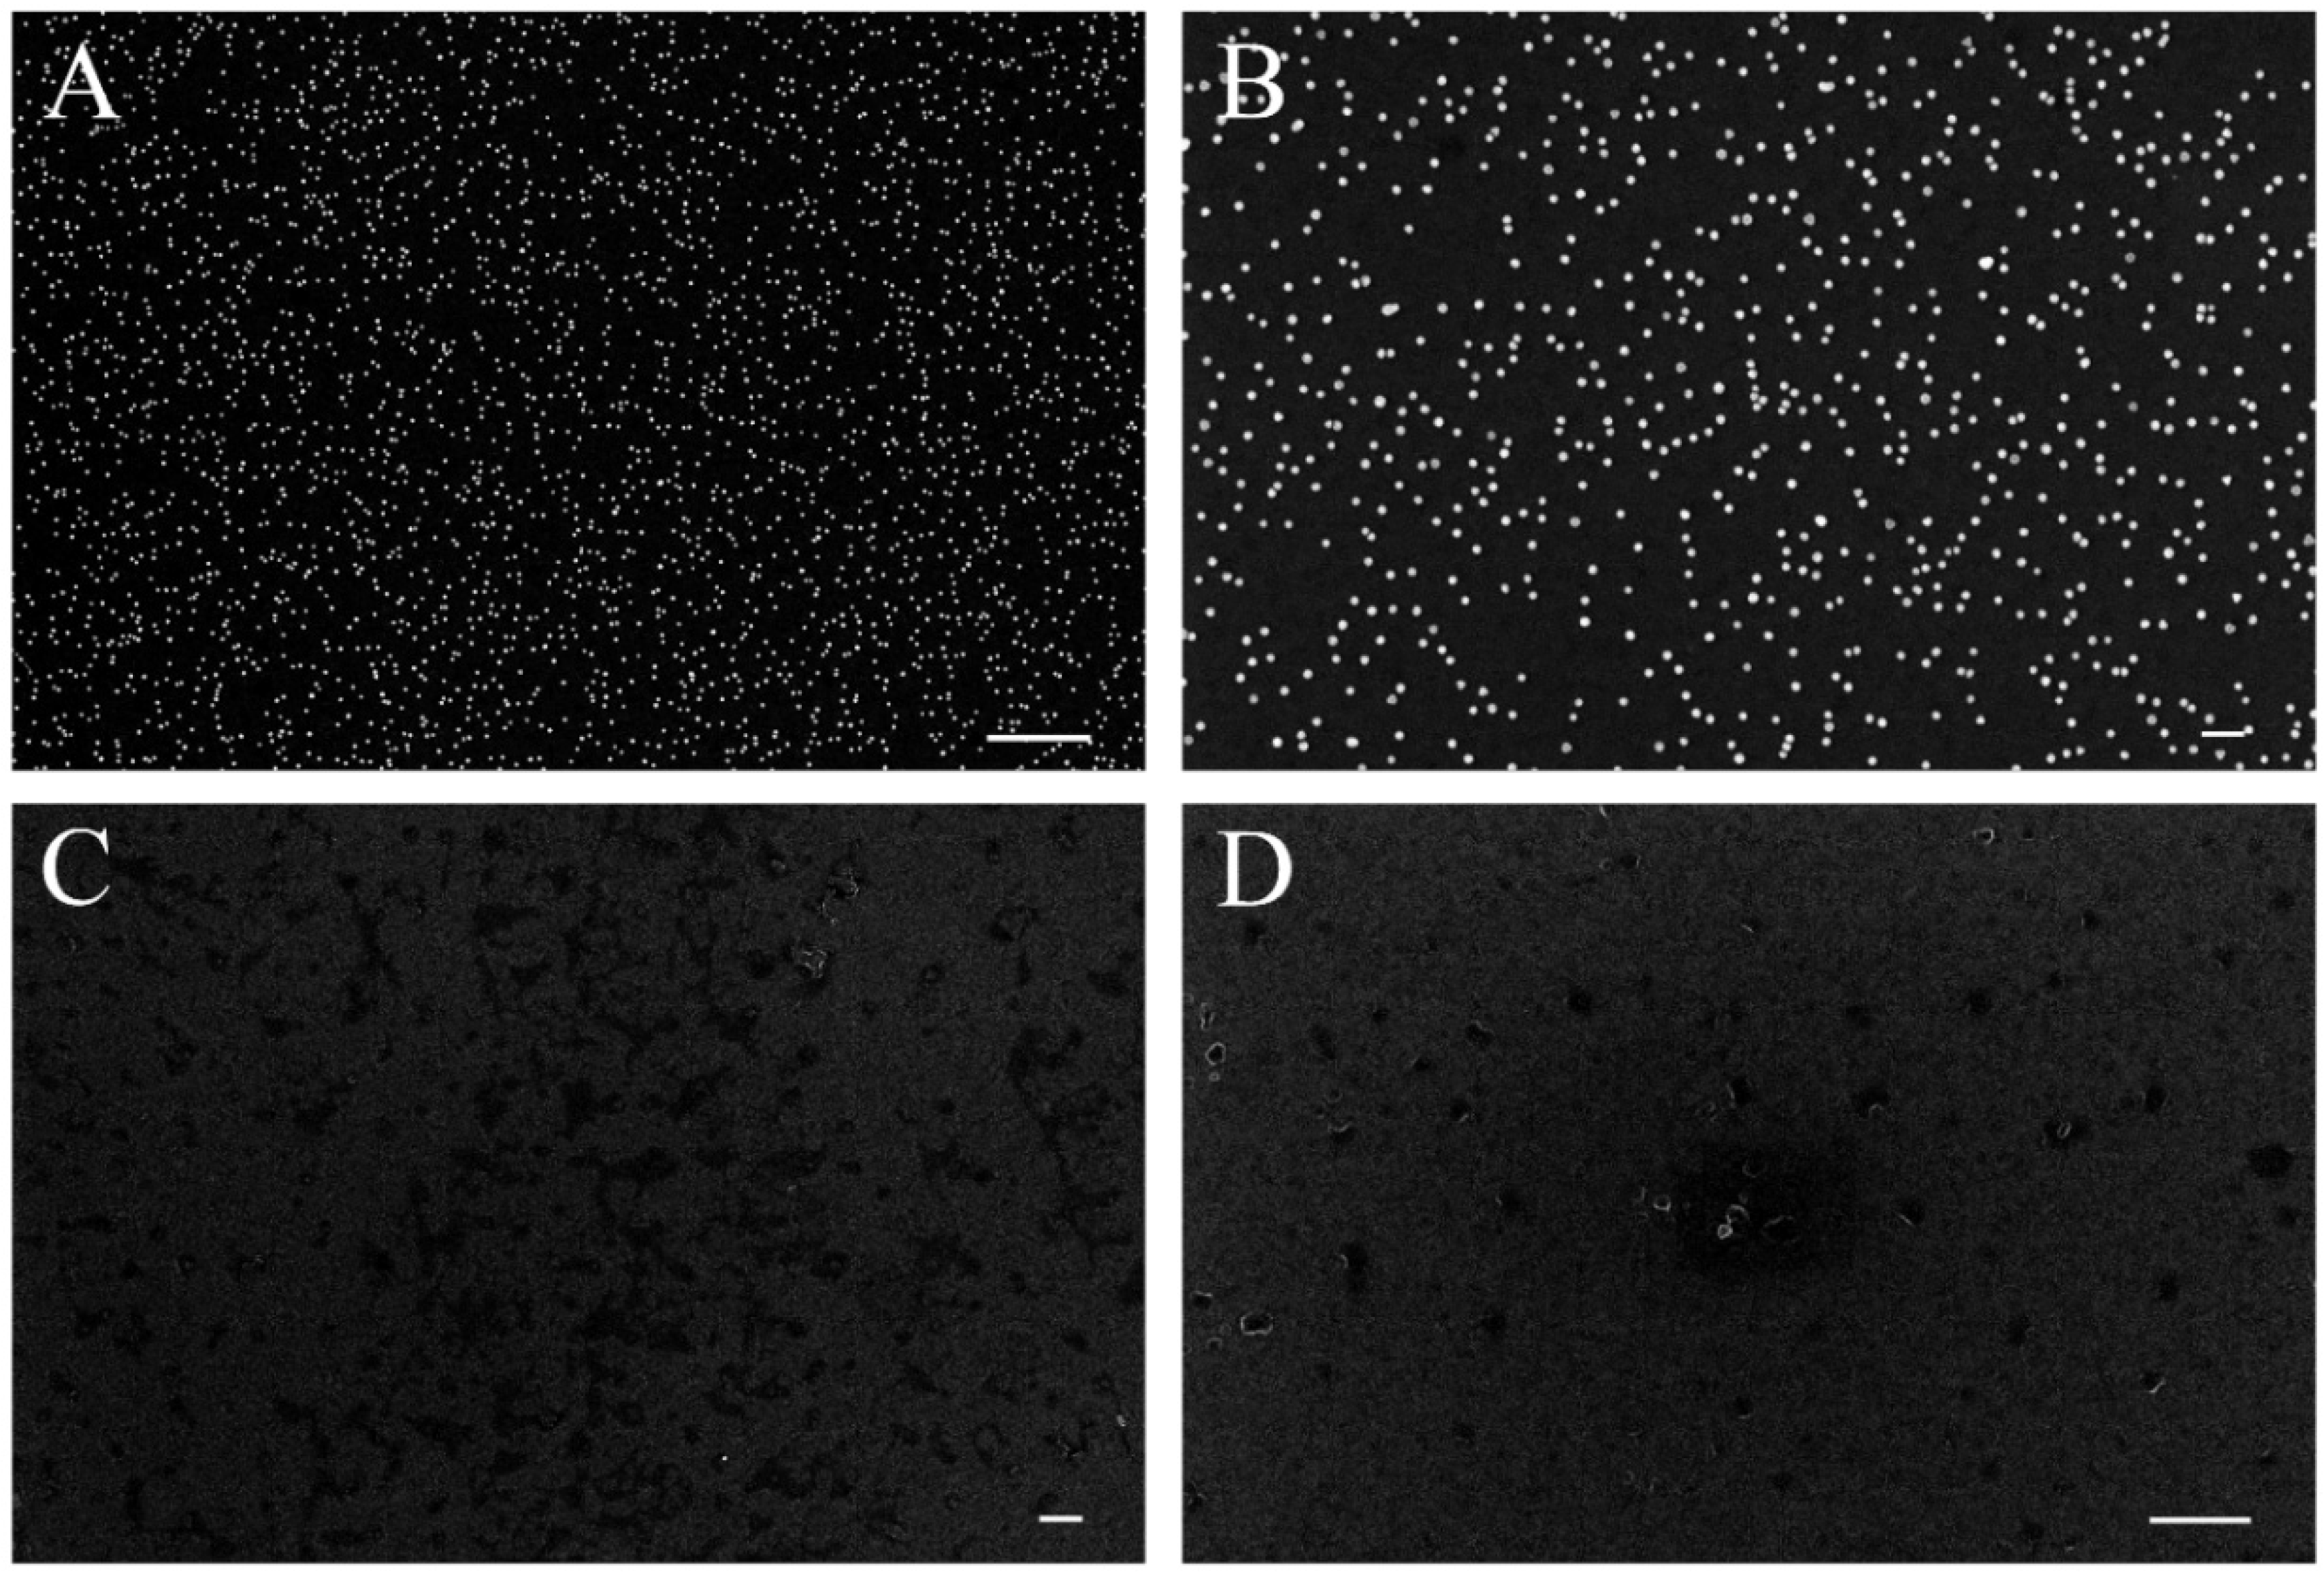
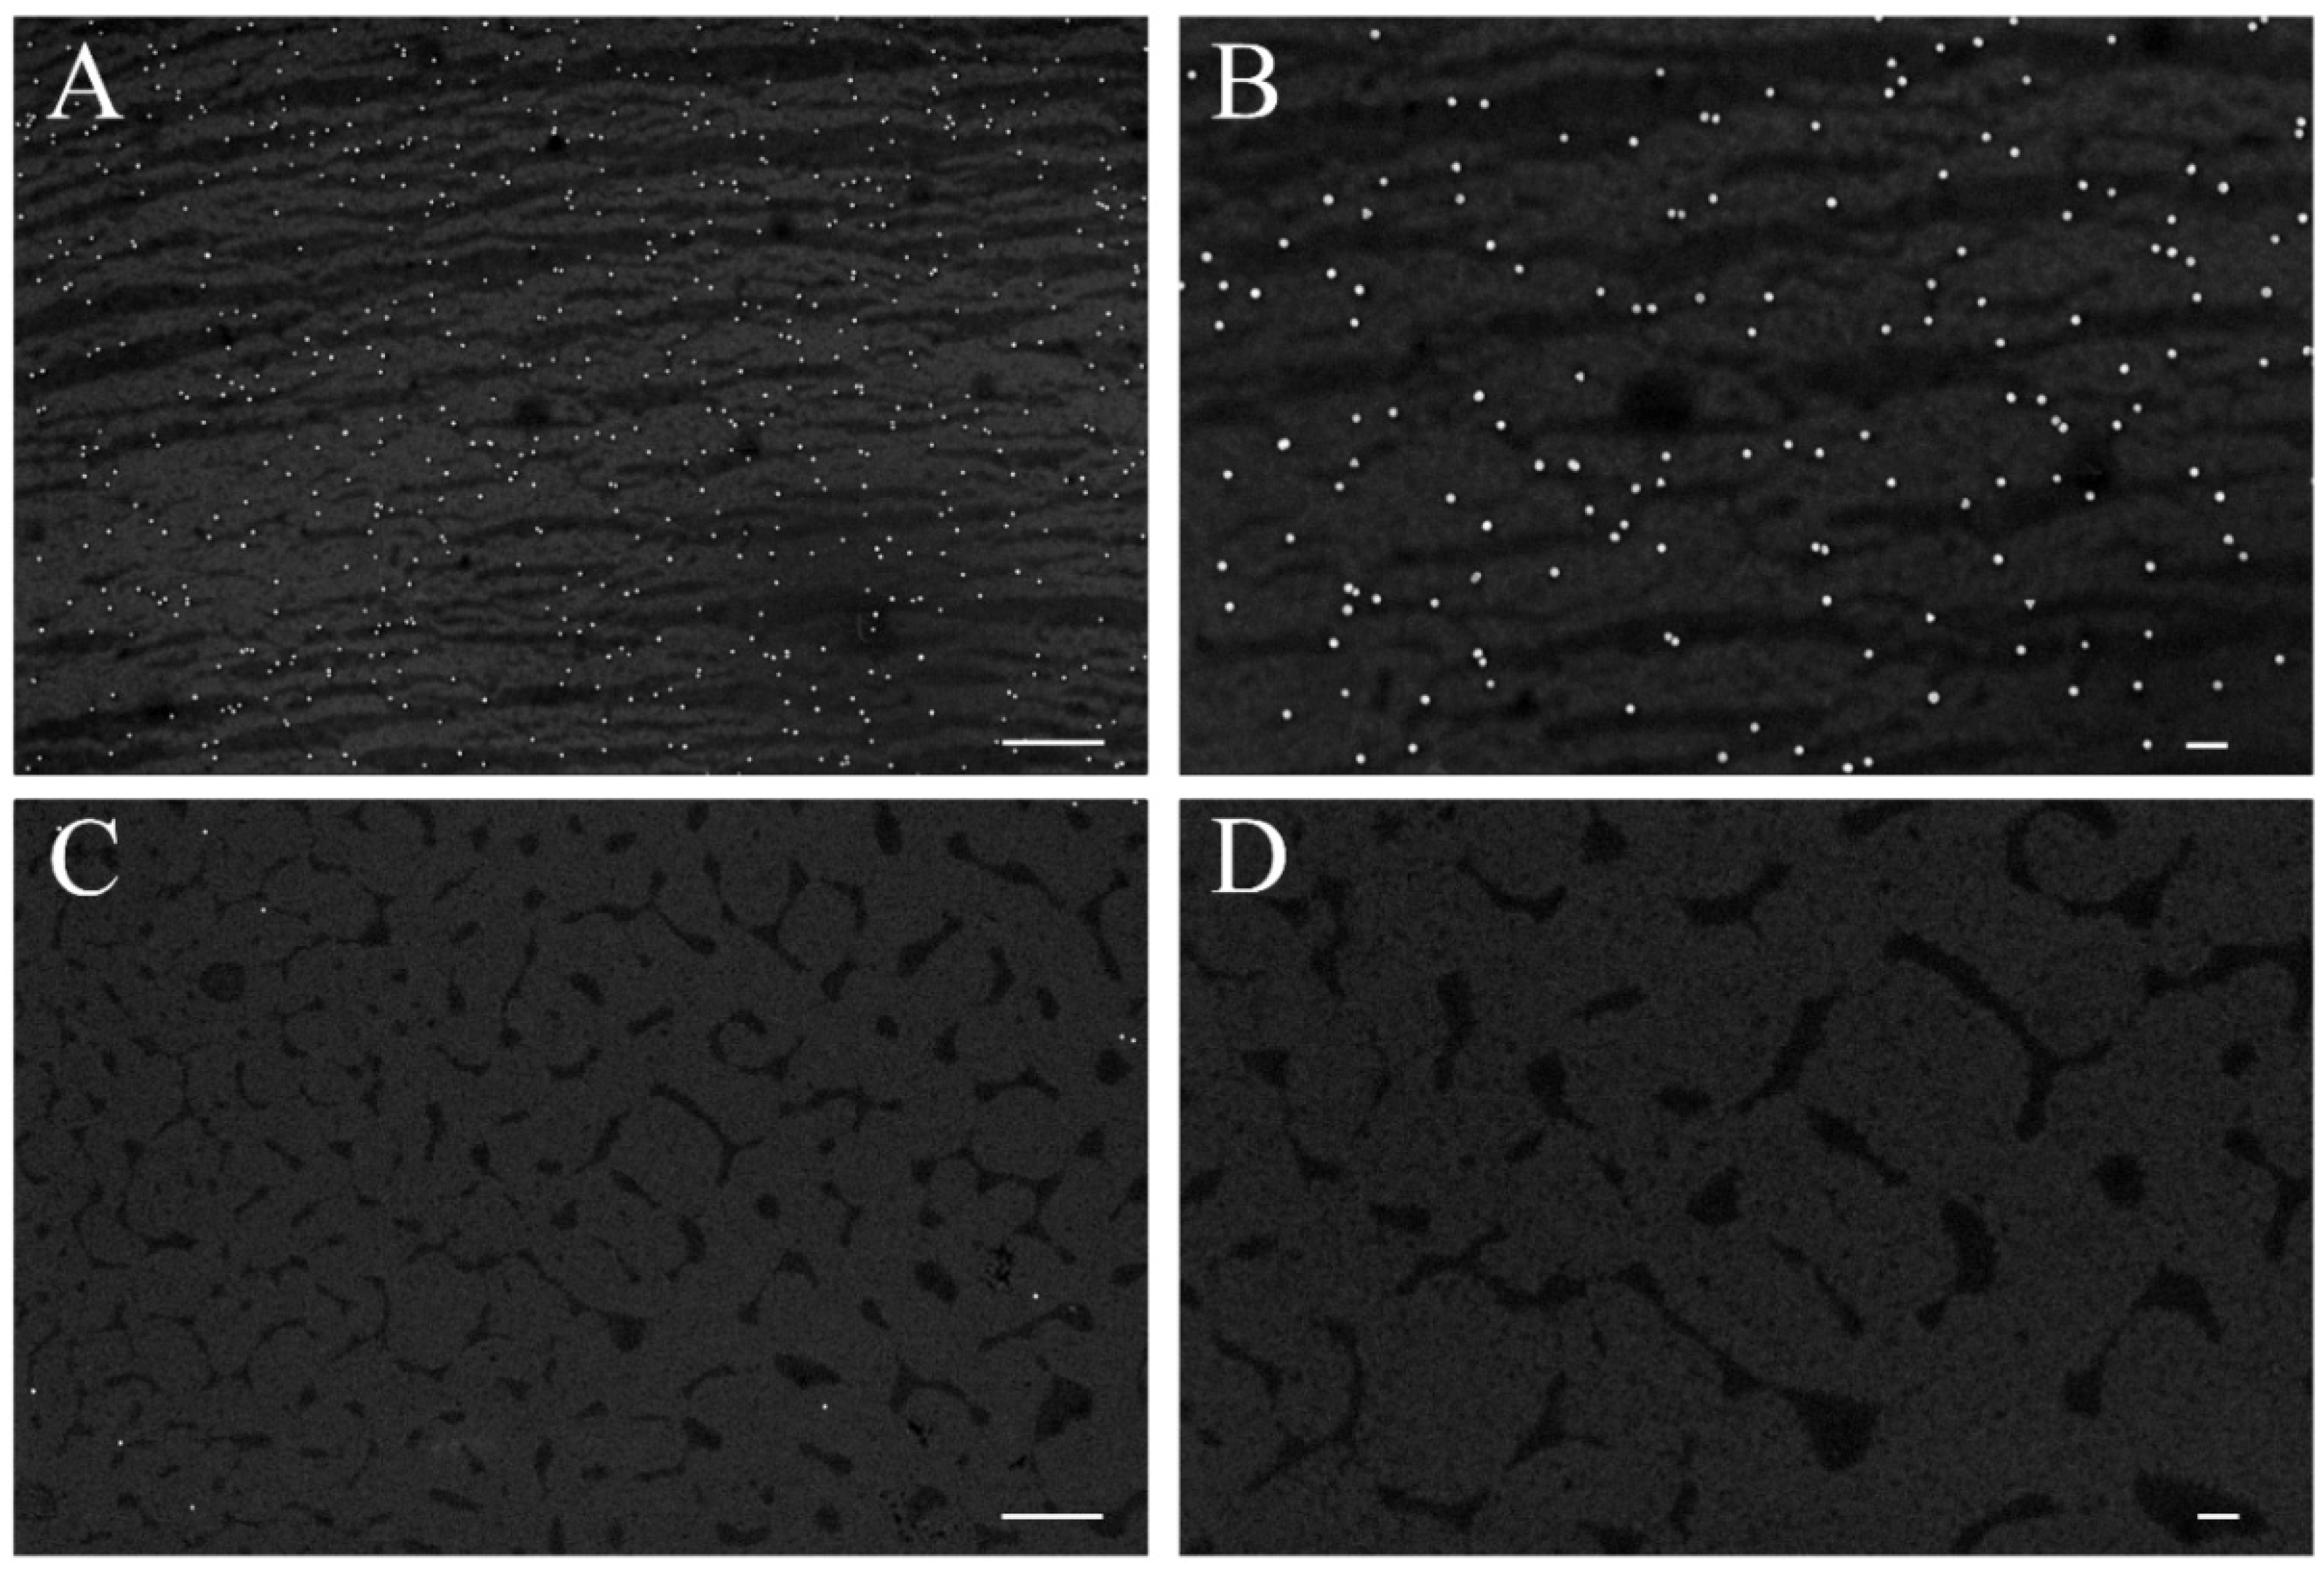
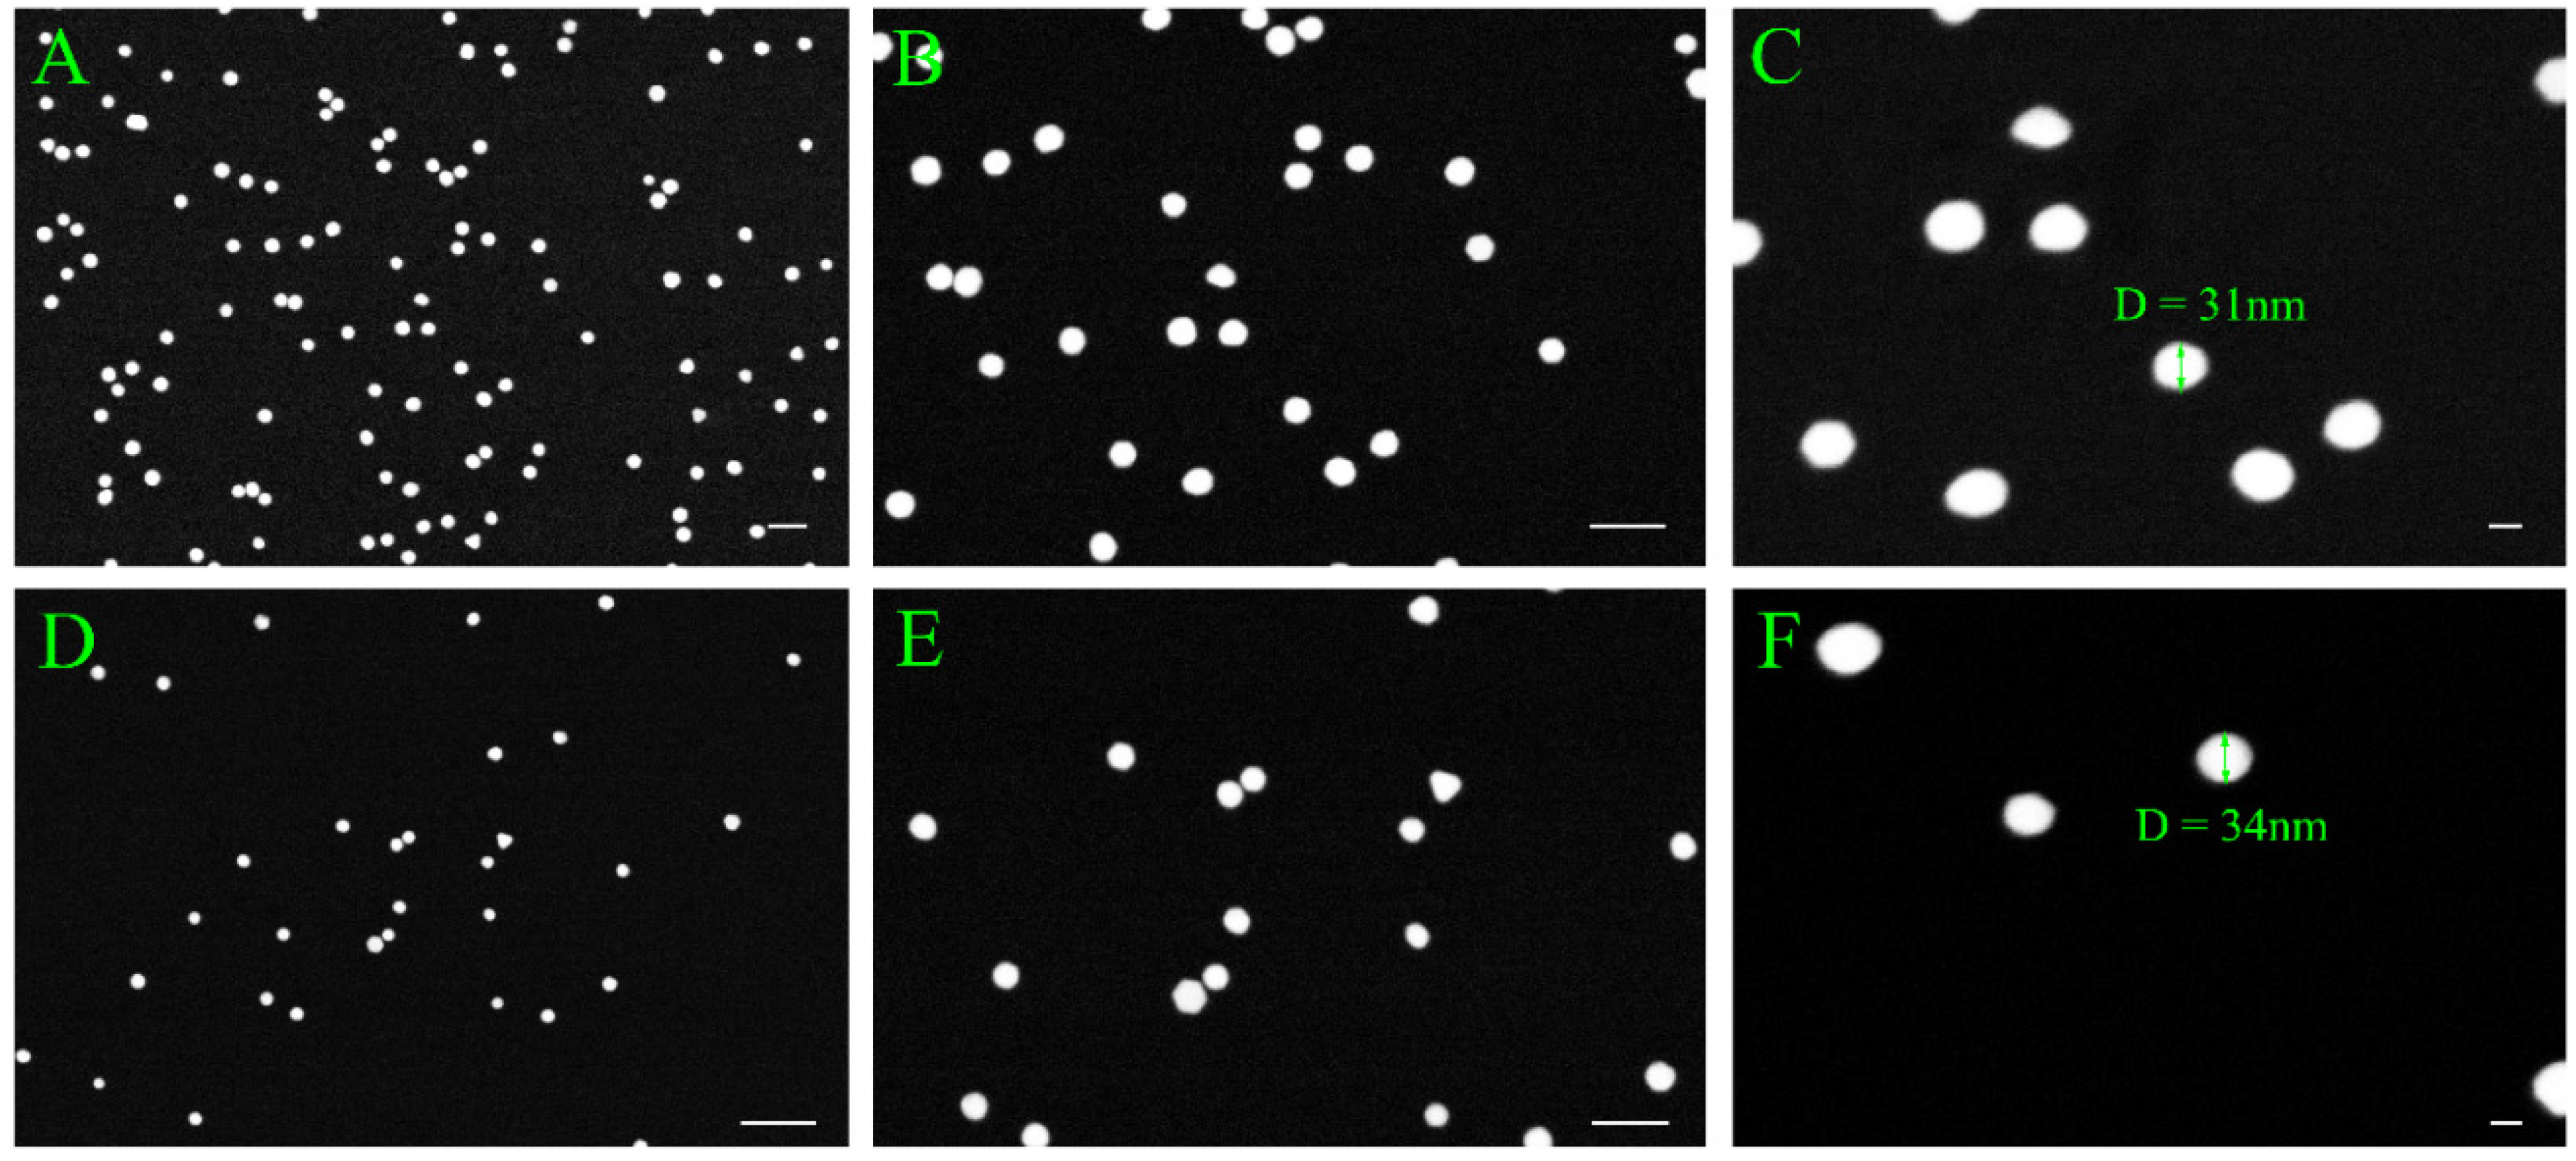
2.2. SEM and EDX of AuNPs

Figure 4 shows scanning electron microscope (SEM) images of AuNPs on sample A1 (Figure 3B and Figure 4A) and control chip C1 (Figure 4C,D). The images show a dense and roughly uniform distribution of AuNPs over the surface. Almost no AuNP were observed on the control chip C1. It is noteworthy that these results were obtained using high concentrations of anti-rabbit IgG-conjugated AuNPs. To exclude the possibility of non-specific binding by saturation, a 1:3 dilution of anti-rabbit IgG conjugated AuNPs solution was applied to sample chip B1 and control chip D1. The results are shown in Figure 4. Sample B1 shows a roughly uniform coverage of AuNP but at a lower distribution density compared to that of A1. Very small amounts of AuNP are present on control chip D1, again pointing to a negligible level of non-specific binding to the surface. This minimal amount of non-specific binding is likely caused by the interaction between the polyclonal goat anti-rabbit IgG and the goat IgG. The interaction of the AuNPs themselves to the IgG molecules on the substrate may however be caused by other factors. No AuNP are shown under magnification of 20,000x. The contrast of AuNP density between samples and negative controls observed in both experiments (i.e., Figure 4 and Figure 5) therefore points to a high selectivity of binding of anti-rabbit IgG conjugated AuNPs onto the surface.
Figure 6 compares the density of AuNPs on chips A1 and B1. Under 50,000x and 200,000x magnification, the ratio of AuNP of A1 to B1 is around 3:1 which is consistent with the relative concentrations of anti-rabbit IgG conjugated AuNP solutions concentration employed in the two experiments. Figure 7 shows the EDX analysis of SiCN substrate immobilized with sandwich rabbit IgG structure. The point analysis of the particle (panel B) shows significant peaks for elements gold, silicon, carbon and nitrogen, which further supports the attachment of AuNPs onto the SiCN substrate. The elements map shows their relative proportions on and off the particle. In spite of background noise of sparse gold distribution of the particle, the contrast of gold density on and off particle is high enough to conclusively establish the presence of discrete AuNPs on the surface (panel C). Panels D, E, F show less silicon, a bit more carbon and almost the same amount of nitrogen on the particle, which agrees with the fact that anti-rabbit IgG conjugated AuNPs contains carbon and nitrogen, but no silicon. The shape of elements mapping are slightly distorted due to the electron astigmation at high magnification but they still reflects the concentrations of elements distribution effectively.

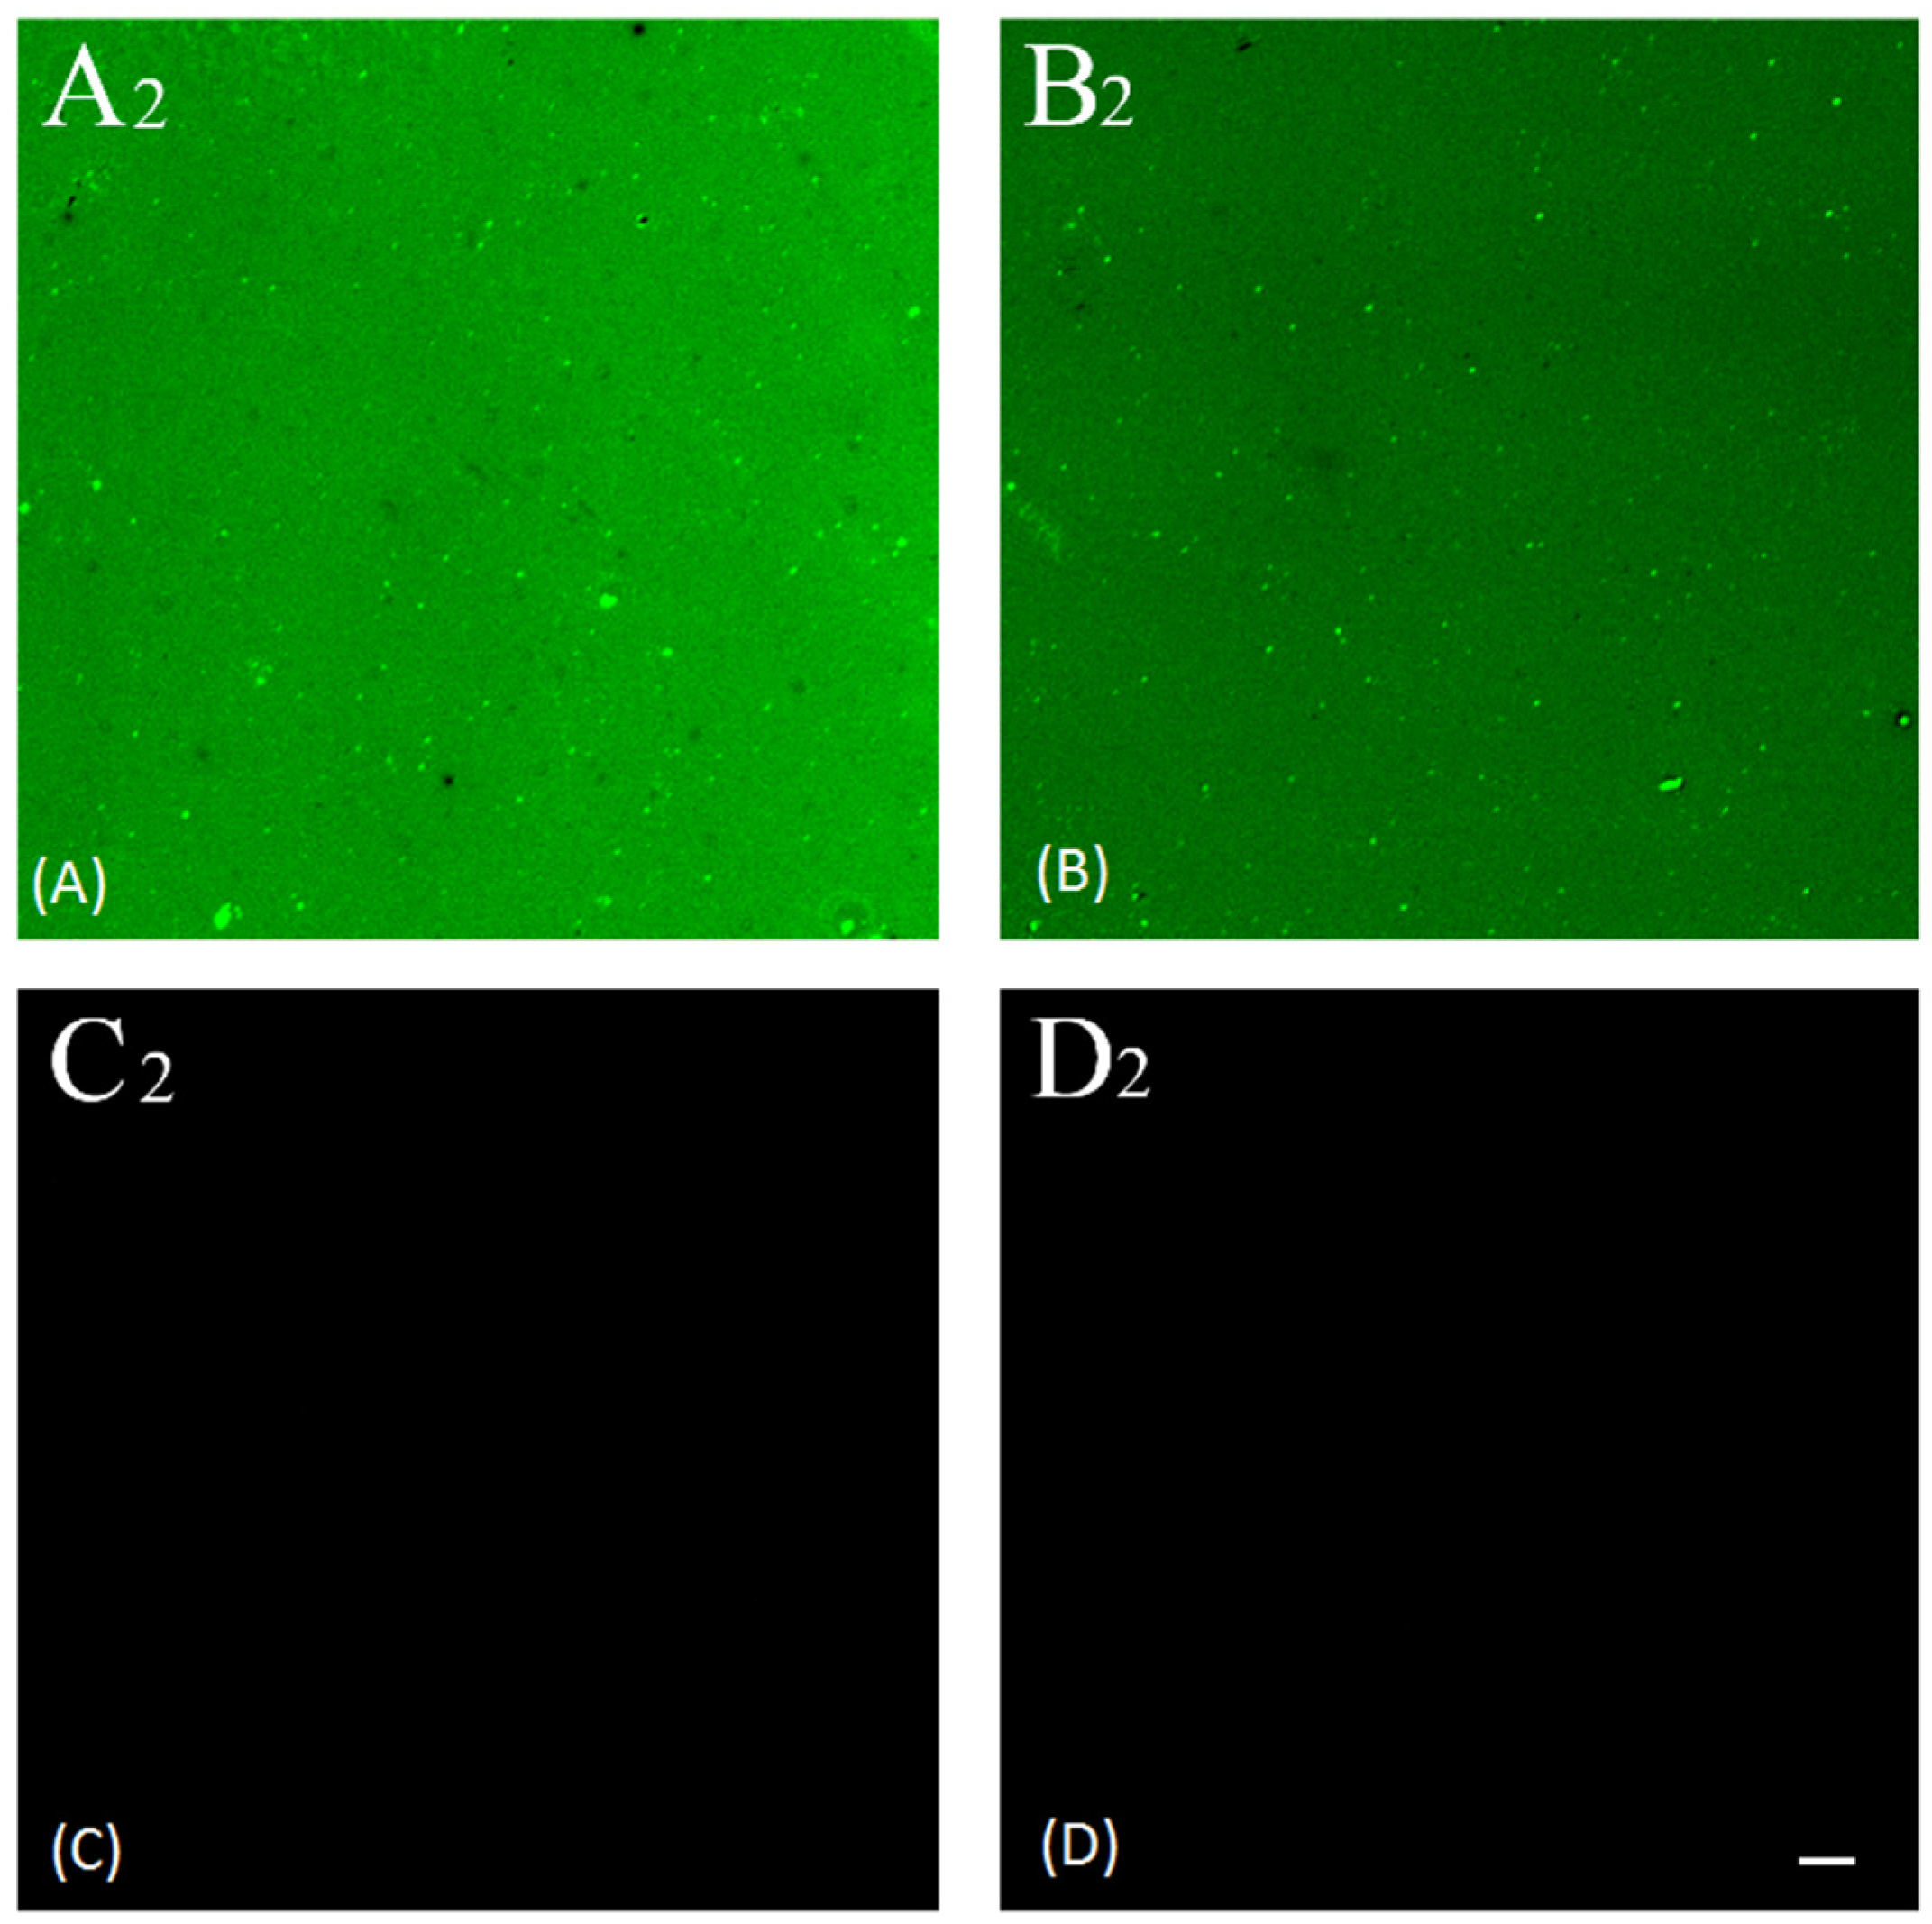
2.3. Fluorescence Imaging

As seen in Figure 8, the fluorescein-5-Isothiocyanate (FITC) fluorescent marker was present only in chips A2 and B2 but not in negative control chips C2 and D2. The FITC fluorescent intensity is clearly stronger in A2 than it is in B2, while almost no difference exists between C2 and D2. Table 2 tabulates the mean fluorescent intensity and signal to noise ratio for those samples. The signal to noise ratios of 185 and 105 under FITC dilution of 1:200 and 1:400, respectively, conclusively establishes the selective absorption of FITC-conjugated anti-rabbit IgG to the target molecule rabbit IgG. The fluorescence intensity of A2 is 47% larger than that of B2, suggesting non-saturation binding of FITC conjugated anti-rabbit IgG to substrate. The intensities from negative control samples C2 and D2 are almost the same for both FITC concentration, further pointing to an almost inexistent binding of FITC conjugated anti-rabbit IgG to substrate. Hence, these results conclusively establish that the chemical bonding of probe molecule anti-rabbit IgG to the aryl film on SiCN substrate induced by diazonium modification has been accomplished.

3. Materials and Methods

3.1. SiCN Film Deposition

A previously reported deposition technique was employed to deposit the thin film [28,72]. More specifically, a single-crystal (100) silicon wafer was subjected to a 15 min piranha clean (3:1 H2SO4:H2O2) to eliminate surface organics, and immediately followed by a 3 min buffered oxide etch (BOE, 10:1 HF:NH4F) to strip the native oxide. The SiCN film was deposited onto the clean silicon wafer by plasma enhanced chemical vapor deposition (PECVD). First, the PECVD chamber (Trion Orion) was pre-conditioned at a mixed gases flow of 25 sccm DES, 40 sccm NH3, 55 sccm N2 at a temperature of 300 °C, a pressure of 500 mTorr, and a power of 50 W for 1200 s. The silicon wafer was then loaded in the reactor. The chamber was purged by 55 sccm N2 at a pressure of 500 mTorr and a temperature of 300 °C for 10 s. The chamber was prepared for the deposition by a mixed gases flow of 25 sccm DES, 40 sccm NH3, 55 sccm N2 at a temperature of 300 °C, a pressure of 500 mTorr for 10 s. A SiCN thin film was deposited with at a mixed gases flow of 25 sccm DES, 40 sccm NH3, 55 sccm N2 at a temperature of 300 °C, a pressure of 500 mTorr, and a power of 50 W for 125 s. The wafer was then annealed in a 3-zone Minibrute tube furnace at 525 °C for 2 h.

3.2. XPS Element Analysis

Surface XPS analyses were performed to characterize the elemental composition of the deposited film, namely the ratio of silicon, carbon and nitride. The XPS was performed in a Kratos Axis Ultra spectrometer using a monochromatic Al Kα source (hν = 1486.6 eV). Instrument base pressure was lower than 5 × 10⁻⁸ Pa. The survey scans were acquired out with a pass energy of 160 eV.

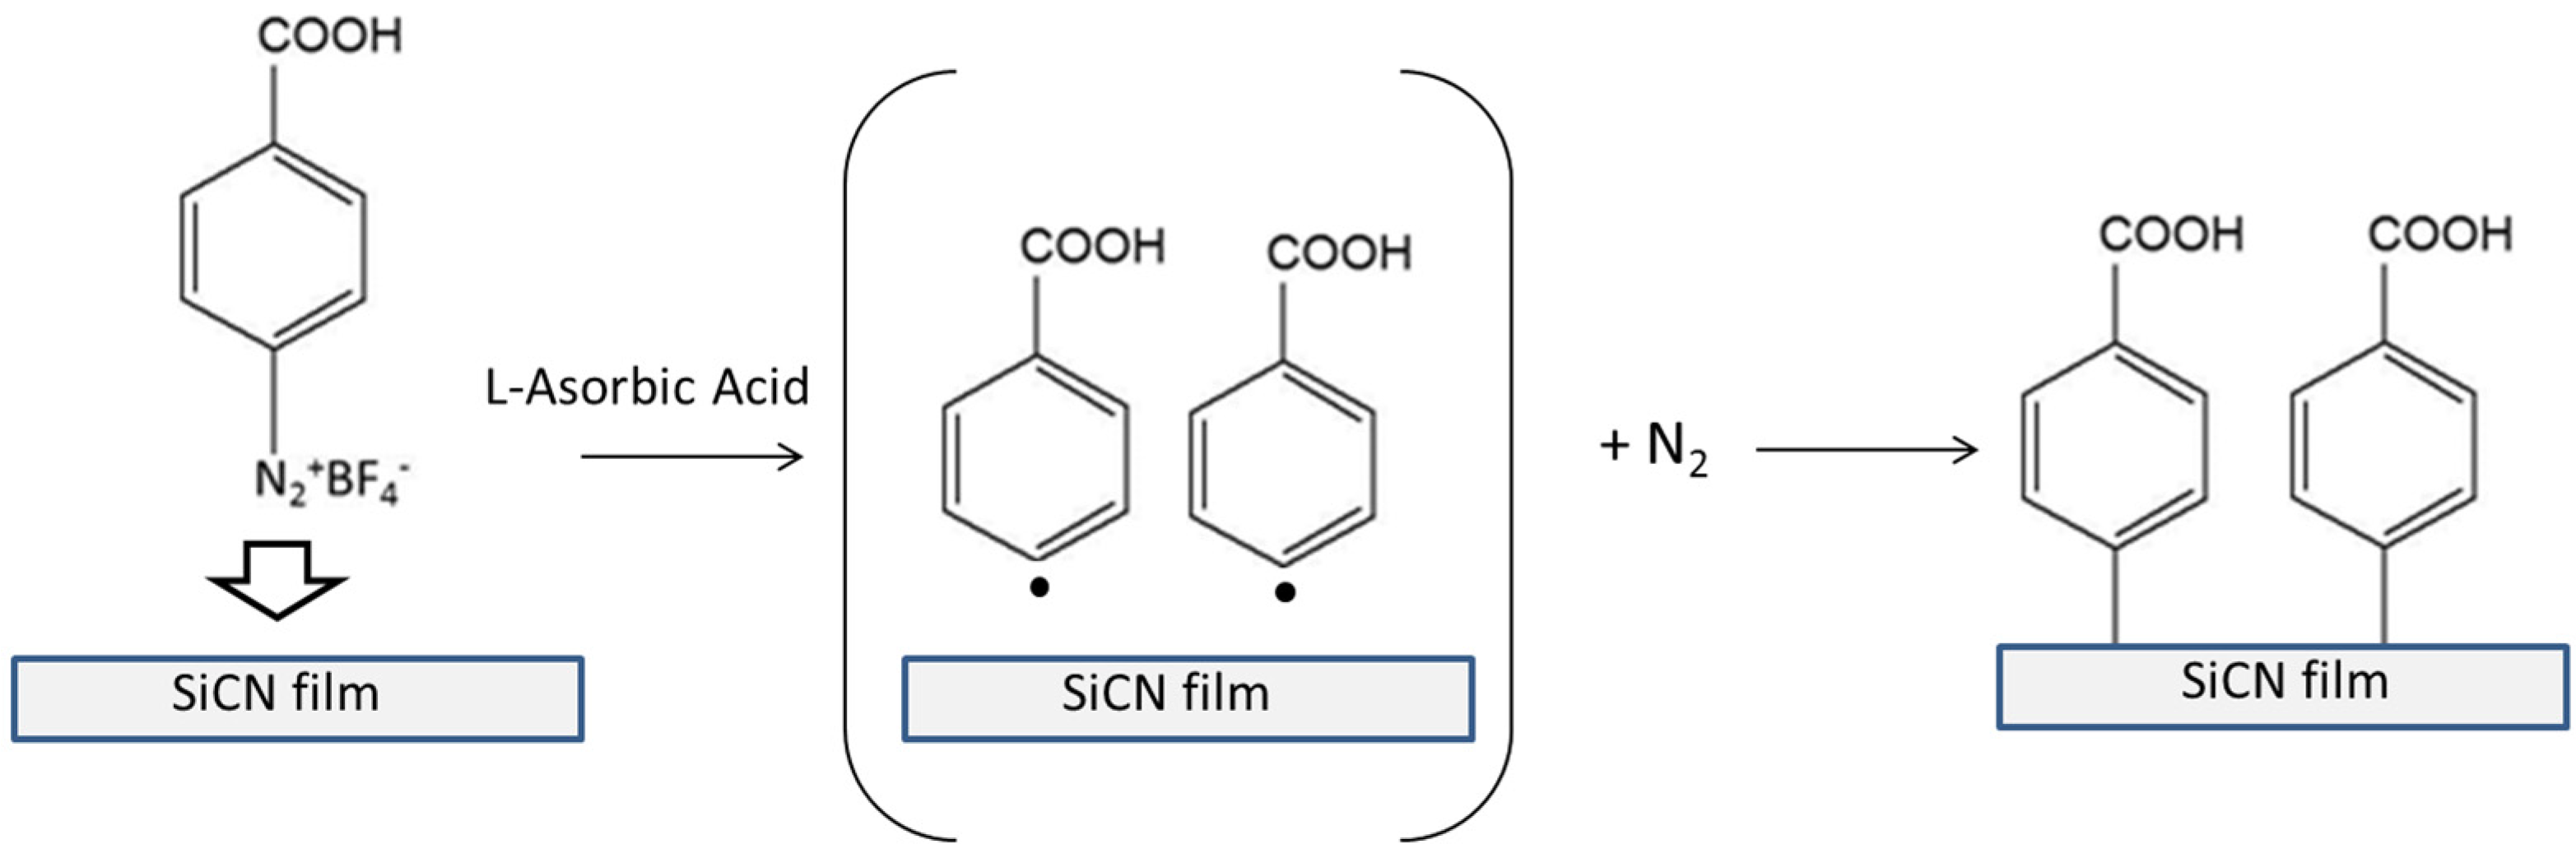
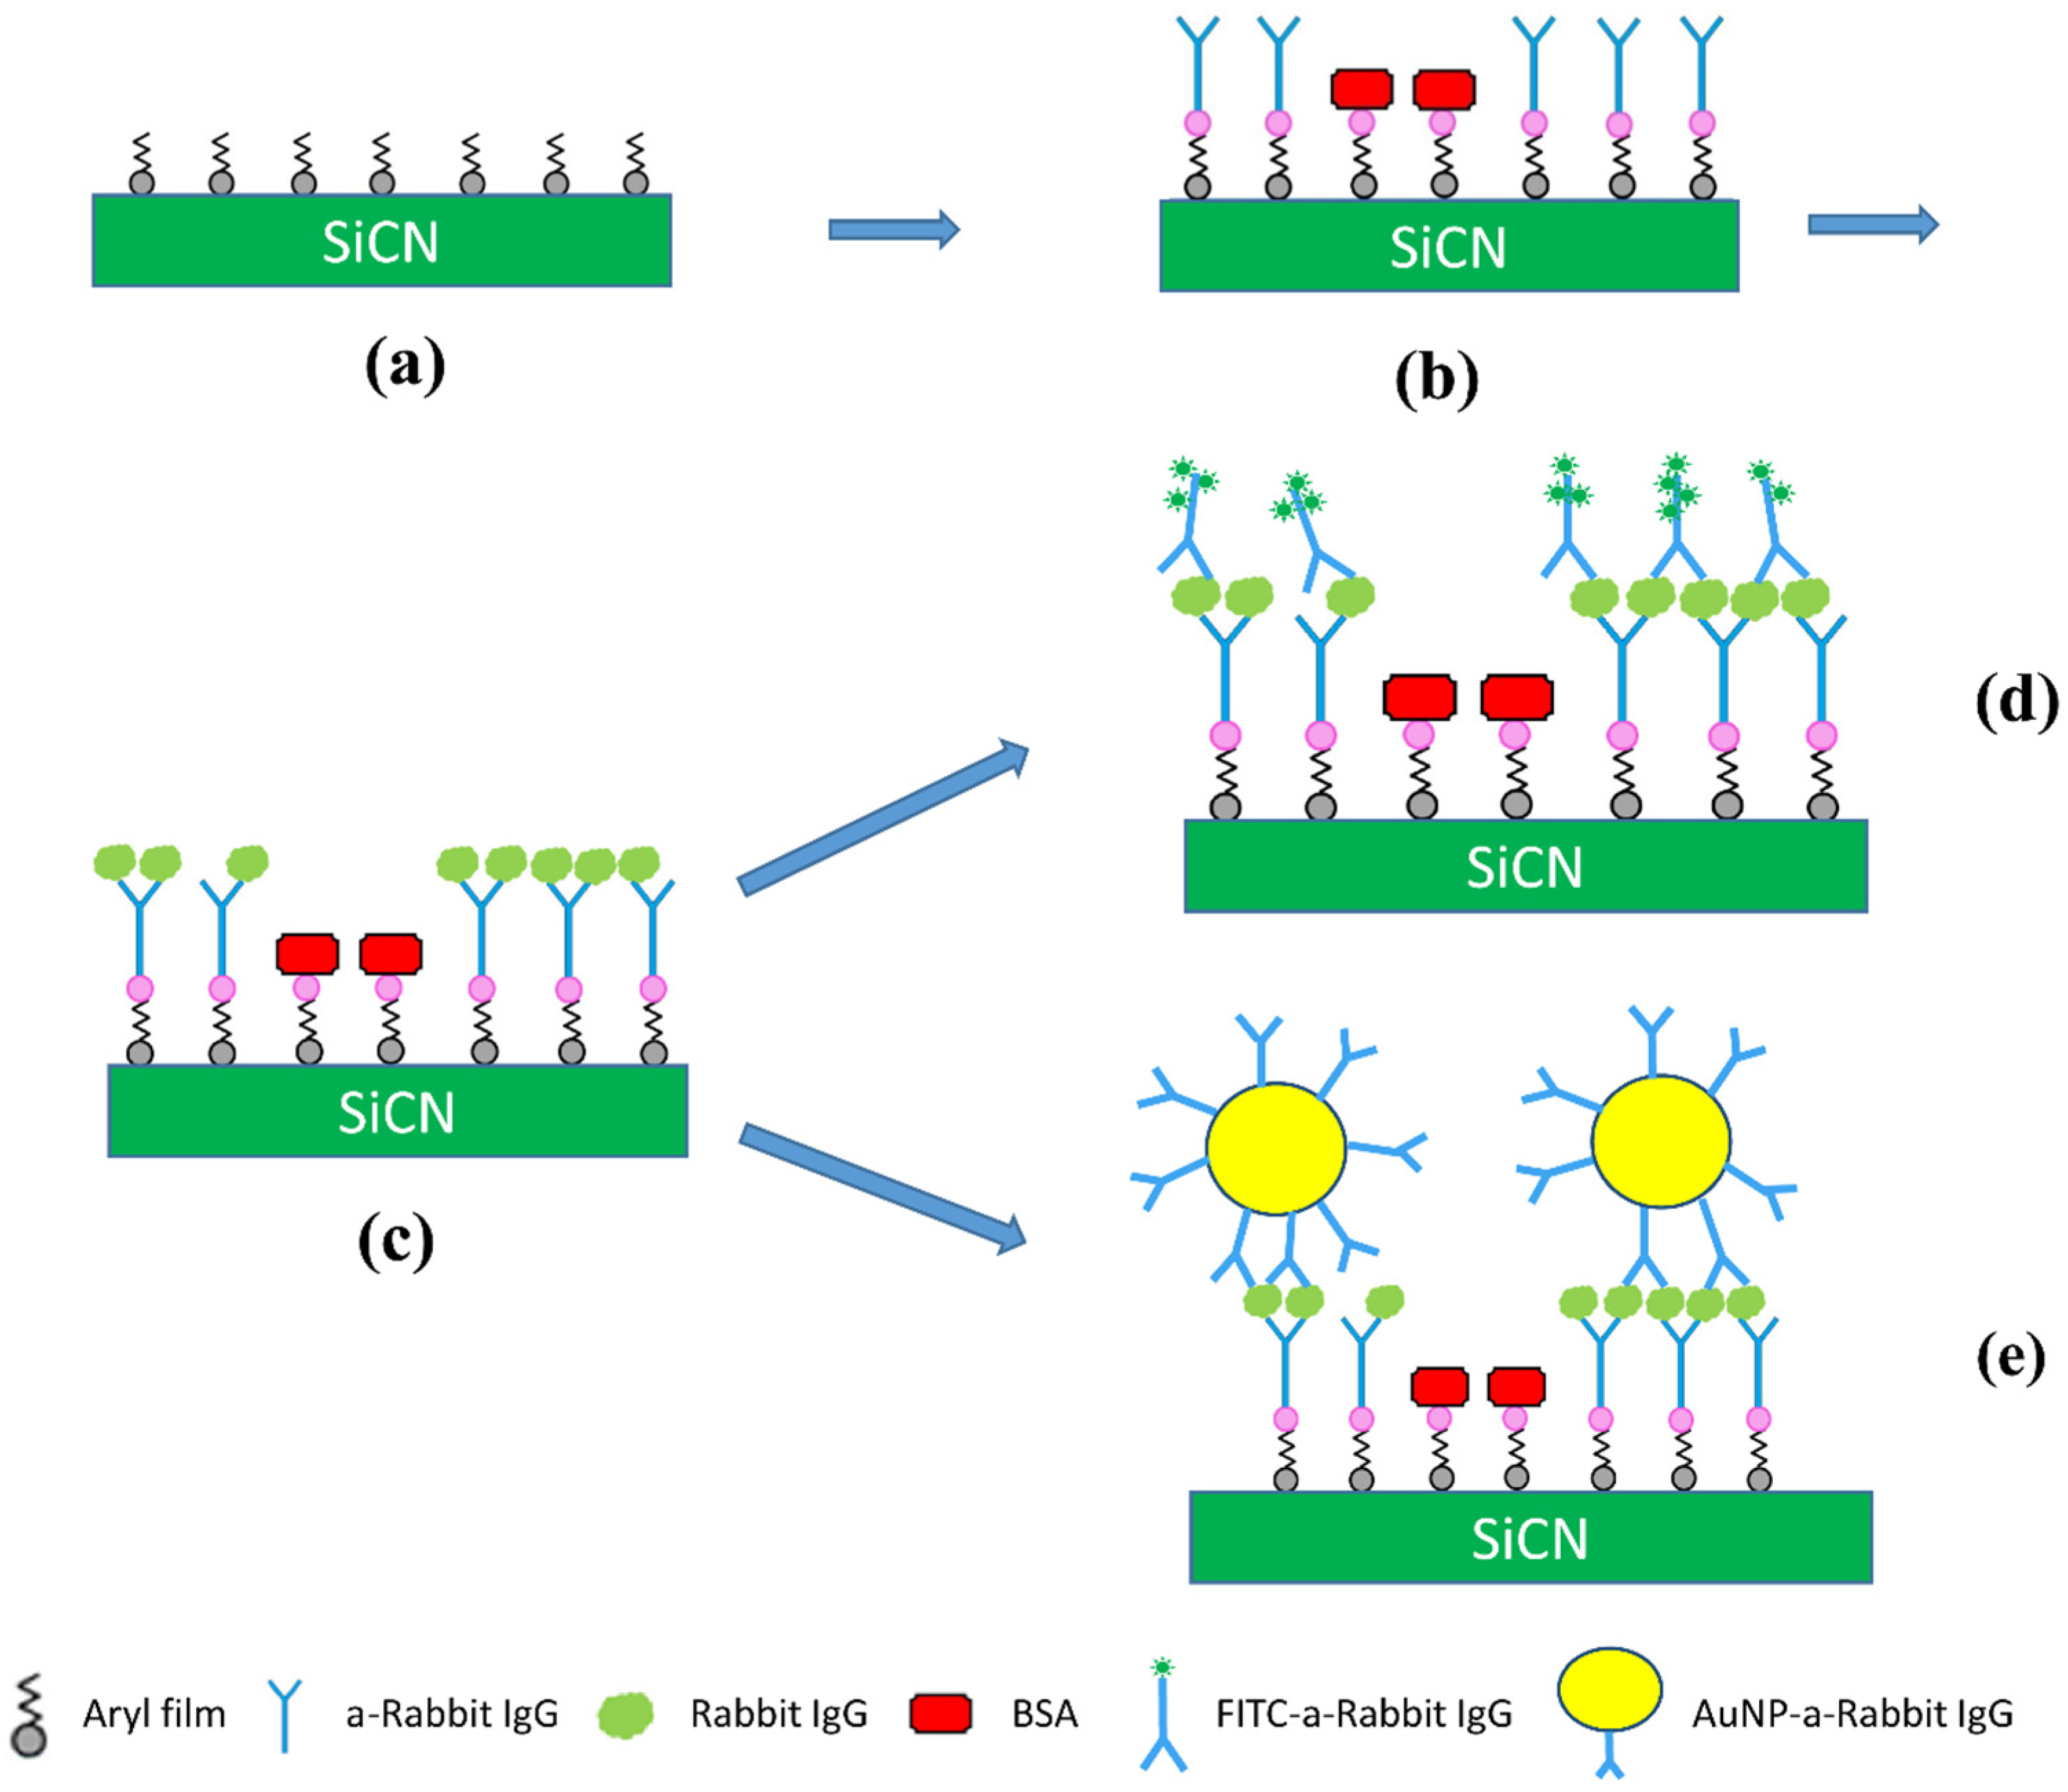
3.3. Diazonium Modification of SiCN

Aryl diazonium salt was synthesized from the corresponding anilines using a previously reported procedure [86]. Briefly, 0.1 moles 4-Aminobenzoic acid (Sigma-Aldrich) was dissolved in 50 mL floroboric acid (48%, Sigma-Aldrich) and then cooled in an ice water bath. After cooling the solution to 0 °C, Sodium nitrite (10 g, Sigma-Aldrich) dissolved in DI water (20 mL) was added drop by drop with stirring. The reaction mixture was further cooled in ice water bath and stirred for another 1 h. The resultant precipitate was filtered in a Buchner funnel and washed with cold anhydrous ether (Sigma-Aldrich).
The SiCN surface was modified by diazonium salt reduction induced aryl film grafting process as per the following procedure. A piranha and BOE etch similar to the one described previously was first employed to clean the SiCN surface from organic contaminants. Indeed, the SiCN films were batch deposited on multiple wafers at a time, with individual wafers often stored for months prior to use. A re-cleaning of the SiCN film surface prior to aryl grafting was thus deemed compulsory in the light of this extensive storage. Following this cleaning, the SiCN chips were incubated in 2:1 volume ratio of 0.05 M 4-carboxybenzenediazonium tetrafluoroborate (COOH−C6H4−N2BF4) and 0.05 M L-ascorbic acid (VC) (Sigma-Aldrich) for 60 min. The chips were then successively rinsed in water, ethanol, and acetone followed by a 5 min sonication in dimethylformamide (DMF) (Sigma-Aldrich). The presence of grafted aryl film onto the SiCN film after sonication in DMF was verified with XPS analysis. For such verification, a Br terminated diazonium salt 4-bromobenzenediazonium tetrafluoroborate was rather used. Bromium was used as elemental marker as it is otherwise absent from the SiCN film surface. Related XPS spectra clearly indicated the presence of the Br groups following the sonication step in DMF, confirming the stability of the grafting [98].
Carboxyl groups were activated by incubating the chips in a 1:1 volume ratio of 0.4 M EDC (N-(3-dimethylaminopropyl)-N′-ethylcarbodiimide hydrochloride) (Sigma-Aldrich) and 0.1 M NHS (N-hydroxysuccinimide) (Sigma-Aldrich) solution for 30 min.

3.4. Gold Nanoparticle Labelled Sandwich Rabbit IgG Assay

In this AuNP labelled sandwich rabbit IgG assay, anti-rabbit IgG was used as the recognition bioreceptor, rabbit IgG was the target and anti-rabbit IgG conjugated AuNP served as detection markers.

3.4.1. Immobilization of AuNP Labelled Sandwich Rabbit IgG

Immobilization of recognition bioreceptor: Four SiCN chips (A1, B1, C1, D1) baring activated carboxyl groups were incubated in 100 µg/mL goat anti-rabbit IgG solution (polyclonal, Sigma-Aldrich) at room temperature for 2 h. The chips were rinsed with PBST (Phosphate Buffered Saline Tween-20) and then incubated in 5% BSA (‎bovine serum albumin) at room temperature for 1 h to block non-specific binding sites. The chips were then rinsed once again in PBST.
Immobilization of target: Two chips (A1 and B1) were immobilized with the detection target by incubating in 200 µg/mL rabbit IgG solution (polyclonal, Sigma-Aldrich) at room temperature for 1 h. As parallel control experimnent, the other two chips (C1 and D1) were incubated in 200 µg/mL goat IgG solution (polyclonal, Sigma-Aldrich) at room temperature for 1 h. The chips were then rinsed once again in PBST.
Immobilization of detection marker: Chips A1 and C1 were immersed in 40 nm AuNP (4.5 × 10¹¹ /mL) conjugated anti-rabbit IgG solution (10 µg/mL, Ted Pella) at room temperature for 1 h. Chips B1 and D1 were immersed in 1:3 diluted solution of 40 nm AuNP conjugated anti-rabbit IgG at room temperature for 1 h. Following incubation, the chips were water rinsed and dried under nitrogen flow. Table 3 summarizes the conditions under which each sample was prepared.

3.4.2. SEM and EDX

A high resolution field emission scanning electron microscopy (Zeiss Sigma FE-SEM) was used to observe the presence of the gold nanoparticles on the surface of chips A1, B1, C1 and D1. Images were obtained at magnifications ranging from 10,000x to 200,000x using an acceleration voltage of 15 KV, and using a secondary electron (SE) in-lens and backscattered electron (BSE) detector. An energy-dispersive X-ray detection instrument (EDX) was used to identify the elemental composition of surfaces of chips A1, B1, C1 and D1. An Oxford Instruments X-MaxN 150 mm2 Silicon Drift Detector (SDD) detector was used for such point analysis and mapping of elemental spatial distributions.

3.5. FITC Labelled Sandwich Rabbit IgG Assay

The FITC labelled sandwich rabbit IgG assay was similar to the AuNP labelled sandwich rabbit IgG assay with the exception that FITC conjugated anti-rabbit IgG was used as the detection marker.

3.5.1. Immobilization of FITC Labelled Sandwich Rabbit IgG

The procedure for immobilization of bioreceptor and target is similar to the one described in section 4.4.1. Four diazonium modified SiCN chips (A2, B2, C2, D2) were incubated in 100 µg/mL goat anti-rabbit IgG solution (polyclonal, Sigma-Aldrich) for 2 h, and 5% BSA (‎bovine serum albumin) for 1 h at room temperature. Chips A2 and B2 were incubated in 200 µg/mL rabbit IgG solution (polyclonal, Sigma-Aldrich) for 1 h whereas chips C2 and D2 were subject to 200 µg/mL goat IgG solution (polyclonal, Sigma-Aldrich) as control for 1 h at room temperature. Chips A2 and C2 were immersed in 1:200 diluted FITC conjugated anti-rabbit IgG solution (Sigma-Aldrich) while Chips B2 and D2 were immersed in 1:400 diluted FITC conjugated anti-rabbit IgG solution at room temperature for 1 h.

3.5.2. Confocal Microscopy Imaging

Chips A2, B2, C2, D2 were individually imaged on a Zeiss LSM 710 Laser scanning confocal microscope mounted on an Axio-observer inverted microscope (ZEN 2011, Jena, Germany) with a plan Apochromat 20x (NA 0.8) dry lens. Fluorescence signal was collected with a 488 nm laser and with an emission wavelength ranging from 492 nm to 590 nm. Images were digitized at 16 bit with a Nyquist sampling rate using a pinhole size of one airy unit. The average intensity of individual images were calculated using the imageJ software (National Institutes of Health).

Acknowledgments

This work was supported by that Natural Sciences and Engineering Research Council of Canada through its Discovery Grant program, as well as by the National Research Council of Canada via the National Institute for Nanotechnology. The authors acknowledge the University of Alberta Nanofab staff for their technical support, more specifically Shihong Xu and Les Schowalter.

Author Contributions

All authors contributed to the conception and design of the experiments; Wei Zheng deposited the SiCN films and Rongbing Du performed the reagent synthesis; Wei Zheng, Rongbing Du, and Yong Cao performed the surface functionalization; Wei Zheng analyzed the data with assistance of Xuejun Sun and Yiyu Wang; Wei Zheng wrote the paper, which was edited and reviewed by all authors.

Conflicts of Interest

The authors declare no conflict of interest. The founding sponsors had no role in the design of the study; in the collection, analyses, or interpretation of data; in the writing of the manuscript, and in the decision to publish the results.

Abbreviations

The following abbreviations are used in this manuscript:
NEMSNano-electromechanical Systems
AuNPGold nanoparticle
SEMScanning electron microscopy
XPSX-ray photoelectron microscopy
PBSTPhosphate Buffered Saline Tween-20
PECVDPlasma enhanced chemical vapor deposition
FITCFluorescein-5-Isothiocyanate

References

  1. Haes, A.J.; Chang, L.; Klein, W.L.; Van Duyne, R.P. Detection of a biomarker for alzheimer’s disease from synthetic and clinical samples using a nanoscale optical biosensor. J. Am. Chem. Soc. 2005, 127, 2264–2271. [Google Scholar] [CrossRef] [PubMed]
  2. Tothill, I.E. Biosensors for cancer markers diagnosis. Semin. Cell Dev. Biol. 2009, 20, 55–62. [Google Scholar] [CrossRef] [PubMed]
  3. Giuliano, K.A.; Taylor, D.L. Fluorescent-protein biosensors: New tools for drug discovery. Trends Biotechnol. 1998, 16, 135–140. [Google Scholar] [CrossRef]
  4. Keusgen, M. Biosensors: New approaches in drug discovery. Naturwissenschaften 2002, 89, 433–444. [Google Scholar] [CrossRef] [PubMed]
  5. Cooper, M.A. Optical biosensors in drug discovery. Nat. Rev. Drug Discov. 2002, 1, 515–528. [Google Scholar] [CrossRef] [PubMed]
  6. Gartia, M.R.; Braunschweig, B.; Chang, T.-W.; Moinzadeh, P.; Minsker, B.S.; Agha, G.; Wieckowski, A.; Keefer, L.L.; Liu, G.L. The microelectronic wireless nitrate sensor network for environmental water monitoring. J. Environ. Monit. 2012, 14, 3068–3075. [Google Scholar] [CrossRef] [PubMed]
  7. Liao, J.C.; Mastali, M.; Gau, V.; Suchard, M.A.; Møller, A.K.; Bruckner, D.A.; Babbitt, J.T.; Li, Y.; Gornbein, J.; Landaw, E.M. Use of electrochemical DNA biosensors for rapid molecular identification of uropathogens in clinical urine specimens. J. Clin. Microbiol. 2006, 44, 561–570. [Google Scholar] [CrossRef] [PubMed]
  8. Edgeworth, J.A.; Farmer, M.; Sicilia, A.; Tavares, P.; Beck, J.; Campbell, T.; Lowe, J.; Mead, S.; Rudge, P.; Collinge, J.; et al. Detection of prion infection in variant creutzfeldt-jakob disease: A blood-based assay. Lancet 2011, 377, 487–493. [Google Scholar] [CrossRef]
  9. Jucker, M.; Walker, L.C. Pathogenic protein seeding in alzheimer disease and other neurodegenerative disorders. Ann. Neurol. 2011, 70, 532–540. [Google Scholar] [CrossRef] [PubMed]
  10. Stohr, J.; Watts, J.C.; Mensinger, Z.L.; Oehler, A.; Grillo, S.K.; DeArmond, S.J.; Prusiner, S.B.; Giles, K. Purified and synthetic alzheimer’s amyloid beta (a beta) prions. PNAS 2012, 109, 11025–11030. [Google Scholar] [CrossRef] [PubMed]
  11. Rushworth, J.V.; Ahmed, A.; Griffiths, H.H.; Pollock, N.M.; Hooper, N.M.; Millner, P.A. A label-free electrical impedimetric biosensor for the specific detection of alzheimer's amyloid-beta oligomers. Biosens. Bioelectron. 2014, 56, 83–90. [Google Scholar] [CrossRef] [PubMed]
  12. Sreekumar, A.; Nyati, M.K.; Varambally, S.; Barrette, T.R.; Ghosh, D.; Lawrence, T.S.; Chinnaiyan, A.M. Profiling of cancer cells using protein microarrays: Discovery of novel radiation-regulated proteins. Cancer Res. 2001, 61, 7585–7593. [Google Scholar] [PubMed]
  13. Woodbury, R.L.; Varnum, S.M.; Zangar, R.C. Elevated hgf levels in sera from breast cancer patients detected using a protein microarray elisa. J. Proteome Res. 2002, 1, 233–237. [Google Scholar] [CrossRef] [PubMed]
  14. Saborio, G.P.; Permanne, B.; Soto, C. Sensitive detection of pathological prion protein by cyclic amplification of protein misfolding. Nature 2001, 411, 810–813. [Google Scholar] [CrossRef] [PubMed]
  15. Castilla, J.; Saa, P.; Soto, C. Detection of prions in blood. Nat. Med. 2005, 11, 982–985. [Google Scholar] [CrossRef] [PubMed]
  16. Chen, B.A.; Morales, R.; Barria, M.A.; Soto, C. Estimating prion concentration in fluids and tissues by quantitative pmca. Nat. Methods 2010, 7, U519–U547. [Google Scholar] [CrossRef] [PubMed]
  17. Moudjou, M.; Sibille, P.; Fichet, G.; Reine, F.; Chapuis, J.; Herzog, L.; Jaumain, E.; Laferriere, F.; Richard, C.A.; Laude, H.; et al. Highly infectious prions generated by a single round of microplate-based protein misfolding cyclic amplification. mBio 2013, 5. [Google Scholar] [CrossRef] [PubMed]
  18. Abdel-Hamid, I.; Ivnitski, D.; Atanasov, P.; Wilkins, E. Flow-through immunofiltration assay system for rapid detection of e. Coli o157:H7. Biosens. Bioelectron. 1999, 14, 309–316. [Google Scholar] [CrossRef]
  19. Lazcka, O.; Del Campo, F.J.; Munoz, F.X. Pathogen detection: A perspective of traditional methods and biosensors. Biosens. Bioelectron. 2007, 22, 1205–1217. [Google Scholar] [CrossRef] [PubMed]
  20. Fung, Y.S.; Wong, Y.Y. Self-assembled monolayers as the coating in a quartz piezoelectric crystal immunosensor to detect salmonella in aqueous solution. Anal. Chem. 2001, 73, 5302–5309. [Google Scholar] [CrossRef] [PubMed]
  21. Chang, Y.P.; Liu, W.C.; Tseng, M.C.; Chu, Y.H. Ionic liquids tailored for reaction-based gas sensing on quartz crystal microbalance. Rev. Anal. Chem. 2015, 34, 77–86. [Google Scholar] [CrossRef]
  22. Wang, Z.; Yang, M.; He, J.; Yang, Q. Progress of different sensing materials modified qcm gas sensors. Prog. Chem. 2015, 27, 251–266. [Google Scholar]
  23. Guo, H. Progress of quartz crystal microbalance in chiral analysis. J. Nanosci. Nanotechnol. 2014, 14, 1884–1897. [Google Scholar] [CrossRef]
  24. Ilic, B.; Czaplewski, D.; Zalalutdinov, M.; Craighead, H.G.; Neuzi, P.; Campagnolo, C.; Batt, C. Single cell detection with micromechanical oscillators. J. Vac. Sci. Technol. B 2001, 19, 2825–2828. [Google Scholar] [CrossRef]
  25. Ilic, B.; Yang, Y.; Craighead, H.G. Virus detection using nanoelectromechanical devices. Appl. Phys. Lett. 2004, 85, 2604–2606. [Google Scholar] [CrossRef]
  26. Poshtiban, S.; Singh, A.; Fitzpatrick, G.; Evoy, S. Bacteriophage tail-spike protein derivitized microresonator arrays for specific detection of pathogenic bacteria. Sens. Actuators B Chem. 2013, 181, 410–416. [Google Scholar] [CrossRef]
  27. Campbell, G.A.; Medina, M.B.; Mutharasan, R. Detection of staphylococcus enterotoxin b at picogram levels using piezoelectric-excited millimeter-sized cantilever sensors. Sens. Actuators B Chem. 2007, 126, 354–360. [Google Scholar] [CrossRef]
  28. Fischer, L.M.; Wright, V.A.; Guthy, C.; Yang, N.; McDermott, M.T.; Buriak, J.M.; Evoy, S. Specific detection of proteins using nanomechanical resonators. Sens. Actuators B Chem. 2008, 134, 613–617. [Google Scholar] [CrossRef]
  29. Quitoriano, N.J.; Belov, M.; Evoy, S.; Kamins, T.I. Single-crystal, si nanotubes, and their mechanical resonant properties. Nano. Lett. 2009, 9, 1511–1516. [Google Scholar] [CrossRef] [PubMed]
  30. Bausells, J. Piezoresistive cantilevers for nanomechanical sensing. Microelectron. Eng. 2015, 145, 9–20. [Google Scholar] [CrossRef]
  31. Abdel-Hamid, I.; Ghindidlis, A.L.; Atanasov, P.; Wilkins, E. Development of a flow-through immunoassay system. Sens. Actuators B 1998, 49, 202–210. [Google Scholar] [CrossRef]
  32. Adan, A.; Alizada, G.; Kiraz, Y.; Baran, Y.; Nalbant, A. Flow cytometry: Basic principles and applications. Crit. Rev. Biotechnol. 2016, 36. [Google Scholar] [CrossRef] [PubMed]
  33. Mross, S.; Pierrat, S.; Zimmermann, T.; Kraft, M. Microfluidic enzymatic biosensing systems: A review. Biosens. Bioelectron. 2015, 70, 376–391. [Google Scholar] [CrossRef] [PubMed]
  34. Gau, J.J.; Lan, E.H.; Dunn, B.; Ho, C.M.; Woo, J.C. A MEMS based amperometric detector for E. coli bacteria using self-assembled monolayers. Biosens. Bioelectron. 2001, 16, 745–755. [Google Scholar] [CrossRef]
  35. Gervals, L.; Gel, M.; Allain, B.; Tolba, M.; Brovko, L.; Zourob, M.; Mandeville, R.; Griffiths, M.; Evoy, S. Immobilization of biotinylated bacteriophages on biosensor surfaces. Sens. Actuators B Chem. 2007, 125, 615–621. [Google Scholar] [CrossRef]
  36. Xu, Y.; Xie, X.; Duan, Y.; Wang, L.; Cheng, Z.; Cheng, J. A review of impedance measurements of whole cells. Biosens. Bioelectron. 2016, 77, 824–836. [Google Scholar] [CrossRef] [PubMed]
  37. Chillawar, R.R.; Tadi, K.K.; Motghare, R.V. Voltammetric techniques at chemically modified electrodes. J. Anal. Chem. 2015, 70, 399–418. [Google Scholar] [CrossRef]
  38. Amatore, C.; Delacotte, J.; Guille-Collignon, M.; Lemaître, F. Vesicular exocytosis and microdevices-microelectrode arrays. Analyst 2015, 140, 3687–3695. [Google Scholar] [CrossRef] [PubMed]
  39. Taylor, A.D.; Yu, Q.; Chen, S.; Homola, J.; Jiang, S. Comparison of E. coli O157:H7 preparation methods used for detection with surface plasmon resonance sensor. Sens. Actuators B 2005, 107, 202–208. [Google Scholar] [CrossRef]
  40. Liu, X.; Hu, Y.; Zheng, S.; Liu, Y.; He, Z.; Luo, F. Surface plasmon resonance immunosensor for fast, highly sensitive, and in situ detection of the magnetic nanoparticles-enriched Salmonella enteritidis. Sens. Actuators B Chem. 2016, 230, 191–198. [Google Scholar] [CrossRef]
  41. Arya, S.K.; Singh, A.; Naidoo, R.; Wu, P.; McDermott, M.T.; Evoy, S. Chemically immobilized t4-bacteriophage for specific escherichia coli detection using surface plasmon resonance. Analyst 2011, 136, 486–492. [Google Scholar] [CrossRef] [PubMed]
  42. Singh, A.; Arya, S.K.; Glass, N.; Hanifi-Moghaddam, P.; Naidoo, R.; Szymanski, C.M.; Tanha, J.; Evoy, S. Bacteriophage tailspike proteins as molecular probes for sensitive and selective bacterial detection. Biosens. Bioelectron. 2010, 26, 131–138. [Google Scholar] [CrossRef] [PubMed]
  43. Butet, J.; Brevet, P.F.; Martin, O.J.F. Optical second harmonic generation in plasmonic nanostructures: From fundamental principles to advanced applications. Acs. Nano. 2015, 9, 10545–10562. [Google Scholar] [CrossRef] [PubMed]
  44. Langer, J.; Novikov, S.M.; Liz-Marzán, L.M. Sensing using plasmonic nanostructures and nanoparticles. Nanotechnology 2015, 26. [Google Scholar] [CrossRef] [PubMed]
  45. Nguyen, H.H.; Park, J.; Kang, S.; Kim, M. Surface plasmon resonance: A versatile technique for biosensor applications. Sensors 2015, 15, 10481–10510. [Google Scholar] [CrossRef] [PubMed]
  46. Wang, P.; Bo, L.; Semenova, Y.; Farrell, G.; Brambilla, G. Optical microfibre based photonic components and their applications in label-free biosensing. Biosensors 2015, 5, 471–499. [Google Scholar] [CrossRef] [PubMed]
  47. Buswell, S.C.; Wright, V.A.; Buriak, J.M.; Van, V.; Evoy, S. Specific detection of proteins using photonic crystal waveguides. Opt. Express 2008, 16, 15949–15957. [Google Scholar] [CrossRef] [PubMed]
  48. Mukundan, H.; Kubicek, J.Z.; Holt, A.; Shively, J.E.; Martinez, J.S.; Grace, K.; Grace, W.K.; Swanson, B.I. Planar optical waveguide-based biosensor for the quantitative detection of tumor markers. Sens. Actuators B Chem. 2009, 138, 453–460. [Google Scholar] [CrossRef]
  49. Schmitt, K.; Schirmer, B.; Hoffmann, C.; Brandenburg, A.; Meyrueis, P. Interferometric biosensor based on planar optical waveguide sensor chips for label-free detection of surface bound bioreactions. Biosens. Bioelectron. 2007, 22, 2591–2597. [Google Scholar] [CrossRef] [PubMed]
  50. Liao, W.C.; Ho, J.A.A. Attomole DNA electrochemical sensor for the detection of escherichia coli o157. Anal. Chem. 2009, 81, 2470–2476. [Google Scholar] [CrossRef] [PubMed]
  51. Joung, H.A.; Lee, N.R.; Lee, S.K.; Ahn, J.; Shin, Y.B.; Choi, H.S.; Lee, C.S.; Kim, S.; Kim, M.G. High sensitivity detection of 16s rrna using peptide nucleic acid probes and a surface plasmon resonance biosensor. Anal. Chim. Acta 2008, 630, 168–173. [Google Scholar] [CrossRef] [PubMed]
  52. Taylor, A.D.; Yu, Q.M.; Chen, S.F.; Homola, J.; Jiang, S.Y. Comparison of E coli o157:H7 preparation methods used for detection with surface plasmon resonance sensor. Sens. Actuators B Chem. 2005, 107, 202–208. [Google Scholar] [CrossRef]
  53. Oh, B.K.; Lee, W.; Chun, B.S.; Bae, Y.M.; Lee, W.H.; Choi, J.W. The fabrication of protein chip based on surface plasmon resonance for detection of pathogens. Biosens. Bioelectron. 2005, 20, 1847–1850. [Google Scholar] [CrossRef] [PubMed]
  54. Taylor, A.D.; Ladd, J.; Yu, Q.M.; Chen, S.F.; Homola, J.; Jiang, S.Y. Quantitative and simultaneous detection of four foodborne bacterial pathogens with a multi-channel spr sensor. Biosens. Bioelectron. 2006, 22, 752–758. [Google Scholar] [CrossRef] [PubMed]
  55. Balasubramanian, S.; Sorokulova, I.B.; Vodyanoy, V.J.; Simonian, A.L. Lytic phage as a specific and selective probe for detection of staphylococcus aureus—A surface plasmon resonance spectroscopic study. Biosens. Bioelectron. 2007, 22, 948–955. [Google Scholar] [CrossRef] [PubMed]
  56. Wan, J.H.; Johnson, M.L.; Guntupalli, R.; Petrenko, V.A.; Chin, B.A. Detection of bacillus anthracis spores in liquid using phage-based magnetoelastic micro-resonators. Sens. Actuators B Chem. 2007, 127, 559–566. [Google Scholar] [CrossRef]
  57. Singh, A.; Arutyunov, D.; Szymanski, C.M.; Evoy, S. Bacteriophage based probes for pathogen detection. Analyst 2012, 137, 3405–3421. [Google Scholar] [CrossRef] [PubMed]
  58. Singh, A.; Arutyunov, D.; McDermott, M.T.; Szymanski, C.M.; Evoy, S. Specific detection of campylobacter jejuni using the bacteriophage nctc 12673 receptor binding protein as a probe. Analyst 2011, 136, 4780–4786. [Google Scholar] [CrossRef] [PubMed]
  59. Tawil, N.; Sacher, E.; Mandeville, R.; Meunier, M. Surface plasmon resonance detection of E. coli and methicillin-resistant s. Aureus using bacteriophages. Biosens. Bioelectron. 2012, 37, 24–29. [Google Scholar] [CrossRef] [PubMed]
  60. Chibli, H.; Ghali, H.; Park, S.; Peter, Y.A.; Nadeau, J.L. Immobilized phage proteins for specific detection of staphylococci. Analyst 2014, 139, 179–186. [Google Scholar] [CrossRef] [PubMed]
  61. Ray, S.; Mehta, G.; Srivastava, S. Label-free detection techniques for protein microarrays: Prospects, merits and challenges. Proteomics 2010, 10, 731–748. [Google Scholar] [CrossRef] [PubMed]
  62. Cho, H.; Lee, B.; Liu, G.L.; Agarwal, A.; Lee, L.P. Label-free and highly sensitive biomolecular detection using sers and electrokinetic preconcentration. Lab Chip 2009, 9, 3360–3363. [Google Scholar] [CrossRef] [PubMed]
  63. Xu, D.X.; Densmore, A.; Delâge, A.; Waldron, P.; McKinnon, R.; Janz, S.; Lapointe, J.; Lopinski, G.; Mischki, T.; Post, E.; et al. Folded cavity soi microring sensors for highsensitivity and real time measurement ofbiomolecular binding. Opt. Express 2008, 16, 15137–15148. [Google Scholar] [CrossRef] [PubMed]
  64. Xu, D.X.; Vachon, M.; Densmore, A.; Ma, R.; Delâge, A.; Janz, S.; Lapointe, J.; Li, Y.; Lopinski, G.; Zhang, D.; et al. Label-free biosensor array based on silicon-on-insulator ring resonators addressed using a WDM approach. Opt. Lett. 2010, 35, 2771–2773. [Google Scholar] [CrossRef] [PubMed]
  65. Liu, G.L.; Lee, L.P. Nanowell surface enhanced raman scattering arrays fabricated by soft-lithography for label-free biomolecular detections in integrated microfluidics. Appl. Phys. Lett. 2005, 87, 074101. [Google Scholar] [CrossRef]
  66. Furuki, M.; Kameoka, J.; Craighead, H.G.; Isaacson, M.S. Surface plasmon resonance sensors utilizing rnicrofabricated channels. Sens. Actuators B Chem. 2001, 79, 63–69. [Google Scholar] [CrossRef]
  67. Cui, Y.; Wei, Q.Q.; Park, H.K.; Lieber, C.M. Nanowire nanosensors for highly sensitive and selective detection of biological and chemical species. Science 2001, 293, 1289–1292. [Google Scholar] [CrossRef] [PubMed]
  68. Wang, X.D.; Wolfbeis, O.S. Fiber-optic chemical sensors and biosensors (2008–2012). Anal. Chem. 2013, 85, 487–508. [Google Scholar] [CrossRef] [PubMed]
  69. Mehrvar, M.; Bis, C.; Scharer, J.M.; Moo-Young, M.; Luong, J.H. Fiber-optic biosensors—Trends and advances. Anal. Sci. 2000, 16, 677–692. [Google Scholar] [CrossRef]
  70. Wang, Y.-M.; Pang, X.-F.; Zhang, Y.-Y. Recent advances in fiber-optic DNA biosensors. J. Biomed. Sci. Eng. 2009, 2, 312–317. [Google Scholar] [CrossRef]
  71. Sekaric, L.; Carr, D.W.; Evoy, S.; Parpia, J.M.; Craighead, H.G. Nanomechanical resonant structures in silicon nitride: Fabrication, operation and dissipation issues. Sens. Actuators A Phys. 2002, 101, 215–219. [Google Scholar] [CrossRef]
  72. Fischer, L.M.; Wilding, N.; Gel, M.; Evoy, S. Low-stress silicon carbonitride for the machining of high-frequency nanomechanical resonators. J. Vac. Sci. Technol. B 2007, 25, 33–37. [Google Scholar] [CrossRef]
  73. Verbridge, S.S.; Craighead, H.G.; Parpia, J.M. A megahertz nanomechanical resonator with room temperature quality factor over a million. Appl. Phys. Lett. 2008, 92. [Google Scholar] [CrossRef]
  74. Southworth, D.R.; Barton, R.A.; Verbridge, S.S.; Ilic, B.; Fefferman, A.D.; Craighead, H.G.; Parpia, J.M. Stress and silicon nitride: A crack in the universal dissipation of glasses. Phys. Rev. Lett. 2009, 102. [Google Scholar] [CrossRef] [PubMed]
  75. Mohammad, M.A.; Dew, S.K.; Evoy, S.; Stepanova, M. Fabrication of sub-10 nm silicon carbon nitride resonators using a hydrogen silsesquioxane mask patterned by electron beam lithography. Microelectron. Eng. 2011, 88, 2338–2341. [Google Scholar] [CrossRef]
  76. Grieshaber, D.; MacKenzie, R.; Voros, J.; Reimhult, E. Electrochemical biosensors-sensor principles and architectures. Sensors 2008, 8, 1400–1458. [Google Scholar] [CrossRef] [Green Version]
  77. Gopel, W.; Heiduschka, P. Interface analysis in biosensor design. Biosens. Bioelectron. 1995, 10, 853–883. [Google Scholar] [CrossRef]
  78. Credou, J.; Volland, H.; Dano, J.; Berthelot, T. A one-step and biocompatible cellulose functionalization for covalent antibody immobilization on immunoassay membranes. J. Mater. Chem. B 2013, 1, 3277–3286. [Google Scholar] [CrossRef]
  79. Mevellec, V.; Roussel, S.; Tessier, L.; Chancolon, J.; Mayne-L'Hermite, M.; Deniau, G.; Viel, P.; Palacin, S. Grafting polymers on surfaces: A new powerful and versatile diazonium salt-based one-step process in aqueous media. Chem. Mater. 2007, 19, 6323–6330. [Google Scholar] [CrossRef]
  80. Mesnage, A.; Esnouf, S.; Jegou, P.; Deniau, G.; Palacin, S. Understanding the redox-induced polymer grafting process: A dual surface-solution analysis. Chem. Mater. 2010, 22, 6229–6239. [Google Scholar] [CrossRef]
  81. Guthy, C.; Das, R.M.; Drobot, B.; Evoy, S. Resonant characteristics of ultranarrow SiCN nanomechanical resonators. J. Appl. Phys. 2010, 108, 014306. [Google Scholar] [CrossRef]
  82. Guthy, C.; Belov, M.; Janzen, A.; Quitoriano, N.J.; Singh, A.; Wright, V.A.; Finley, E.; Kamins, T.I.; Evoy, S. Large-scale arrays of nanomechanical sensors for biomolecular fingerprinting. Sens. Actuators B Chem. 2013, 187, 111–117. [Google Scholar] [CrossRef]
  83. Shewchuk, D.M.; McDermott, M.T. Comparison of diazonium salt derived and thiol derived nitrobenzene layers on gold. Langmuir 2009, 25, 4556–4563. [Google Scholar] [CrossRef] [PubMed]
  84. El Hadj, F.A.; Amiar, A.; Cherkaoui, M.; Chazalviel, J.N.; Ozanam, F. Study of organic grafting of the silicon surface from 4-nitrobenzene diazonium tetrafluoroborate. Electrochim. Acta 2012, 70, 318–324. [Google Scholar] [CrossRef]
  85. Young, J.; Su, Y.; Lee, S.; Pak, C.; Kim, H. Enhanced durability of linker-containing carbon nanotube functionalized via diazonium reaction. Electrochim. Acta 2015, 154, 63–69. [Google Scholar]
  86. Solak, A.O.; Eichorst, L.R.; Clark, W.J.; McCreery, R.L. Modified carbon surfaces as "organic electrodes" that exhibit conductance switching. Anal. Chem. 2003, 75, 296–305. [Google Scholar] [CrossRef] [PubMed]
  87. Combellas, C.; Kanoufi, F.; Pinson, J.; Podvorica, F.I. Time-of-flight secondary ion mass spectroscopy characterization of the covalent bonding between a carbon surface and aryl groups. Langmuir 2005, 21, 280–286. [Google Scholar] [CrossRef] [PubMed]
  88. Assresahegn, B.D.; Brousse, T.; Bélanger, D. Advances on the use of diazonium chemistry for functionalization of materials used in energy storage systems. Carbon 2015, 92, 362–381. [Google Scholar] [CrossRef]
  89. Menanteau, T.; Benoît, C.; Breton, T.; Cougnon, C. Enhancing the performance of a diazonium-modified carbon supercapacitor by controlling the grafting process. Electrochem. Commun. 2016, 63, 70–73. [Google Scholar] [CrossRef]
  90. Bouša, D.; Pumera, M.; Sedmidubský, D.; Šturala, J.; Luxa, J.; Mazánek, V.; Sofer, Z. Fine tuning of graphene properties by modification with aryl halogens. Nanoscale 2016, 8, 1493–1502. [Google Scholar] [CrossRef] [PubMed]
  91. González, M.C.R.; Orive, A.G.; Salvarezza, R.C.; Creus, A.H. Electrodeposition of gold nanoparticles on aryl diazonium monolayer functionalized hopg surfaces. Phys. Chem. Chem. Phys. 2016, 18, 1953–1960. [Google Scholar] [CrossRef] [PubMed]
  92. Stewart, M.P.; Maya, F.; Kosynkin, D.V.; Dirk, S.M.; Stapleton, J.J.; McGuiness, C.L.; Allara, D.L.; Tour, J.M. Direct covalent grafting of conjugated molecules onto si, gaas, and pd surfaces from aryidiazonium salts. J. Am. Chem. Soc. 2004, 126, 370–378. [Google Scholar] [CrossRef] [PubMed]
  93. Bengamra, M.; Khlifi, A.; Ktari, N.; Mahouche-Chergui, S.; Carbonnier, B.; Fourati, N.; Kalfat, R.; Chehimi, M.M. Silanized aryl layers through thiol-yne photo-click reaction. Langmuir 2015, 31, 10717–10724. [Google Scholar] [CrossRef] [PubMed]
  94. Hurley, B.L.; McCreery, R.L. Covalent bonding of organic molecules to cu and al alloy 2024 t3 surfaces via diazonium ion reduction. J. Electrochem. Soc. 2004, 151, B252–B259. [Google Scholar] [CrossRef]
  95. Laurentius, L.; Stoyanov, S.R.; Gusarov, S.; Kovalenko, A.; Du, R.; Lopinski, G.P.; McDermott, M.T. Diazonium-derived aryl films on gold nanoparticles: Evidence for a carbon–gold covalent bond. Acs Nano 2011, 5, 4219–4227. [Google Scholar] [CrossRef] [PubMed]
  96. Chevalier, C.L.; Landis, E.C. Electrochemical attachment of diazonium-generated films on nanoporous gold. Langmuir 2015, 31, 8633–8641. [Google Scholar] [CrossRef] [PubMed]
  97. Neal, S.N.; Workie, B.; McCandless, B.E.; Mohamed, A.A. Gold-organic thin films from the reductive grafting of diazonium gold(III) salts. J. Electroanal. Chem. 2015, 757, 73–79. [Google Scholar] [CrossRef]
  98. Zheng, W.; Du, R.B.; Cao, Y.; Mohammad, M.A.; Dew, S.K.; McDermott, M.T.; Evoy, S. Diazonium chemistry for the bio-functionalization of glassy nanostring resonator arrays. Sensors 2015, 15, 18724–18741. [Google Scholar] [CrossRef] [PubMed]
Figure 1. Diagram of diazonium aryl functionalization of SiCN surfaces.
Biosensors 06 00008 g001
Figure 2. Schematic diagram of rabbit IgG sandwich assay onto SiCN surfaces. (a) grafting of aryl groups, as described in Figure 1; (b) activation of carboxyl groups and attachment of anti-rabbit IgG and BSA blocking layer; (c) specific capture of rabbit IgG; (d) tagging using FITC-labelled anti-rabbit IgG; (e) tagging using gold nanoparticles functionalized with anti-rabbit IgG.
Biosensors 06 00008 g002
Figure 3. XPS survey of SiCN film.
Biosensors 06 00008 g003
Figure 4. Comparison of presence of AuNP on the surface of sample chip A1 and negative control chip C1: (A) AuNP distribution on chip A1 under 10,000x magnification, scale bar length is 1 μm; (B) AuNP distribution on chip A1 under 20,000x magnification, scale bar length is 200 nm; (C) AuNP distribution on chip C1 under 10,000x magnification, scale bar length is 1 μm; (D) AuNP distribution on chip C1 under 20,000x magnification, scale bar length is 200 nm.
Biosensors 06 00008 g004
Figure 5. Comparison of presence of AuNPs on the surface of sample chip B1 and negative control chip D1: (A) AuNP distribution on chip B1 under 10,000 times magnification, scale bar length 1 μm; (B) AuNP distribution on chip B1 under 20,000 times magnification, scale bar length 200 nm; (C) AuNP distribution on chip D1 under 10,000 times magnification, scale bar length is 1 μm; (D) AuNP distribution on chip D1 under 20,000 times magnification, scale bar length is 200 nm.
Biosensors 06 00008 g005
Figure 6. Comparison of presence and density of AuNP on the surface of chips A1 and B1 under high magnification: (A) AuNP distribution on chip A1 under 50,000 times magnification, scale bar stands for 100 nm; (B) AuNP distribution on chip A1 under 100,000 times magnification, scale bar stands for 100 nm; (C) AuNP distribution on chip A1 under 200,000 times magnification, scale bar stands for 20 nm; (D) AuNP distribution on chip B1 under 50,000 times magnification, scale bar stands for 200 nm; (E) AuNP distribution on chip B1 under 100,000 times magnification, scale bar stands for 100 nm; (F) AuNP distribution on chip B1 under 200,000 times magnification, scale bar stands for 20 nm.
Biosensors 06 00008 g006
Figure 7. EDX analysis of substrate immobilized with AuNP: (A) SEM image of AuNP; (B) EDX spectrum of a point of the particle, showing peaks of gold, silicon, carbon and nitrogen; (C) EDX map of distribution and relative intensity of gold in scanned area; (D) EDX map of distribution and relative intensity of silicon in scanned area; (E) EDX map of distribution and relative intensity of carbon in scanned area; (F) EDX map of distribution and relative intensity of element nitrogen in scanned area. Scale bar stands for 50 nm.
Biosensors 06 00008 g007
Figure 8. Comparison of presence of FITC on the surface of sample chip A2, B2 and control chip C2, D2: (A) FITC distribution on chip A2; (B) FITC distribution on chip B2; (C) FITC distribution on chip C2; (D) FITC distribution on chip D2. Scale bar stands for 2 μm.
Biosensors 06 00008 g008
Table 1. Element composition analysis of SiCN film.
ElementAtomic Concentration %Mass Concentration %
N 1s29.6921.94
C 1s30.8719.57
Si 2p39.4658.49
Table 2. Mean optical intensity of FITC on the surface of sample chip A2, B2 and control chip C2, D2.
SampleIntensity (AU)Signal to Noise RatioDilution Ratio of FITC Conjugated Anti-Rabbit IgG
A237,9671851:200
C2205
B225,7911051:400
D2245
Table 3. Description of Samples.
SampleControl TypeDilution RatioLabel
A1positive1:1AuNP
B1positive1:3AuNP
C1negative1:1AuNP
D1negative1:3AuNP
A2positive1:200FITC
B2positive1:400FITC
C2negative1:200FITC
D2negative1:400FITC

