Article

A Label-Free Impedance Immunosensor Using Screen-Printed Interdigitated Electrodes and Magnetic Nanobeads for the Detection of E. coli O157:H7

1
Department of Biological and Agricultural Engineering, University of Arkansas, Fayetteville, AR 72701, USA
2
Cell and Molecular Biology Program, University of Arkansas, Fayetteville, AR 72701, USA
3
College of Information and Electrical Engineering, China Agricultural University, Beijing 100083, China
4
Center of Excellence for Poultry Science, University of Arkansas, Fayetteville, AR 72701, USA
5
College of Biosystems Engineering and Food Science, Zhejiang University, Hangzhou 310068, China
*
Author to whom correspondence should be addressed.
Biosensors 2015, 5(4), 791-803; https://doi.org/10.3390/bios5040791
Submission received: 15 October 2015 / Revised: 5 December 2015 / Accepted: 11 December 2015 / Published: 15 December 2015
(This article belongs to the Special Issue Affinity Sensors)

Abstract

:
Escherichia coli O157:H7 is one of the leading bacterial pathogens causing foodborne illness. In this study, an impedance immunosensor based on the use of magnetic nanobeads and screen-printed interdigitated electrodes was developed for the rapid detection of E. coli O157:H7. Magnetic nanobeads coated with anti-E. coli antibody were mixed with an E. coli sample and used to isolate and concentrate the bacterial cells. The sample was suspended in redox probe solution and placed onto a screen-printed interdigitated electrode. A magnetic field was applied to concentrate the cells on the surface of the electrode and the impedance was measured. The impedance immunosensor could detect E. coli O157:H7 at a concentration of 104.45 cfu·mL−1 (~1400 bacterial cells in the applied volume of 25 μL) in less than 1 h without pre-enrichment. A linear relationship between bacteria concentration and impedance value was obtained between 104 cfu·mL−1 and 107 cfu·mL−1. Though impedance measurement was carried out in the presence of a redox probe, analysis of the equivalent circuit model showed that the impedance change was primarily due to two elements: Double layer capacitance and resistance due to electrode surface roughness. The magnetic field and impedance were simulated using COMSOL Multiphysics software.

Graphical Abstract

1. Introduction

Escherichia coli O157:H7 is one of the most dangerous foodborne pathogens, infecting an estimated 63,000 people in the US each year, including 20 deaths, and having an infective dose as low as 10 cells [1,2]. Infection of E. coli O157:H7 may cause a life-threatening complication known as hemolytic uremic syndrome in 10%–15% of patients with hemorrhagic colitis. E. coli O157:H7 infections have primarily been associated with ground beef and leafy green produce but increased integration of the food supply chain has resulted in E. coli O157:H7 contamination of unusual food products, such as cookie dough and hazelnuts [3]. Contaminated food products not only threaten human health but also cost food producers millions of dollars in economic loss [4]. As such, a method to rapidly detect E. coli O157:H7 in food products is needed.
Bacterial culture and plating and polymerase chain reaction are the traditional methods for E. coli O157:H7 detection, but these methods are time-consuming and require trained personnel and specialized laboratories and equipment. Results may take days, during which food products may have been shipped to consumers or to other producers. Biosensors have attracted attention in the field of foodborne pathogen detection due to their speed, simplicity, and low cost. Several types of biosensors have been developed for the detection of E. coli O157:H7 including quartz crystal microbalance [5,6,7,8], surface plasmon resonance [9,10,11,12] and electrochemistry [13,14,15,16,17,18,19,20,21]. Many of the developed biosensors relied on immobilization of antibodies on the sensing surface to concentrate and hold the bacterial cells close enough to the sensing surface for measurement. This method has the problem of low capture efficiency, often being as low as 35% even after extensive optimization [22]. A method not reliant on electrode immobilization should be used to overcome the problem of low capture efficiency.
Magnetic nanoparticles have been used extensively in biosensors for bacterial detection though usually for immunomagnetic separation of the bacteria from a sample [13,14,15] or as labels to increase the sensitivity of the biosensor [7,8]. Magnetic nanoparticles may also be used to concentrate the bacterial cells onto the sensing surface, as done by Varshney and Li [13], where a magnetic field was applied under the electrode to pull the bacteria close to an interdigitated microelectrode array for sensitive detection. The interdigitated microelectrode arrays used by Varshney and Li [13], while being highly sensitive, were time-consuming and expensive to produce, making them impractical for commercial use. Screen printed interdigitated electrodes are capable of being produced at a much lower cost and in high volume, making them practical for use in commercialized rapid tests. Recently, a screen printed interdigitated electrode was successfully used for the development of an impedance biosensor for detection of avian influenza (AI) virus [23], but this reported biosensor required signal amplification with labels. The impedance immunosensor developed in this research was a label-free detection approach. In addition, the size of AI virus is 80–120 nm in diameter, whereas an E. coli O157:H7 cell is about 1–1.5 μm long and 0.5 μm (or 500 nm) in diameter, and there are many differences in biological components; e.g. physical structure and binding sites, between AI virus and bacterial cells. Therefore, we have attempted to explore a new application of the screen printed interdigitated electrode based impedance immunosensor for bacteria detection.
In this study, an impedance immunosensor for the detection of E. coli O157:H7 was developed using antibody-coated magnetic nanobeads and screen printed interdigitated electrodes. In the research the antibody-coated magnetic nanobeads served three roles: (1) to specifically separate E. coli O157:H7 cells from media and place them in redox probe for measurement; (2) to concentrate the separated E. coli O157:H7 into a smaller volume; and (3) to concentrate the E. coli O157:H7 cells onto the surface of the screen printed electrode. An equivalent circuit model was developed to understand the phenomenon involved in the impedance measurement.

2. Experimental Section

2.1. Bacterial Culture

Escherichia coli O157:H7 was purchased from American Type Culture Collection (ATCC 43888) and stored in brain heart infusion broth (BHI, Remel Inc., Lenexa, KS, USA) at −80 °C. The culture was grown in brain-heart infusion (BHI) broth at 37 °C for 18 h. For enumeration the culture was serially diluted in phosphate buffered saline (PBS; 0.01 M; pH 7.4; Sigma-Aldrich, St. Louis, MO, USA) and plated on sorbitol MacConkey agar (SMAC, Remel Inc., part of Thermo Fisher Scientific, Lenexa, KS, USA) incubated at 37 °C for 22–24 h. Due to biosafety concerns, the bacteria was killed by boiling for 10 min before use in biosensor tests.

2.2. Biological and Chemical Reagents

Phosphate buffered saline (PBS; 0.01 M; pH 7.4) was purchased from Sigma-Aldrich. Biotin-labeled anti-E. coli antibody (Catalog # B65007R) was purchased from Meridian Life Science (Memphis, TN, USA). It is a rabbit antibody to E. coli, O and K antigenic serotypes. It was diluted to 0.4–0.5 mg·mL−1 with PBS for use in tests. All solutions were prepared with deionized water from Millipore (Milli-Q, 18.2 MΩ·cm, Bedford, MA, USA).

2.3. Screen-Printed Interdigitated Electrodes and Magnetic Nanobeads

Gold screen-printed interdigitated electrodes were provided by Aibit, LLC (Jiangyin, China). The interdigitated electrode consisted of three pairs of 200 µm wide electrodes spaced 200 µm apart arranged in a circular array printed on a ceramic substrate. The outer diameter of the array was 5.4 mm. A photograph and drawing of the interdigitated screen printed electrode is shown in the supplemental materials (Figure S1). Streptavidin coated magnetic nanobeads (Fe3O4; ~150 nm diameter) were purchased from R & D Systems (Minneapolis, MN, USA) and used at the stock concentration (1 mg·mL−1).

2.4. Impedance Measurement

Impedance measurements were performed using an IM-6 impedance analyzer with IM-6/Thales software (BAS, West Lafayette, IN, USA). Test-sense and counter-reference probes were connected to the electrode. An AC potential of 50 mV was used for all impedance measurements. Impedance magnitude and phase angle were measured at 38 points in the frequency range of 10 Hz to 100 kHz. All impedance measurements were done in the presence of a redox probe consisting of 5 mM [Fe(CN)6]3−/4− (1:1 ratio) mixture in PBS.

2.5. Immunomagnetic Separation of E. coli O157:H7

Antibody-coated nanobeads were prepared by mixing 20 μL of streptavidin coated magnetic nanobeads with 20 μL of biotin labeled anti- E. coli O157:H7 antibody in 200 μL of PBS for 45 min in a rotating mixer at 5 rpm. A magnetic field (~0.7 T) was applied using a magnetic separator consisting of six permanent magnets (Aibit LLC) for 4 min and the bead/antibody complexes were washed twice with 200 μL of PBS. The nanobeads were split into two tubes. A 200 μL sample of E. coli O157:H7 was added to one tube and 200 μL of PBS was added to another tube to serve as a negative control sample. The samples were mixed for 45 min in a rotating mixer at 5 rpm. The samples were then magnetically separated for 4 min and washed twice with redox probe and each suspended in 100 μL of redox probe for impedance measurement. All mixing was done at room temperature.

2.6. Detection of E. coli O157:H7

Screen-printed interdigitated electrodes were cleaned using 1 M NaOH for 3 min. The electrode was then washed with deionized water and dried with nitrogen. Impedance detection of E. coli O157:H7 was done by placing a 25 μL drop of a prepared sample from immunomagnetic separation onto the electrode surface. A magnetic field with a surface intensity of ~0.4 T was applied using a permanent magnet (neodymium magnet, CMS Magnetics, Garland, TX, USA) and used to draw the bacteria/nanobead complexes to the electrode surface for 10 min before impedance measurement. The impedance was measured while the magnetic field was still being applied. The impedance of the control sample prepared in parallel with the bacterial sample was measured first to gather a baseline for detection. The impedance of each bacteria sample was compared to the control sample prepared in parallel to it. Figure 1 shows the diagrams of the immunomagnetic separation and detection protocols.

2.7. The Preparation, Inoculation and Detection of Ground Beef Samples

Ground beef was purchased from a local grocery store, and transported to the lab within 15 min. Twenty-five grams of ground beef was weighted and transferred into a filtering stomacher bag. Then, 225 mL of sterile PBS solution was added to the stomacher bag, and mixed in a stomacher (Stomacher 400, Seward, UK) at 200 rpm for two min. After that, 10 mL of stomaching solution were collected and inoculated with E. coli O157:H7 at concentrations of 105 and 106 cfu·mL−1 for use in the tests. The same protocol as described earlier for detection of E. coli O157:H7 was followed in the test, except the ground beef sample was used instead of pure bacterial culture of E coli O157:H7.
Figure 1. Immunomagnetic separation of E. coli O157:H7 from media using the antibody-coated nanobeads and the concentration of bacteria on the electrode surface using a magnetic field.
Biosensors 05 00791 g001

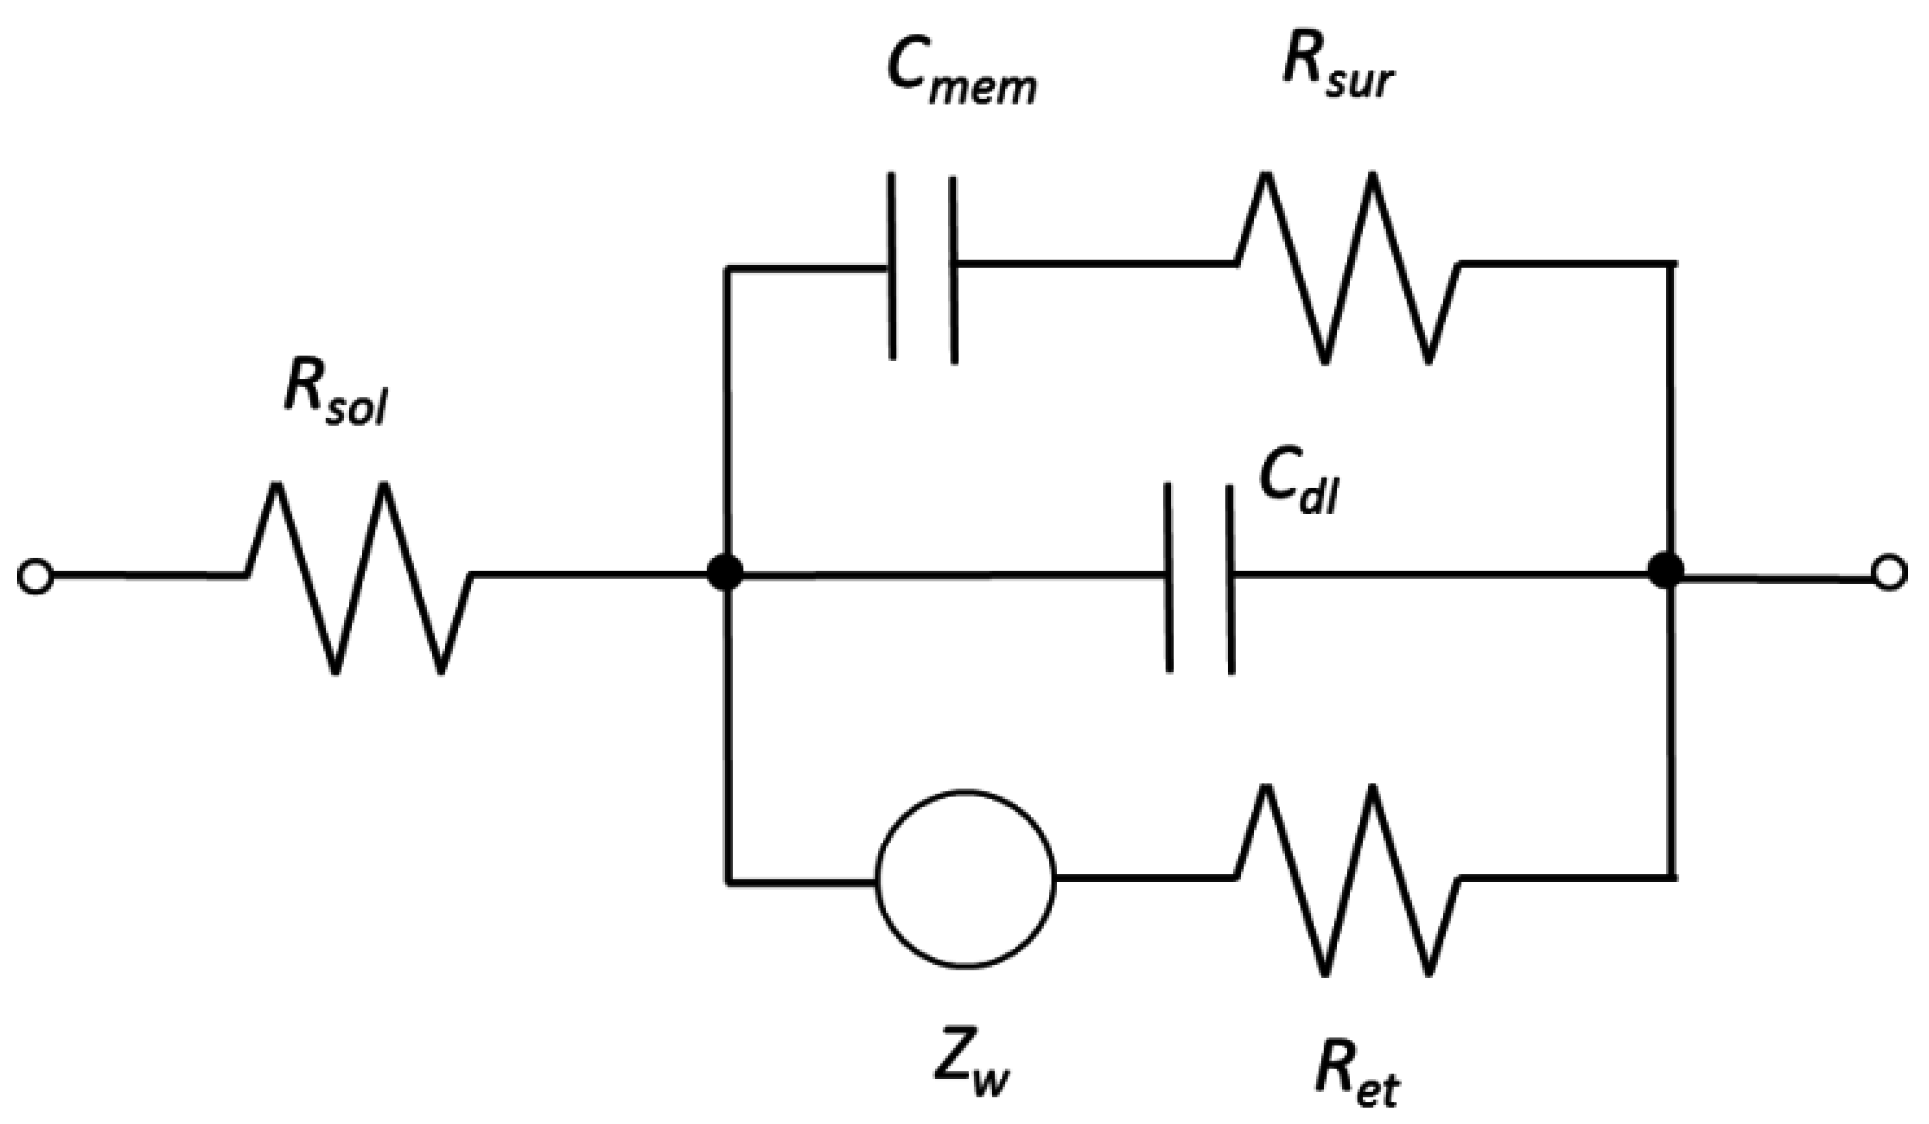
2.8. Equivalent Circuit Modeling and Statistical Analysis

An equivalent circuit was built and evaluated using IM-6/Thales software. Statistical analysis of data and preparation of graphs were done using Microsoft Excel (Microsoft, Redmond, WA, USA).
Escherichia coli O157:H7 at concentrations of 104 to 107 cfu·mL−1 were measured. Means and standard deviations were calculated based on triplicate tests. Lower detection limits were determined as a signal/noise ratio of 3, where the noise was defined as the standard deviation of the negative PBS control. Statistically significant differences were determined using t-tests (α = 0.05).

2.9. Electron Microscopy

Electron scanning electron microscopy was done using a Philips XL30 ESEM (Environmental Scanning Electron Microscope, FEI, Hillsboro, OR, USA) to confirm binding of the antibody-coated nanobeads to the E. coli O157:H7 cells. A sample was prepared using the protocol described in Section 2.5. Fixation was done using Karnovsky’s fixative followed by dehydration with successive ethanol washes.

2.10. Comsol Simulation

Comsol Multiphysics software was used to construct a computer model of the biosensor system. Simulations were performed to observe the effect of the E. coli cells on impedance change at varying distances from the electrode surface. A simplified computer model representing a 200 μm × 600 μm cutout of the electrode contained two 200 μm square electrode fingers separated by a 200 μm gap. A height of 150 μm was added to the system to simulate part of a droplet on the electrode surface. The layout of the computer model is shown in the supplemental material (Figure S2).
E. coli cells in the system were modeled as ellipsoids 1.5 μm long and 0.5 μm wide with membrane conductivity and cell wall permittivity of 0.5 S/m and 60, respectively [24,25]. For the interior of the chamber the conductivity and relative permittivity were set to 0.0001 S/m and 77 to simulate the 0.01 M PBS used in the experiment. The electrical conductivity of the gold electrode was set to 4.1 × 10⁷ S/m. The relative permittivity of gold is presumed to be infinite. Due to software limitations involved in solving for an infinite relative permittivity, boundary conditions were set for the surface of the gold electrode and the interior electrostatics were not solved for.
A voltage amplitude of 50 mV was applied at a frequency of 100 Hz and an electric field distribution was obtained, from which the impedance value was calculated. The simulated E. coli cells were positioned on the electrode surface as well as 1, 5, 10, 25, 50, and 75 μm above the electrode surface to observe the change in impedance values at different distances between the cells and electrode surface.

3. Results and Discussion

3.1. Characterization of Impedance Spectrum Data

Impedance magnitudes and phase angles for the detection of a sample containing 107 cfu·mL−1 E. coli O157:H7 and a negative control sample are shown in Figure 2. The presence of bacteria resulted in a decrease in impedance magnitude and the maximum decrease occurred at 100 Hz. The phase angle describes the contribution of the resistance and capacitance elements to the impedance value. A current passing through a capacitor is phase shifted by −90° with respect to the voltage while a current passing through a resistor is in phase with the voltage, therefore having a phase angle of 0°. A phase angle between −90° and 0° indicates that the impedance value is affected by a combination of resistance and capacitive elements. The phase angles for both the bacterial and control samples decreased in the middle frequency around 500 Hz to 1 kHz and in the high frequency range nearing 100 kHz. In the higher frequency range between 10 kHz and 30 kHz the phase angle for both samples increased, though the bacterial sample phase angle was lower than the control sample’s. At the lower frequency range (10 Hz to 500 Hz), the phase angle of the bacterial sample was higher than the control sample’s. The phase angle data suggests that the presence of bacteria disrupted a capacitance element at the higher frequencies while creating a capacitance element in the low frequency range. An equivalent circuit model was built and evaluated to better understand the impedance spectrum data.
Figure 2. A typical Bode plot of the measured impedance data of the control and E. coli O157:H7 at a concentration of 107 cfu/mL. (a) Impedance magnitude and (b) Phase angle. The frequency range was 10 Hz to 100 kHz. The amplitude of voltage applied was 50 mV.
Biosensors 05 00791 g002
The equivalent circuit shown in Figure 3 contained three resistance elements corresponding to bulk electrolyte resistance (Rsol), electron transfer resistance (Ret) and resistance due to surface roughness (Rsur), two capacitance elements corresponding to double layer capacitance (Cdl) and capacitance of bacterial cells (Cmem)25, and a Warburg impedance element (Zw). A fitting analysis showed that the equivalent circuit fit the measured data with an average error of 0.4% and a maximum error of 4.6% for the impedance magnitude and an average error of 0.2° and a maximum error of 3.1° for the phase angle as shown in the supplemental materials (Figure S3).
Figure 3. Equivalent circuit used for data analysis. The equivalent circuit components were bulk electrolyte (Rsol), electron transfer resistance (Ret), resistance due to surface roughness (Rsur), double layer capacitance (Cdl), capacitance of bacterial cells (Cmem), and a Warburg impedance element (Zw).
Biosensors 05 00791 g003
Two capacitance elements, Cmem and Cdl, were looked at to better understand the phase angle data. The Cdl element decreased by 53 nF between the control and the sample containing 107 cfu·mL−1 cells, showing that the presence of bacteria disrupting the formation of a double layer capacitor on the electrode surface. The Cmem element increased 13 μF between the control and the sample containing 107 cfu·mL−1 cells, suggesting that the presence of the bacterial cells formed a capacitance element in the system [26]. From this information, it can be implied that the presence of bacteria disrupted the double layer capacitance in the high frequency range while producing a capacitance element in the low frequency ranges. This would explain the pattern seen in the phase angle data.
The Rsur element decreased 76 Ω between the control and the sample containing 107 cfu·mL−1 cells. The decrease in resistance may be explained by an increase in the electrode surface roughness due to the presence of nanobeads and nanobead/bacteria clusters on the electrode. The addition of the beads and clusters likely had the effect of increasing the conductive surface area of the electrode, thereby reducing the resistance of electrical flow. The nanobead/bacteria clusters may have also formed “bridges” between the electrode fingers, further reducing the resistance. The resistance of the electron transfer decreased 21 Ω between the control and the bacteria sample, indicating the bacteria did not form a large enough layer on the electrode surface to impede electron transfer from the surface of the electrode. Rsol only decreased 3 Ω between the bacterial and control samples.

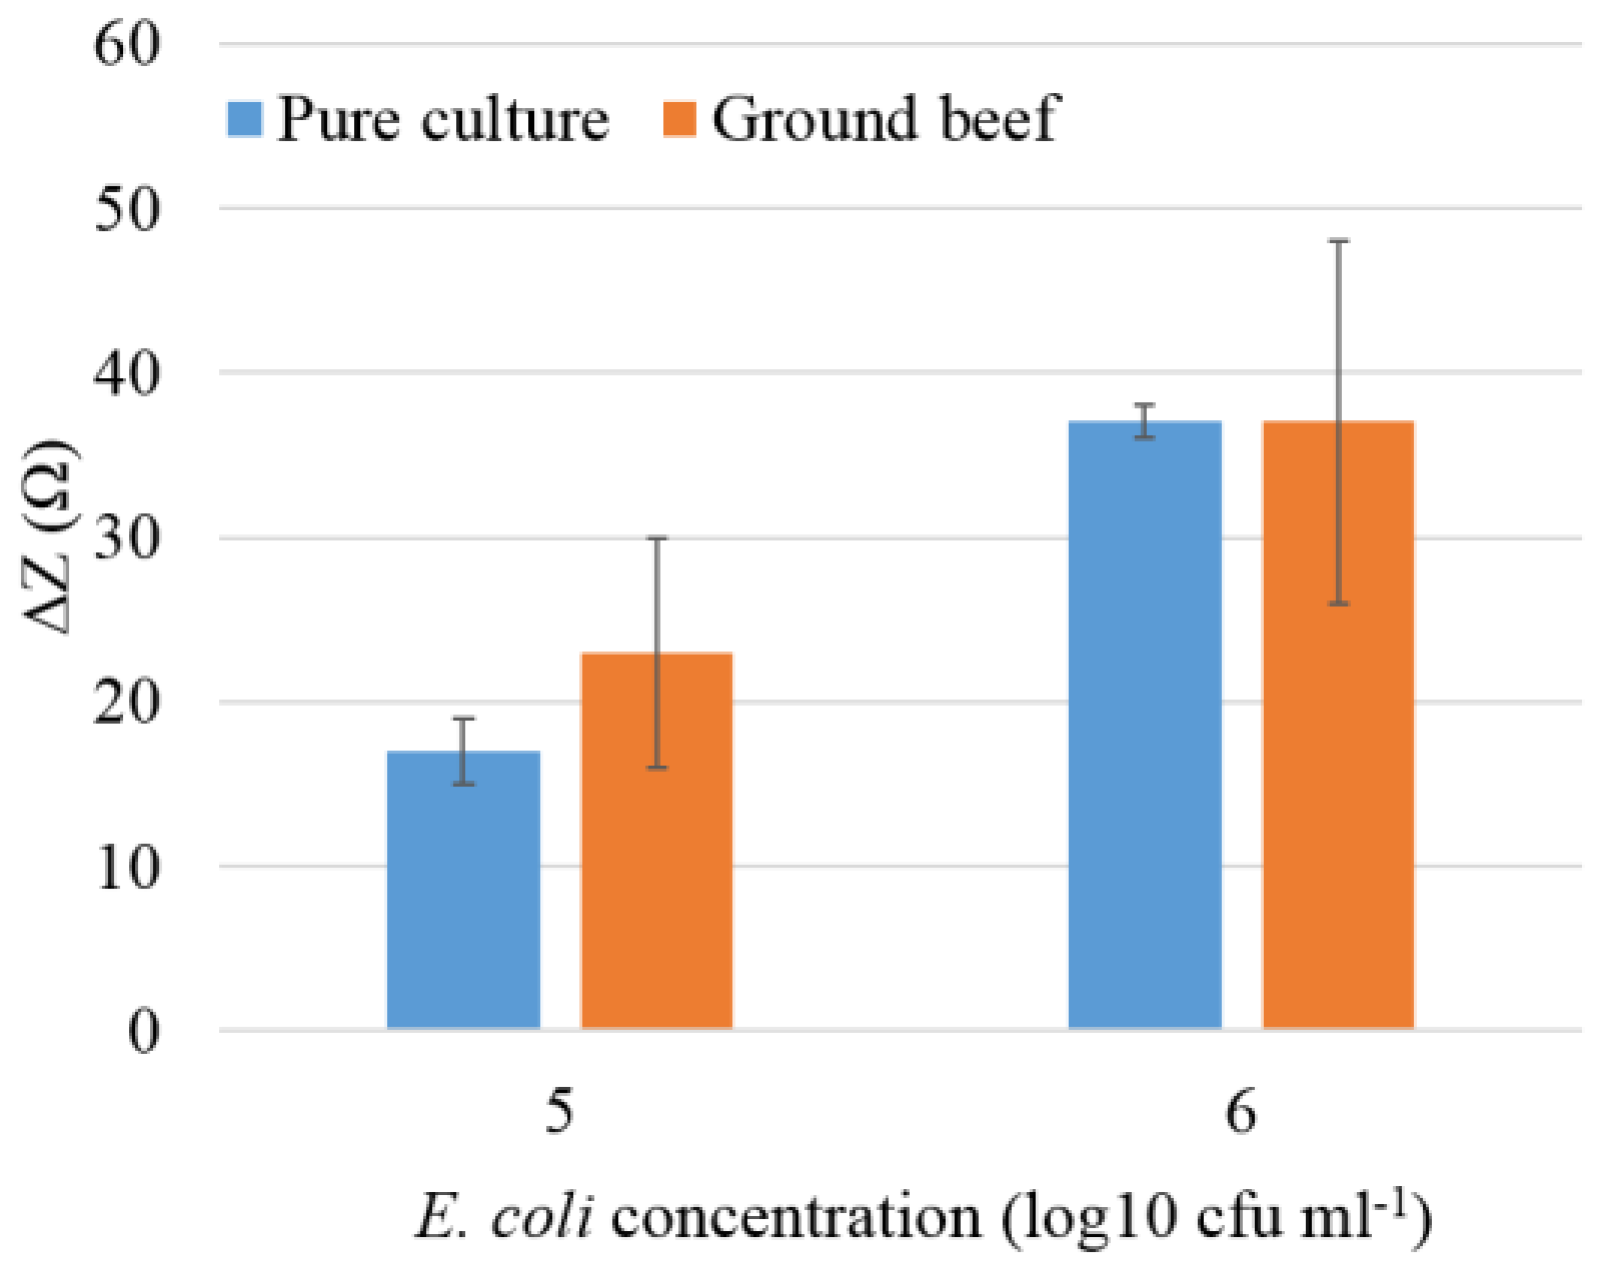
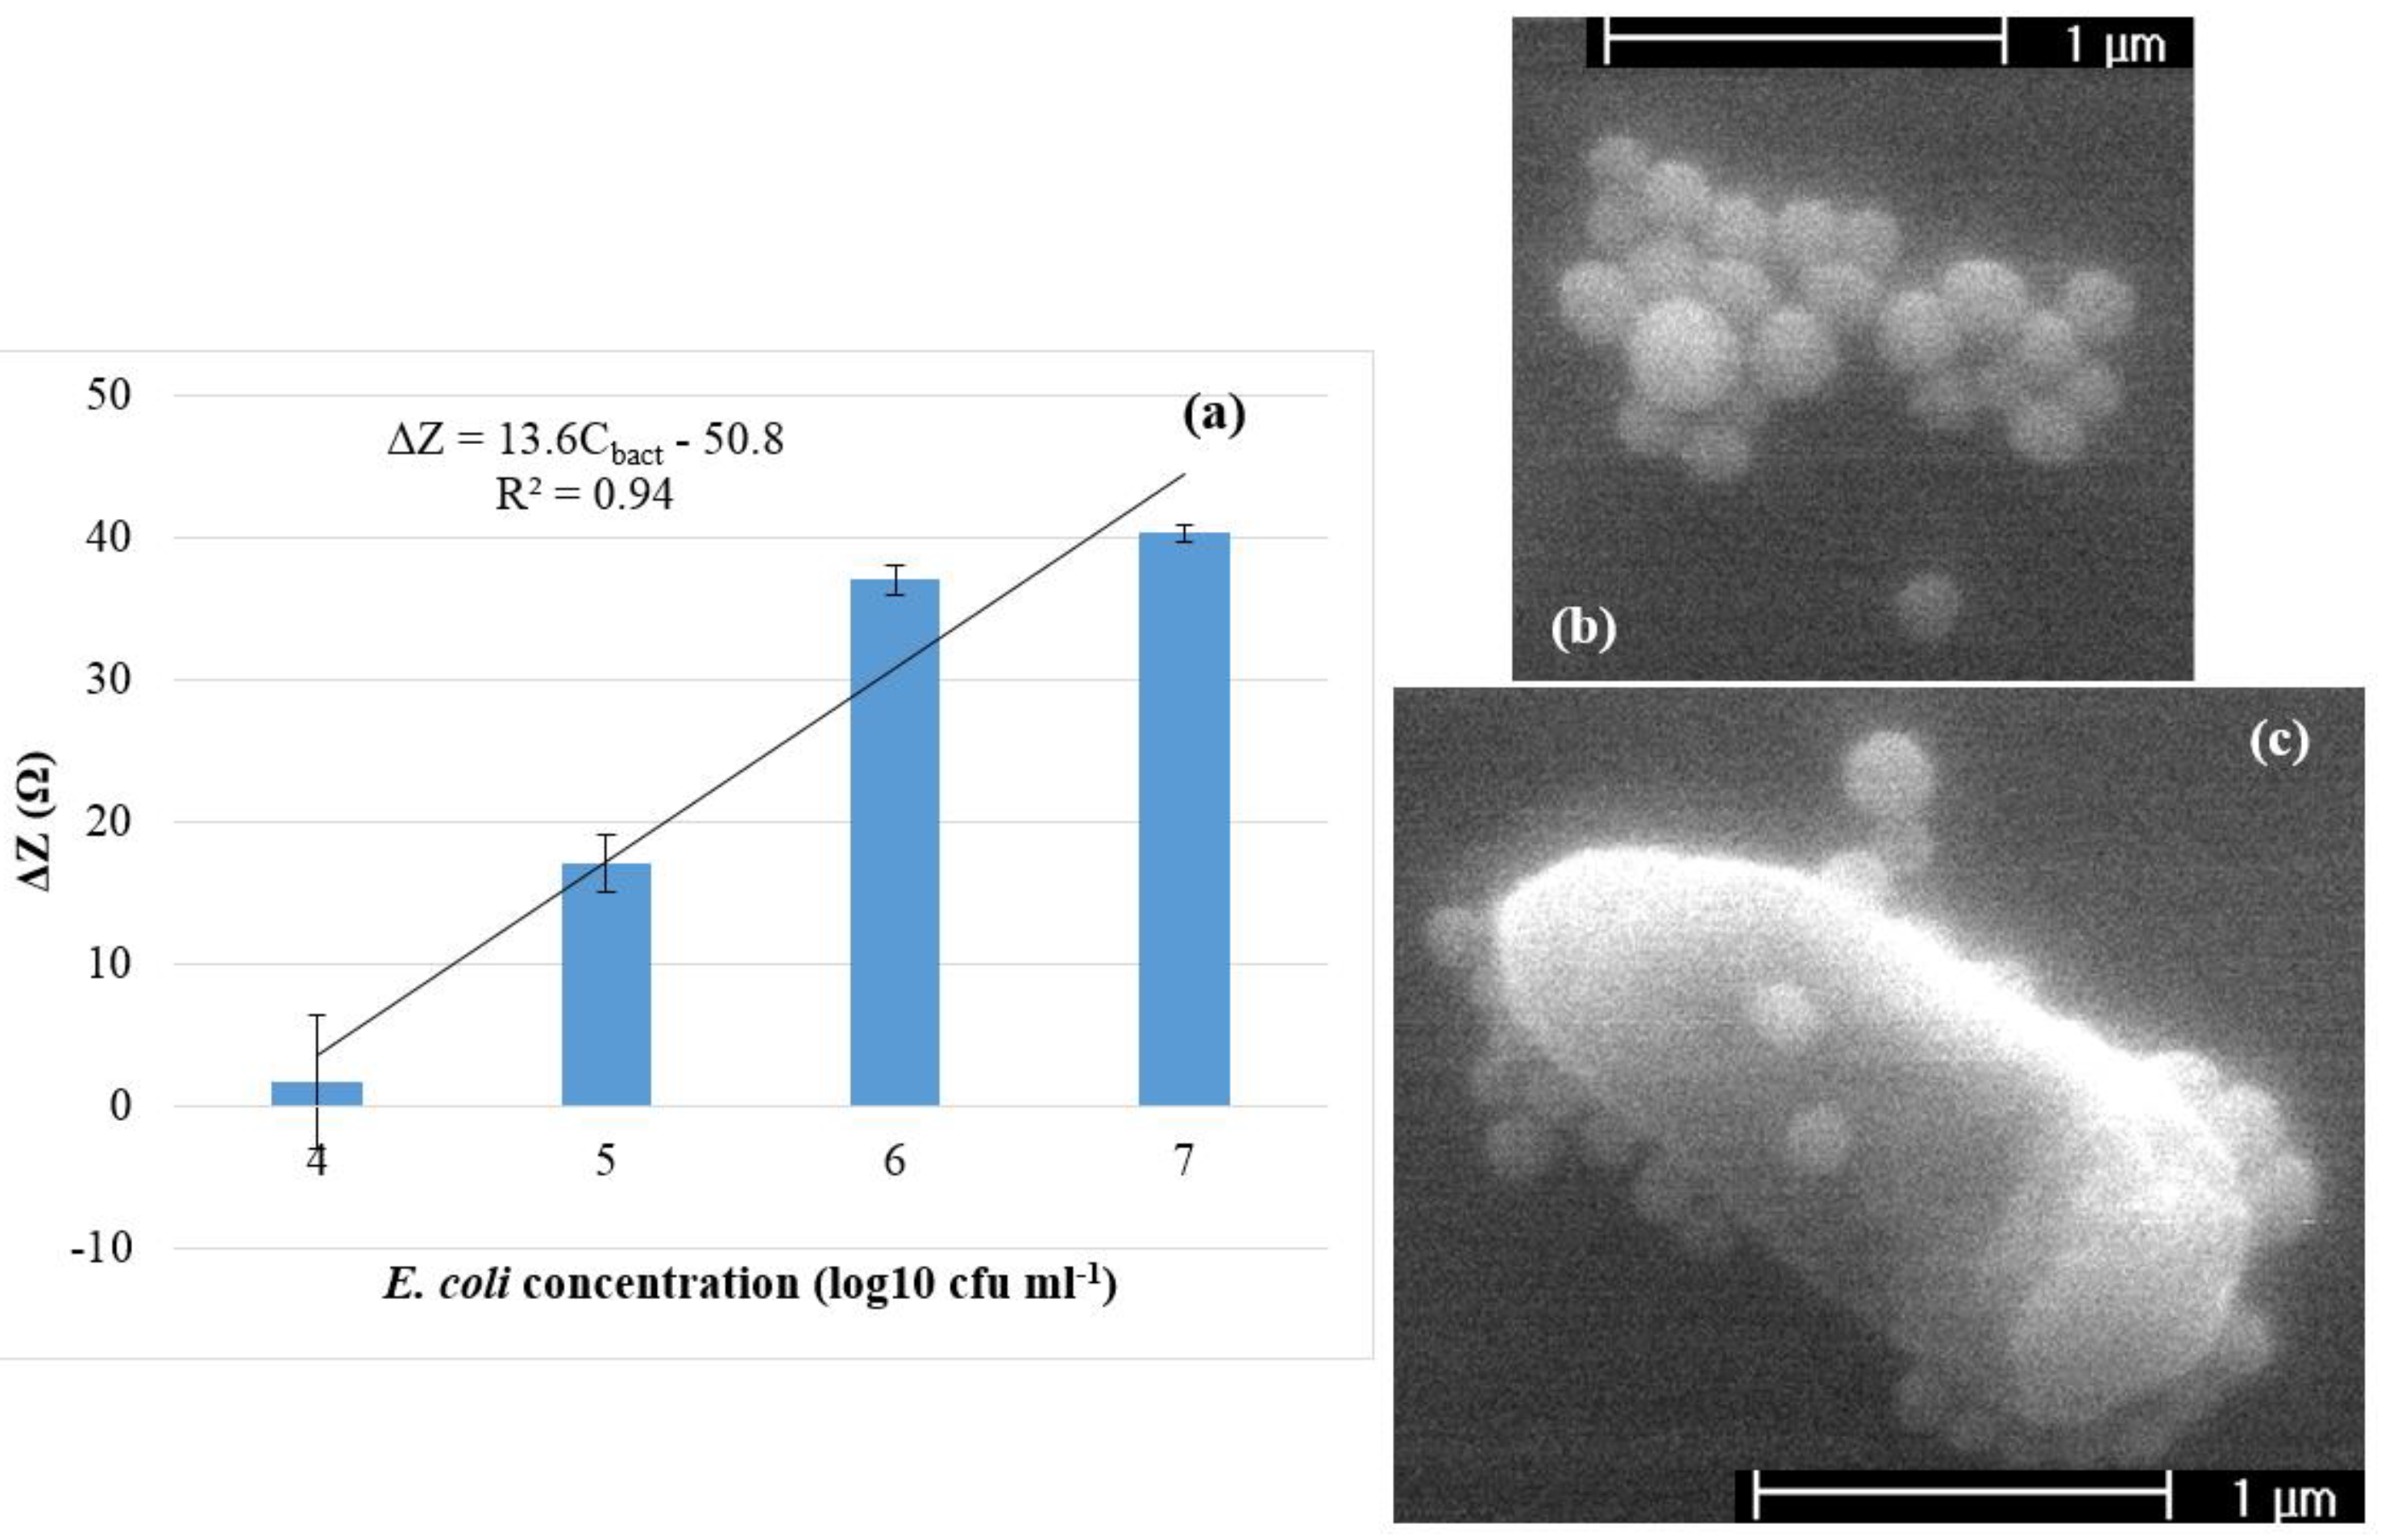
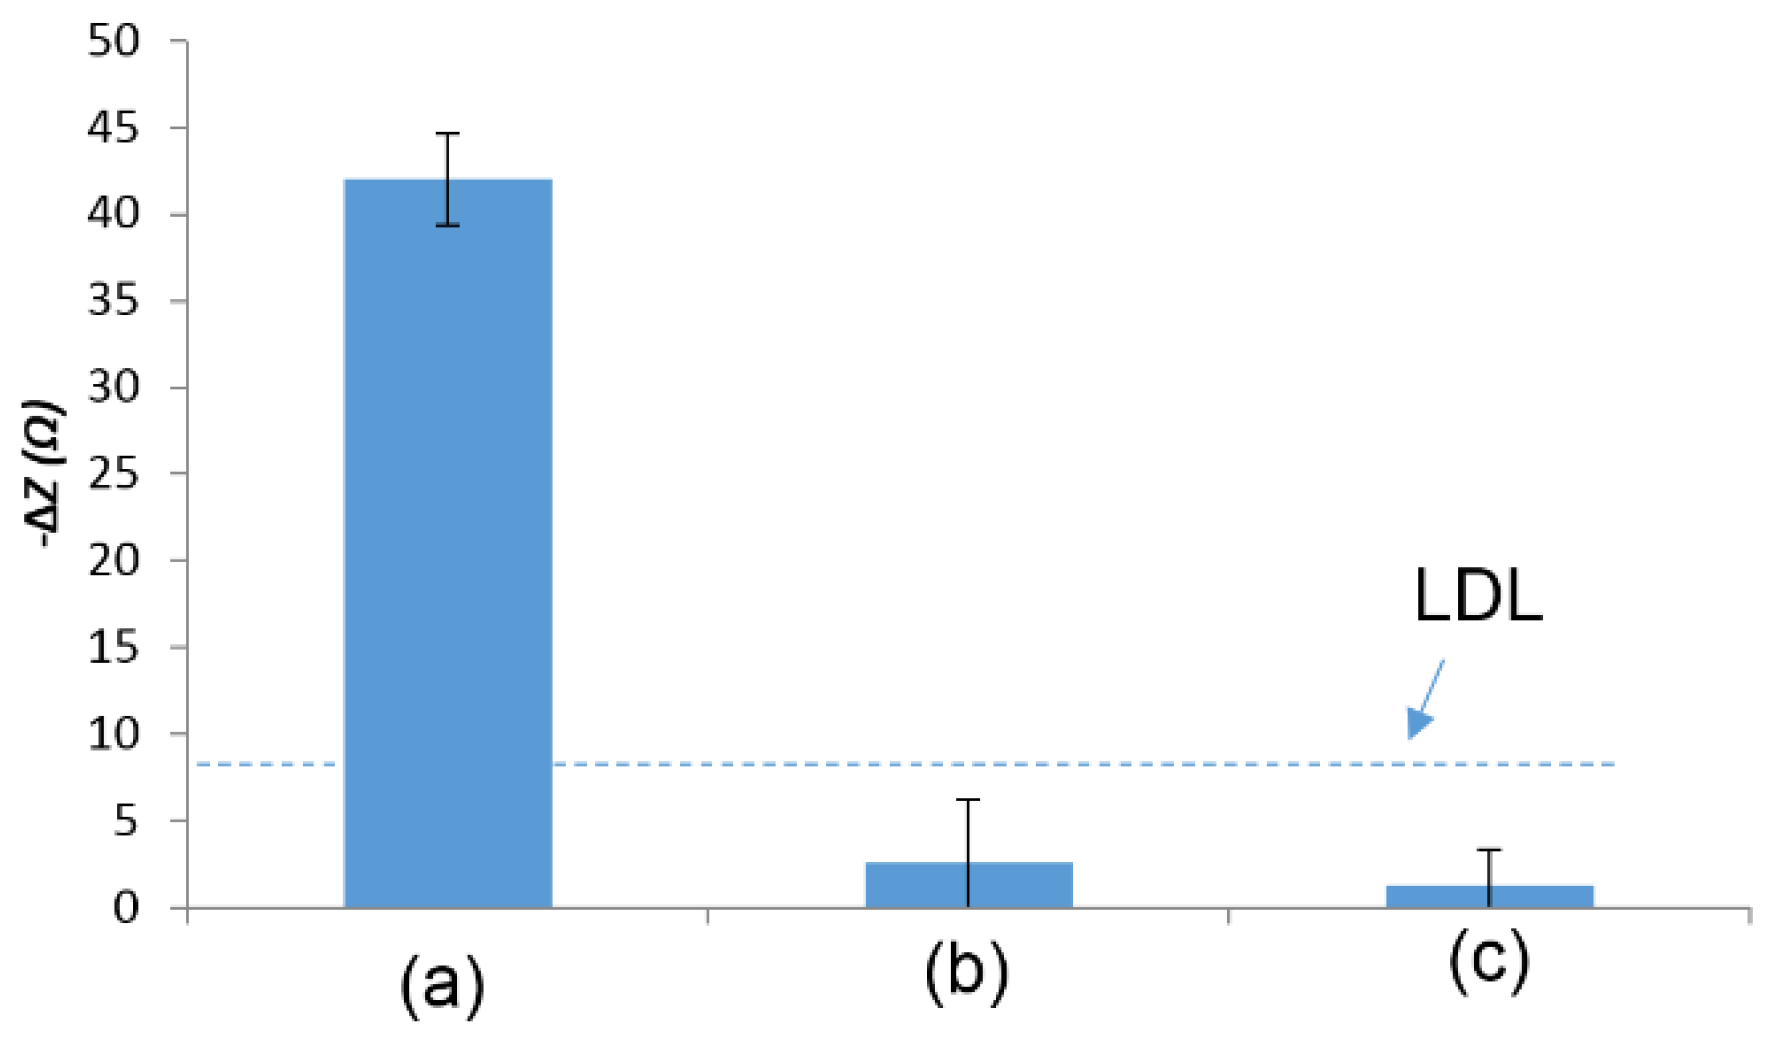
3.2. Detection of E. coli O157:H7

The impedance magnitude at 100 Hz was determined to be the best indicator of bacterial presence. Figure 4a shows the average impedance decrease for each E. coli O157:H7 concentration. Based on the t-tests results, the P-value of impedance change (ΔZ) between 104 and 105 cfu·mL−1, 105 and 106 cfu·mL−1, and 106 and 107 cfu·mL−1 was 0.04, 0.002 and 0.05, respectively, indicating a significant difference. A linear relationship (R2 = 0.94) was found to exist between log value of E. coli concentration (Cbact) in cfu·mL−1 and impedance change (ΔZ) in ohms between control and bacteria samples that corresponded to ΔZ = 13.6Cbact – 50.8. The lower detection limit was calculated to be 104.45 cfu·mL−1. This corresponded to a final bacteria count of ~1400 cells in the applied volume of 25 µL. The reproducibility of the biosensor was shown to be high, with small standard deviations (SD = 2 ± 1) at all bacteria concentrations. The capture of the bacteria by the antibody-coated nanobeads was confirmed by ESEM, shown in the Figure 4c. To improve the specificity of the immunosensor, the combination of monoclonal antibodies against unique epitopes on the O157 and H7 antigens is a logical approach for specific detection of E. coli O157:H7, minimizing interferences from other bacteria including non-O157 and non-H7 serotypes of E. coli.
Figure 4. (a) Average impedance change between the control and bacteria measurements at 100 Hz for E. coli O157:H7. Error bars were based on standard deviation of triplicate tests; (b) ESEM photograph of the antibody-coated nanobeads; and (c) ESEM photograph of an E. coli O157:H7 cell attached with antibody-coated nanobeads.
Biosensors 05 00791 g004
The Z and ΔZ values were in the low Ω range due to the use of 5 mM [Fe(CN)6]3−/4− (1:1 ratio) mixture in PBS as a measurement solution. The use of this high electrolyte solution was needed to provide stability to the biosensor. Previous tests with low electrolyte solutions had very low repeatability. It was hypothesized that the diffusion of ionic species from the interior of the bacteria was affecting these tests and so a high electrolyte solution was used to negate the effect of those ions. This resulted in lower Z and ΔZ values but much higher repeatability.
The sensitivity of the biosensor could be potentially be improved by removing the free beads from the measurement sample. The presence of the free beads introduced noise into the system which may obscure the impedance measurement of E. coli O157:H7 at lower concentrations. Removal of free beads could be accomplished using a magnetophoretic separation device as described by Huang et al. [27]. Another way to improve the sensitivity is to apply further concentrated sample. In this study, a 2-times concentrated sample (from 200 µL sample to be concentrated to 100 µL) was used in all the tests. We conducted a quick test by applying 3-times concentrated sample, which resulted in a 16.7% increase in ΔZ value for E. coli O157:H7 at the concentration of 105 cfu·mL−1, indicating that the magnetic nanobeads based isolation/concentration procedure could improve the sensitivity of the immunosensor. In order to detect E.coli at low concentrations, a more concentrated sample is needed.
While a reduction in the initial amount of nanobeads used in the test would likely reduce the noise of the system, previous unpublished research has shown that a reduction in the amount of nanobeads used in the test would result in a loss of capture efficiency. The data for these tests is included in the supplemental materials (Figure S4).
The magnetic nanobeads were determined to be necessary for detection by both experimental analysis and computer simulation. Escherichia coli cells without magnetic nanobeads were suspended in a redox probe solution and a drop of the sample was placed on a screen-printed electrode and the impedance was measured after 10 min. No detectable signal could be seen for E. coli cells only in a redox probe. Also E. coli samples were prepared as described in Section 2.5 but no magnetic field was applied after placing the samples on the electrode. Again, no detectable signal was seen. This data is included in Figure 5. Without a magnet underneath the electrode, the bacteria/nanobead complexes were loosely suspended in the drop solution without tight attachment onto the electrode surface, which might have negligible effect on the electrode surface. Based on the equivalent circuit shown in Figure 3 used for data analysis, the Rsur element (electrode surface roughness) contributed the majority of the impedance change. When the magnet was applied underneath the electrode, the bacteria/nanobead complexes were tightly attached onto the electrode surface, which could increase the electrode surface roughness, resulting in a change in impedance. A simulation using Comsol Multiphysics (Figure 7) also showed that the impedance change decreases as the distance between the E. coli cells and electrode increases.
To demonstrate the application of the immunosensor for food safety, food sample test was conducted using ground beef, which was inoculated with target bacteria of E. coli O157:H7 at concentrations of 105 and 106 cfu·mL−1. As shown in Figure 6, the change in impedance in ground beef sample that was artificially contaminated with E. coli O157:H7, was compared to the pure culture at the same concentration. The inoculated beef sample showed a detectable impedance response at both concentrations of 105 and 106 cfu·mL−1, which was comparable to the pure culture detection signal. However, larger error bars were observed in detection of ground beef than the pure culture. It was possibly due to the interference of the background of food samples. There is an abundant amount of protein, fat, and other components of meat products presented in ground beef.
Figure 5. Average impedance change (a) between a control sample and nanobeads captured E. coli O157:H7 with a magnet underneath; (b) pure E. coli O157:H7; (c) between a control sample and nanobeads captured E. coli O157:H7 with no magnet underneath. E. coli O157:H7 concentration was 107 cfu·mL−1. Error bars were based on standard deviation of triplicate tests. LDL line was determined by signal/noise ratio of 3, where noise was defined as the standard deviation of the pure redox probe measurements.
Biosensors 05 00791 g005
Figure 6. The comparison of impedance signals between the pure culture of E. coli O157:H7 and the ground beef with E. coli O157:H7 at concentrations of 105 and 106 cfu·mL−1 using the immunosensor.
Biosensors 05 00791 g006

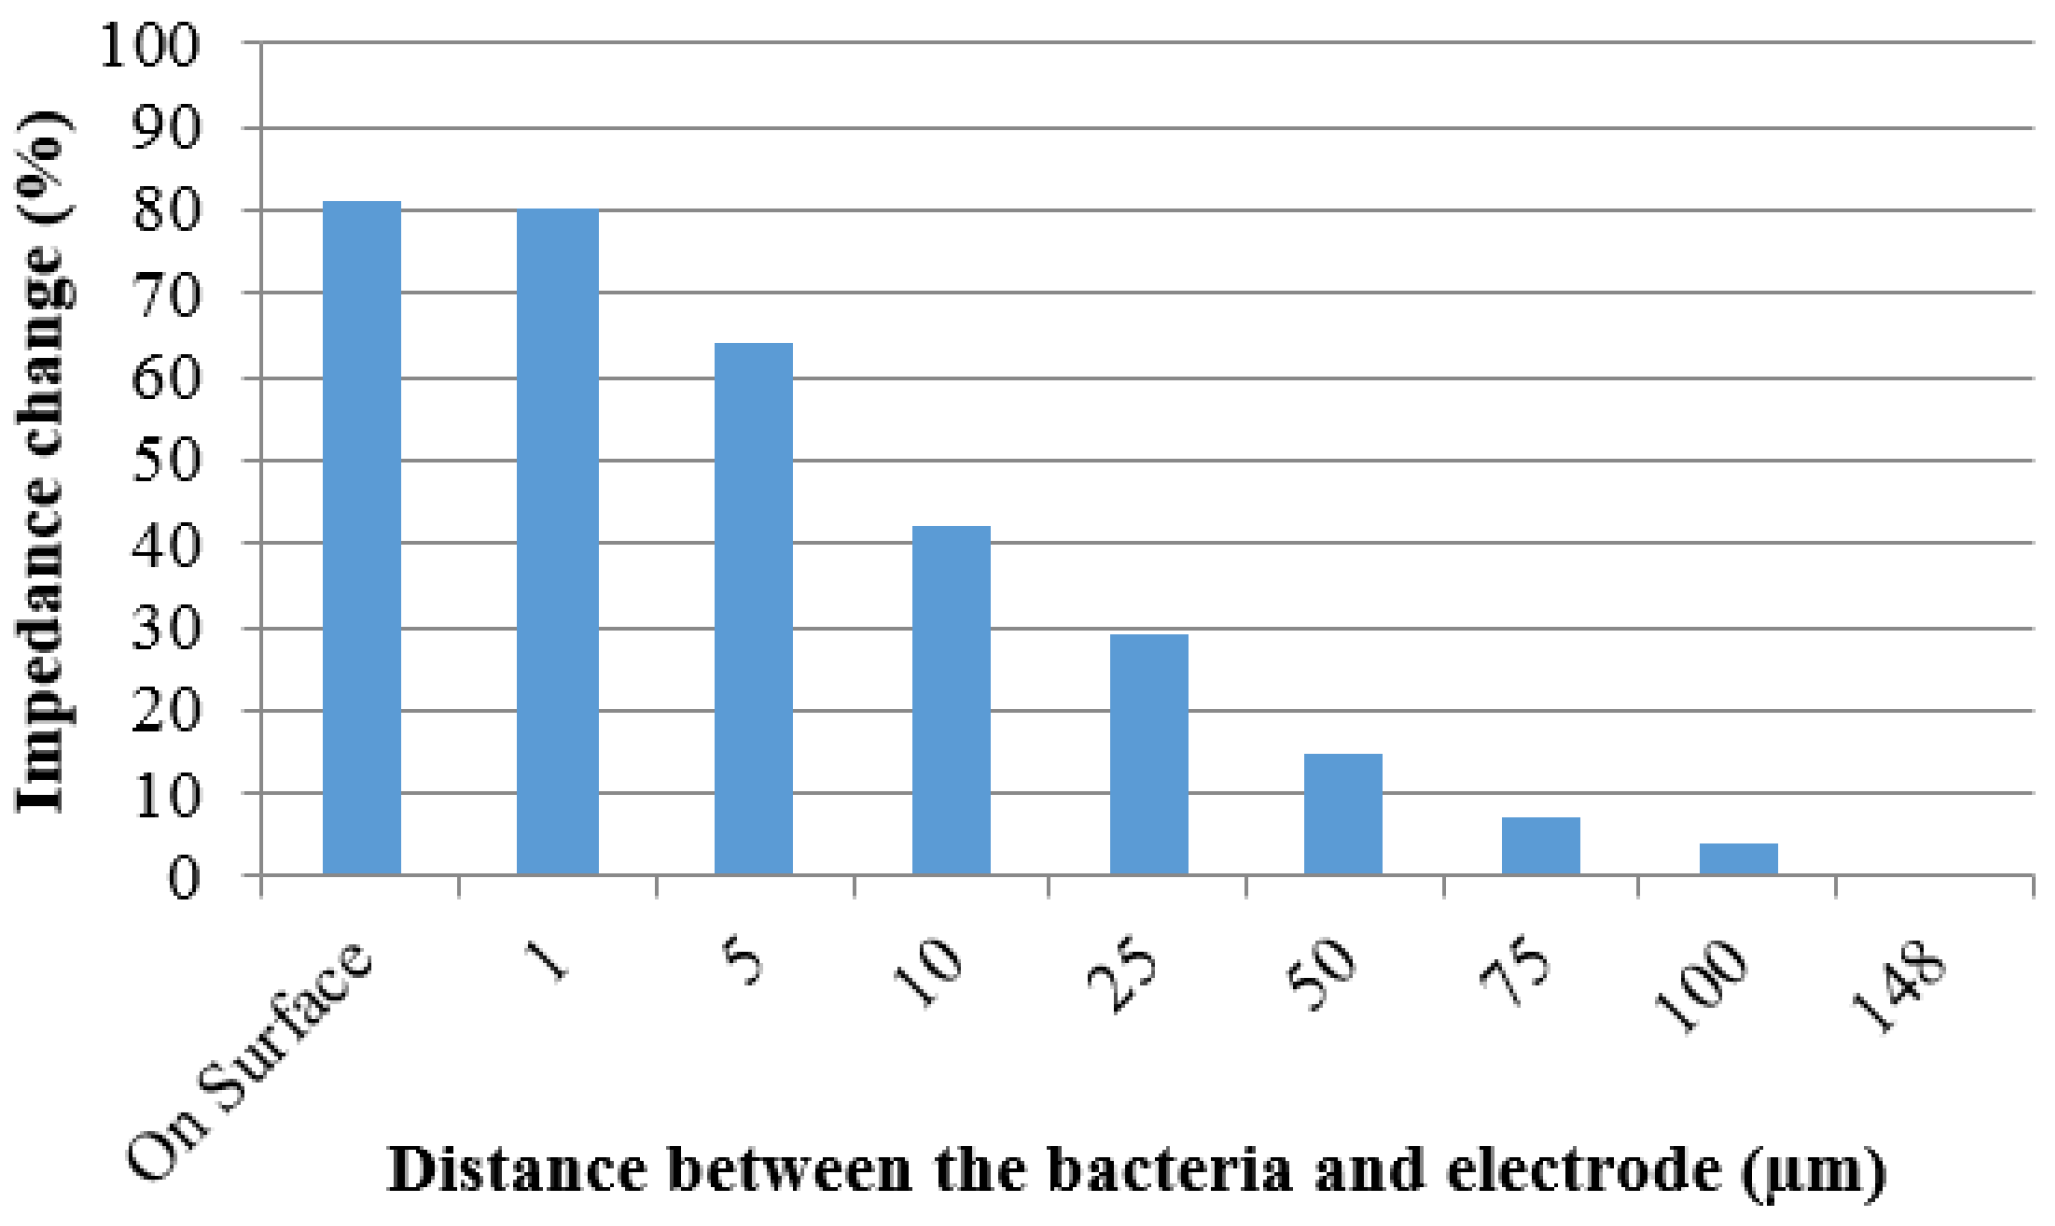
3.3. Simulation of Impedance Change

The simulation using Comsol Multiphysics showed that the impedance change decreases as the distance between the E. coli cells and electrode increases, as shown in Figure 7. When the E. coli cells are within 25 µm of the electrode surface there is a significant impedance change. When the E. coli cells are positioned on the electrode or just 1 µm above it the impedance change is 80%. Moving the E. coli cells out to 5, 10, or 25 µm away from the electrode resulted in the impedance change being decreased to 64%, 42%, and 29%, respectively. At distances greater than 25 µm the impedance change steadily decreases until 150 µm, where the same characteristics as if no cells are present. This may be explained by the cells being outside of the capacitive area, reducing their effect on the impedance value.
Figure 7. Impedance percent change due to simulated E. coli cells at varying distances from the electrode surface.
Biosensors 05 00791 g007

4. Conclusions

In this study an impedance immunosensor was developed for the rapid detection of E. coli O157:H7 using antibody-coated magnetic nanobeads and screen printed interdigitated electrodes. The antibody-coated magnetic nanobeads were shown to serve multiple roles in this impedance biosensor, including the isolation and concentration of the target bacteria from a sample and the placement of bacteria onto the electrode surface. The impedance biosensor was capable of detecting ~1400 cells of E. coli O157:H7 in less than 1 h.

Supplementary Files

Supplementary File 1

Acknowledgments

This research was supported in part by China Ministry of Science and Technology (Project No. 2013BAD19B02) and the Center of Excellence for Poultry Science at the University of Arkansas. The authors thank Aibit LLC for providing the magnetic separator and screen-printed interdigitated electrodes.

Author Contributions

Yanbin Li, Walter Bottje and Ronghui Wang conceived and designed the experiments; Jacob Lum performed the experiments; Ronghui Wang and Jacob Lum analyzed the data; Zach Callaway simulated the magnetic field and impedance using COMSOL Multiphysics software; Yanbin Li and Jianhan Lin designed the screen-printed interdigitated electrode. Ronghui Wang and Jacob Lum wrote the paper. All co-authors reviewed the manuscript with their corrections and suggestions.

Conflicts of Interest

The authors declare no conflict of interest.

References

  1. Schmid-Hempel, P.; Frank, S.A. Pathogenesis, Virulence, and Infective Dose. PLoS Pathog. 2007, 3, 1372–1373. [Google Scholar] [CrossRef] [PubMed]
  2. Scallan, E.; Hoekstra, R.; Angulo, F.; Tauxe, R.; Widdowson, M.; Roy, S.; Jones, J.; Griffin, P. Foodborne Illness Acquired in the United States—Major Pathogens. Emerg. Infect. Dis. 2011, 17, 7–15. [Google Scholar] [CrossRef] [PubMed]
  3. Miller, B.D.; Rigdon, C.E.; Ball, J.; Rounds, J.M.; Klos, R.F.; Brennan, B.M.; Arends, K.D.; Kennelly, P.; Hedberg, C.; Smith, K.E. Use of Traceback Methods to Confirm the Source of a Multistate Escherichia coli O157:H7 Outbreak due to In-Shell Hazelnuts. J. Food Prot. 2012, 75, 320–327. [Google Scholar] [CrossRef] [PubMed]
  4. Rekow, C.L.; Brashears, M.M.; Brooks, J.C.; Loneragan, G.H.; Gragg, S.E.; Miller, M.F. Implementation of Targeted Interventions to Control Escherichia coli O157:H7 in a Commercial Abattoir. Meat Sci. 2011, 87, 361–365. [Google Scholar] [CrossRef] [PubMed]
  5. Shen, Z.; Wang, J.; Qiu, Z.; Jin, M.; Wang, X.; Chen, Z.; Li, J.; Cao, F. QCM Immunosensor Detection of Escherichia coli O157:H7 Based on Beacon Immunomagnetic Nanoparticles and Catalytic Growth of Colloidal Gold. Biosens. Bioelectron. 2011, 26, 3376–3381. [Google Scholar] [CrossRef] [PubMed]
  6. Poitras, C.; Tufenkji, N. A QCM-D-Based Biosensor for E. coli O157: H7 Highlighting the Relevance of the Dissipation Slope as a Transduction Signal. Biosens. Bioelectron. 2009, 24, 2137–2142. [Google Scholar] [CrossRef] [PubMed]
  7. Liu, F.; Li, Y.; Su, X.; Slavik, M.; Ying, Y.; Wang, J. QCM Immunosensor with Nanoparticle Amplification for Detection of Escherichia coli O157: H7. Sens. Instrum. Food Qual. Saf. 2007, 1, 161–168. [Google Scholar] [CrossRef]
  8. Jiang, X.; Wang, R.; Wang, Y.; Su, X.; Ying, Y.; Wang, J.; Li, Y. Evaluation of Different Micro/Nanobeads Used as Amplifiers in QCM Immunosensor for More Sensitive Detection of E. coli O157:H7. Biosens. Bioelectron. 2011, 29, 23–28. [Google Scholar] [CrossRef] [PubMed]
  9. Waswa, J.; Irudayaraj, J.; DebRoy, C. Direct Detection of E. Coli O157:H7 in Selected Food Systems by a Surface Plasmon Resonance Biosensor. LWT Food Sci. Technol. 2007, 40, 187–192. [Google Scholar] [CrossRef]
  10. Wang, Y.; Ye, Z.; Si, C.; Ying, Y. Subtractive Inhibition Assay for the Detection of E. coli O157:H7 Using Surface Plasmon Resonance. Sensors 2011, 11, 2728–2739. [Google Scholar] [CrossRef] [PubMed]
  11. Euma, N.; Yeom, S.; Kwon, D.; Kim, H.; Kang, S. Enhancement of Sensitivity Using Gold Nanorods-Antibody Conjugator for Detection of E. coli O157:H7. Sens. Actuators B Chem. 2010, 143, 784–788. [Google Scholar] [CrossRef]
  12. Subramanian, A.; Irudayaraj, J.; Ryan, T. A Mixed Self-Assembled Monolayer-Based Surface Plasmon Immunosensor for Detection of E. coli O157:H7. Biosens. Bioelectron. 2006, 21, 998–1006. [Google Scholar] [CrossRef] [PubMed]
  13. Varshney, M.; Li, Y. Interdigitated Array Microelectrode Based Impedance Biosensor Coupled with Magnetic Nanoparticle–Antibody Conjugates for Detection of Escherichia coli O157:H7 in Food Samples. Biosens. Bioelectron. 2007, 22, 2408–2414. [Google Scholar] [CrossRef] [PubMed]
  14. Chowdhury, D.; De, A.; Chaudhuri, C.R.; Bandyopadhyay, K.; Sen, P. Label Free Polyaniline Based Impedimetric Biosensor for Detection of E. coli O157: H7 Bacteria. Sens. Actuators B Chem. 2012, 171–172, 916–923. [Google Scholar] [CrossRef]
  15. Chan, K.Y.; Ye, W.W.; Zhang, Y.; Xiao, L.D.; Leung, P.H.M.; Li, Y.; Yang, M. Ultrasensitive Detection of E. coli O157: H7 with Biofunctional Magnetic Bead Concentration via Nanoporous Membrane Based Electrochemical Immunosensor. Biosens. Bioelectron. 2013, 41, 532–537. [Google Scholar] [CrossRef] [PubMed]
  16. Radke, S.M.; Alocilja, E.C. A High Density Microelectrode Array Biosensor for Detection of E. coli O 157:H7. Biosens. Bioelectron. 2005, 20, 1662–1667. [Google Scholar] [CrossRef] [PubMed]
  17. Varshney, M.; Li, Y.; Srinivasan, B.; Tung, S. A Label-Free, Microfluidics and Interdigitated Array Microelectrode-based Impedance Biosensor in Combination with Nanoparticles Immunoseparation for Detection of Escherichia coli O157:H7 in Food Samples. Sens. Actuators B Chem. 2007, 128, 99–107. [Google Scholar] [CrossRef]
  18. Varshney, M.; Li, Y. Double Interdigitated Array Microelectrode-Based Impedance Biosensor for Detection of Viable Escherichia coli O157: H7 in Growth Medium. Talanta 2008, 74, 518–525. [Google Scholar] [CrossRef] [PubMed]
  19. Lin, Y.; Chen, S.; Chuang, Y.; Lu, Y.; Shen, T.Y.; Chang, C.A.; Lin, C. Disposable Amperometric Immunosensing Strips Fabricated by Au Nanoparticles-Modified Screen-Printed Carbon Electrodes for the Detection of Foodborne Pathogen Escherichia coli O157:H7. Biosens. Bioelectron. 2008, 23, 1832–1837. [Google Scholar] [CrossRef] [PubMed]
  20. Setterington, E.B.; Alocilja, E.C. Rapid Electrochemical Detection of Polyaniline-labeled Escherichia coli O157: H7. Biosens. Bioelectron. 2011, 26, 2208–2214. [Google Scholar] [CrossRef] [PubMed]
  21. Barreiros dos Santos, M.; Agusil, J.P.; Prieto-Simón, B.; Sporer, C.; Teixeira, V.; Samitier, J. Highly Sensitive Detection of Pathogen Escherichia coli O157:H7 by Electrochemical Impedance Spectroscopy. Biosens. Bioelectron. 2013, 45, 174–180. [Google Scholar] [CrossRef] [PubMed]
  22. Gehring, G.; Albin, D.M.; Bhunia, A.K.; Reed, S.A.; Tu, S.I.; Uknalis, J. Antibody Microarray Detection of Escherichia coli O157: H7: Quantification, Assay Limitations, and Capture Efficiency. Anal. Chem. 2006, 78, 6601–6607. [Google Scholar] [CrossRef] [PubMed]
  23. Fu, Y.; Callaway, Z.; Lum, J.; Wang, R.; Lin, J.; Li, Y. Exploiting Enzyme Catalysis in Ultra-Low Ion Strength Media for Impedance Biosensing of Avian Influenza Virus Using a Bare Interdigitated Electrode. Anal. Chem. 2014, 86, 1965–1971. [Google Scholar] [CrossRef] [PubMed]
  24. Asami, K.; Hanai, T.; Koizumi, N. Dielectric Analysis of Escherichia coli Suspensions in the Light of the Theory of Interfacial Polarization. Biophys. J. 1980, 31, 215–228. [Google Scholar] [CrossRef]
  25. Gielen, F.; Pereira, F.; Demello, A.; Edel, J. High-Resolution Local Imaging of Temperature in Dielectrophoretic Platforms. Anal. Chem. 2010, 82, 7509–7514. [Google Scholar] [CrossRef] [PubMed]
  26. Santos-Sacchi, J. Determination of Cell Capacitance Using the Exact Empirical Solution of dY/dCm and Its Phase Angle. Biophys. J. 2004, 87, 714–727. [Google Scholar] [CrossRef] [PubMed]
  27. Huang, H.; Ruan, C.; Lin, J.; Li, M.; Cooney, L.; Oliver, W.; Li, Y.; Wang, A. Magnetic Nanoparticle Based Magnetophoresis for Efficient Separation of E. coli O157:H7. Trans. ASABE, 2011, 54, 1015–1024. [Google Scholar] [CrossRef]

