3.1. Measurements of the Carbon Isotope Composition of the Larch Tree Ring CO2
By now the carbon isotope composition of 85 samples of different conifer disc tree rings has been investigated. The results obtained show that the samples are enriched in light isotope
12C up to δ
13 С = −25.3‰ for spruce, varying between −25‰ (1894) and −36.4‰ (1986) for the Siberian stone pine (Tomsk Oblast, Russia) and between −26.1‰ (1886) and −27.7‰ (1995) for the spruce disc tree rings from the Altai Mountains, Russia. The tree ring carbon isotope composition of CO
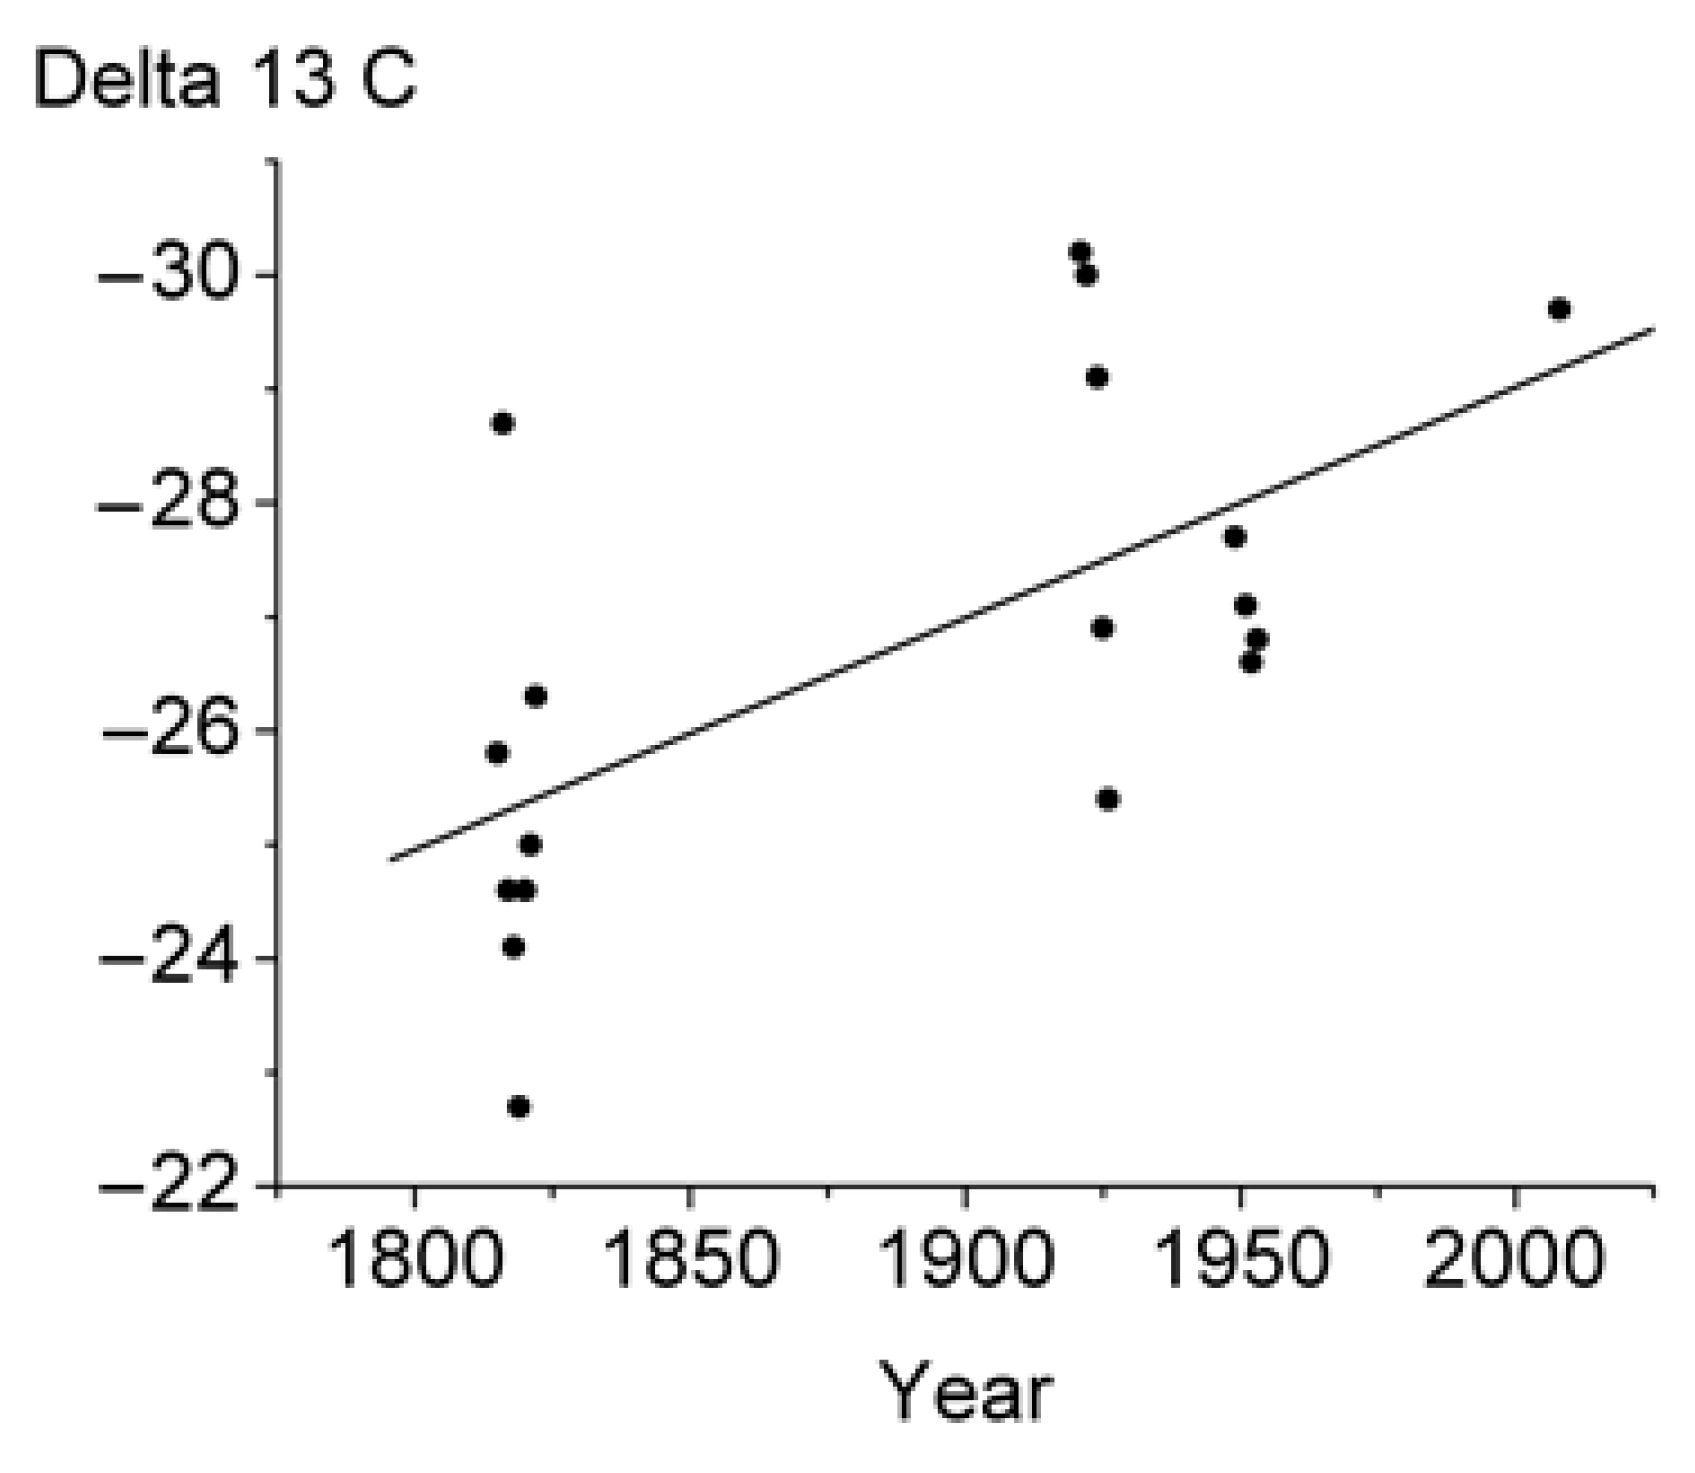
2 chemically extracted from the tree ring wood of the 300 year old larch is shown in
Figure 2. The samples are enriched in light isotope
12C from δ
13 С ≈ −25 ‰ to δ
13 С ≈ −30‰. The measurements were made on the rings of 1815–1822, 1922–1926, 1949–1954, and of 2007 + 2008 (the sum of two very narrow tree rings). It is obvious that CO
2 is formed by trees themselves due to metabolic processes at work in the trees rather than being of atmospheric origin.
Figure 2.
Measured annual variations in the carbon isotope composition of the vacuum-desorbed CO2 (Delta 13C) from the tree ring gas samples of the 300 year old larch. A fractionation effect is seen to affect the annual distribution of the vacuum-desorbed СО2.
Figure 2.
Measured annual variations in the carbon isotope composition of the vacuum-desorbed CO2 (Delta 13C) from the tree ring gas samples of the 300 year old larch. A fractionation effect is seen to affect the annual distribution of the vacuum-desorbed СО2.
We thought it would of interest to compare the results obtained for the isotope composition in the cell-respired CO
2 with variations in the cellulose carbon isotope composition [
11] and with those for the atmospheric air CO
2 [
12],
Figure 3 and
Figure 4. Although the comparison was performed at different scales and for different objects, the results show the same tendency towards annual enrichment in light
12C isotope both of atmospheric air and of the carbon isotope composition of cellulose and desorbed CO
2. We wanted to use the illustrations to emphasize the very fact that the same tendency relating to variations in Delta13C was retained in totally different objects.
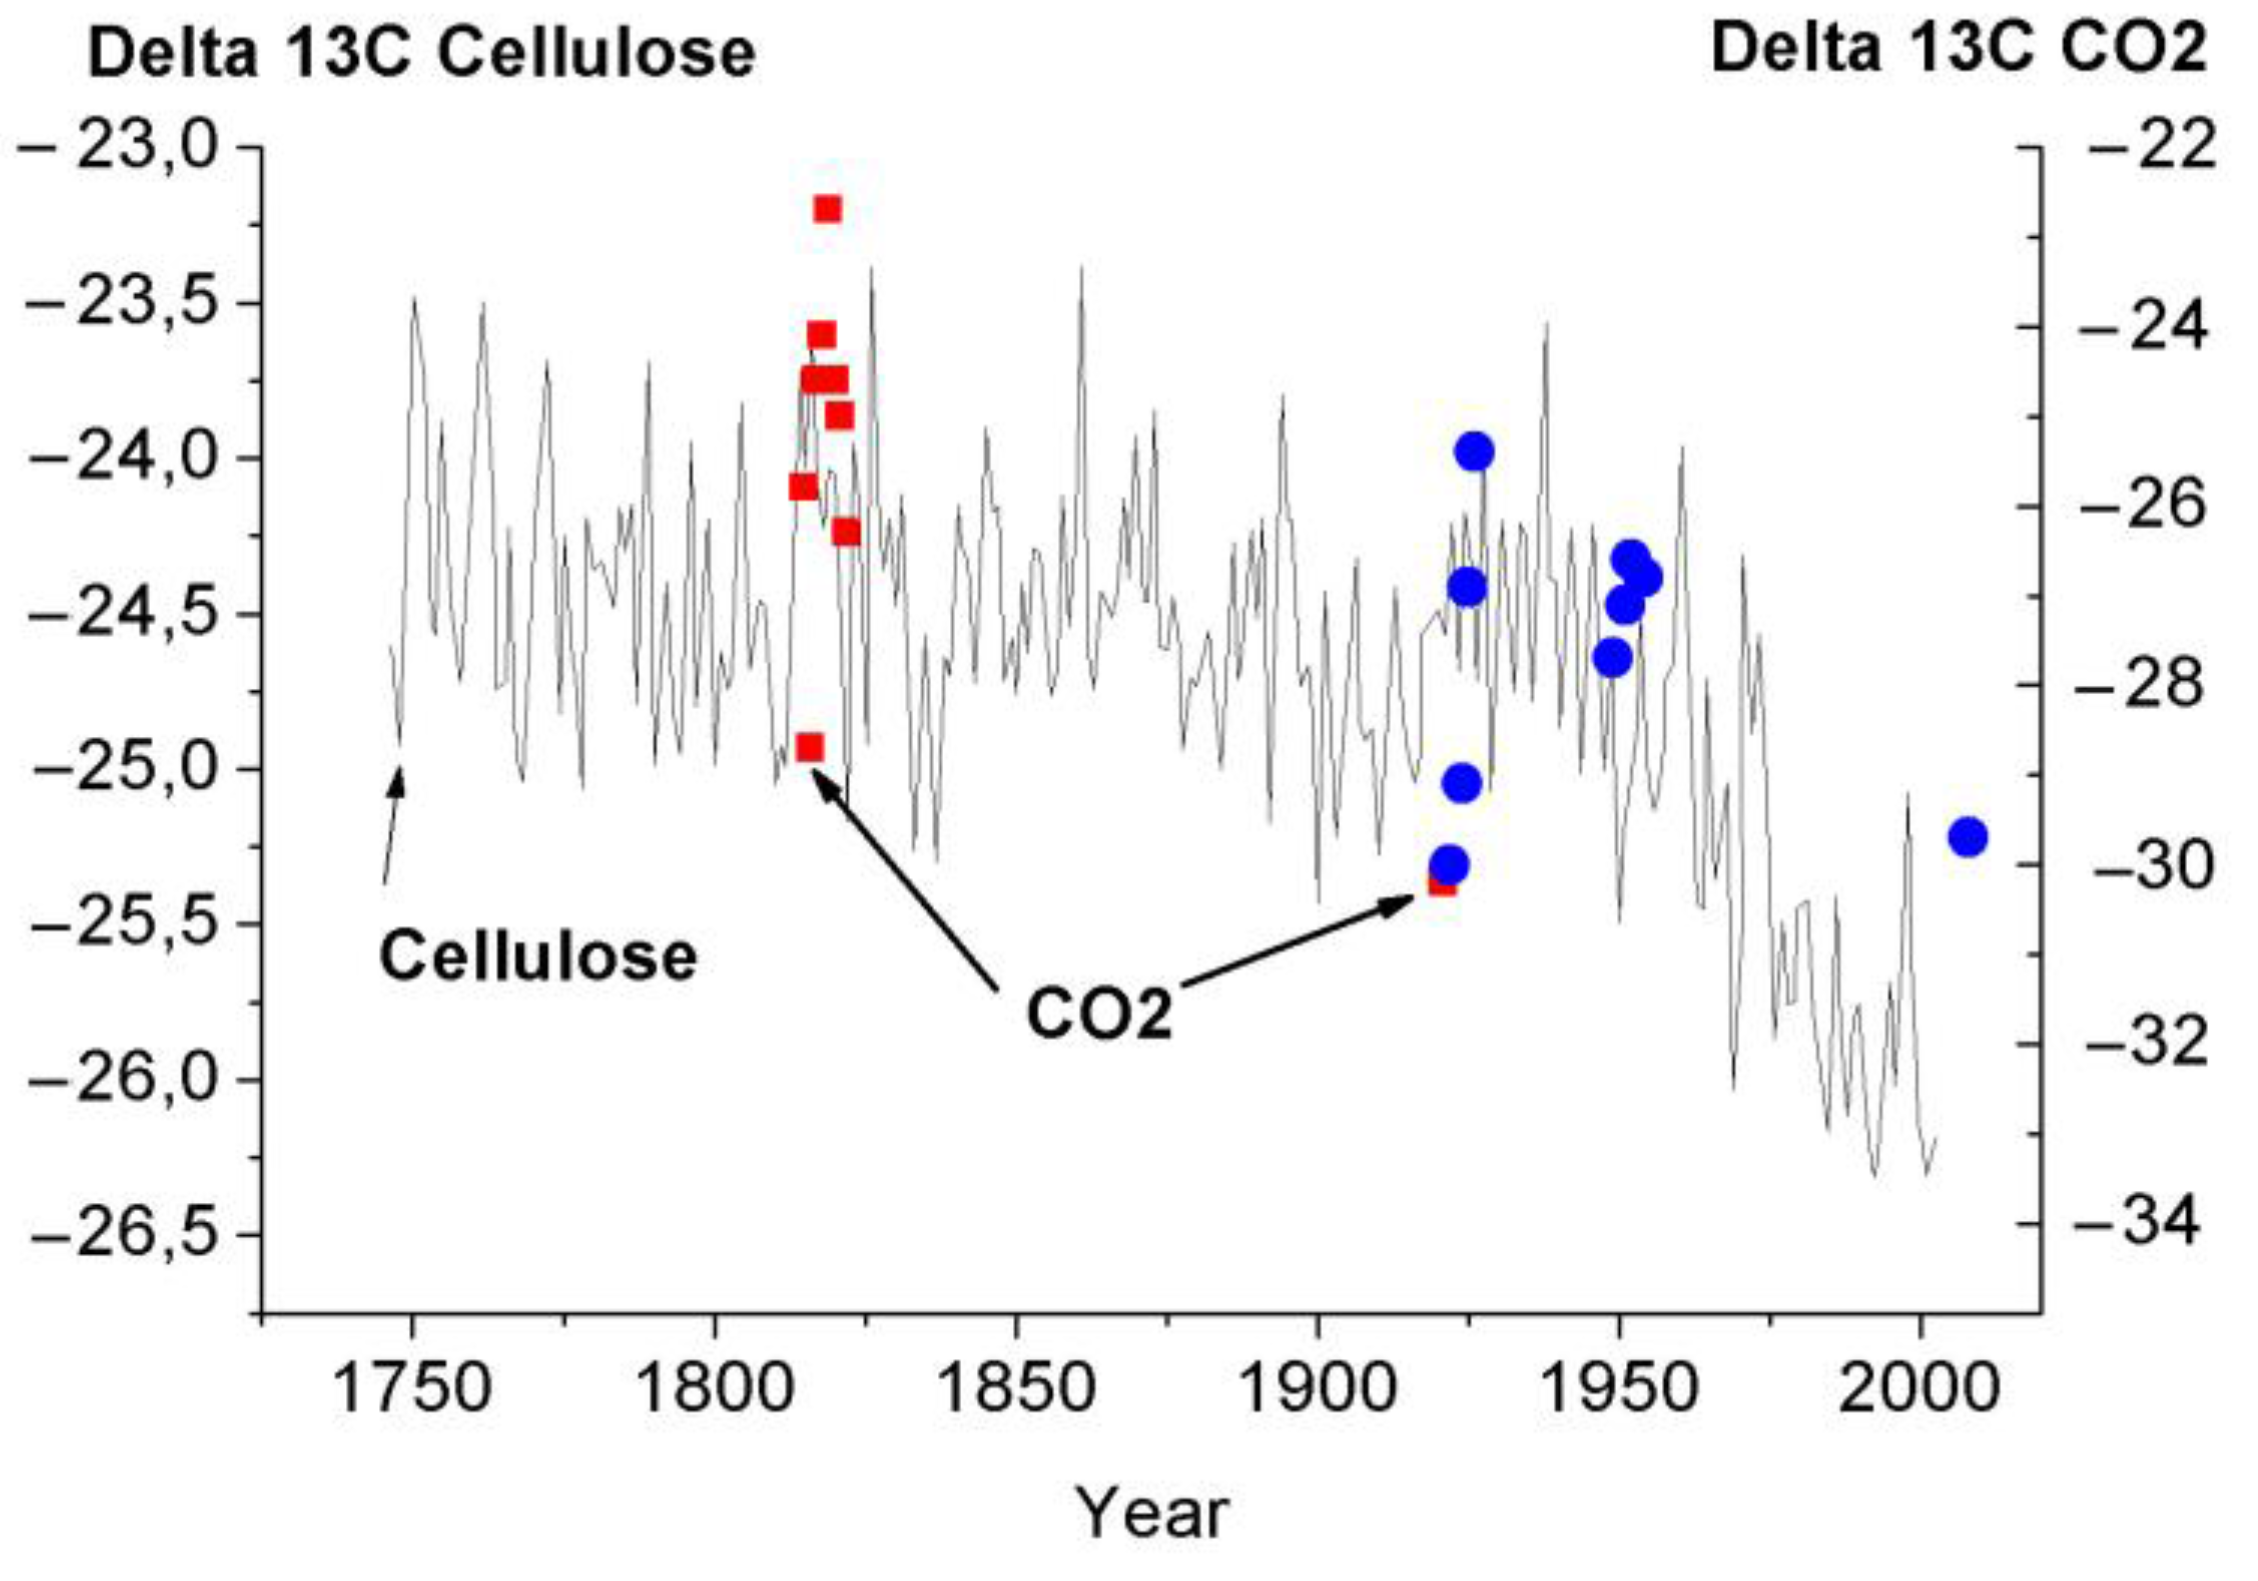
Figure 3.
Comparison of variations in the carbon isotope composition of CO
2 desorbed from the tree ring wood of the 300 year old larch with variation in Delta 13C of cellulose (
Figure 4 from [
11].
Figure 4 [
11] was digitized before use).
Figure 3.
Comparison of variations in the carbon isotope composition of CO
2 desorbed from the tree ring wood of the 300 year old larch with variation in Delta 13C of cellulose (
Figure 4 from [
11].
Figure 4 [
11] was digitized before use).
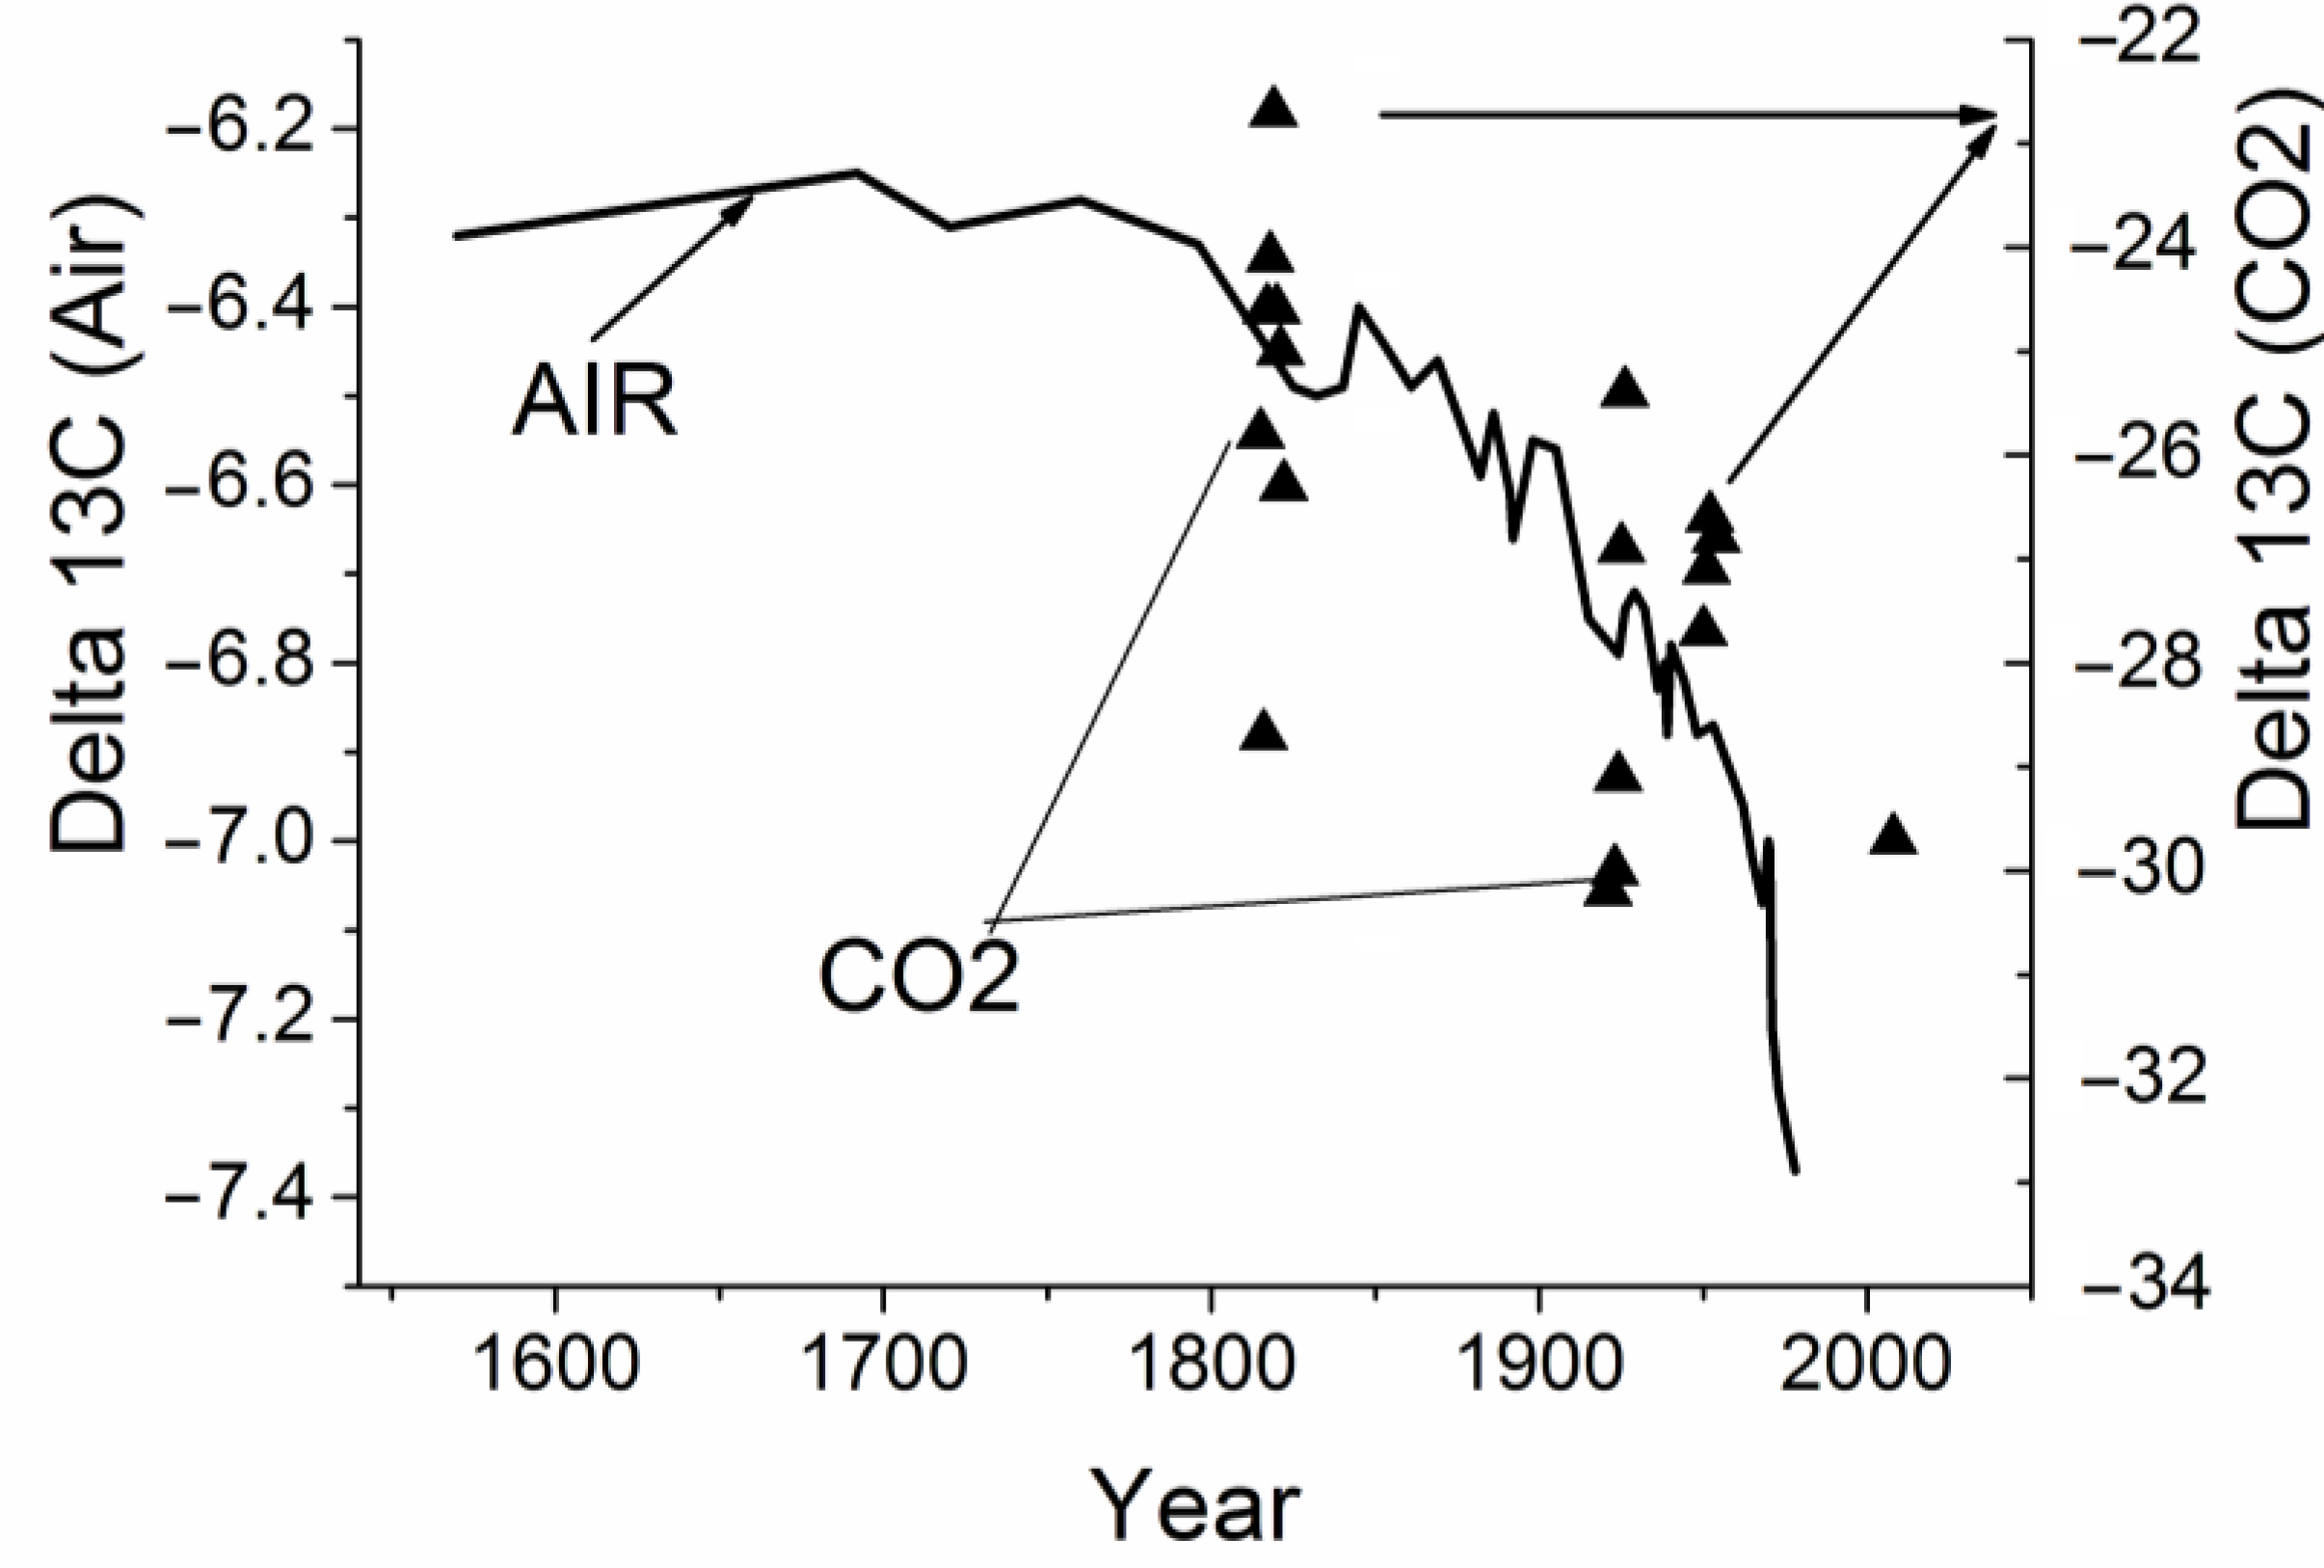
Figure 4.
Comparison of variations in the carbon isotope composition of CO
2 desorbed from the tree ring wood of the 300 year old larch with variations in the Delta 13C ratio in air extracted from Antarctic ice core and firn samples [
12].
Figure 4.
Comparison of variations in the carbon isotope composition of CO
2 desorbed from the tree ring wood of the 300 year old larch with variations in the Delta 13C ratio in air extracted from Antarctic ice core and firn samples [
12].
There is no way to perform measurements of the CO
2 and carbon isotope composition at the same points of the disc tree rings because of high wood material consumption. We used the neighboring tree ring sections for an analysis of these parameters. Our numerous measurements of the carbon isotope composition of the vacuum-desorbed CO
2 have shown that an increase in the CO
2 concentration in a gas sample brings about changes in the carbon isotope composition: the higher is the CO
2 concentration in the sample, the lighter is the isotope composition, and vice versa. As the CO
2 and carbon isotope composition has to be measured at different points in the tree rings, on frequent occasions, the shape of the curves is different. Variations in the annual carbon isotope composition of CO
2 and in the vacuum-desorbed CO
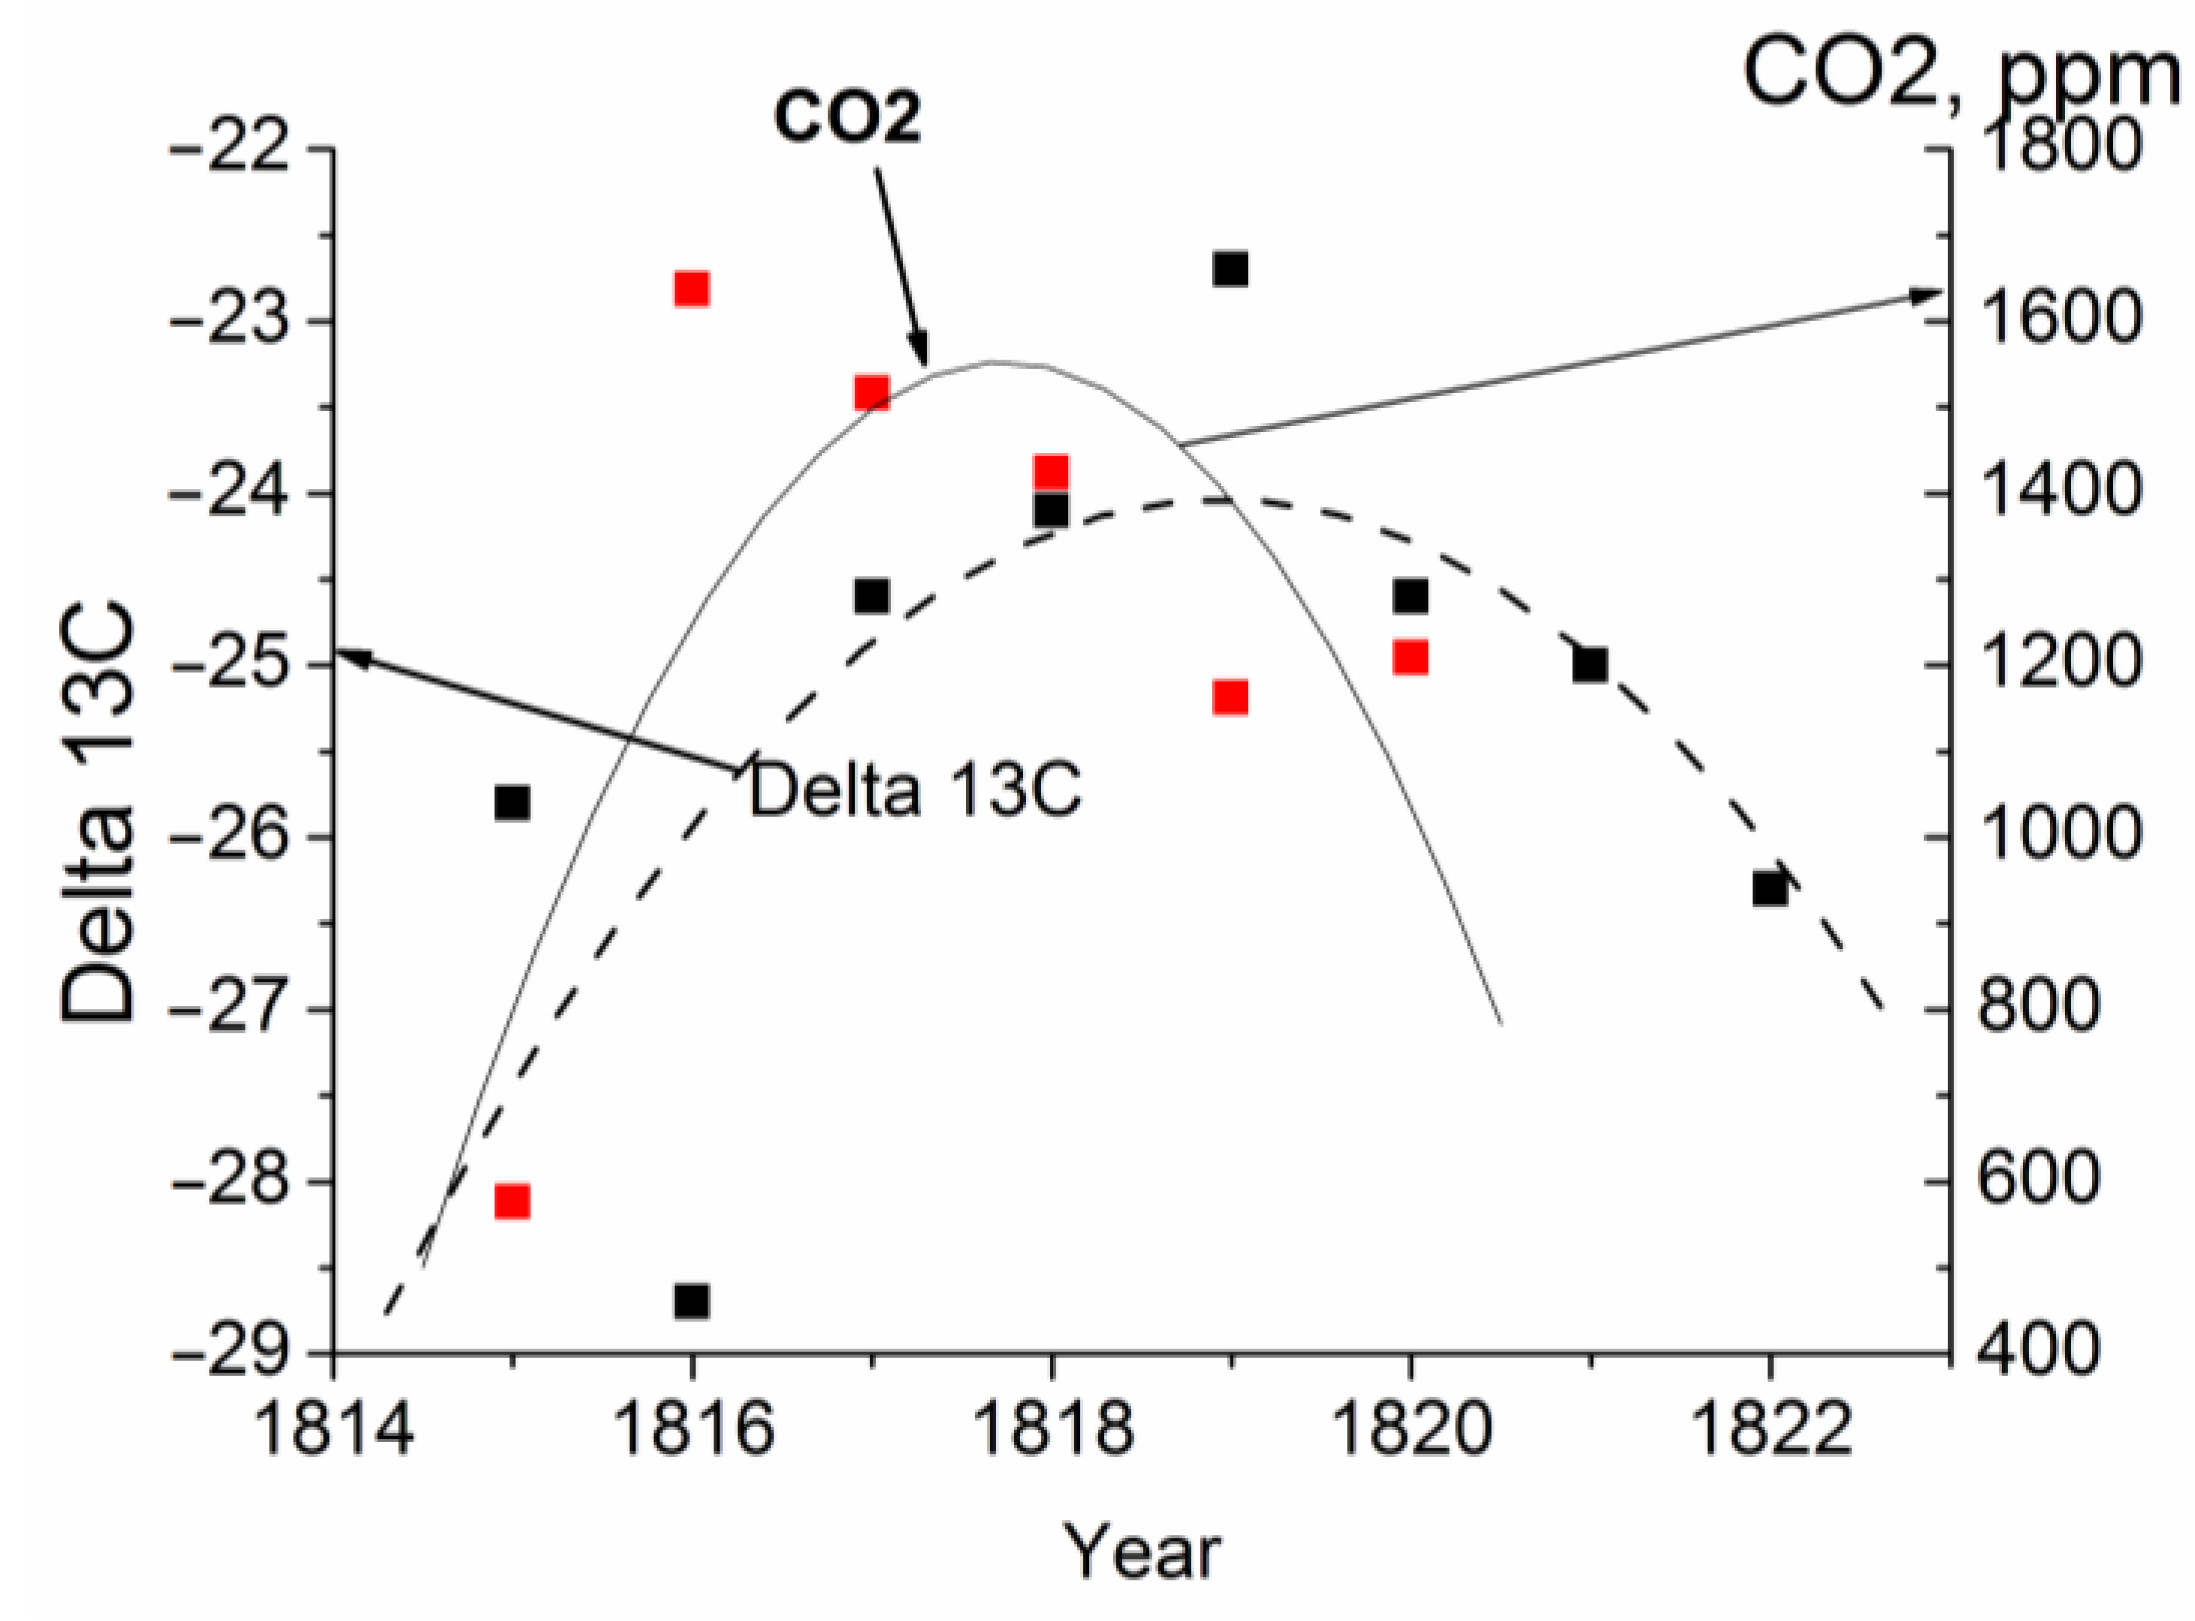
2 in the larch tree rings are illustrated in
Figure 5.
Figure 5.
Comparison of annual distributions of the concentration of CO2 vacuum-desorbed from the tree ring wood (ppm) and carbon isotope composition of CO2 (Delta 13C) in the 300 year old larch disc for 1815–1822. The concentration of CO2 vacuum-desorbed from the tree ring wood in 1815–1822 is in excess of the CO2 concentration in air observed in recent years (~400 ppm).
3.2. CO2 and H2O Variations in the Larch Disc Tree Rings
It is generally believed that CO
2 released by respiring cells in tree stems completely diffuses to the atmosphere in the course of time. However, our numerous tests of the vacuum-desorbed gas samples taken from the tree ring wood show that part of CO
2 conserved in stems is typically dissolved in water. At the same time, H
2O and CO
2 are shown to be irregularly distributed in the disc tree rings. Our earlier results obtained from a laser photoacoustic gas analysis of the tree ring vacuum-desorbed CO
2 and H
2O from evergreen conifer trees were presented in [
7,
8]. All conifer discs were shown to exhibit peculiar annual CO
2 and H
2O tree ring distributions with distinct 4-year cyclicity. Since larches are deciduous conifer trees, there was a need to examine the peculiar behavior of the CO
2 and H
2O chronologies in the larch tree rings, especially for the trees cut in different regions. The results of investigations into the vacuum-desorbed CO
2 (and H
2O) from the tree ring wood of the 300 year old larch (Siberia) are presented in
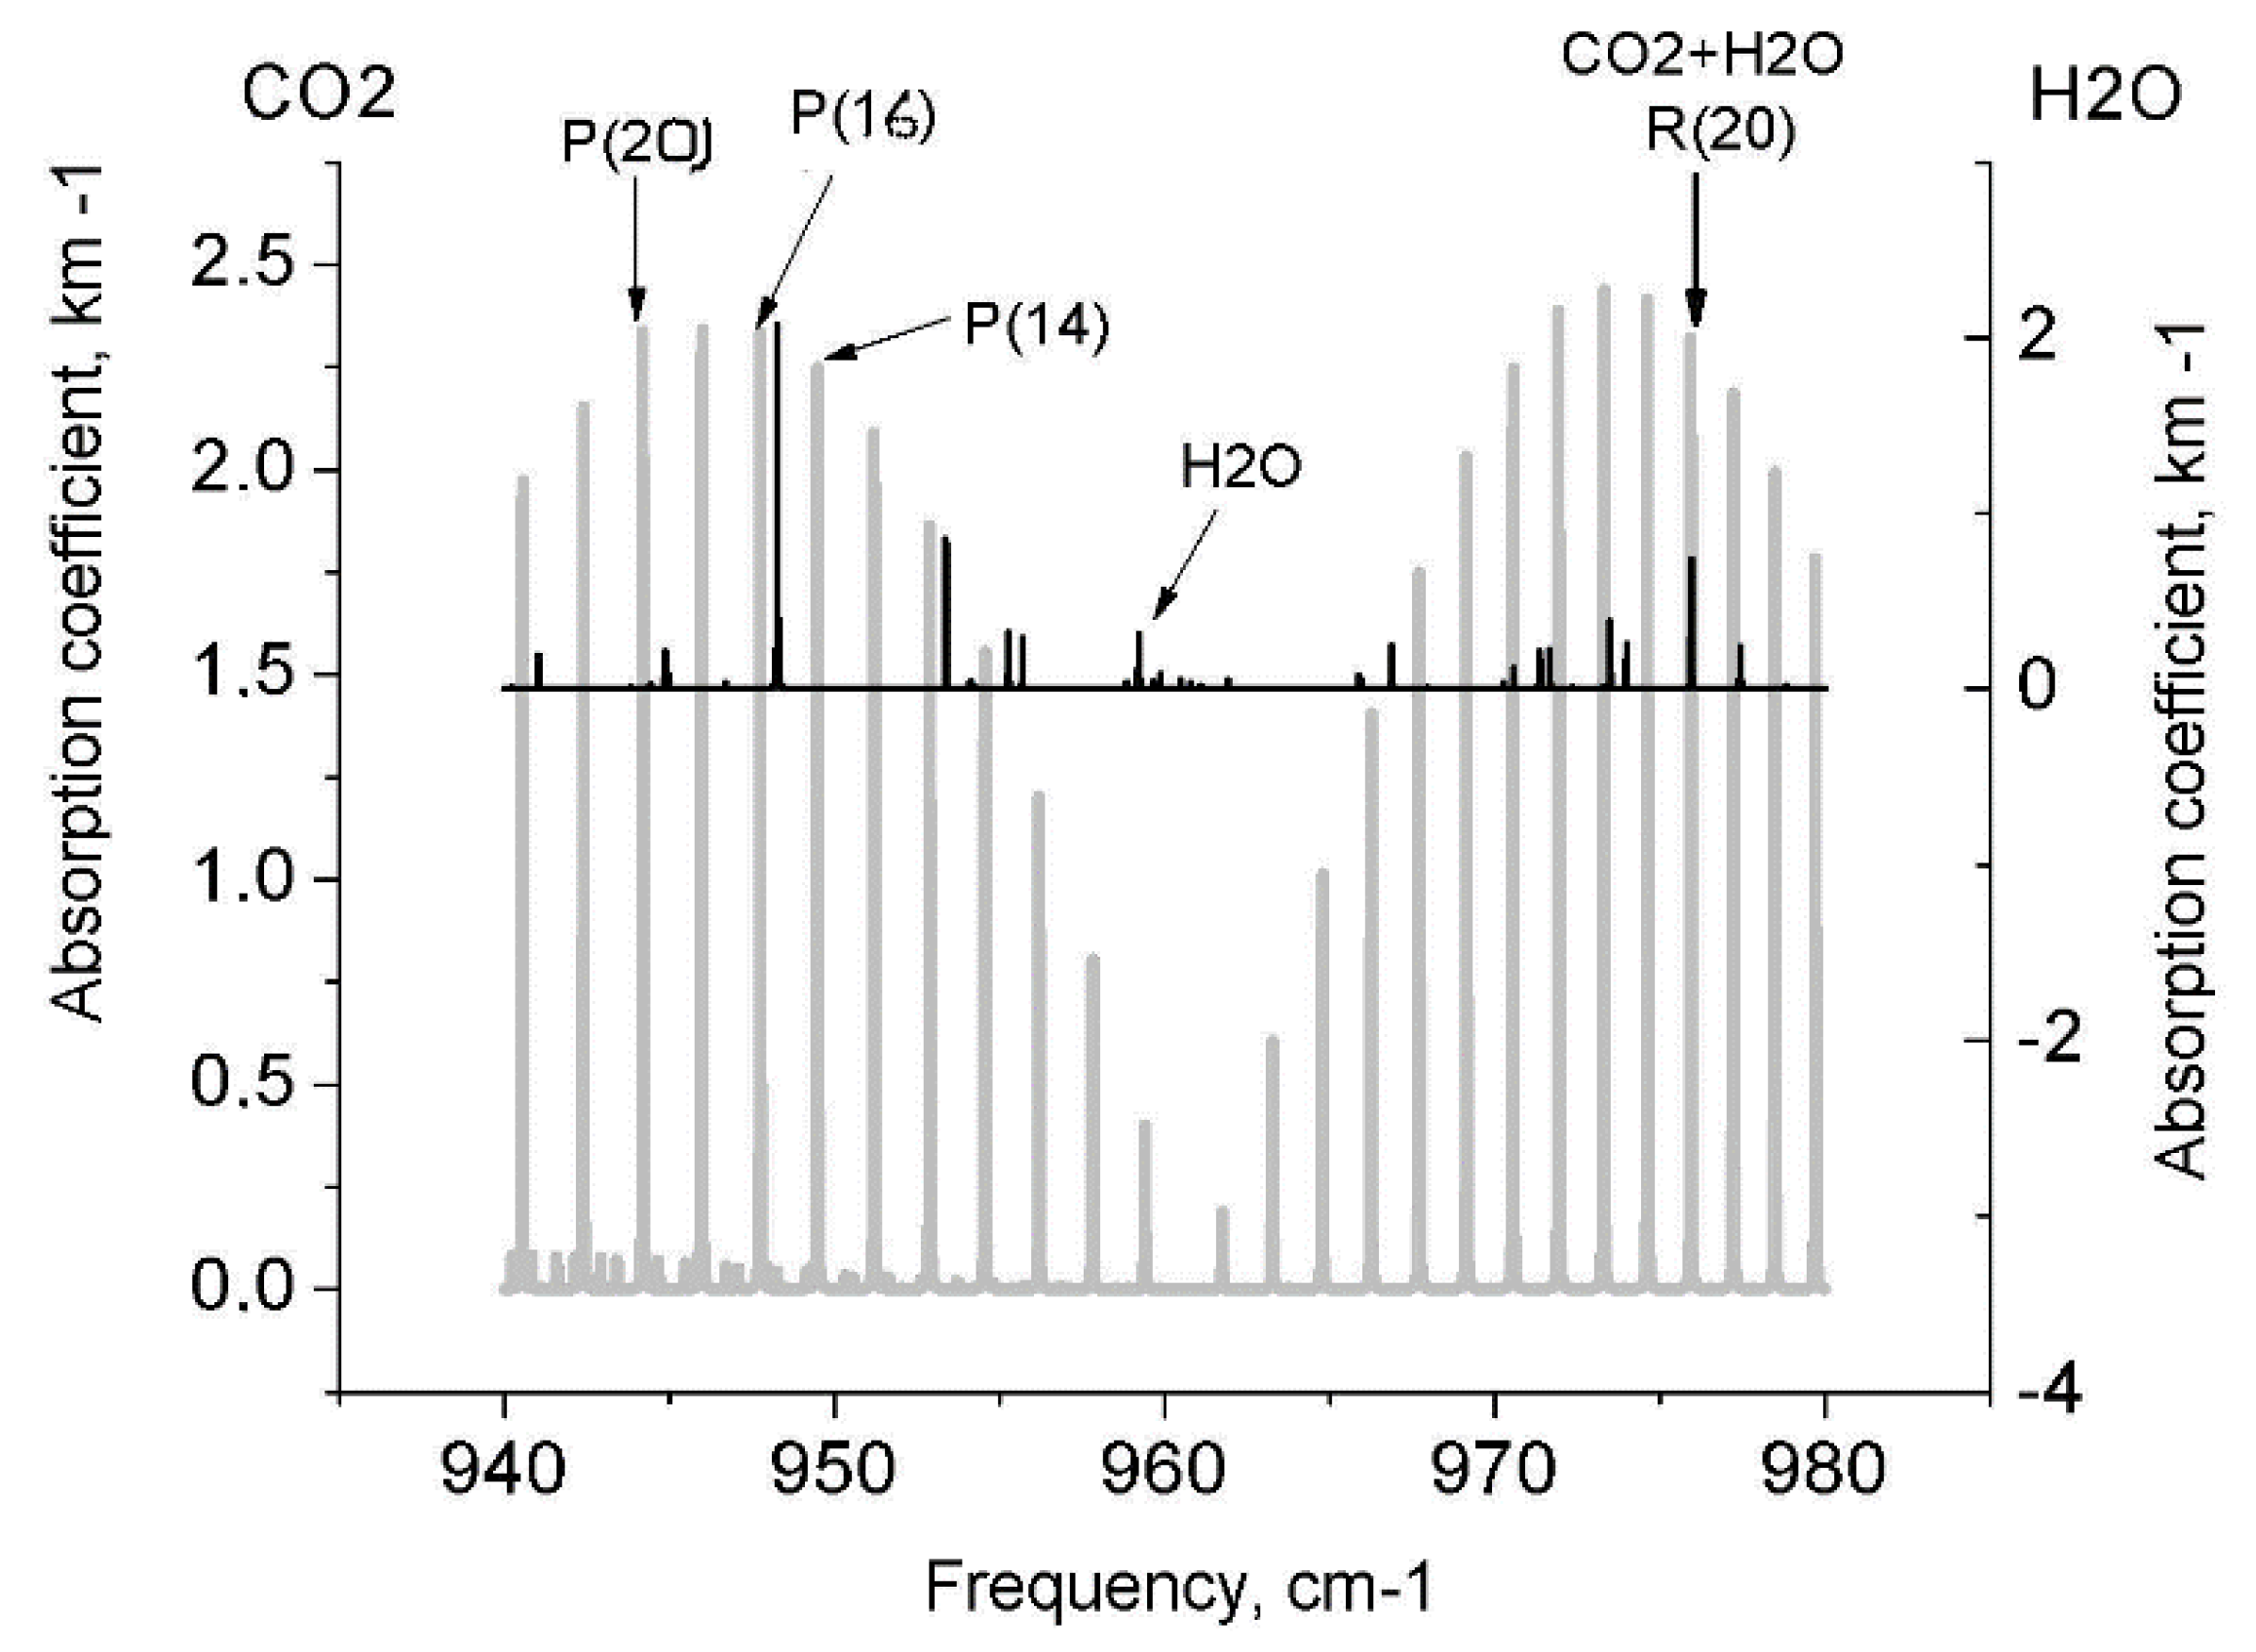
Figure 6. We could fix the absorption as the sum of two components (CO
2 + H
2O) in the
R (20) CO
2 laser line, because their absorption lines coincide (
Figure 1). To obtain the H
2O absorption alone, we subtracted the CO
2 signals from the
R (20) signals. As the result, two trends were observed, which enabled us to examine and compare the annual CO
2 and H
2O distributions in the disc tree rings of the 300 year old larch. The results were smoothed out by the 11-year running average. It follows from
Figure 5 and
Figure 6 that the data obtained by the method proposed here show that considerable portions of CO
2 and H
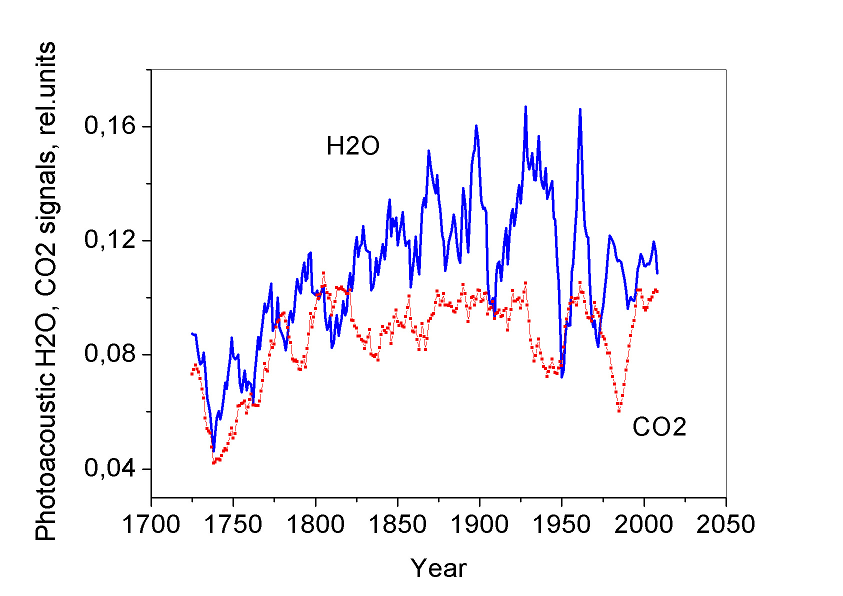
2O are stored in the tree stem rings and exhibit specific annual distributions. It is apparent from the figures that the CO
2 and H
2O distributions in the tree rings demonstrate characteristic features: (1) ~25-year H
2O cycles; (2) ~25-year CO
2 cycles up to ~1830; and (3) variations in the CO
2 distribution since 1830, which may be evidence for an impact of industrial operations as atmospheric pollution sources on stem respiration.
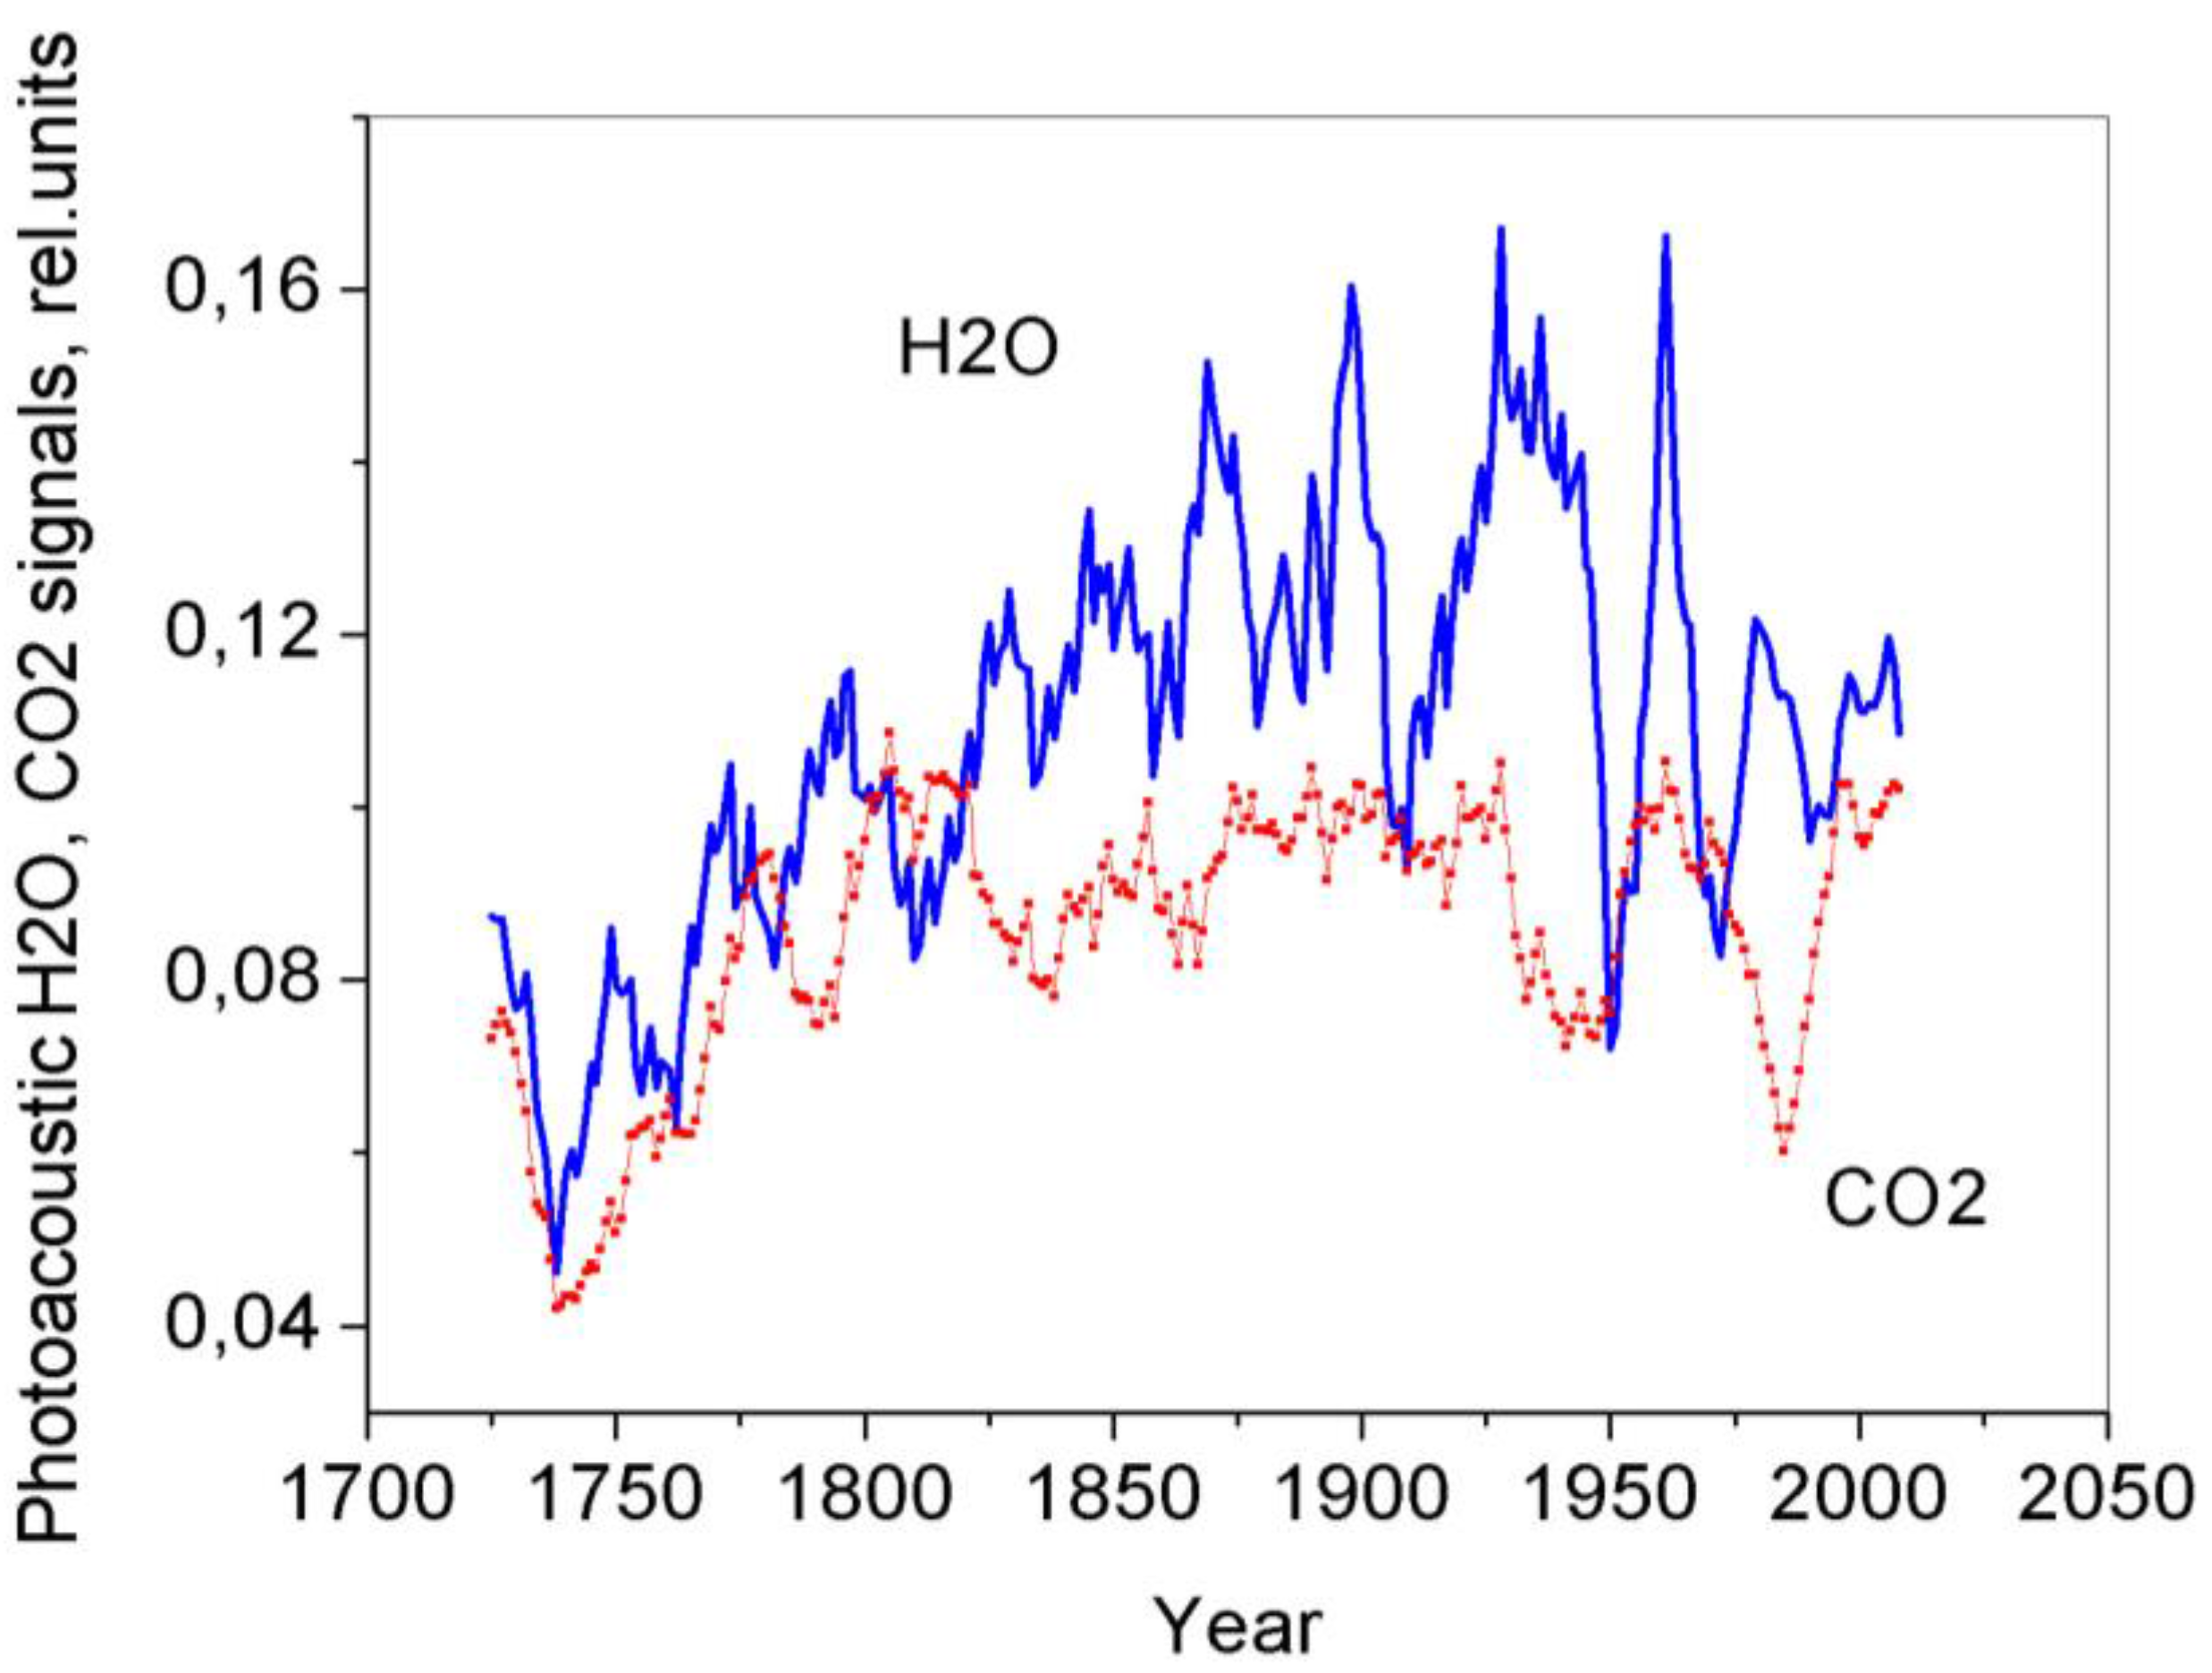
Figure 6.
Comparison of photoacoustic signals from CO2 and H2O vacuum-desorbed from the tree rings of the 300 year old larch in the CO2 laser lines P (20) (CO2) and R (20) (H2O). The results were smoothed out by a 11-year running average.
Figure 6.
Comparison of photoacoustic signals from CO2 and H2O vacuum-desorbed from the tree rings of the 300 year old larch in the CO2 laser lines P (20) (CO2) and R (20) (H2O). The results were smoothed out by a 11-year running average.
We have analyzed the measurement results for CO
2 vacuum-desorbed from the tree rings since 1830 to find out whether the measurements showed the existence of cyclic CO
2 variations. The results of Fourier analysis of the tree ring CO
2 variations (1840–1935) with the use of the ORIGIN software are shown in
Figure 7. Similar to the results obtained from investigations into the tree ring CO
2 distribution in the Siberian stone pine [
7,
8], the tree ring CO
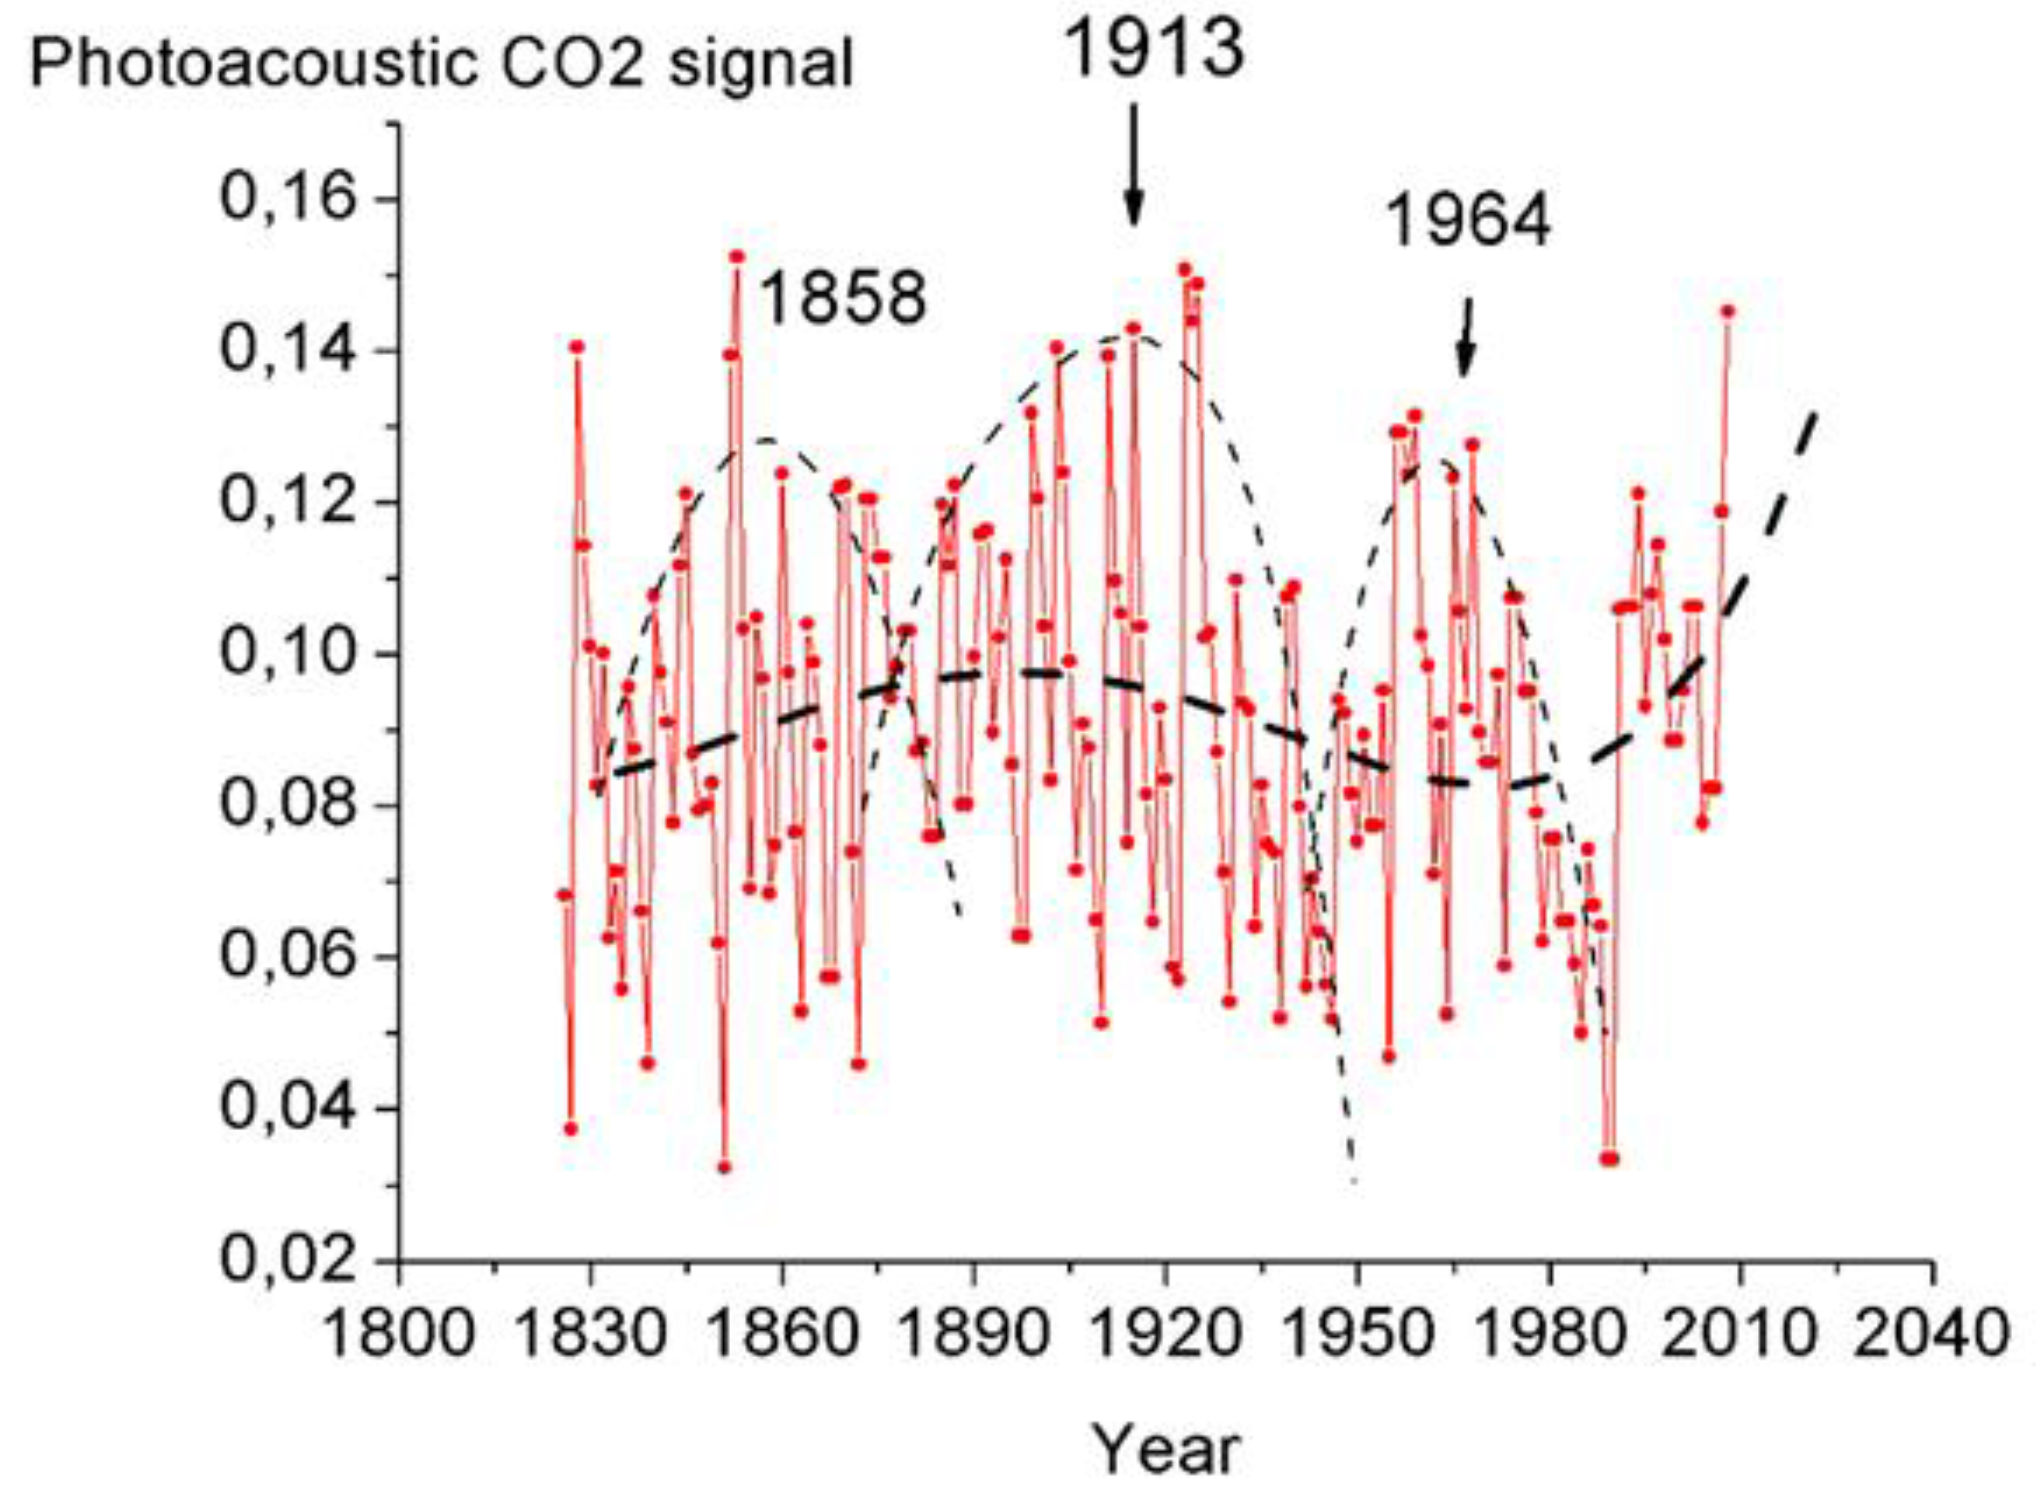
2 stored in the larch disc exhibits 2-, 4-year, and higher-order cycles. To provide a more graphic illustration of the foregoing effect, we have used polynomials to approximate the tree ring CO
2 distribution data collected in 1840–1935. The polynomial approximation of the CO
2 tree ring distributions obtained since 1830 has emphasized ~50-year long-term cycles (
Figure 8) and a tendency towards disc tree ring CO
2 rise for the last years attributable to atmospheric CO
2 rise [
13]. These cycles (~50 year) are difficult to distinguish by the ORIGIN software.
Figure 7.
Amplitude spectrum of the tree ring CO2 in the 300 year old larch.
Figure 7.
Amplitude spectrum of the tree ring CO2 in the 300 year old larch.
Figure 8.
Superposition of long-term cyclicity on short-term cycles of the annual CO2 distribution in the disc tree rings of the 300 year old larch.
Figure 8.
Superposition of long-term cyclicity on short-term cycles of the annual CO2 distribution in the disc tree rings of the 300 year old larch.
We have discovered that the cyclic patterns studied may vary. As an example, the manner in which the cyclic patterns of the CO
2 tree ring distribution averaged over 4-year running average values varied in 1840–1935 is demonstrated in
Figure 9.
Figure 9.
Variations in the annual vacuum-desorbed СО2 concentrations (ppm) in1840–1935. Appreciable variations in the CO2 cycles in the 300 year old larch rings are observed.
Figure 9.
Variations in the annual vacuum-desorbed СО2 concentrations (ppm) in1840–1935. Appreciable variations in the CO2 cycles in the 300 year old larch rings are observed.
Previously it was found [
7,
8] that the CO
2 and H
2O content in the tree rings of the Siberian stone pine varying over a wide range of time scales was affected by climatic factors. This is most closely related to 4-year and 2-year periods of variations in the amount of precipitation in the dormant phase, whereas long-term variations in the CO
2 content anticorrelate with temperature in the vegetation period. As regards the 300 year old larch, a significant correlation was found between CO
2 content and winter precipitation. (The Spearman rank correlation coefficients were 0.32, 0.36, 0.37, 0.51, and 0.40 for November, December, January, February, and March, respectively, with a 95% confidence interval for the 120-year period from 1889 to 2008). In this case, however, the correlation was positive, which is evidence for the association of the CO
2 content and spring soil moisture.
For comparison purposes, we have presented the vacuum-desorbed CO
2 distributions in the disc tree rings of the 300 year old larch and those relating to the discs brought from other regions, specifically from the region located near Lake Baikal.
Figure 10 shows annual variations in the CO
2 content measured in the 61 larch disc tree rings brought from the Baikal region. Using second-order polynomial curves, the tree ring CO
2 distributions can be grouped together into three time spans. This is indicative of the years wherein the CO
2 content in these distributions was at its maximum: 1944, 1961, and 1987. Thus, as
Figure 10 suggests, the CO
2 content is characterized by (1) distinct short-term cycles modulated by long-term ones and by (2) a negative trend.
Figure 10.
Annual variations in the CO2 concentrations (ppm) in the larch disc tree rings (settlement of Chernorud, Lake Baikal, Russia).
Figure 10.
Annual variations in the CO2 concentrations (ppm) in the larch disc tree rings (settlement of Chernorud, Lake Baikal, Russia).


