Investigating the Microstructure and Mechanical Properties of Aluminum-Matrix Reinforced-Graphene Nanosheet Composites Fabricated by Mechanical Milling and Equal-Channel Angular Pressing
 ,
, 
 , , ,
, , ,
Abstract
:
1. Introduction
2. Materials and Methods
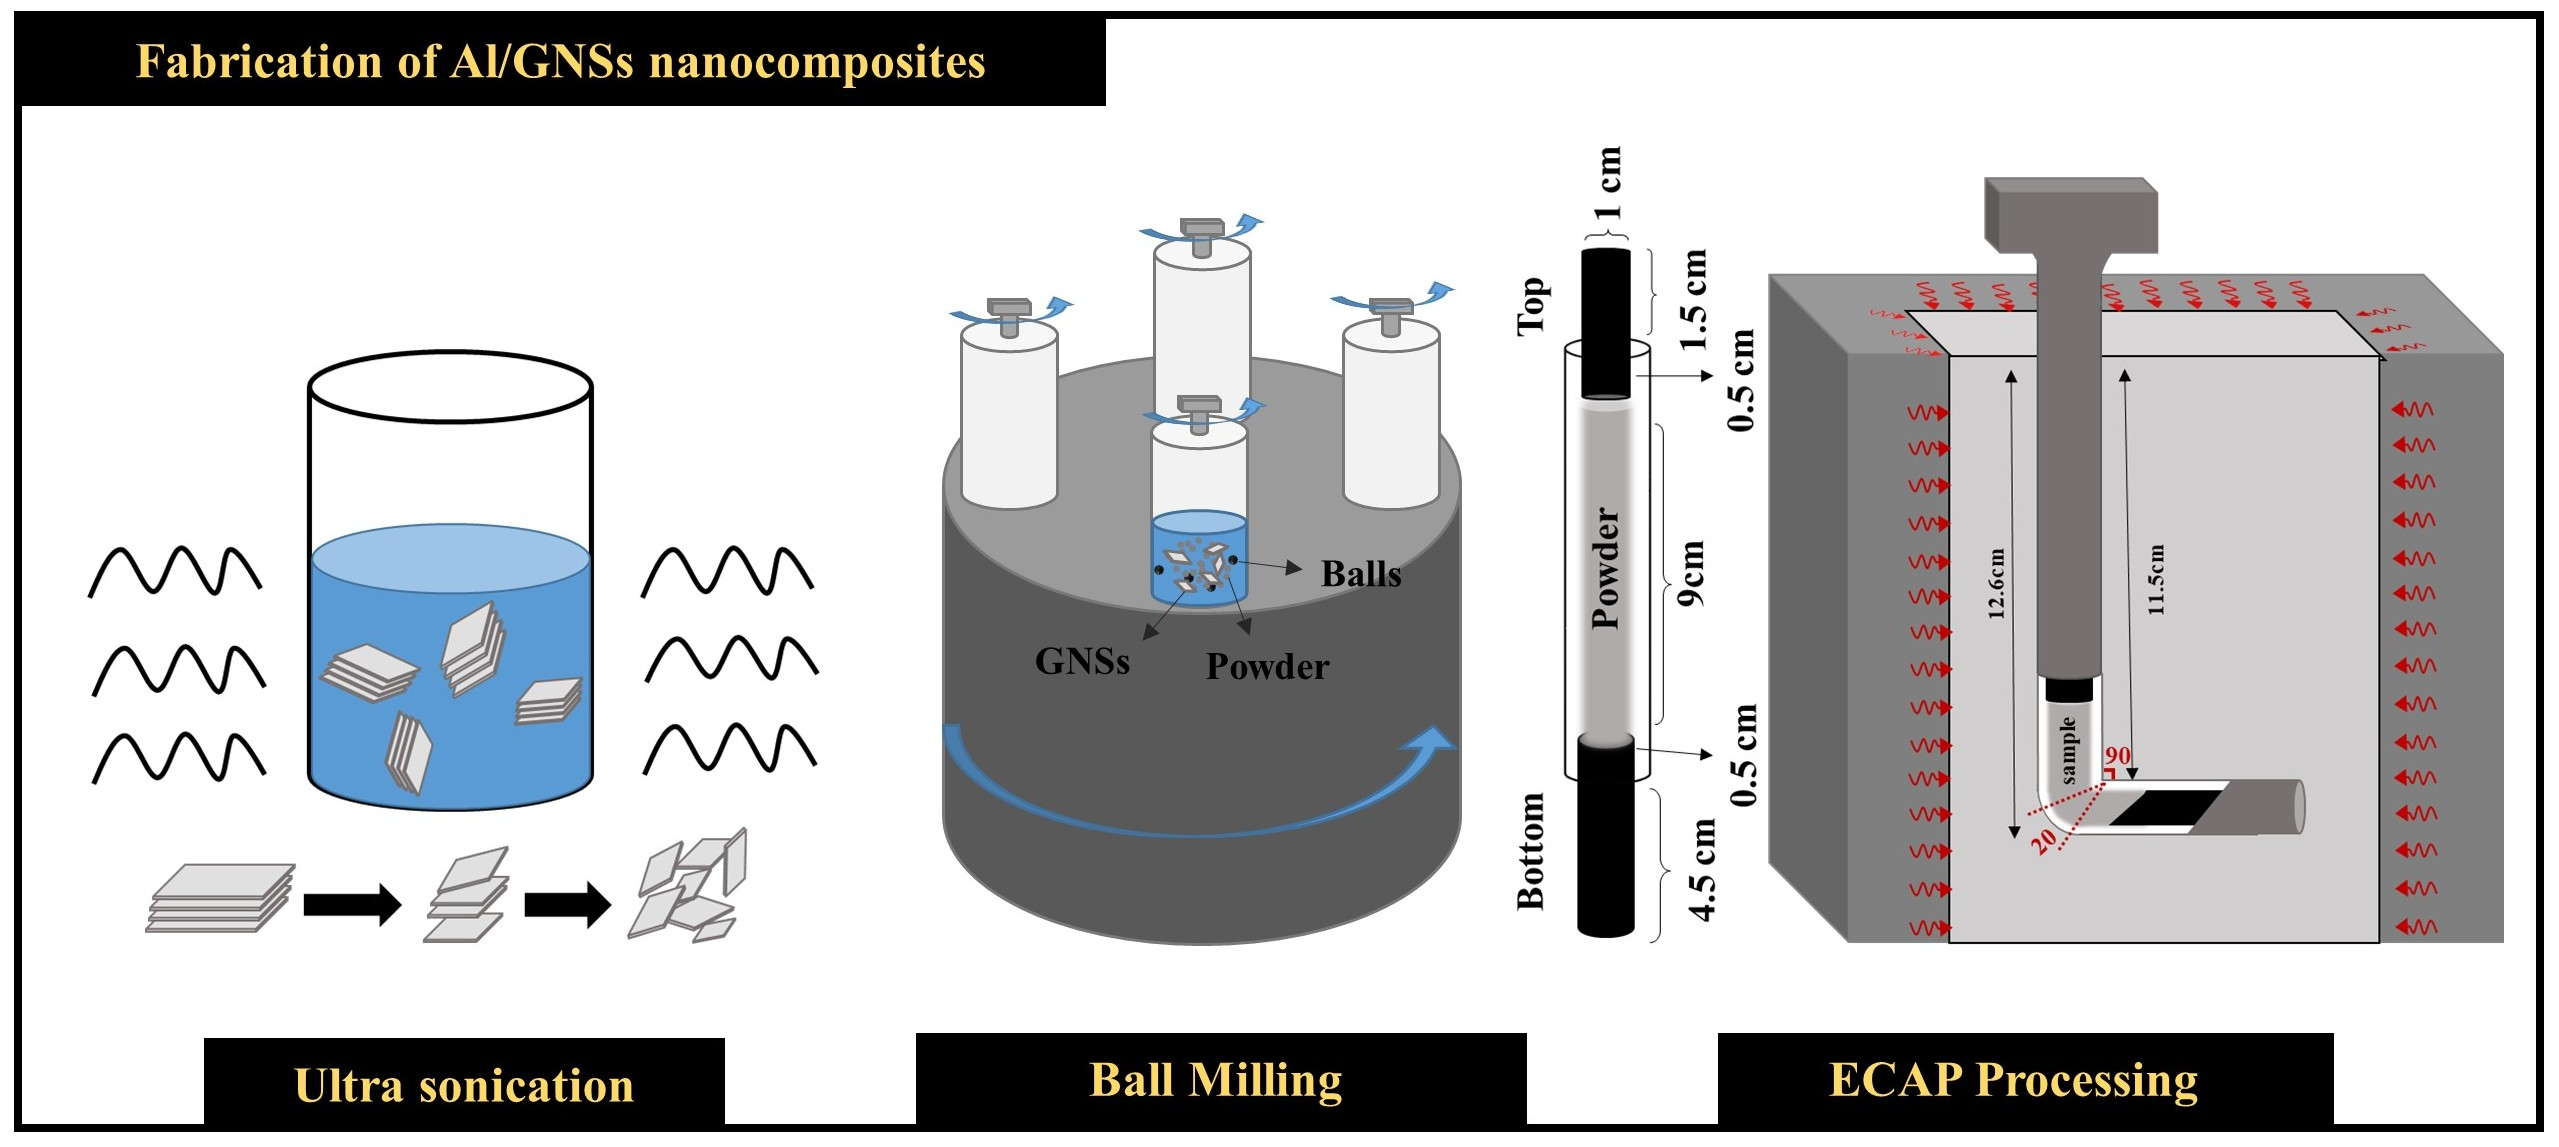
2.1. Materials
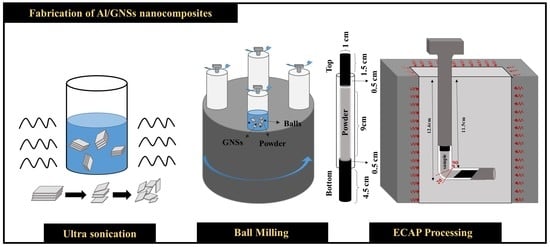
2.2. Experimental Procedure
2.2.1. Powder Preparation
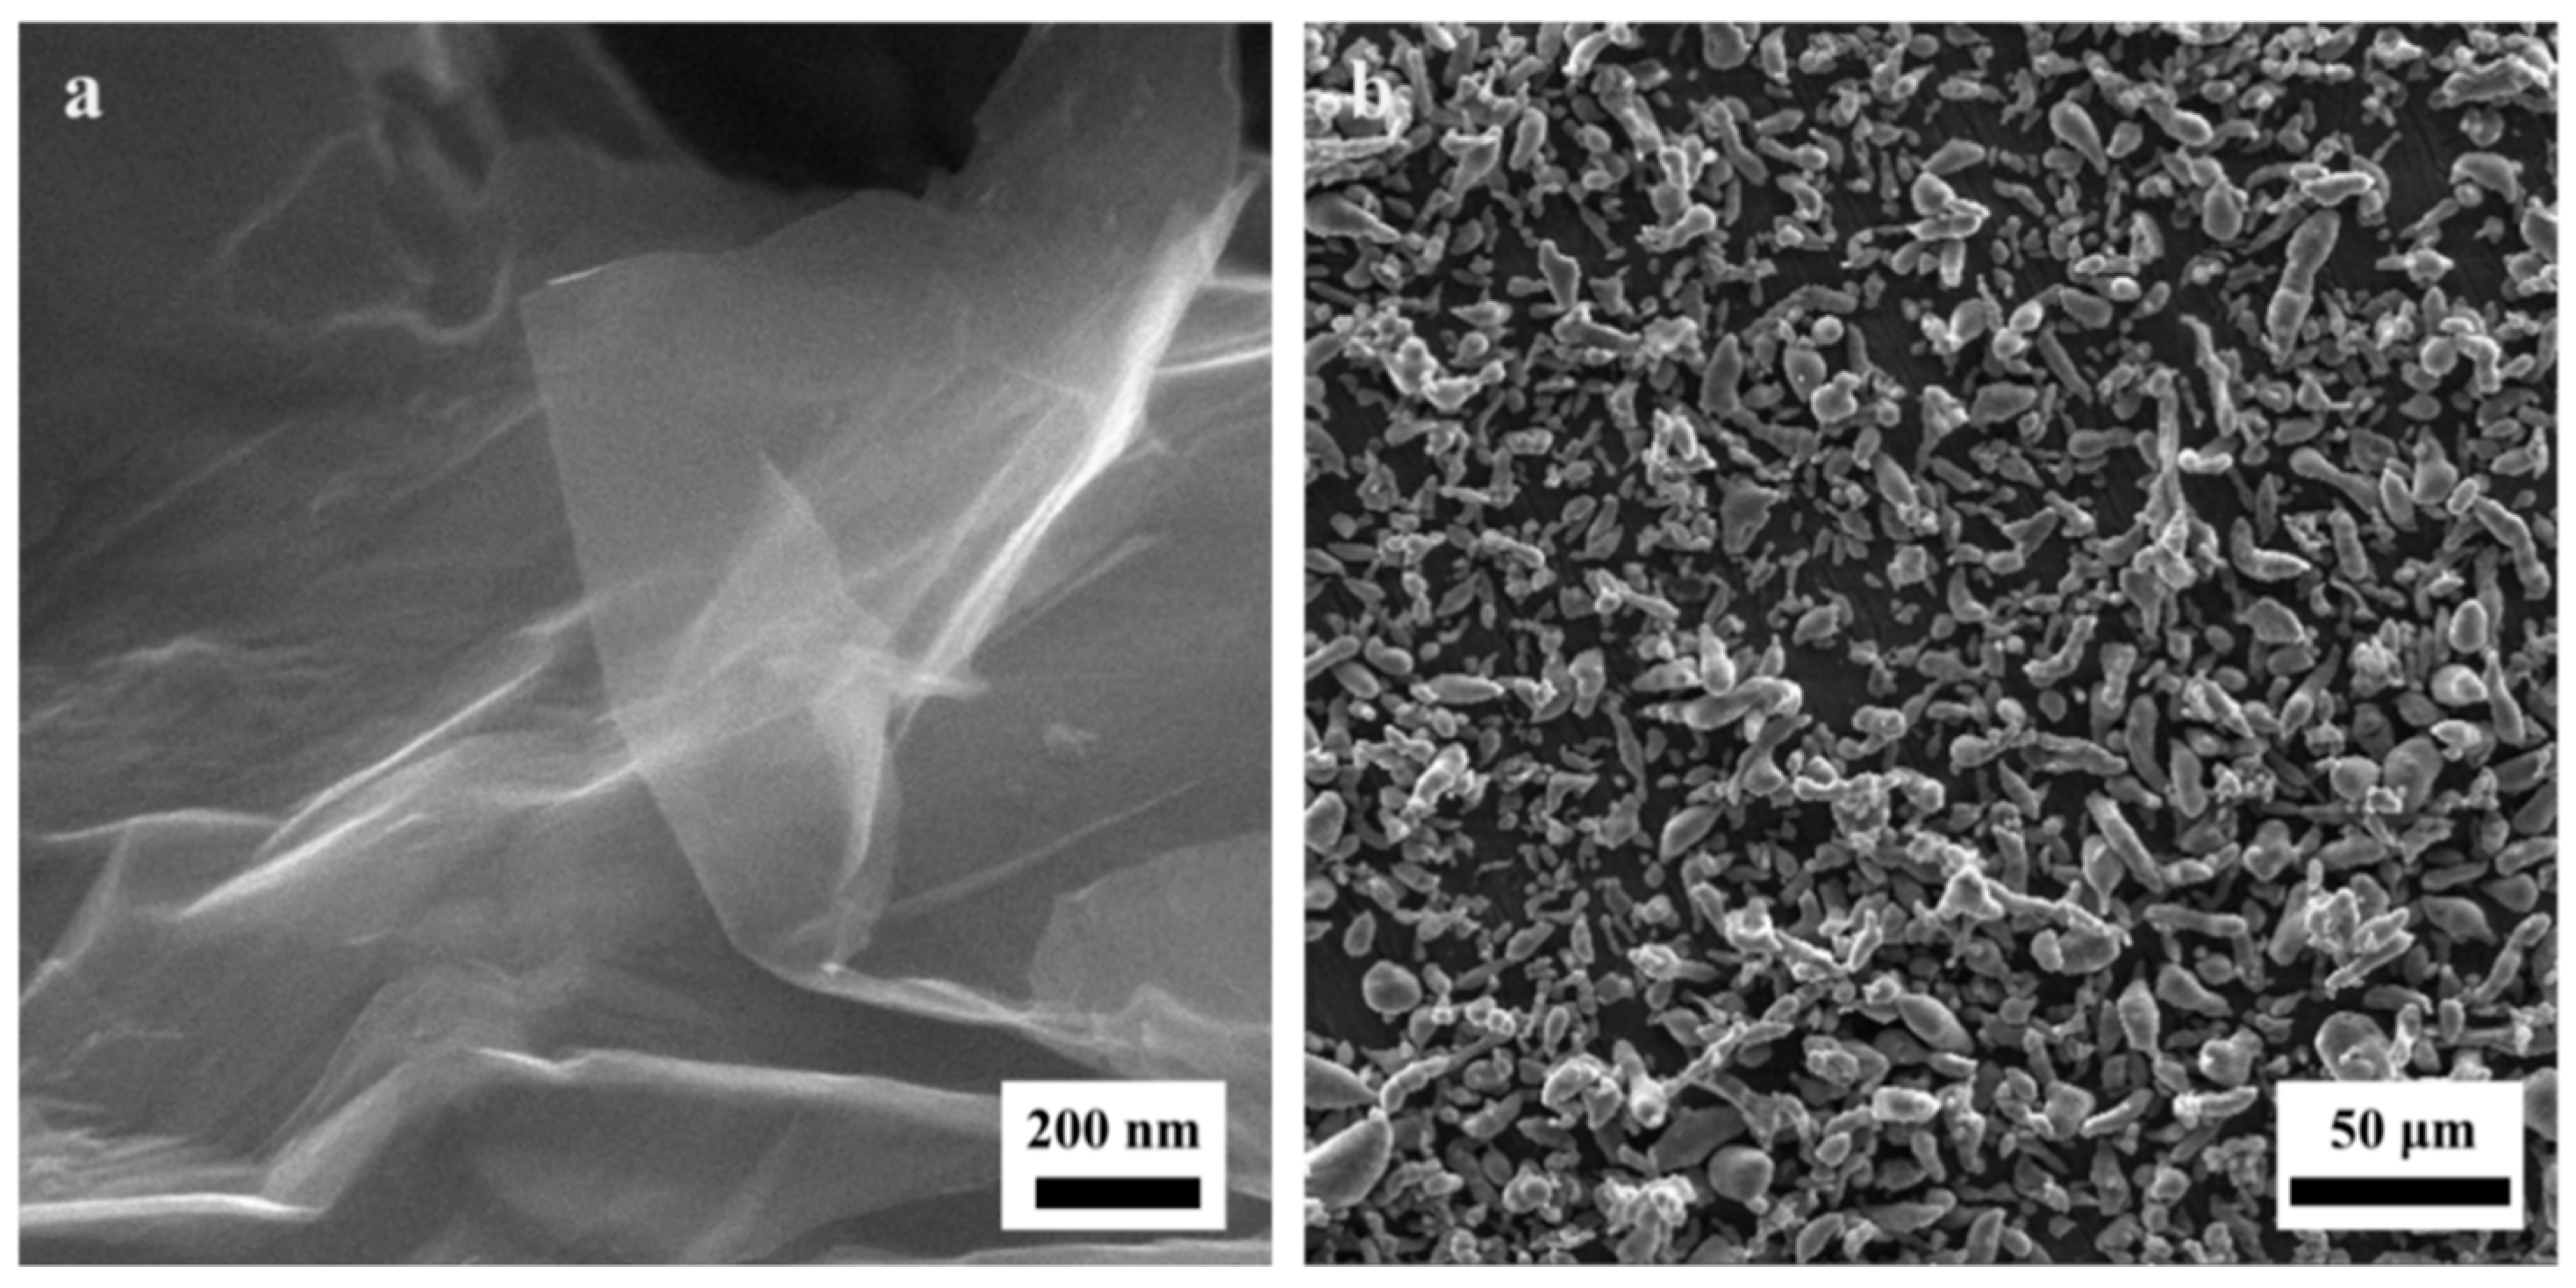
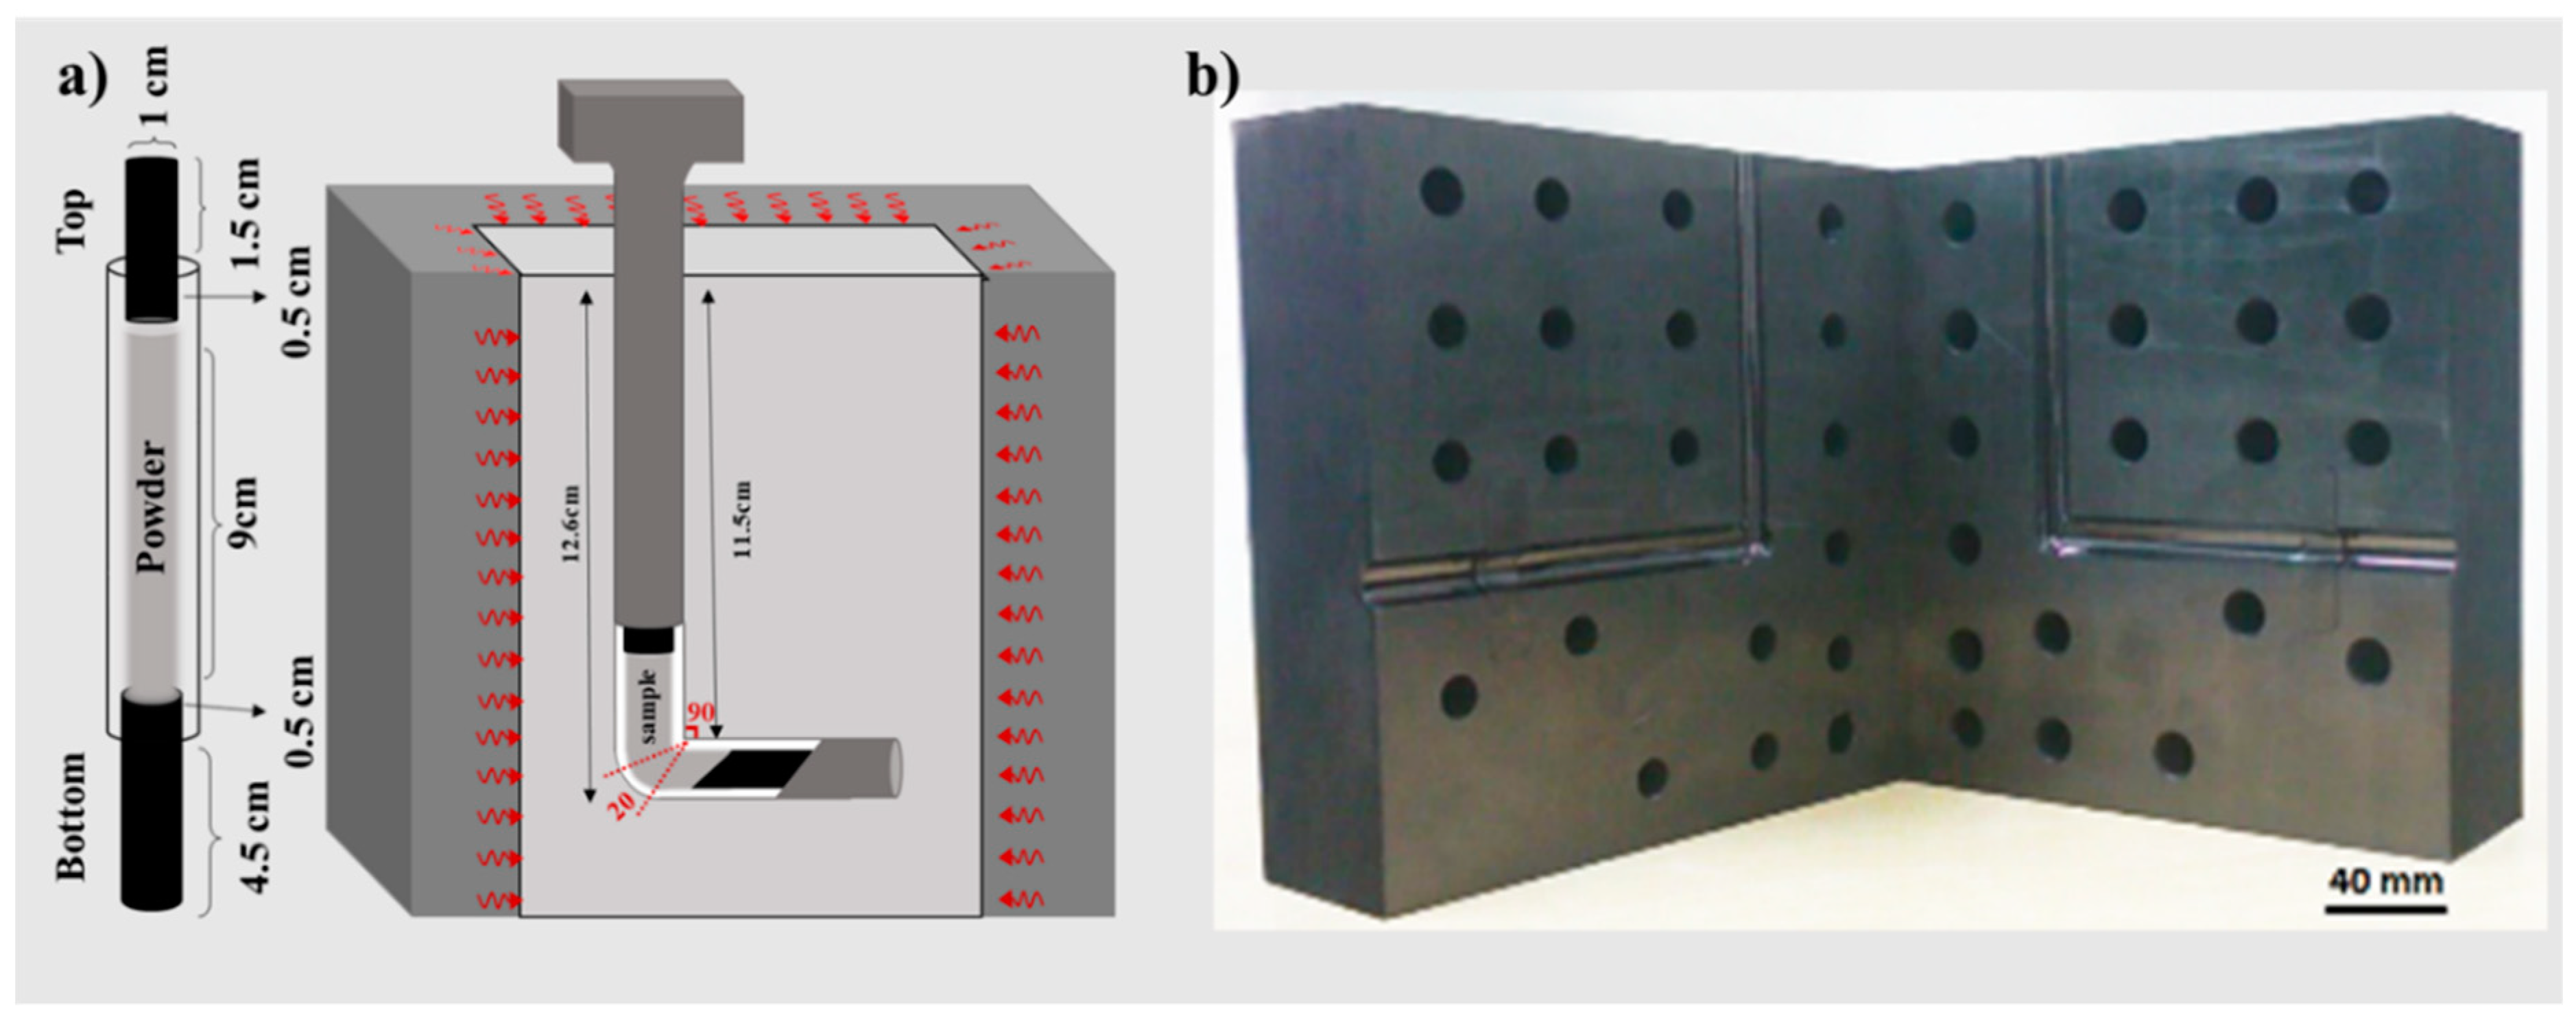
2.2.2. ECAP Process
2.3. Characterization
3. Results
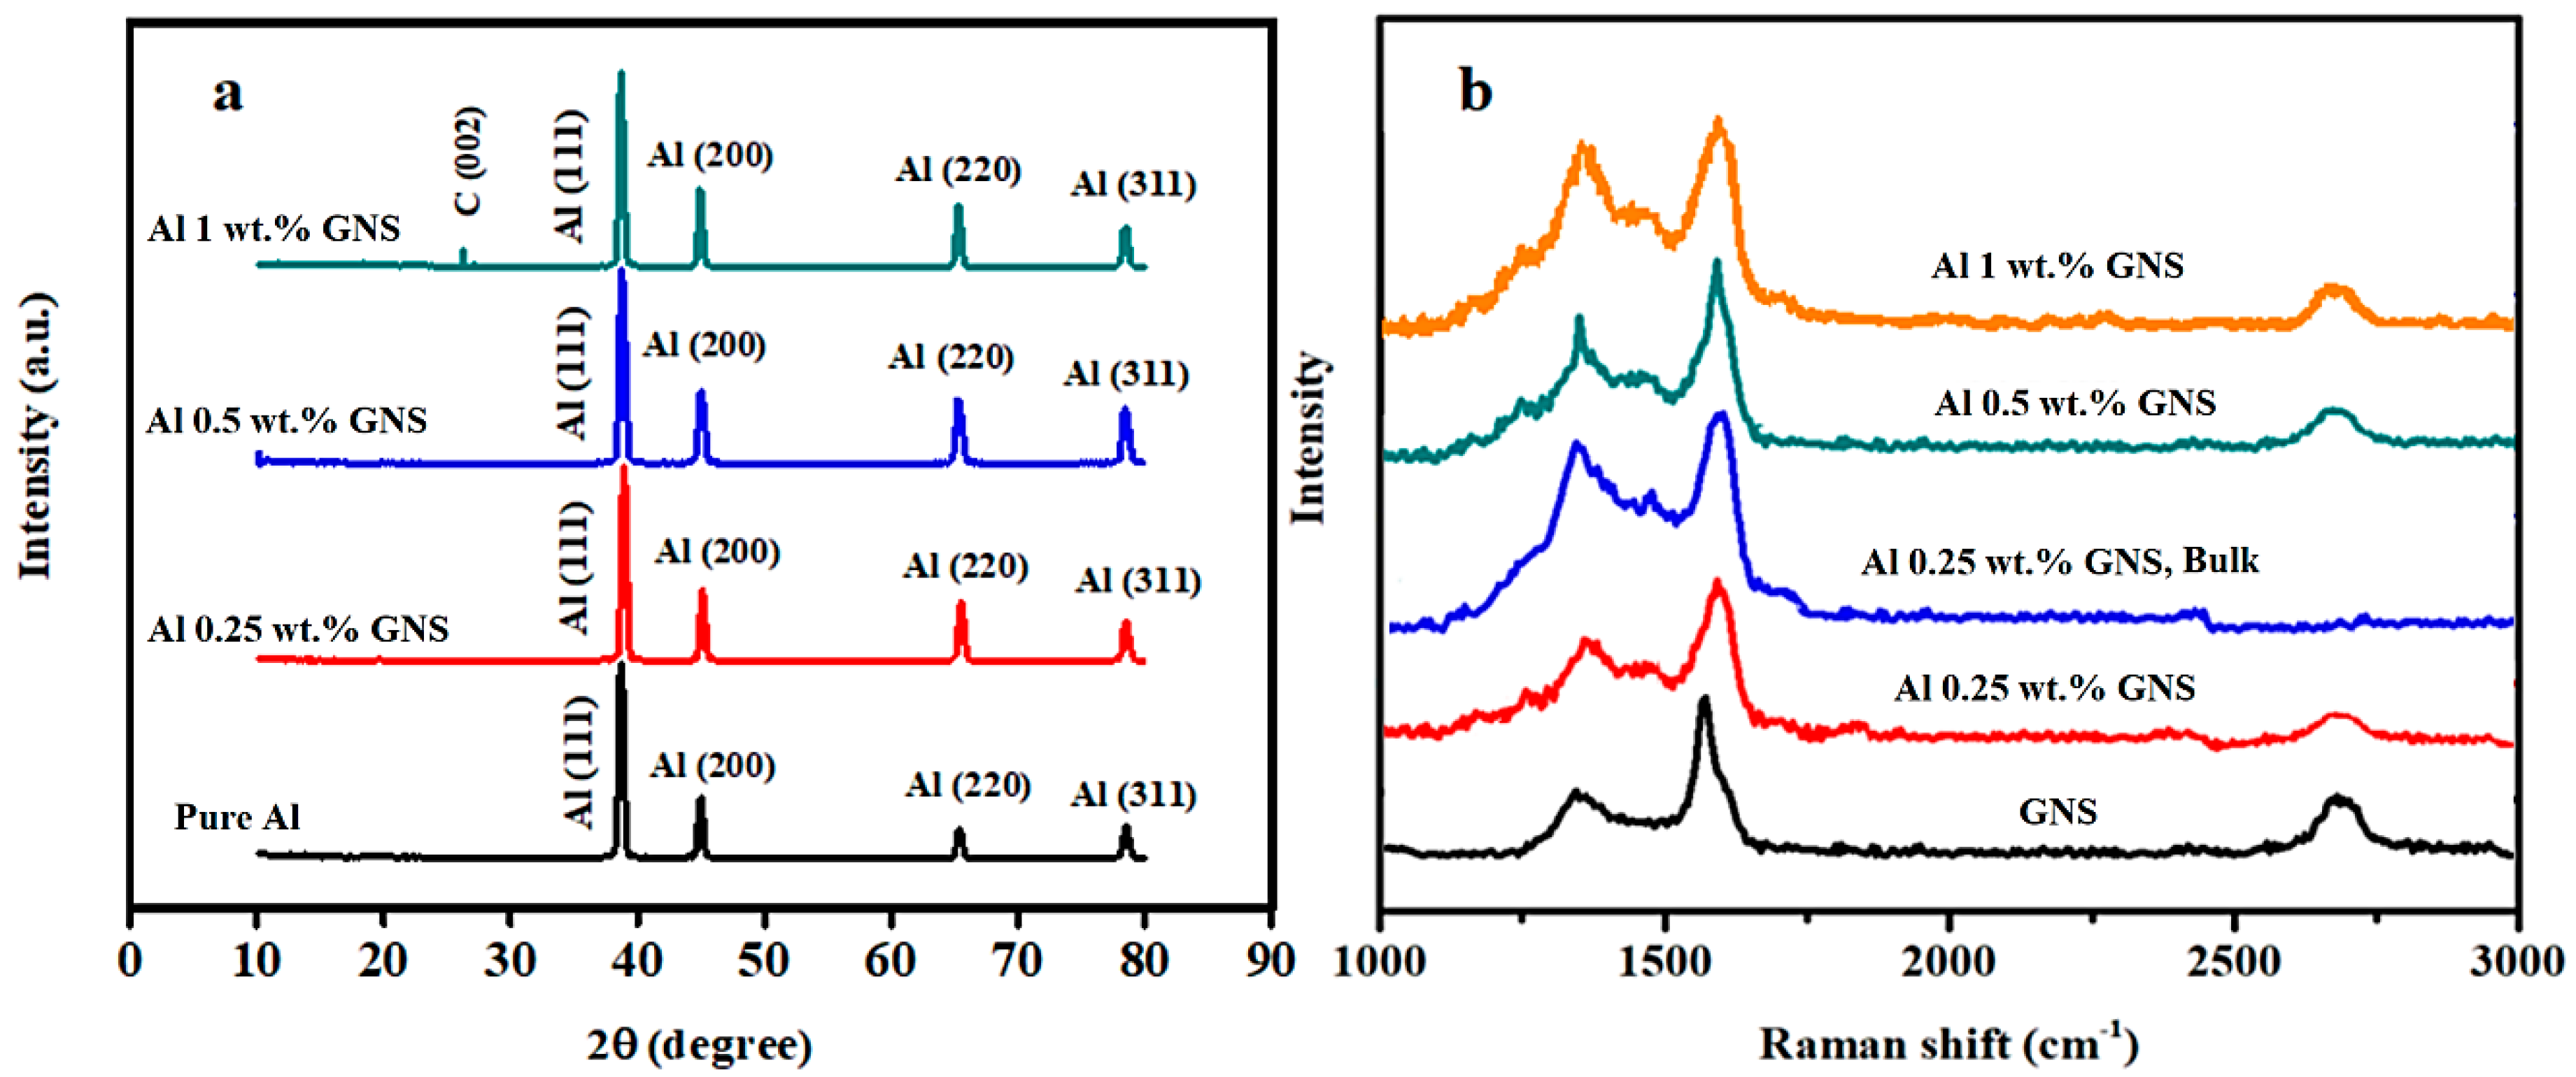
3.1. X-Ray Diffraction
3.2. Raman Spectroscopy
3.3. Microstructure Characterization
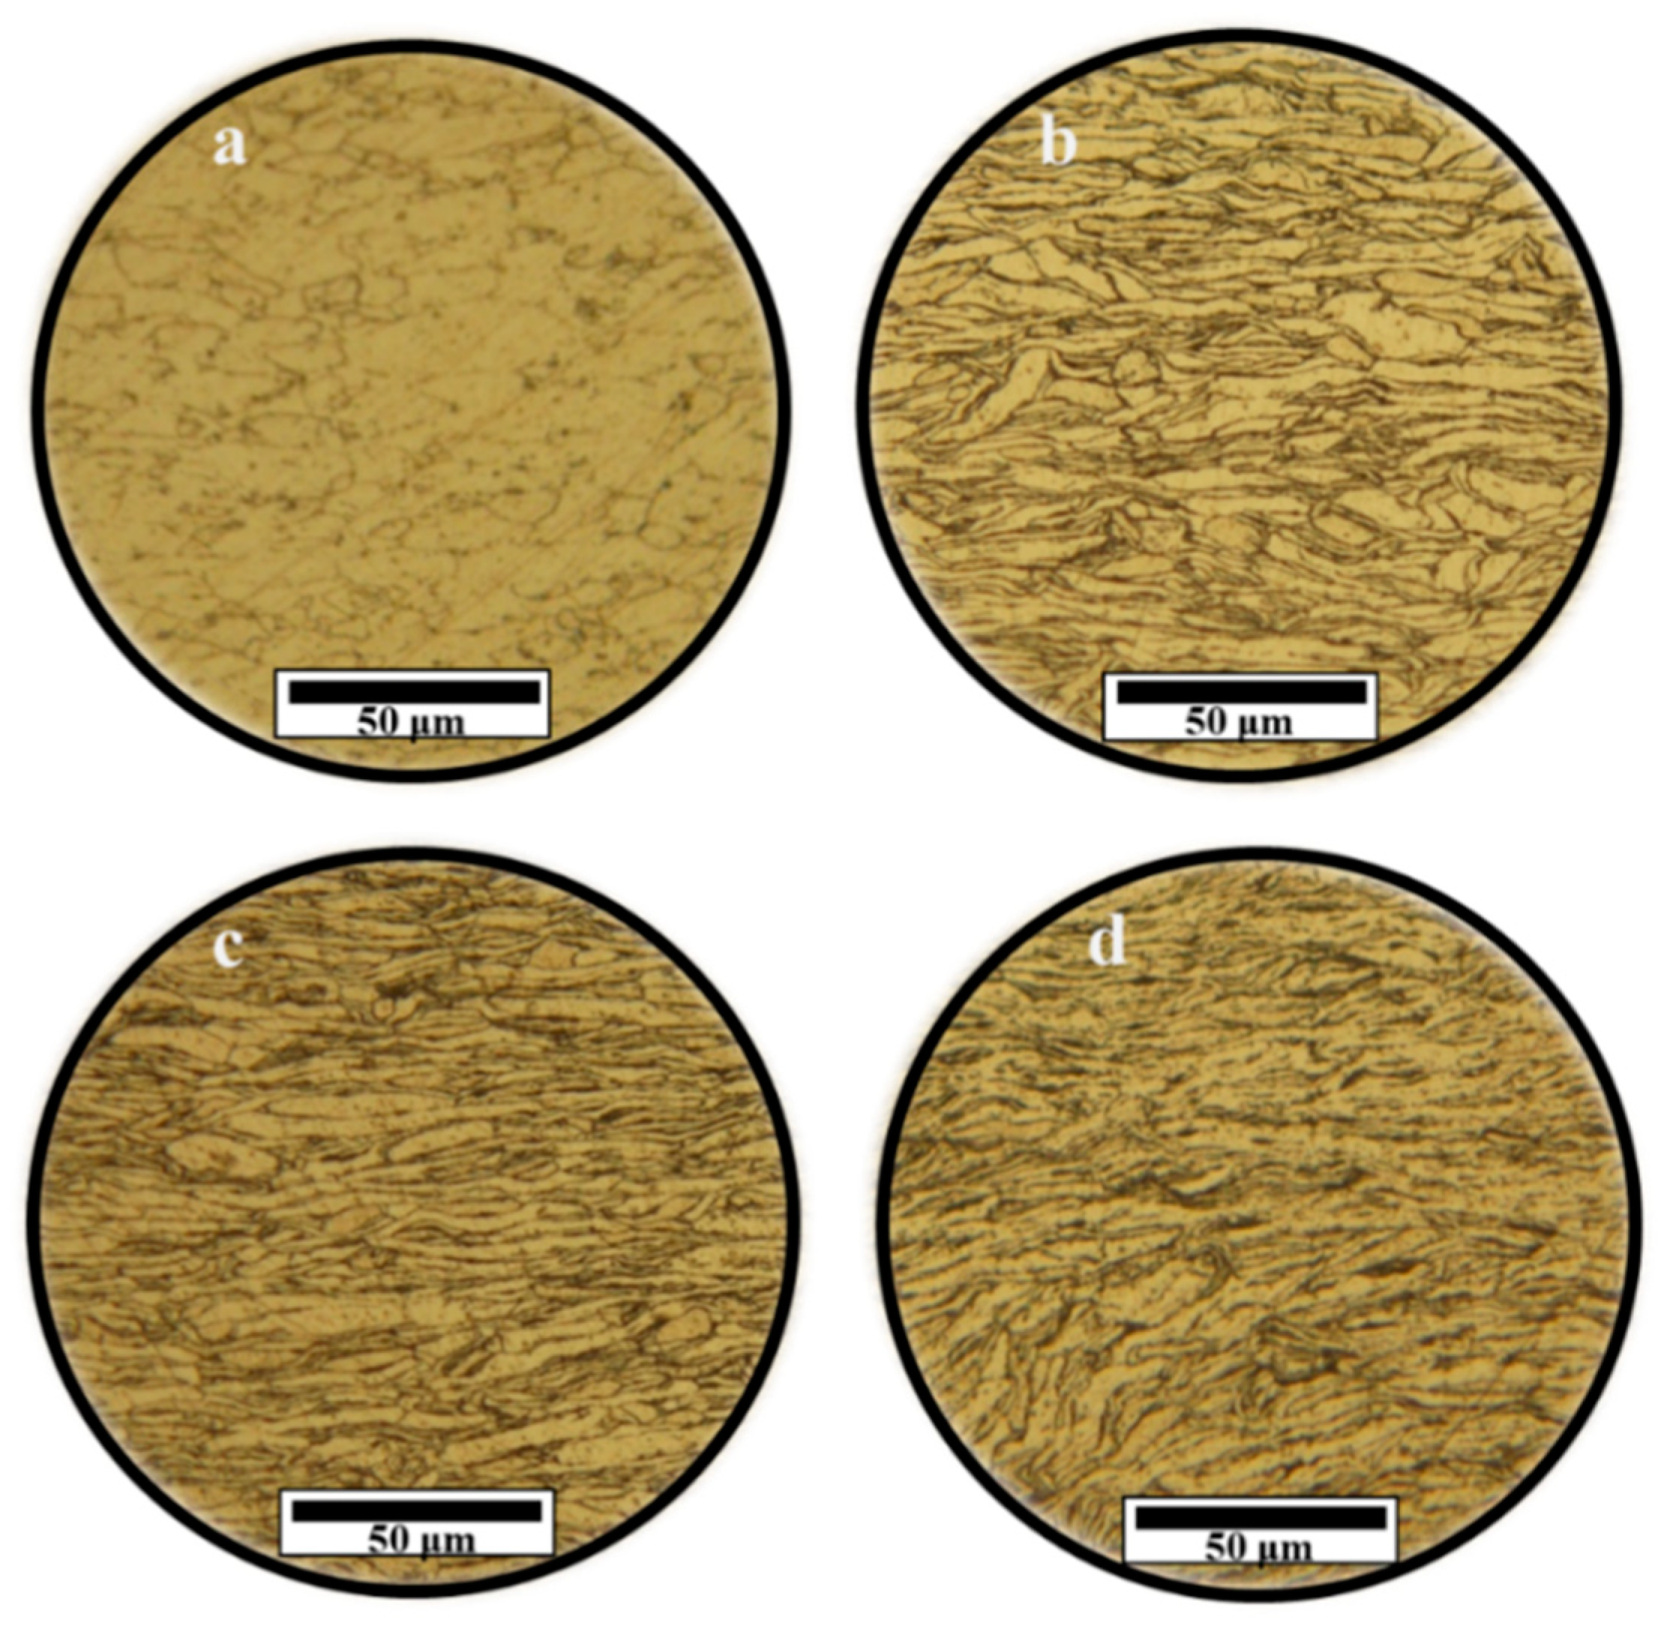
3.3.1. Light Optical Microscopy
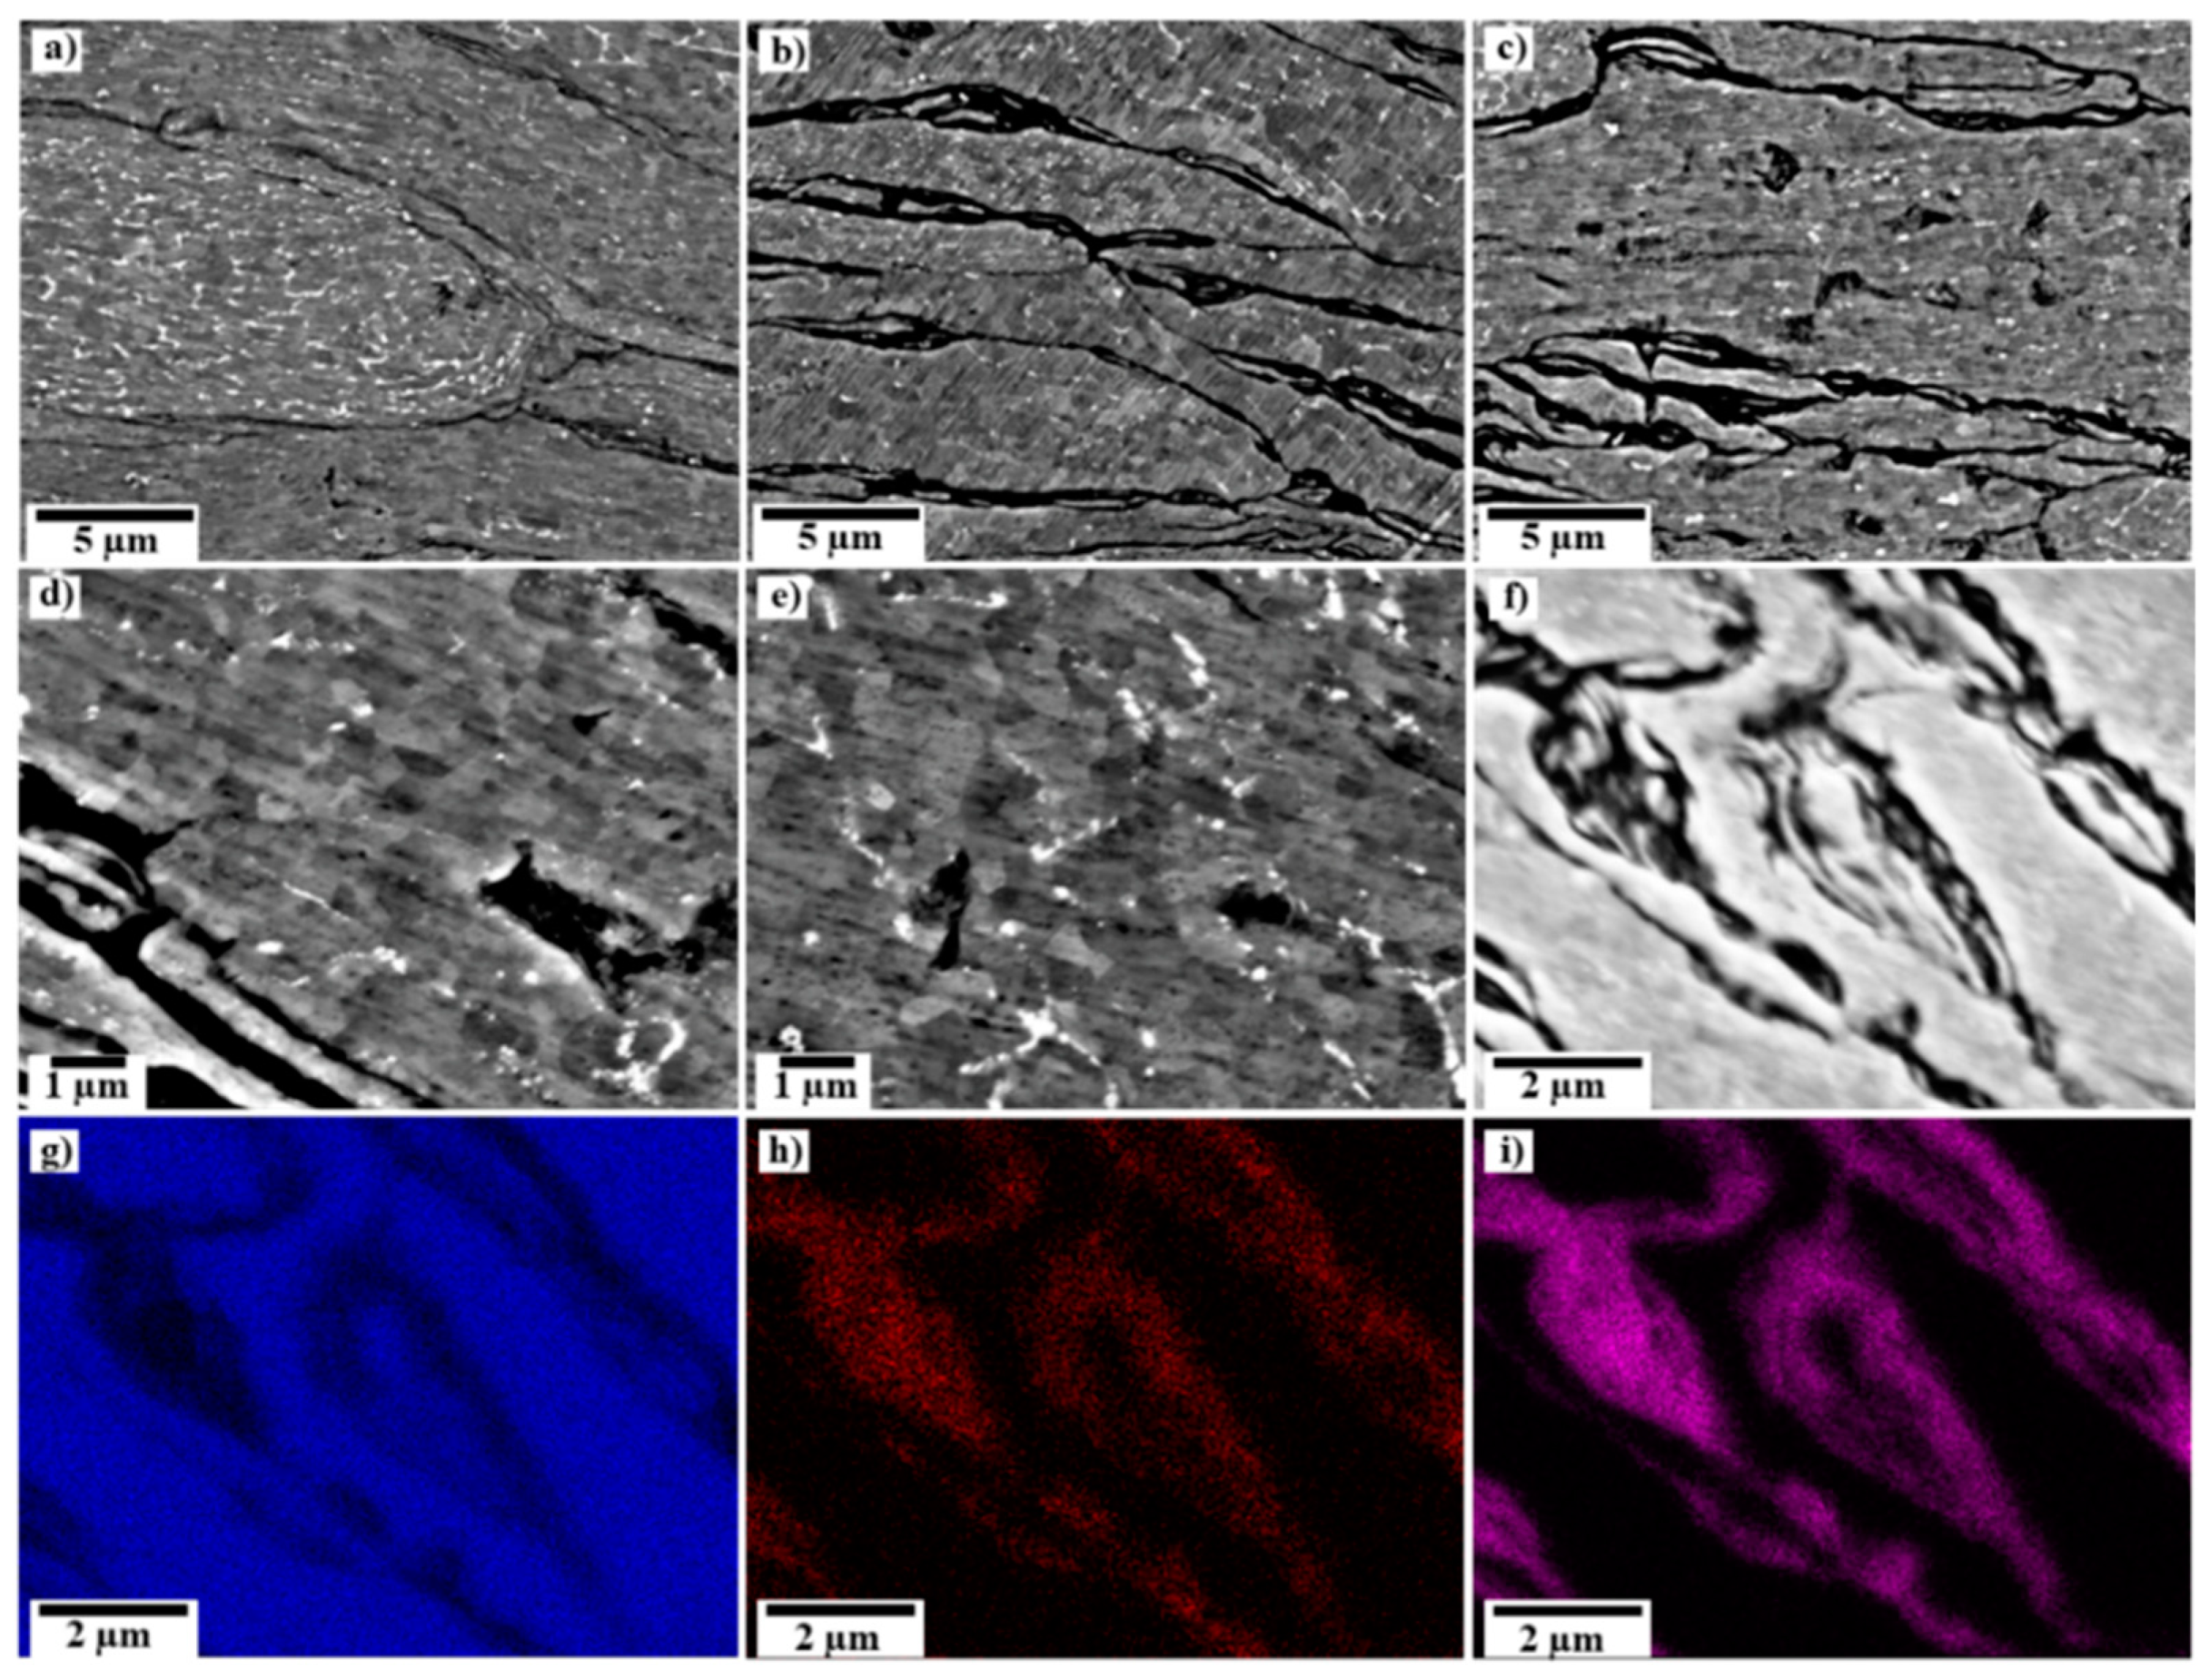
3.3.2. Scanning Electron Microscopy
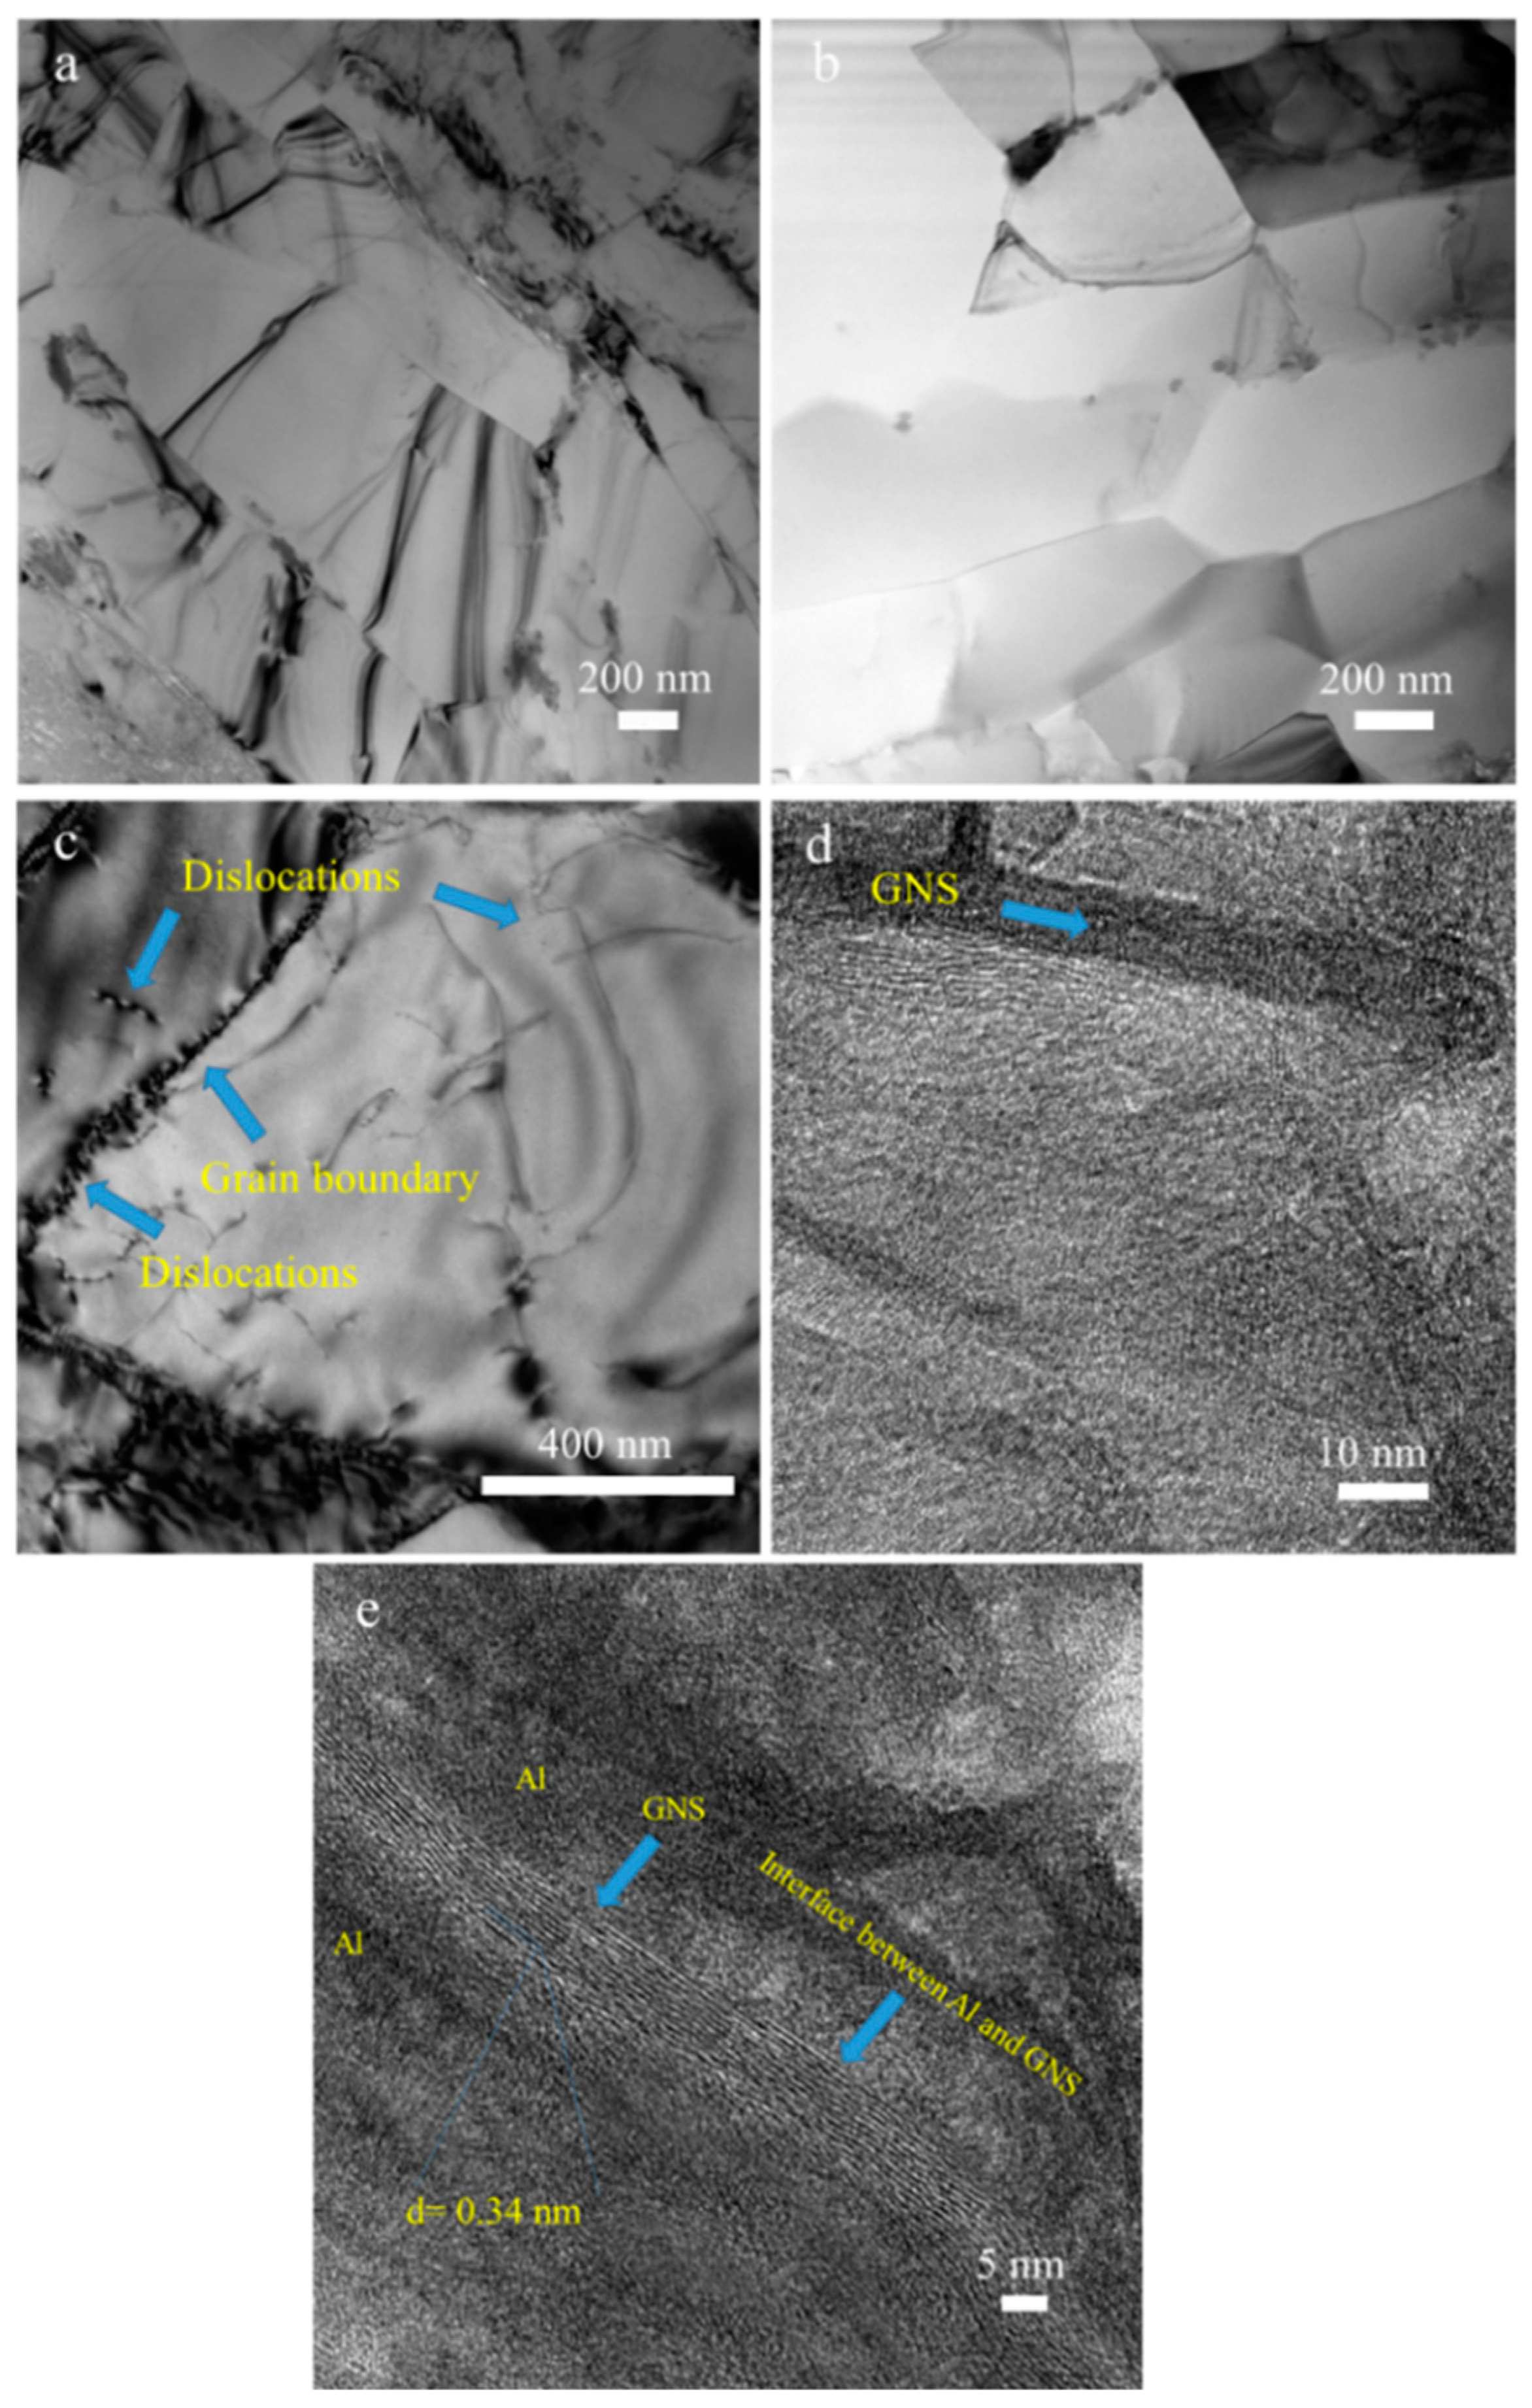
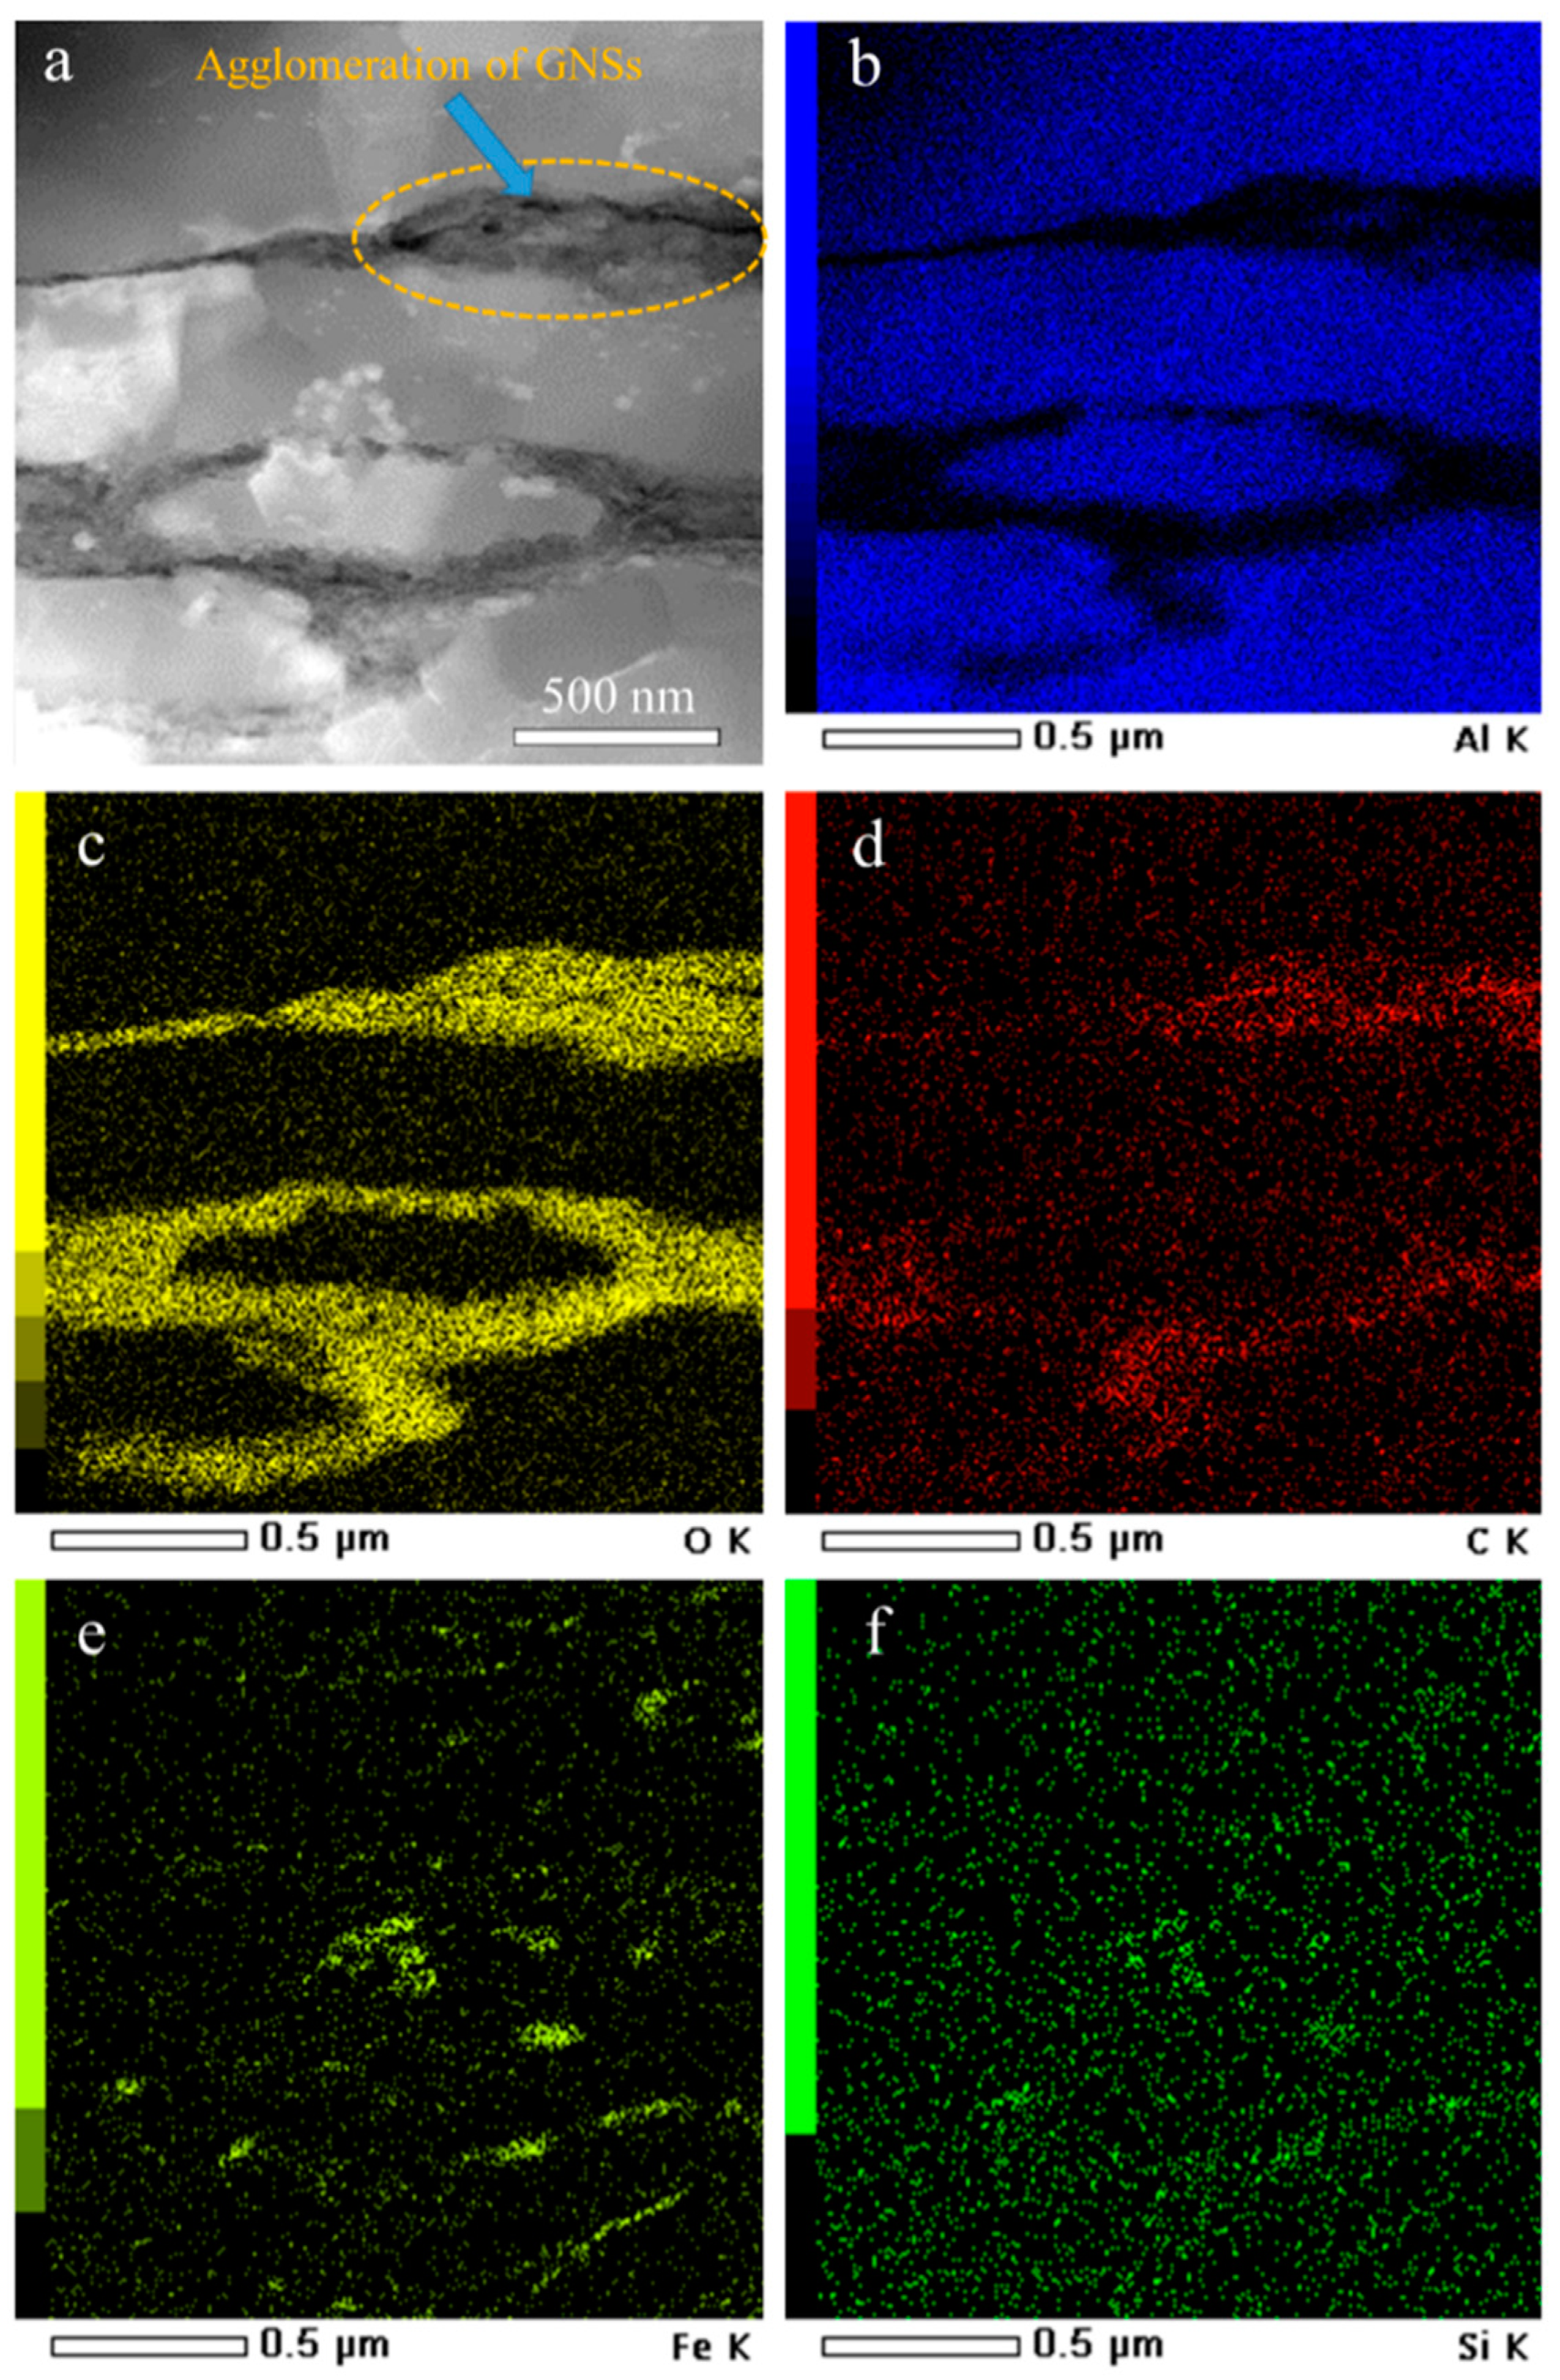
3.3.3. Transmission Electron Microscopy
3.4. Density
3.5. Mechanical Properties
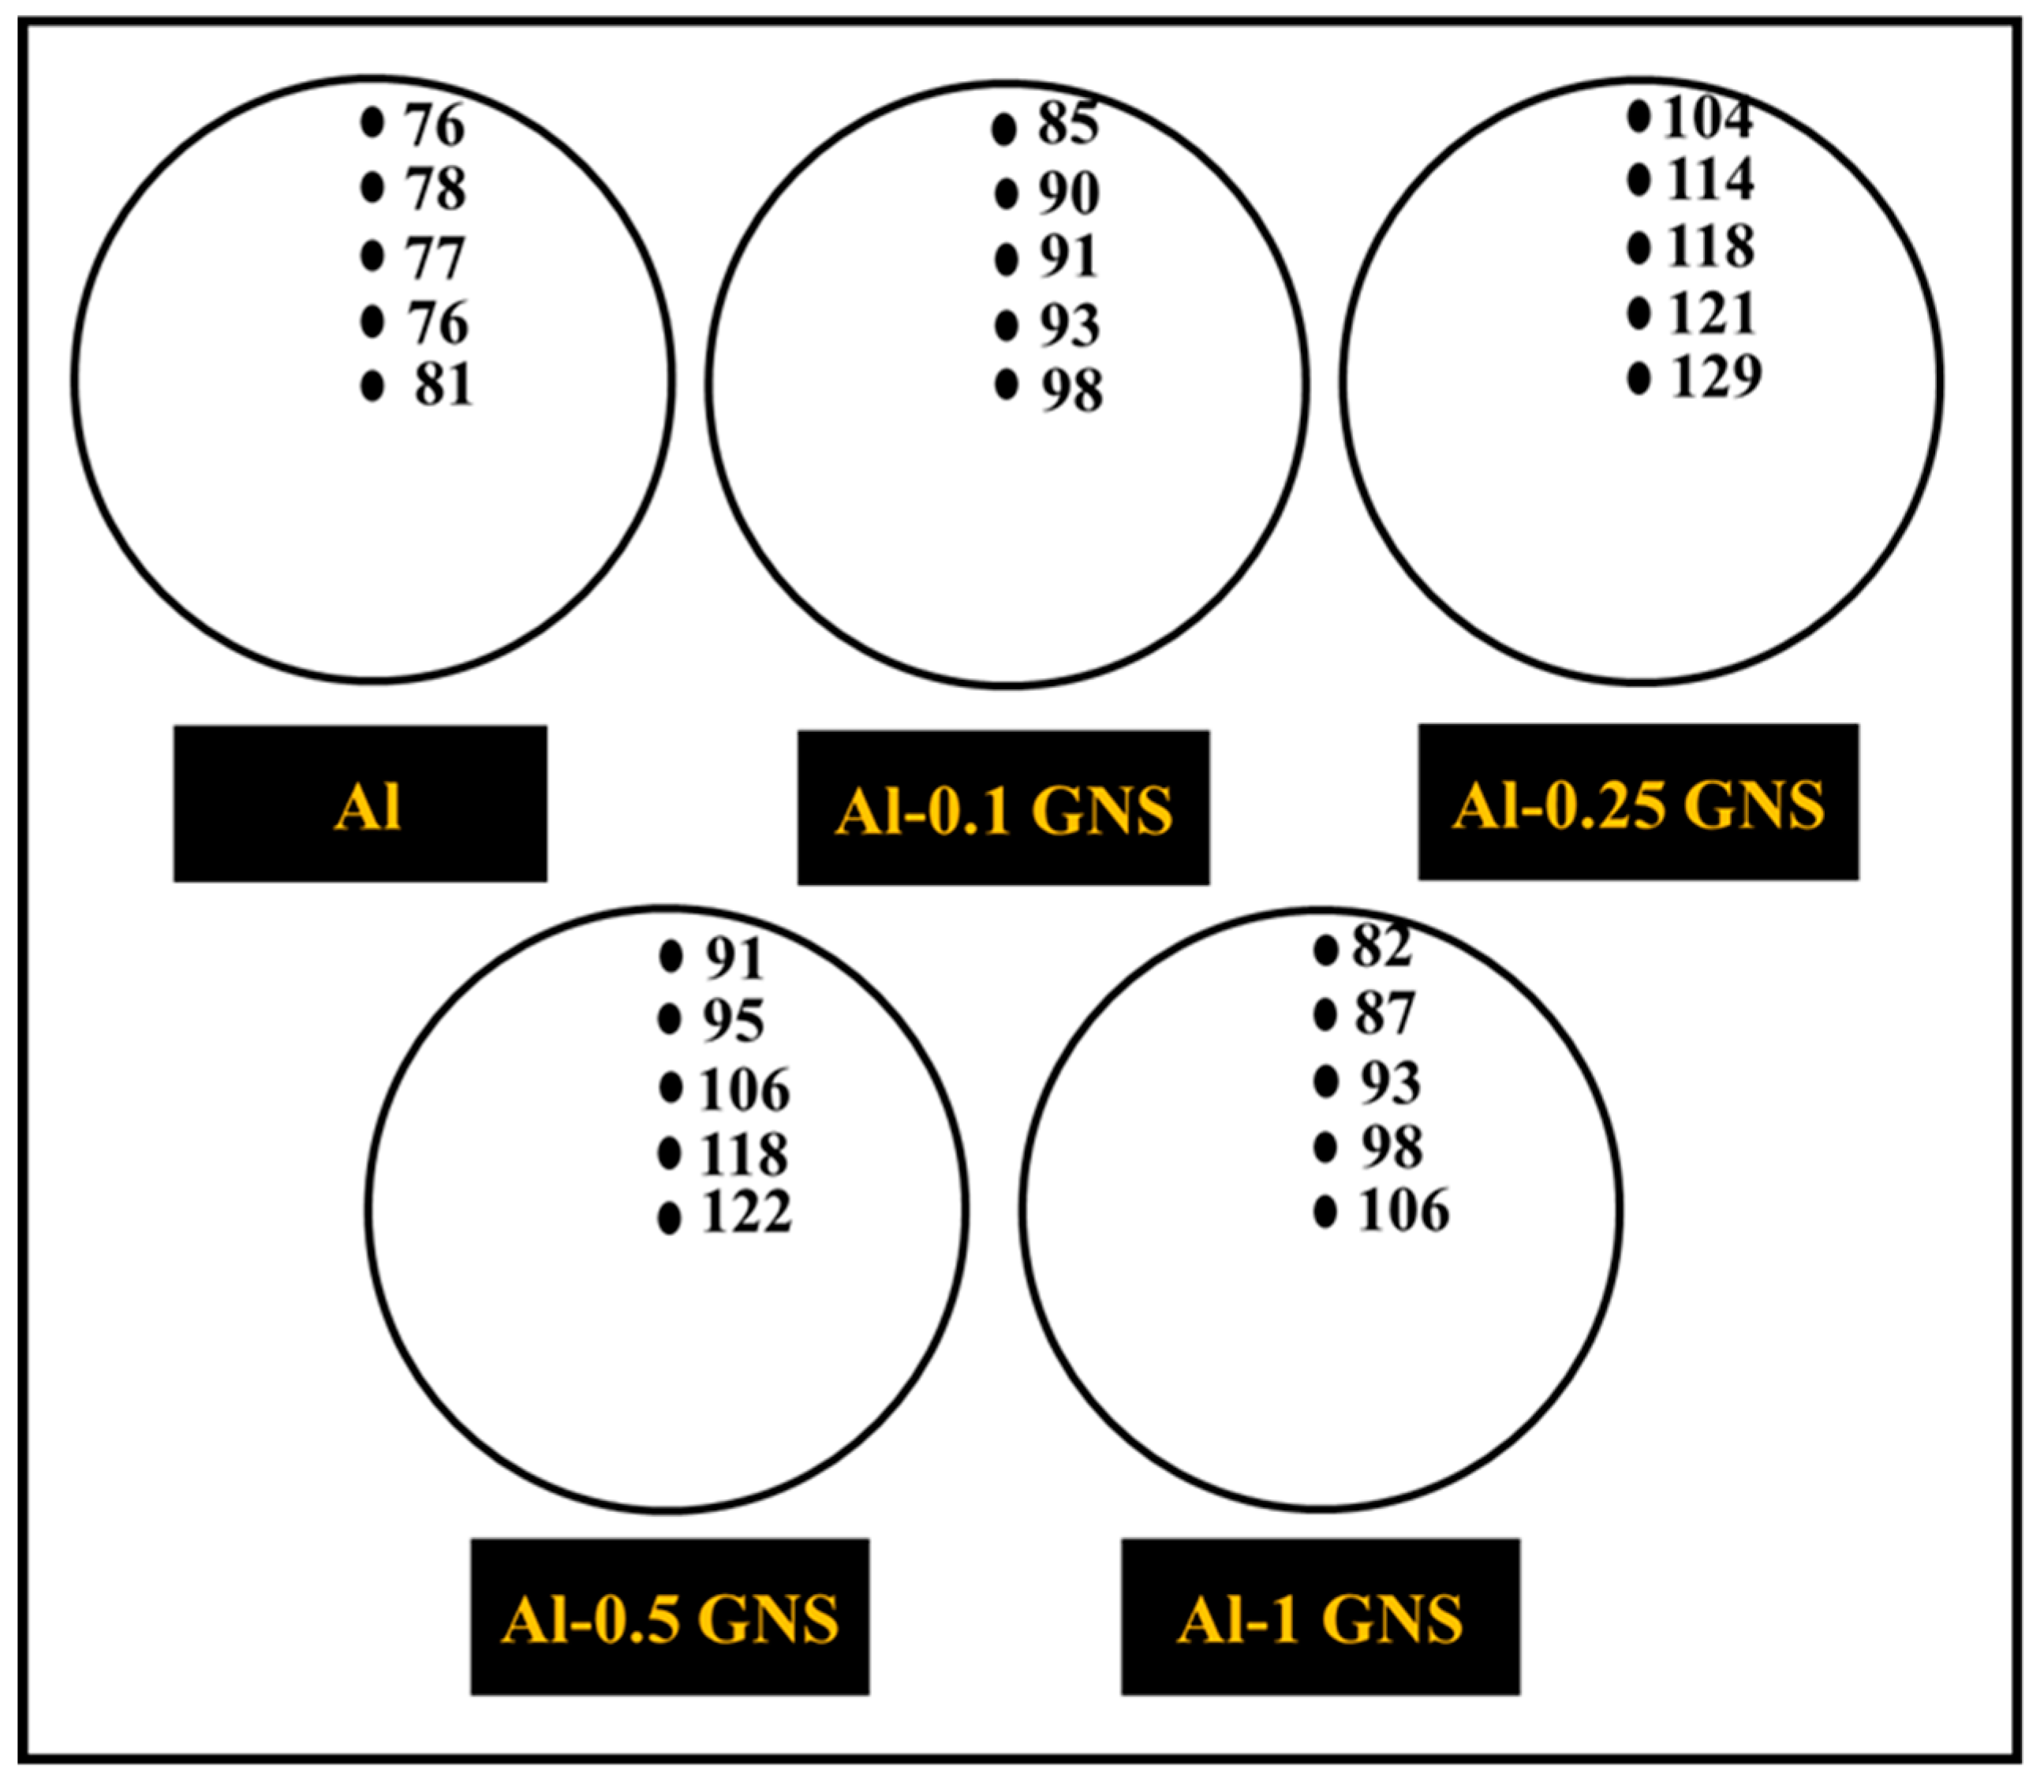
3.5.1. Hardness
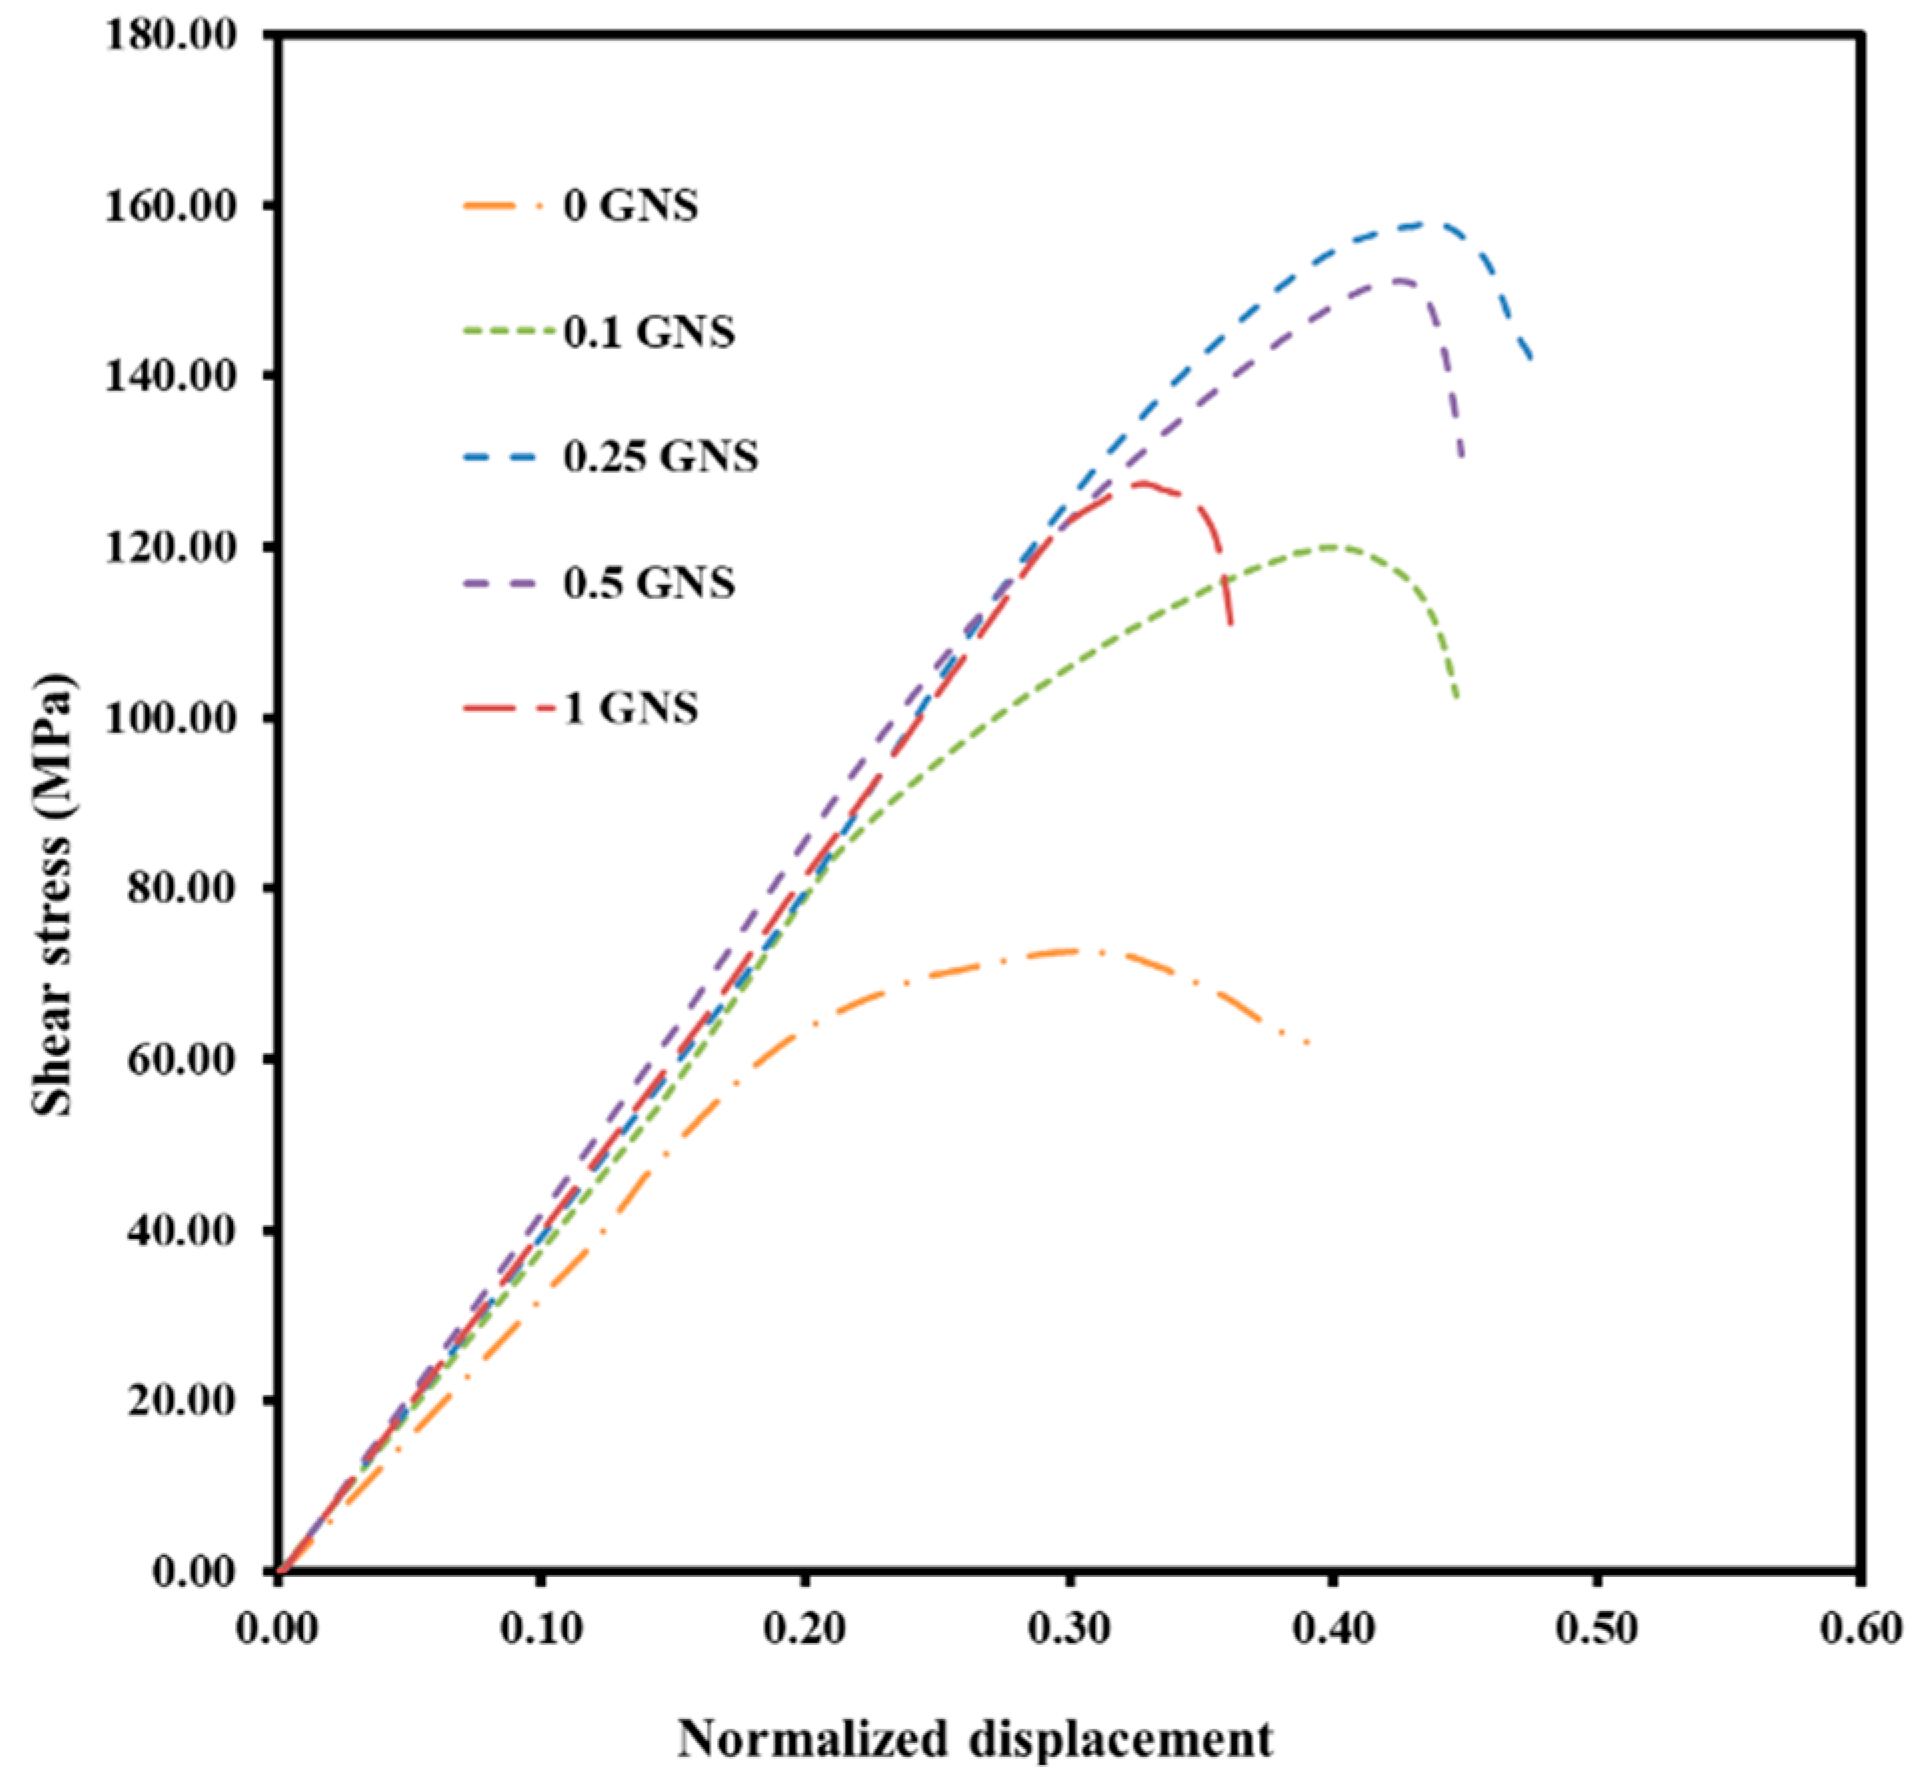
3.5.2. Shear Stress
4. Conclusions
Author Contributions
Funding
Conflicts of Interest
References
- Smith, A.T.; LaChance, A.M.; Zeng, S.; Liu, B.; Sun, L. Synthesis, properties, and applications of graphene oxide/reduced graphene oxide and their nanocomposites. Nano Mater. Sci. 2019, 1, 31–47. [Google Scholar] [CrossRef]
- Kumar, P.; Yu, S.; Shahzad, F.; Hong, S.M.; Kim, Y.-H.; Koo, C.M. Ultrahigh electrically and thermally conductive self-aligned graphene/polymer composites using large-area reduced graphene oxides. Carbon 2016, 101, 120–128. [Google Scholar] [CrossRef]
- Choi, W.; Lahiri, I.; Seelaboyina, R.; Kang, Y.S. Synthesis of graphene and its applications: A review. Crit. Rev. Solid State Mater. Sci. 2010, 35, 52–71. [Google Scholar] [CrossRef]
- Lee, W.C.; Loh, K.P.; Lim, C.T. When stem cells meet graphene: Opportunities and challenges in regenerative medicine. Biomaterials 2018, 155, 236–250. [Google Scholar]
- Wang, Y.; Li, Z.; Wang, J.; Li, J.; Lin, Y. Graphene and graphene oxide: Biofunctionalization and applications in biotechnology. Trends Biotechnol. 2011, 29, 205–212. [Google Scholar] [CrossRef] [PubMed]
- Zhang, Y.; Zhang, L.; Zhou, C. Review of chemical vapor deposition of graphene and related applications. Acc. Chem. Res. 2013, 46, 2329–2339. [Google Scholar] [CrossRef] [PubMed]
- Yi, M.; Shen, Z. A review on mechanical exfoliation for the scalable production of graphene. J. Mater. Chem. A 2015, 3, 11700–11715. [Google Scholar] [CrossRef]
- Son, M.; Ham, M.-H. Low-temperature synthesis of graphene by chemical vapor deposition and its applications. FlatChem 2017, 5, 40–49. [Google Scholar] [CrossRef]
- Rezvani, E.; Hatamie, A.; Berahman, M.; Simchi, M.; Angizi, S.; Rahmati, R.; Kennedy, J.; Simchi, A. Synthesis, First-Principle Simulation, and Application of Three-Dimensional Ceria Nanoparticles/Graphene Nanocomposite for Non-Enzymatic Hydrogen Peroxide Detection. J. Electrochem. Soc. 2019, 166, H3167–H3174. [Google Scholar] [CrossRef]
- Habib, M.R.; Liang, T.; Yu, X.; Pi, X.; Liu, Y.; Xu, M. A review of theoretical study of graphene chemical vapor deposition synthesis on metals: Nucleation, growth, and the role of hydrogen and oxygen. Rep. Prog. Phys. 2018, 81, 036501. [Google Scholar] [CrossRef]
- Sun, R.; Li, L.; Feng, C.; Kitipornchai, S.; Yang, J. Tensile property enhancement of defective graphene/epoxy nanocomposite by hydrogen functionalization. Compos. Struct. 2019, 224, 111079. [Google Scholar] [CrossRef]
- Dhand, C.; Dwivedi, N.; Loh, X.J.; Ying, A.N.J.; Verma, N.K.; Beuerman, R.W.; Lakshminarayanan, R.; Ramakrishna, S. Methods and strategies for the synthesis of diverse nanoparticles and their applications: A comprehensive overview. Rsc Adv. 2015, 5, 105003–105037. [Google Scholar] [CrossRef]
- Guo, H.; Lv, R.; Bai, S. Recent advances on 3D printing graphene-based composites. Nano Mater. Sci. 2019, 1, 101–115. [Google Scholar] [CrossRef]
- Pal, N.; Dubey, P.; Gopinath, P.; Pal, K. Combined effect of cellulose nanocrystal and reduced graphene oxide into poly-lactic acid matrix nanocomposite as a scaffold and its anti-bacterial activity. Int. J. Biol. Macromol. 2017, 95, 94–105. [Google Scholar] [CrossRef] [PubMed]
- Cui, Y.; Kundalwal, S.; Kumar, S. Gas barrier performance of graphene/polymer nanocomposites. Carbon 2016, 98, 313–333. [Google Scholar] [CrossRef]
- Huang, H.-D.; Ren, P.-G.; Xu, J.-Z.; Xu, L.; Zhong, G.-J.; Hsiao, B.S.; Li, Z.-M. Improved barrier properties of poly (lactic acid) with randomly dispersed graphene oxide nanosheets. J. Membr. Sci. 2014, 464, 110–118. [Google Scholar] [CrossRef]
- Liu, J.; Yan, H.; Jiang, K. Mechanical properties of graphene platelet-reinforced alumina ceramic composites. Ceram. Int. 2013, 39, 6215–6221. [Google Scholar] [CrossRef]
- Fan, Y.; Wang, L.; Li, J.; Li, J.; Sun, S.; Chen, F.; Chen, L.; Jiang, W. Preparation and electrical properties of graphene nanosheet/Al2O3 composites. Carbon 2010, 48, 1743–1749. [Google Scholar] [CrossRef]
- Barfmal, M.; Montazeri, A. MD-based design of SiC/graphene nanocomposites towards better mechanical performance. Ceram. Int. 2017, 43, 17167–17173. [Google Scholar] [CrossRef]
- Sheinerman, A.; Gutkin, M.Y. Multiple cracking in deformed laminated metal-graphene composites. Compos. Struct. 2018, 191, 113–118. [Google Scholar] [CrossRef]
- Nieto, A.; Bisht, A.; Lahiri, D.; Zhang, C.; Agarwal, A. Graphene reinforced metal and ceramic matrix composites: A review. Int. Mater. Rev. 2017, 62, 241–302. [Google Scholar] [CrossRef]
- Rashad, M.; Pan, F.S.; Asif, M.; Ullah, A. Improved mechanical properties of magnesium–graphene composites with copper–graphene hybrids. Mater. Sci. Technol. 2015, 31, 1452–1461. [Google Scholar] [CrossRef]
- Rashad, M.; Pan, F.; Tang, A.; Asif, M. Effect of graphene nanoplatelets addition on mechanical properties of pure aluminum using a semi-powder method. Prog. Nat. Sci. Mater. Int. 2014, 24, 101–108. [Google Scholar] [CrossRef]
- Simões, S.; Viana, F.; Reis, M.A.; Vieira, M.F. Improved dispersion of carbon nanotubes in aluminum nanocomposites. Compos. Struct. 2014, 108, 992–1000. [Google Scholar] [CrossRef]
- Surappa, M. Aluminium matrix composites: Challenges and opportunities. Sadhana 2003, 28, 319–334. [Google Scholar] [CrossRef]
- Rashad, M.; Pan, F.; Yu, Z.; Asif, M.; Lin, H.; Pan, R. Investigation on microstructural, mechanical and electrochemical properties of aluminum composites reinforced with graphene nanoplatelets. Prog. Nat. Sci. Mater. Int. 2015, 25, 460–470. [Google Scholar] [CrossRef] [Green Version]
- Zare, H.; Jahedi, M.; Toroghinejad, M.R.; Meratian, M.; Knezevic, M. Compressive, shear, and fracture behavior of CNT reinforced Al matrix composites manufactured by severe plastic deformation. Mater. Des. 2016, 106, 112–119. [Google Scholar] [CrossRef] [Green Version]
- Li, G.; Xiong, B. Effects of graphene content on microstructures and tensile property of graphene-nanosheets/aluminum composites. J. Alloy. Compd. 2017, 697, 31–36. [Google Scholar] [CrossRef]
- Saboori, A.; Pavese, M.; Badini, C.; Fino, P. Microstructure and thermal conductivity of Al–Graphene composites fabricated by powder metallurgy and hot rolling techniques. Acta Metall. Sin. (Engl. Lett.) 2017, 30, 675–687. [Google Scholar] [CrossRef]
- Estrin, Y.; Vinogradov, A. Extreme grain refinement by severe plastic deformation: A wealth of challenging science. Acta Mater. 2013, 61, 782–817. [Google Scholar] [CrossRef]
- Esmaeili, A.; Shaeri, M.H.; Noghani, M.T.; Razaghian, A. Fatigue behavior of AA7075 aluminium alloy severely deformed by equal channel angular pressing. J. Alloy. Compd. 2018, 757, 324–332. [Google Scholar] [CrossRef]
- Jahedi, M.; Paydar, M.H. Study on the feasibility of the torsion extrusion (TE) process as a severe plastic deformation method for consolidation of Al powder. Mater. Sci. Eng. A 2010, 527, 5273–5279. [Google Scholar] [CrossRef]
- Ebrahimi, S.S.; Dehghani, K.; Aghazadeh, J.; Ghasemian, M.; Zangeneh, S. Investigation on microstructure and mechanical properties of Al/Al-Zn-Mg–Cu laminated composite fabricated by accumulative roll bonding (ARB) process. Mater. Sci. Eng. A 2018, 718, 311–320. [Google Scholar] [CrossRef]
- Ansarian, I.; Shaeri, M.; Ebrahimi, M.; Minárik, P.; Bartha, K. Microstructure evolution and mechanical behaviour of severely deformed pure titanium through multi directional forging. J. Alloy. Compd. 2019, 776, 83–95. [Google Scholar] [CrossRef]
- Chinh, N.Q.; Jenei, P.; Gubicza, J.; Bobruk, E.V.; Valiev, R.Z.; Langdon, T.G. Influence of Zn content on the microstructure and mechanical performance of ultrafine-grained Al–Zn alloys processed by high-pressure torsion. Mater. Lett. 2017, 186, 334–337. [Google Scholar] [CrossRef]
- Zhao, L.; Lu, H.; Gao, Z. Microstructure and mechanical properties of Al/graphene composite produced by high-pressure torsion. Adv. Eng. Mater. 2015, 17, 976–981. [Google Scholar] [CrossRef]
- Valiev, R.Z.; Islamgaliev, R.K.; Alexandrov, I.V. Bulk nanostructured materials from severe plastic deformation. Prog. Mater. Sci. 2000, 45, 103–189. [Google Scholar] [CrossRef]
- Syukron, M.; Ojima, M.; Seman, A.A.; Hussain, Z.; Koseki, T. Mechanical properties of 1.5 wt.% TiB2-added hypoeutectic Al-Mg-Si alloys processed by equal channel angular pressing. Procedia Chem. 2016, 19, 106–112. [Google Scholar] [CrossRef]
- Valiev, R.Z.; Langdon, T.G. Principles of equal-channel angular pressing as a processing tool for grain refinement. Prog. Mater. Sci. 2006, 51, 881–981. [Google Scholar] [CrossRef]
- Shaeri, M.; Salehi, M.; Seyyedein, S.; Abutalebi, M.; Park, J.K. Microstructure and mechanical properties of Al-7075 alloy processed by equal channel angular pressing combined with aging treatment. Mater. Des. 2014, 57, 250–257. [Google Scholar] [CrossRef]
- Afifi, M.A.; Wang, Y.C.; Pereira, P.H.R.; Huang, Y.; Wang, Y.; Cheng, X.; Li, S.; Langdon, T.G. Effect of heat treatments on the microstructures and tensile properties of an ultrafine-grained Al-Zn-Mg alloy processed by ECAP. J. Alloy. Compd. 2018, 749, 567–574. [Google Scholar] [CrossRef] [Green Version]
- Huang, Y.; Bazarnik, P.; Wan, D.; Luo, D.; Pereira, P.H.R.; Lewandowska, M.; Yao, J.; Hayden, B.E.; Langdon, T.G. The fabrication of graphene-reinforced Al-based nanocomposites using high-pressure torsion. Acta Mater. 2019, 164, 499–511. [Google Scholar] [CrossRef]
- Chegini, M.; Shaeri, M.H. Effect of equal channel angular pressing on the mechanical and tribological behavior of Al-Zn-Mg-Cu alloy. Mater. Charact. 2018, 140, 147–161. [Google Scholar] [CrossRef]
- Dashti, A.; Shaeri, M.; Taghiabadi, R.; Djavanroodi, F.; Vali Ghazvini, F.; Javadi, H. Microstructure, Texture, Electrical and Mechanical Properties of AA-6063 Processed by Multi Directional Forging. Materials 2018, 11, 2419. [Google Scholar] [CrossRef] [PubMed]
- Haghighi, M.; Shaeri, M.; Sedghi, A.; Djavanroodi, F. Effect of Graphene Nanosheets Content on Microstructure and Mechanical Properties of Titanium Matrix Composite Produced by Cold Pressing and Sintering. Nanomaterials 2018, 8, 1024. [Google Scholar] [CrossRef] [PubMed]
- Yue, H.; Yao, L.; Gao, X.; Zhang, S.; Guo, E.; Zhang, H.; Lin, X.; Wang, B. Effect of ball-milling and graphene contents on the mechanical properties and fracture mechanisms of graphene nanosheets reinforced copper matrix composites. J. Alloy. Compd. 2017, 691, 755–762. [Google Scholar] [CrossRef]
- Zhang, H.; Xu, C.; Xiao, W.; Ameyama, K.; Ma, C. Enhanced mechanical properties of Al5083 alloy with graphene nanoplates prepared by ball milling and hot extrusion. Mater. Sci. Eng. A 2016, 658, 8–15. [Google Scholar] [CrossRef]
- Pérez-Bustamante, R.; Bolaños-Morales, D.; Bonilla-Martínez, J.; Estrada-Guel, I.; Martínez-Sánchez, R. Microstructural and hardness behavior of graphene-nanoplatelets/aluminum composites synthesized by mechanical alloying. J. Alloy. Compd. 2014, 615, S578–S582. [Google Scholar] [CrossRef]
- Ferrari, A.C. Raman spectroscopy of graphene and graphite: Disorder, electron–phonon coupling, doping and nonadiabatic effects. Solid State Commun. 2007, 143, 47–57. [Google Scholar] [CrossRef]
- Wu, J.B.; Lin, M.L.; Cong, X.; Liu, H.N.; Tan, P.H. Raman spectroscopy of graphene-based materials and its applications in related devices. Chem. Soc. Rev. 2018, 47, 1822–1873. [Google Scholar] [CrossRef] [Green Version]
- Xing, T.; Li, L.H.; Hou, L.; Hu, X.; Zhou, S.; Peter, R.; Petravic, M.; Chen, Y. Disorder in ball-milled graphite revealed by Raman spectroscopy. Carbon 2013, 57, 515–519. [Google Scholar] [CrossRef]
- Jeon, I.-Y.; Choi, H.-J.; Jung, S.-M.; Seo, J.-M.; Kim, M.-J.; Dai, L.; Baek, J.-B. Large-scale production of edge-selectively functionalized graphene nanoplatelets via ball milling and their use as metal-free electrocatalysts for oxygen reduction reaction. J. Am. Chem. Soc. 2012, 135, 1386–1393. [Google Scholar] [CrossRef] [PubMed]
- Arao, Y.; Tanks, J.; Aida, K.; Kubouchi, M. Mechanochemical reaction using weak acid salts enables dispersion and exfoliation of nanomaterials in polar solvents. J. Mater. Sci. 2019, 54, 4546–4558. [Google Scholar] [CrossRef]
- Mahmoud, A.E.D.; Stolle, A.; Stelter, M. Sustainable synthesis of high-surface-area graphite oxide via dry ball milling. ACS Sustain. Chem. Eng. 2018, 6, 6358–6369. [Google Scholar] [CrossRef]
- Dash, P.; Dash, T.; Rout, T.K.; Sahu, A.K.; Biswal, S.K.; Mishra, B.K. Preparation of graphene oxide by dry planetary ball milling process from natural graphite. RSC Adv. 2016, 6, 12657–12668. [Google Scholar] [CrossRef]
- Kumar, P.; Harivignesh, J. Grain Refinement Through Design Modification of ECAP Dies. Int. J. Mech. Prod. Eng. Res. Dev. 2018, 8, 35–42. [Google Scholar]
- Kumar, S.; Ostrikov, K.K. Unidirectional arrays of vertically standing graphenes in reactive plasmas. Nanoscale 2011, 3, 4296–4300. [Google Scholar] [CrossRef] [Green Version]
- Zare, H.; Jahedi, M.; Toroghinejad, M.R.; Meratian, M.; Knezevic, M. Microstructure and mechanical properties of carbon nanotubes reinforced aluminum matrix composites synthesized via equal-channel angular pressing. Mater. Sci. Eng. A 2016, 670, 205–216. [Google Scholar] [CrossRef] [Green Version]
- Du, X.; Chen, R.; Liu, F. Investigation of Graphene Nanosheets Reinforced Aluminum Matrix Composites. Dig. J. Nanomater. Biostruct. (DJNB) 2017, 12, 37–45. [Google Scholar]
- Bisht, A.; Srivastava, M.; Kumar, R.M.; Lahiri, I.; Lahiri, D. Strengthening mechanism in graphene nanoplatelets reinforced aluminum composite fabricated through spark plasma sintering. Mater. Sci. Eng. A 2017, 695, 20–28. [Google Scholar] [CrossRef]
- Ibrahim, I.; Mohamed, F.; Lavernia, E. Particulate reinforced metal matrix composites—A review. J. Mater. Sci. 1991, 26, 1137–1156. [Google Scholar] [CrossRef]
- Boostani, A.F.; Yazdani, S.; Mousavian, R.T.; Tahamtan, S.; Khosroshahi, R.A.; Wei, D.; Brabazon, D.; Xu, J.; Zhang, X.; Jiang, Z. Strengthening mechanisms of graphene sheets in aluminium matrix nanocomposites. Mater. Des. 2015, 88, 983–989. [Google Scholar] [CrossRef] [Green Version]
- Bastwros, M.; Kim, G.-Y.; Zhu, C.; Zhang, K.; Wang, S.; Tang, X.; Wang, X. Effect of ball milling on graphene reinforced Al6061 composite fabricated by semi-solid sintering. Compos. Part B Eng. 2014, 60, 111–118. [Google Scholar] [CrossRef]
- Mishra, R.K.; Gupta, A.K.; Rao, P.R.; Sachdev, A.K.; Kumar, A.M.; Luo, A.A. Influence of cerium on texture and ductility of magnesium extrusions. Scr. Mater. 2008, 59, 562–565. [Google Scholar] [CrossRef]
- Von Mises, R. Göttingen Nachrichten, Math. Phys. Klasse 1913, 1, 582–592. [Google Scholar]


| - | Pure GNSs | Al-0.25 GNSs | Al-0.25 GNSs Bulk | Al-0.5 GNSs | Al-1 GNSs |
|---|---|---|---|---|---|
| RSGP | 1571.235 | 1590.780 | 1591.899 | 1590.780 | 1590.780 |
| ID/IG | 0.3033 | 0.6765 | 0.864 | 0.722 | 0.960 |
| Sample | Hardness (HV) | Density (Top) | Density (Bottom) | |||||
|---|---|---|---|---|---|---|---|---|
| - | Top | Bottom | Theo. | Exp. | Per. (%) | Theo. | Exp. | Per. (%) |
| Pure Al | 81 2 | 79 1 | 2.700 | 2.69 0.07 | 99.62 | 2.700 | 2.69 0.04 | 99.62 |
| Al-0.1 wt.% GNSs | 98 1 | 89 2 | 2.699 | 2.69 0.05 | 99.66 | 2.699 | 2.67 0.08 | 98.92 |
| Al-0.25 wt.% GNSs | 129 5 | 120 3 | 2.698 | 2.68 0.09 | 99.33 | 2.698 | 2.65 0.05 | 98.22 |
| Al-0.5 wt.% GNSs | 122 2 | 116 3 | 2.697 | 2.67 0.03 | 98.99 | 2.697 | 2.62 0.02 | 97.14 |
| Al-1 wt.% GNSs | 106 3 | 95 4 | 2.694 | 2.58 0.06 | 95.75 | 2.694 | 2.55 0.04 | 94.65 |
| Sample | Shear Yield Strength (MPa) | Ultimate Shear Strength (MPa) | Uniform Normal Displacement (mm/mm) | Uniform Plastic Normal Displacement (mm/mm) |
|---|---|---|---|---|
| Pure Al | 64 2 | 73 3 | 0.32 0.02 | 0.16 0.01 |
| Al-0.1 wt.% GNSs | 85 1 | 119 1 | 0.40 0.03 | 0.17 0.01 |
| Al-0.25 wt.% GNSs | 124 3 | 158 2 | 0.44 0.01 | 0.14 0.03 |
| Al-0.5 wt.% GNSs | 105 4 | 151 3 | 0.42 0.02 | 0.13 0.02 |
| Al-1 wt.% GNSs | 98 5 | 127 4 | 0.32 0.04 | 0.10 0.03 |
© 2019 by the authors. Licensee MDPI, Basel, Switzerland. This article is an open access article distributed under the terms and conditions of the Creative Commons Attribution (CC BY) license (http://creativecommons.org/licenses/by/4.0/).
Share and Cite
Hasanzadeh Azar, M.; Sadri, B.; Nemati, A.; Angizi, S.; Shaeri, M.H.; Minárik, P.; Veselý, J.; Djavanroodi, F. Investigating the Microstructure and Mechanical Properties of Aluminum-Matrix Reinforced-Graphene Nanosheet Composites Fabricated by Mechanical Milling and Equal-Channel Angular Pressing. Nanomaterials 2019, 9, 1070. https://doi.org/10.3390/nano9081070
Hasanzadeh Azar M, Sadri B, Nemati A, Angizi S, Shaeri MH, Minárik P, Veselý J, Djavanroodi F. Investigating the Microstructure and Mechanical Properties of Aluminum-Matrix Reinforced-Graphene Nanosheet Composites Fabricated by Mechanical Milling and Equal-Channel Angular Pressing. Nanomaterials. 2019; 9(8):1070. https://doi.org/10.3390/nano9081070
Chicago/Turabian StyleHasanzadeh Azar, Mahdi, Bahareh Sadri, Alireza Nemati, Shayan Angizi, Mohammad Hossein Shaeri, Peter Minárik, Jozef Veselý, and Faramarz Djavanroodi. 2019. "Investigating the Microstructure and Mechanical Properties of Aluminum-Matrix Reinforced-Graphene Nanosheet Composites Fabricated by Mechanical Milling and Equal-Channel Angular Pressing" Nanomaterials 9, no. 8: 1070. https://doi.org/10.3390/nano9081070