Functionalized Cellulose Nanocrystal Nanocomposite Membranes with Controlled Interfacial Transport for Improved Reverse Osmosis Performance

 , and
, and
Abstract
:
1. Introduction
2. Materials and Methods
2.1. Preparation of Nanocellulose
2.1.1. TEMPO Oxidation and Characterization of CNCs
2.1.2. Nanocellulose Stock Solution Preparation
2.2. Membrane Fabrication
2.2.1. Support Pretreatment
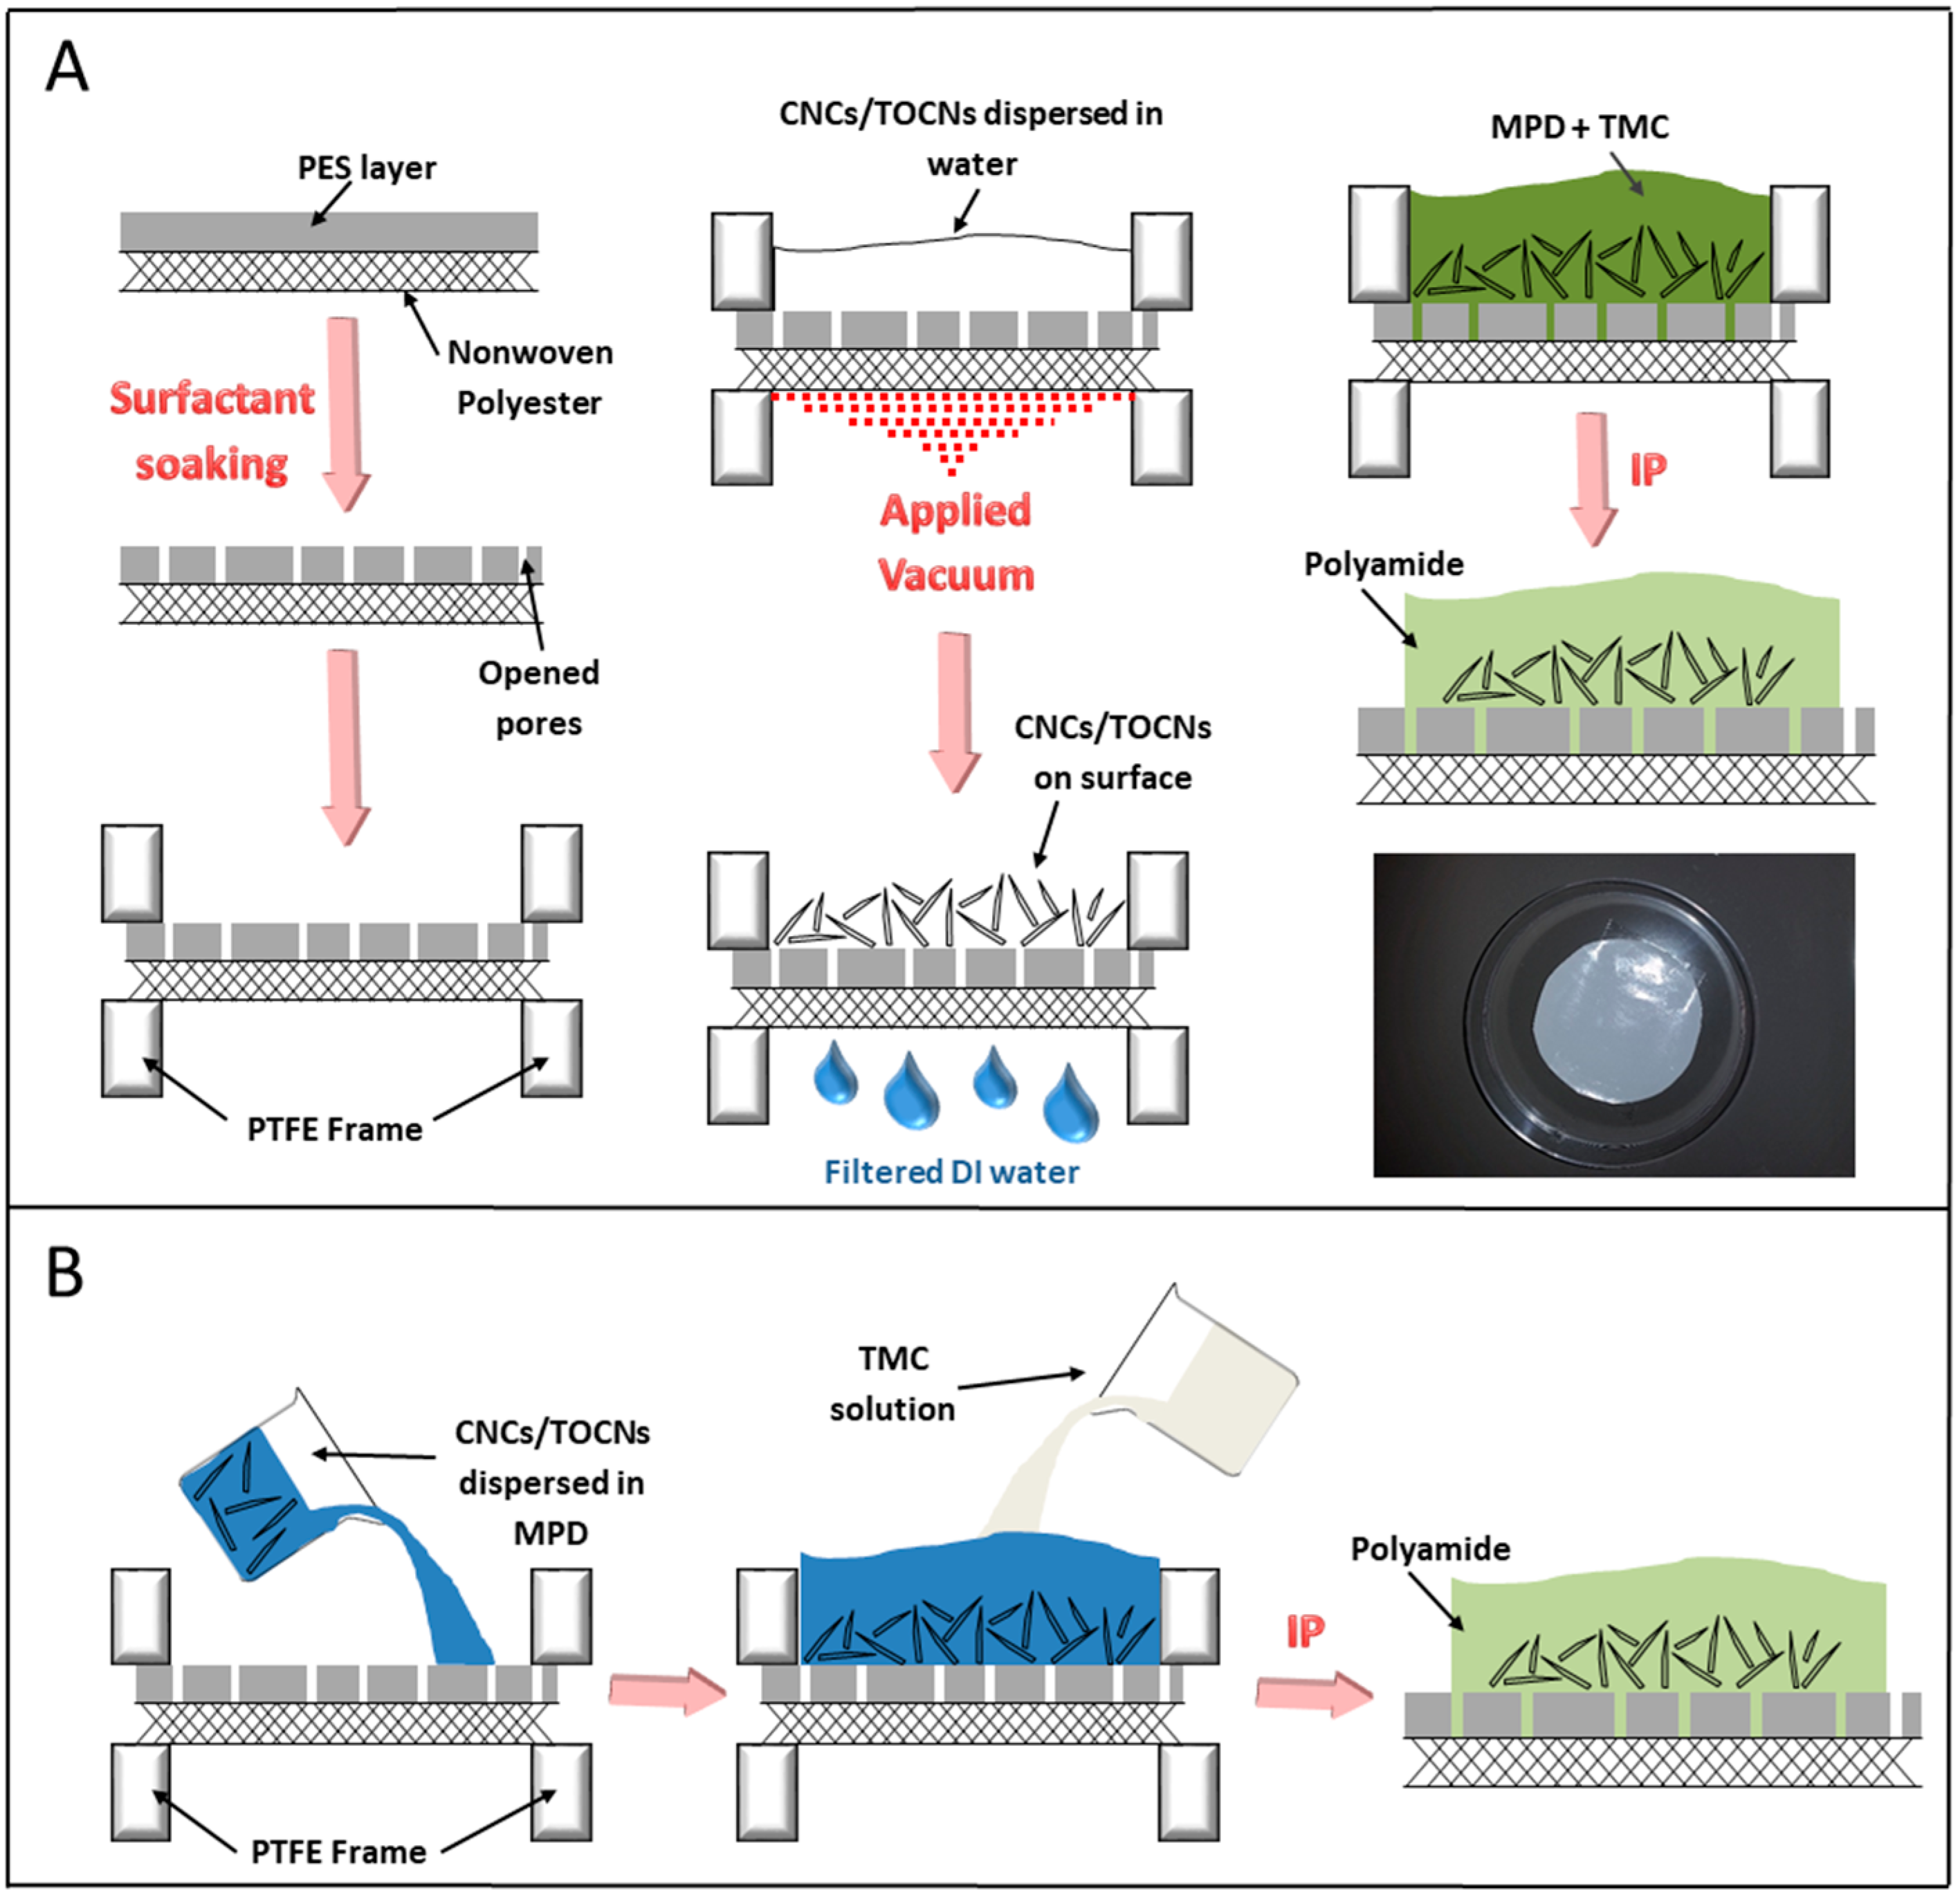
2.2.2. Vacuum Filtration Fabrication Method
2.2.3. Monomer Dispersion Fabrication Method
2.3. Characterization
2.3.1. ATR-FTIR
2.3.2. AFM Imaging and Surface Roughness
2.3.3. TEM
2.4. Membrane Permeation Evaluation
3. Results
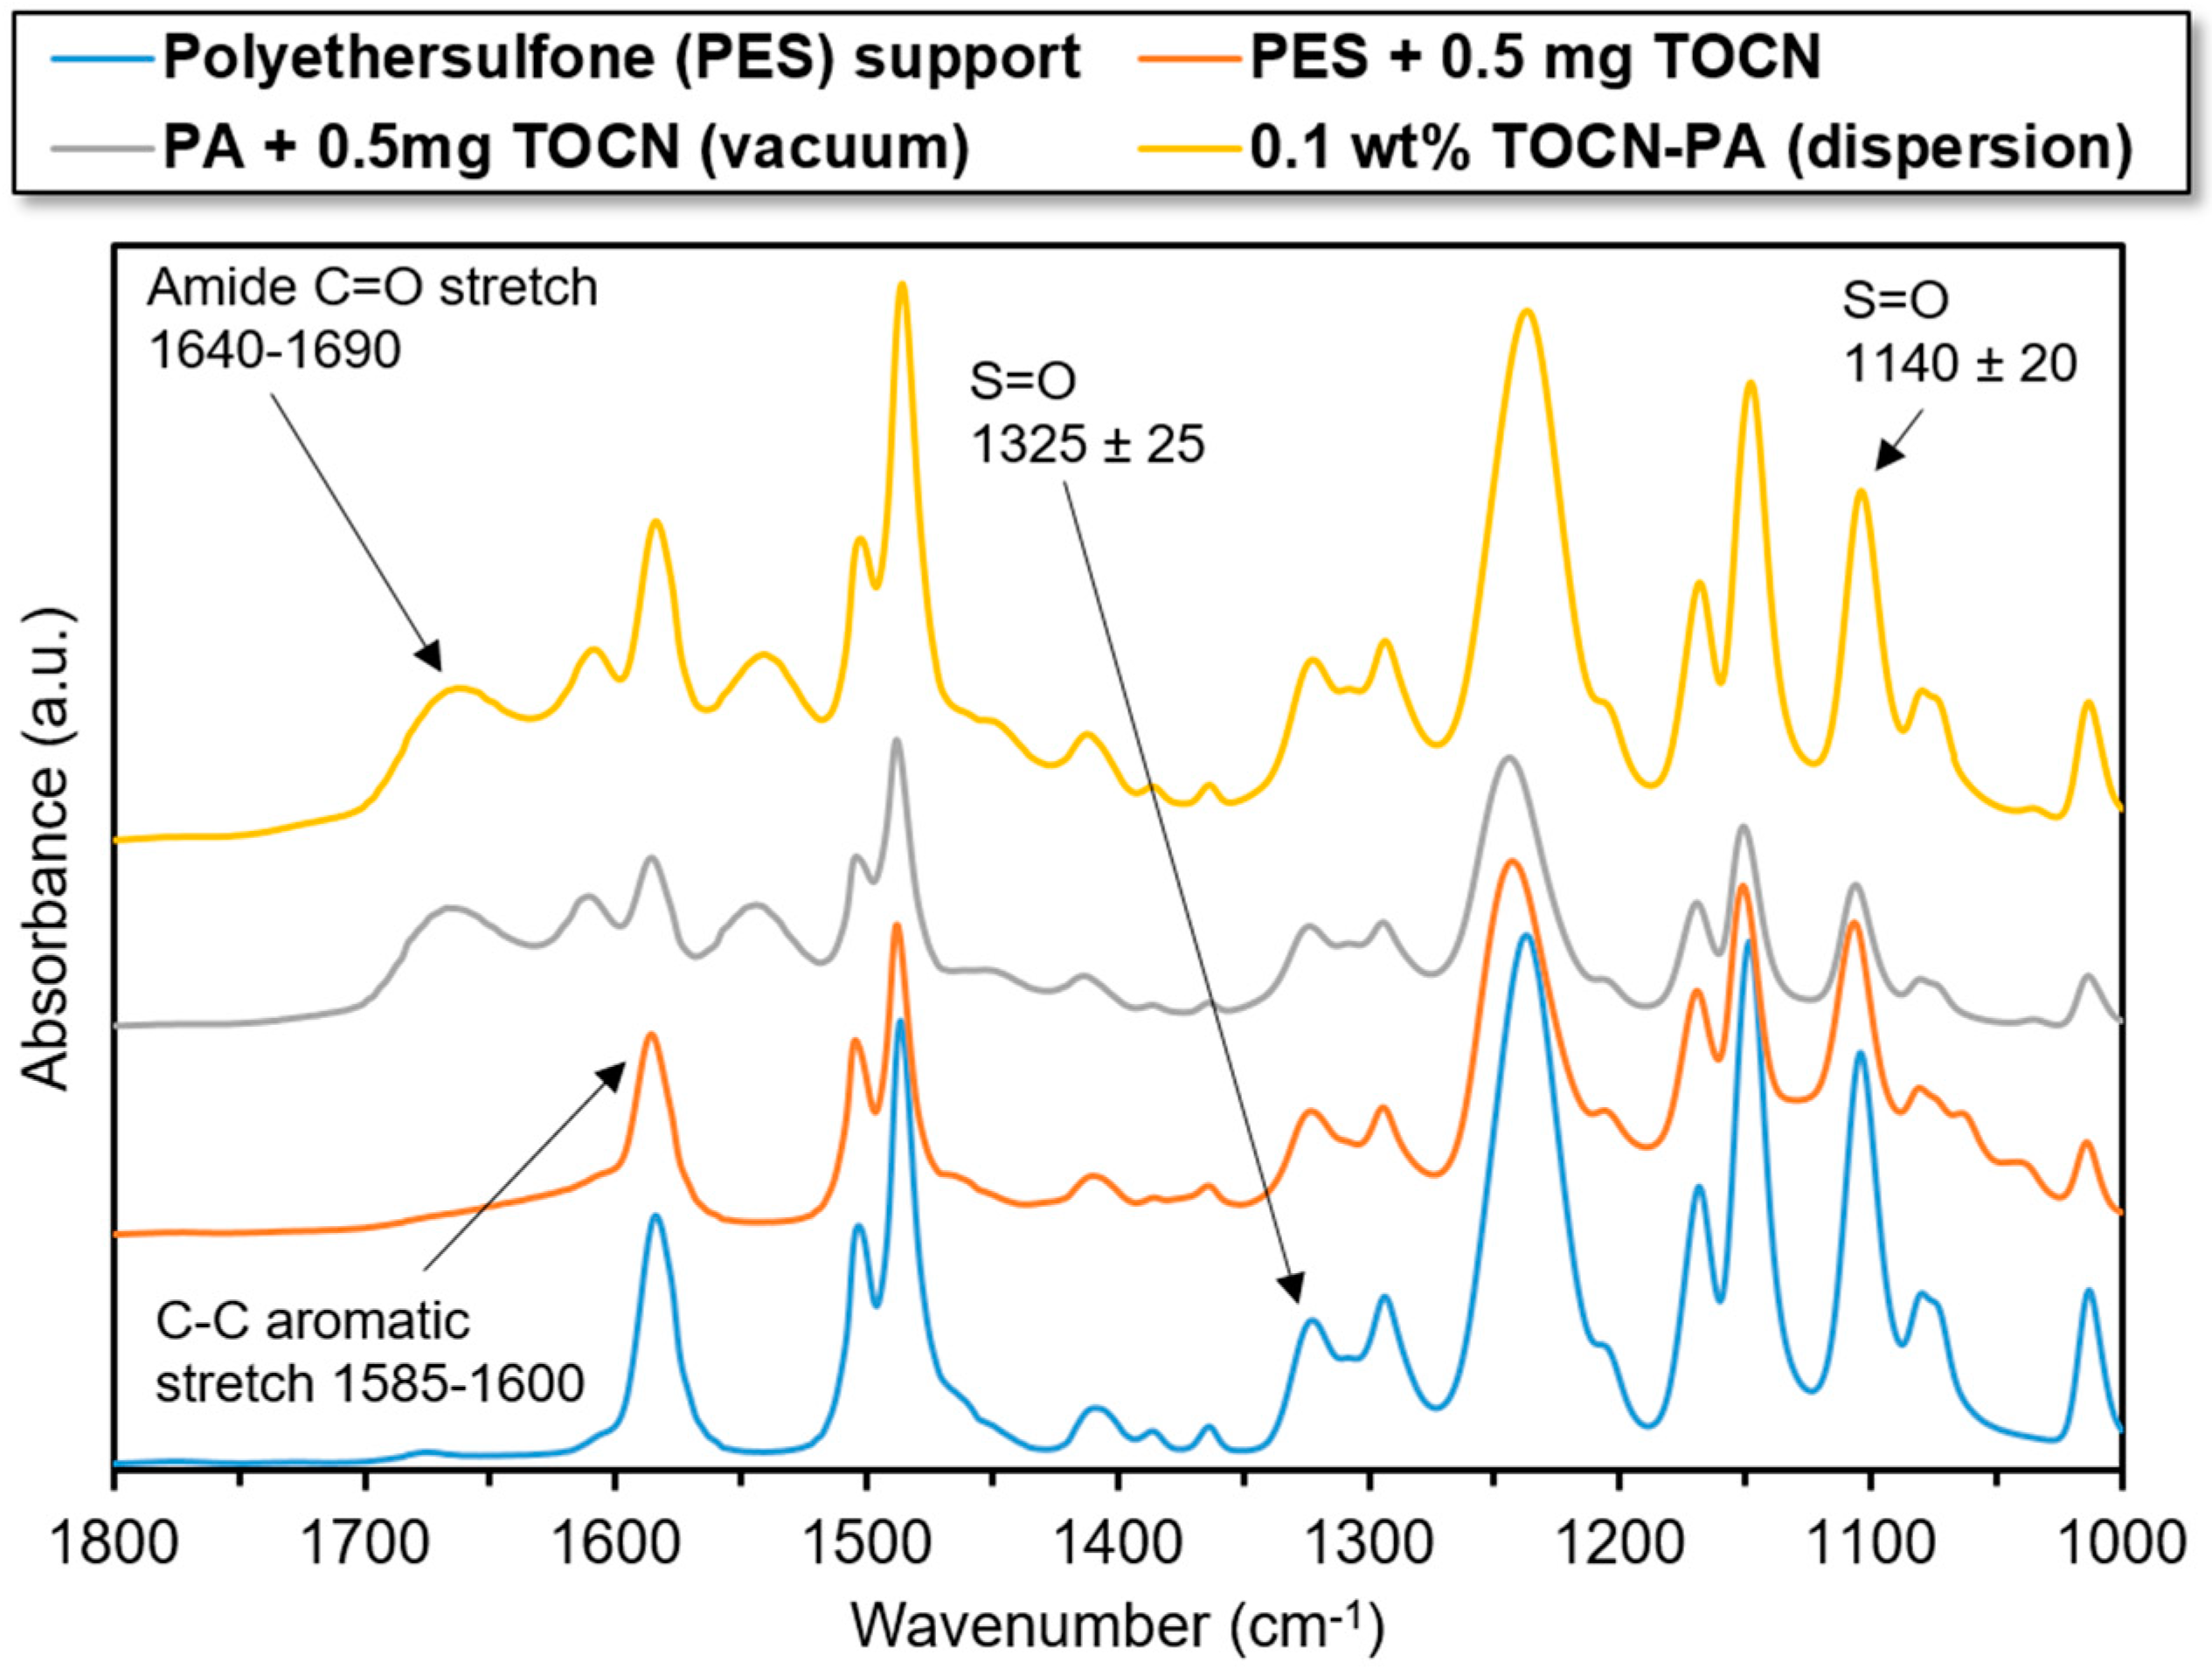
3.1. ATR-FTIR
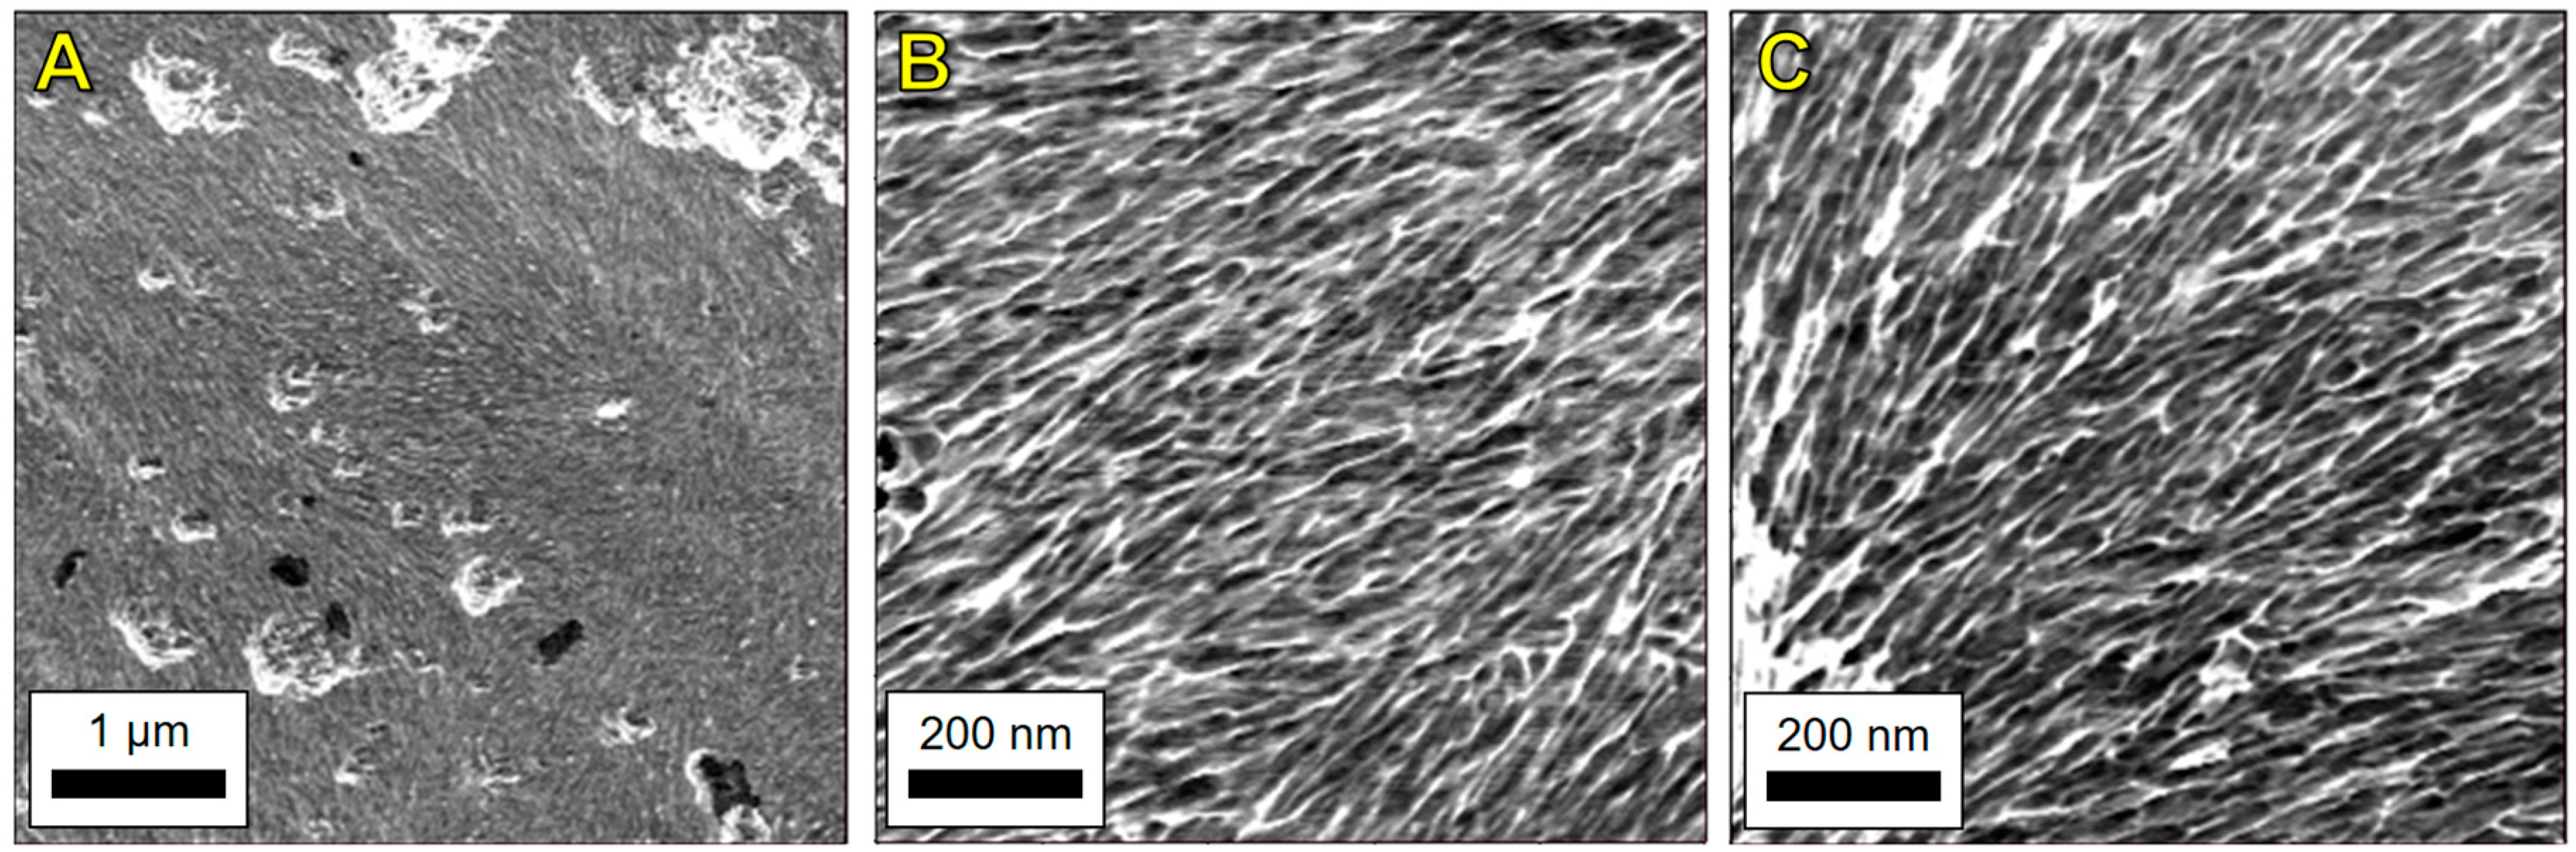
3.2. TEM
3.2.1. Size of TEMPO-Oxidized Cellulose Nanocrystals
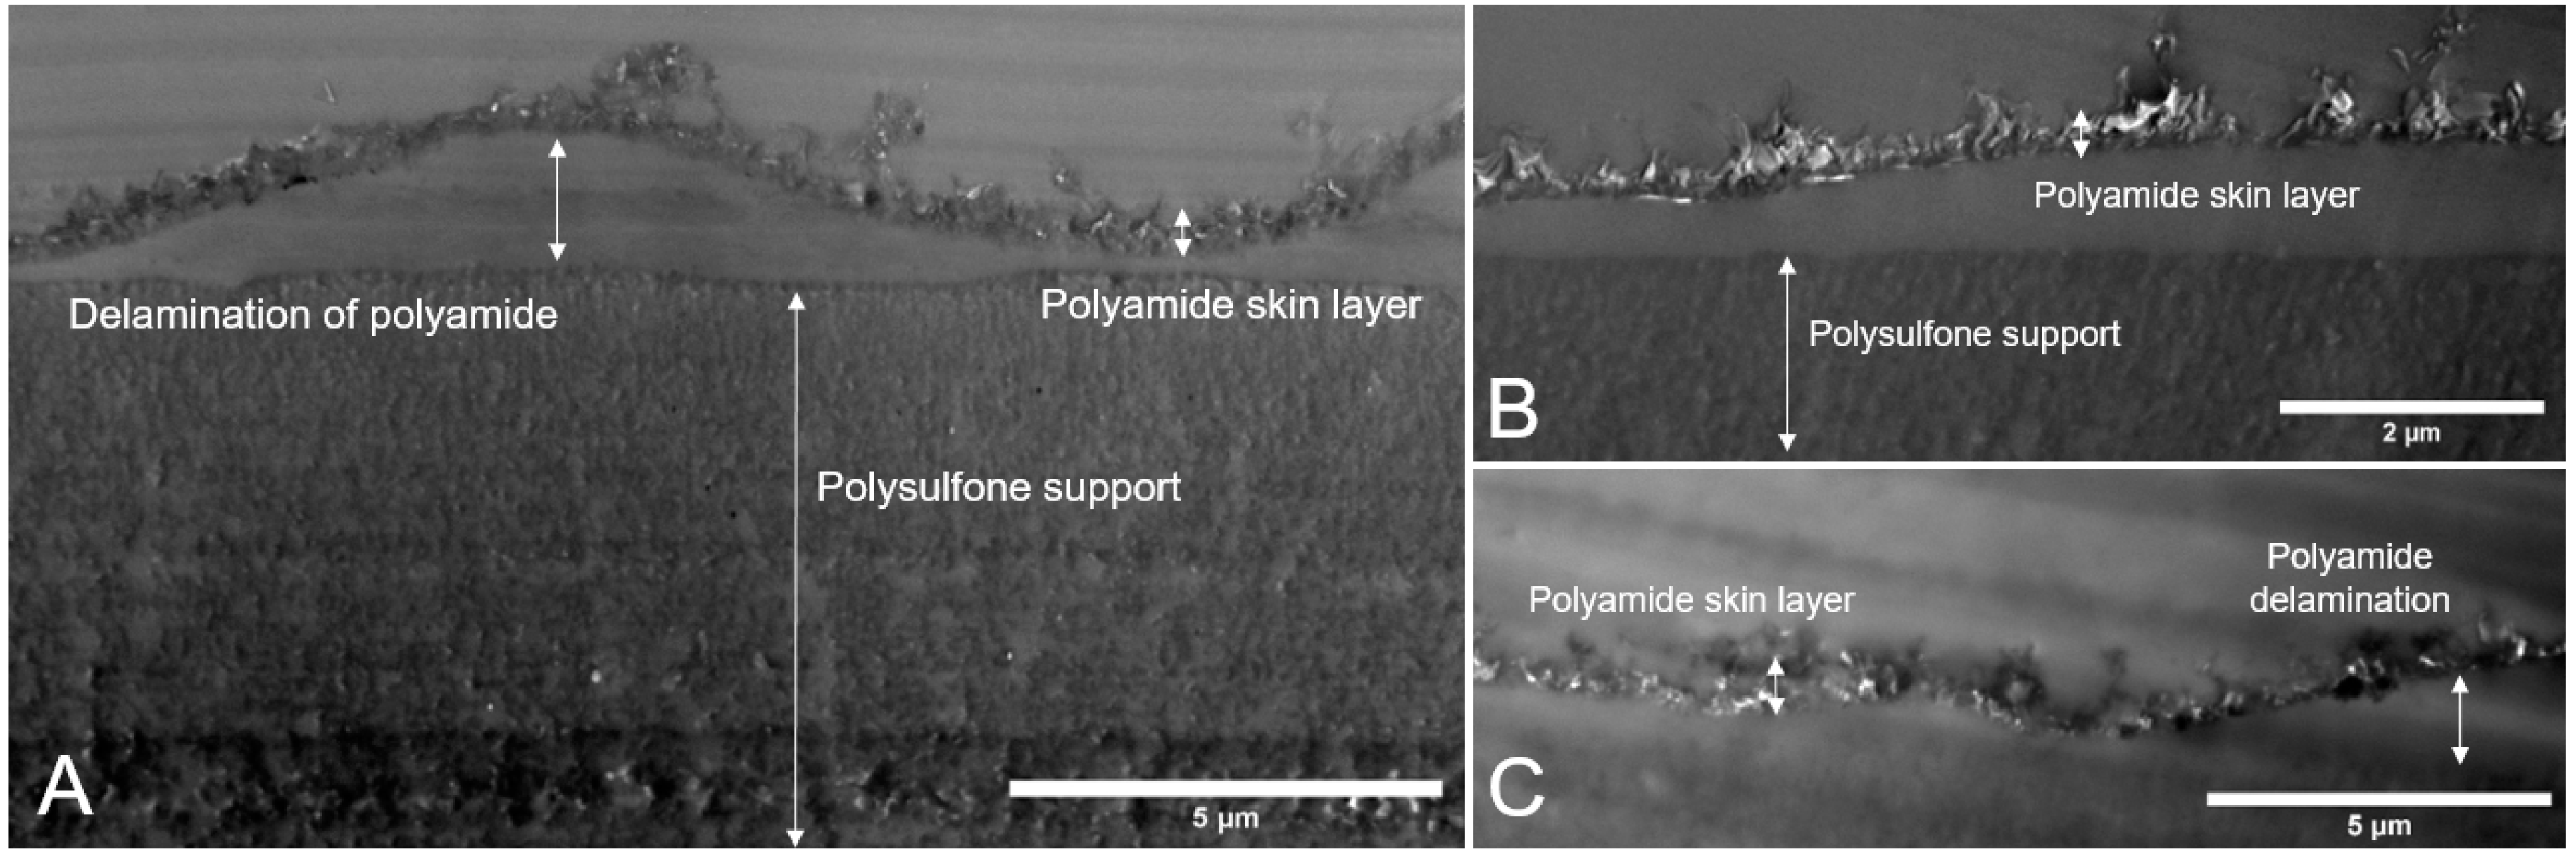
3.2.2. Membrane Cross-Sections
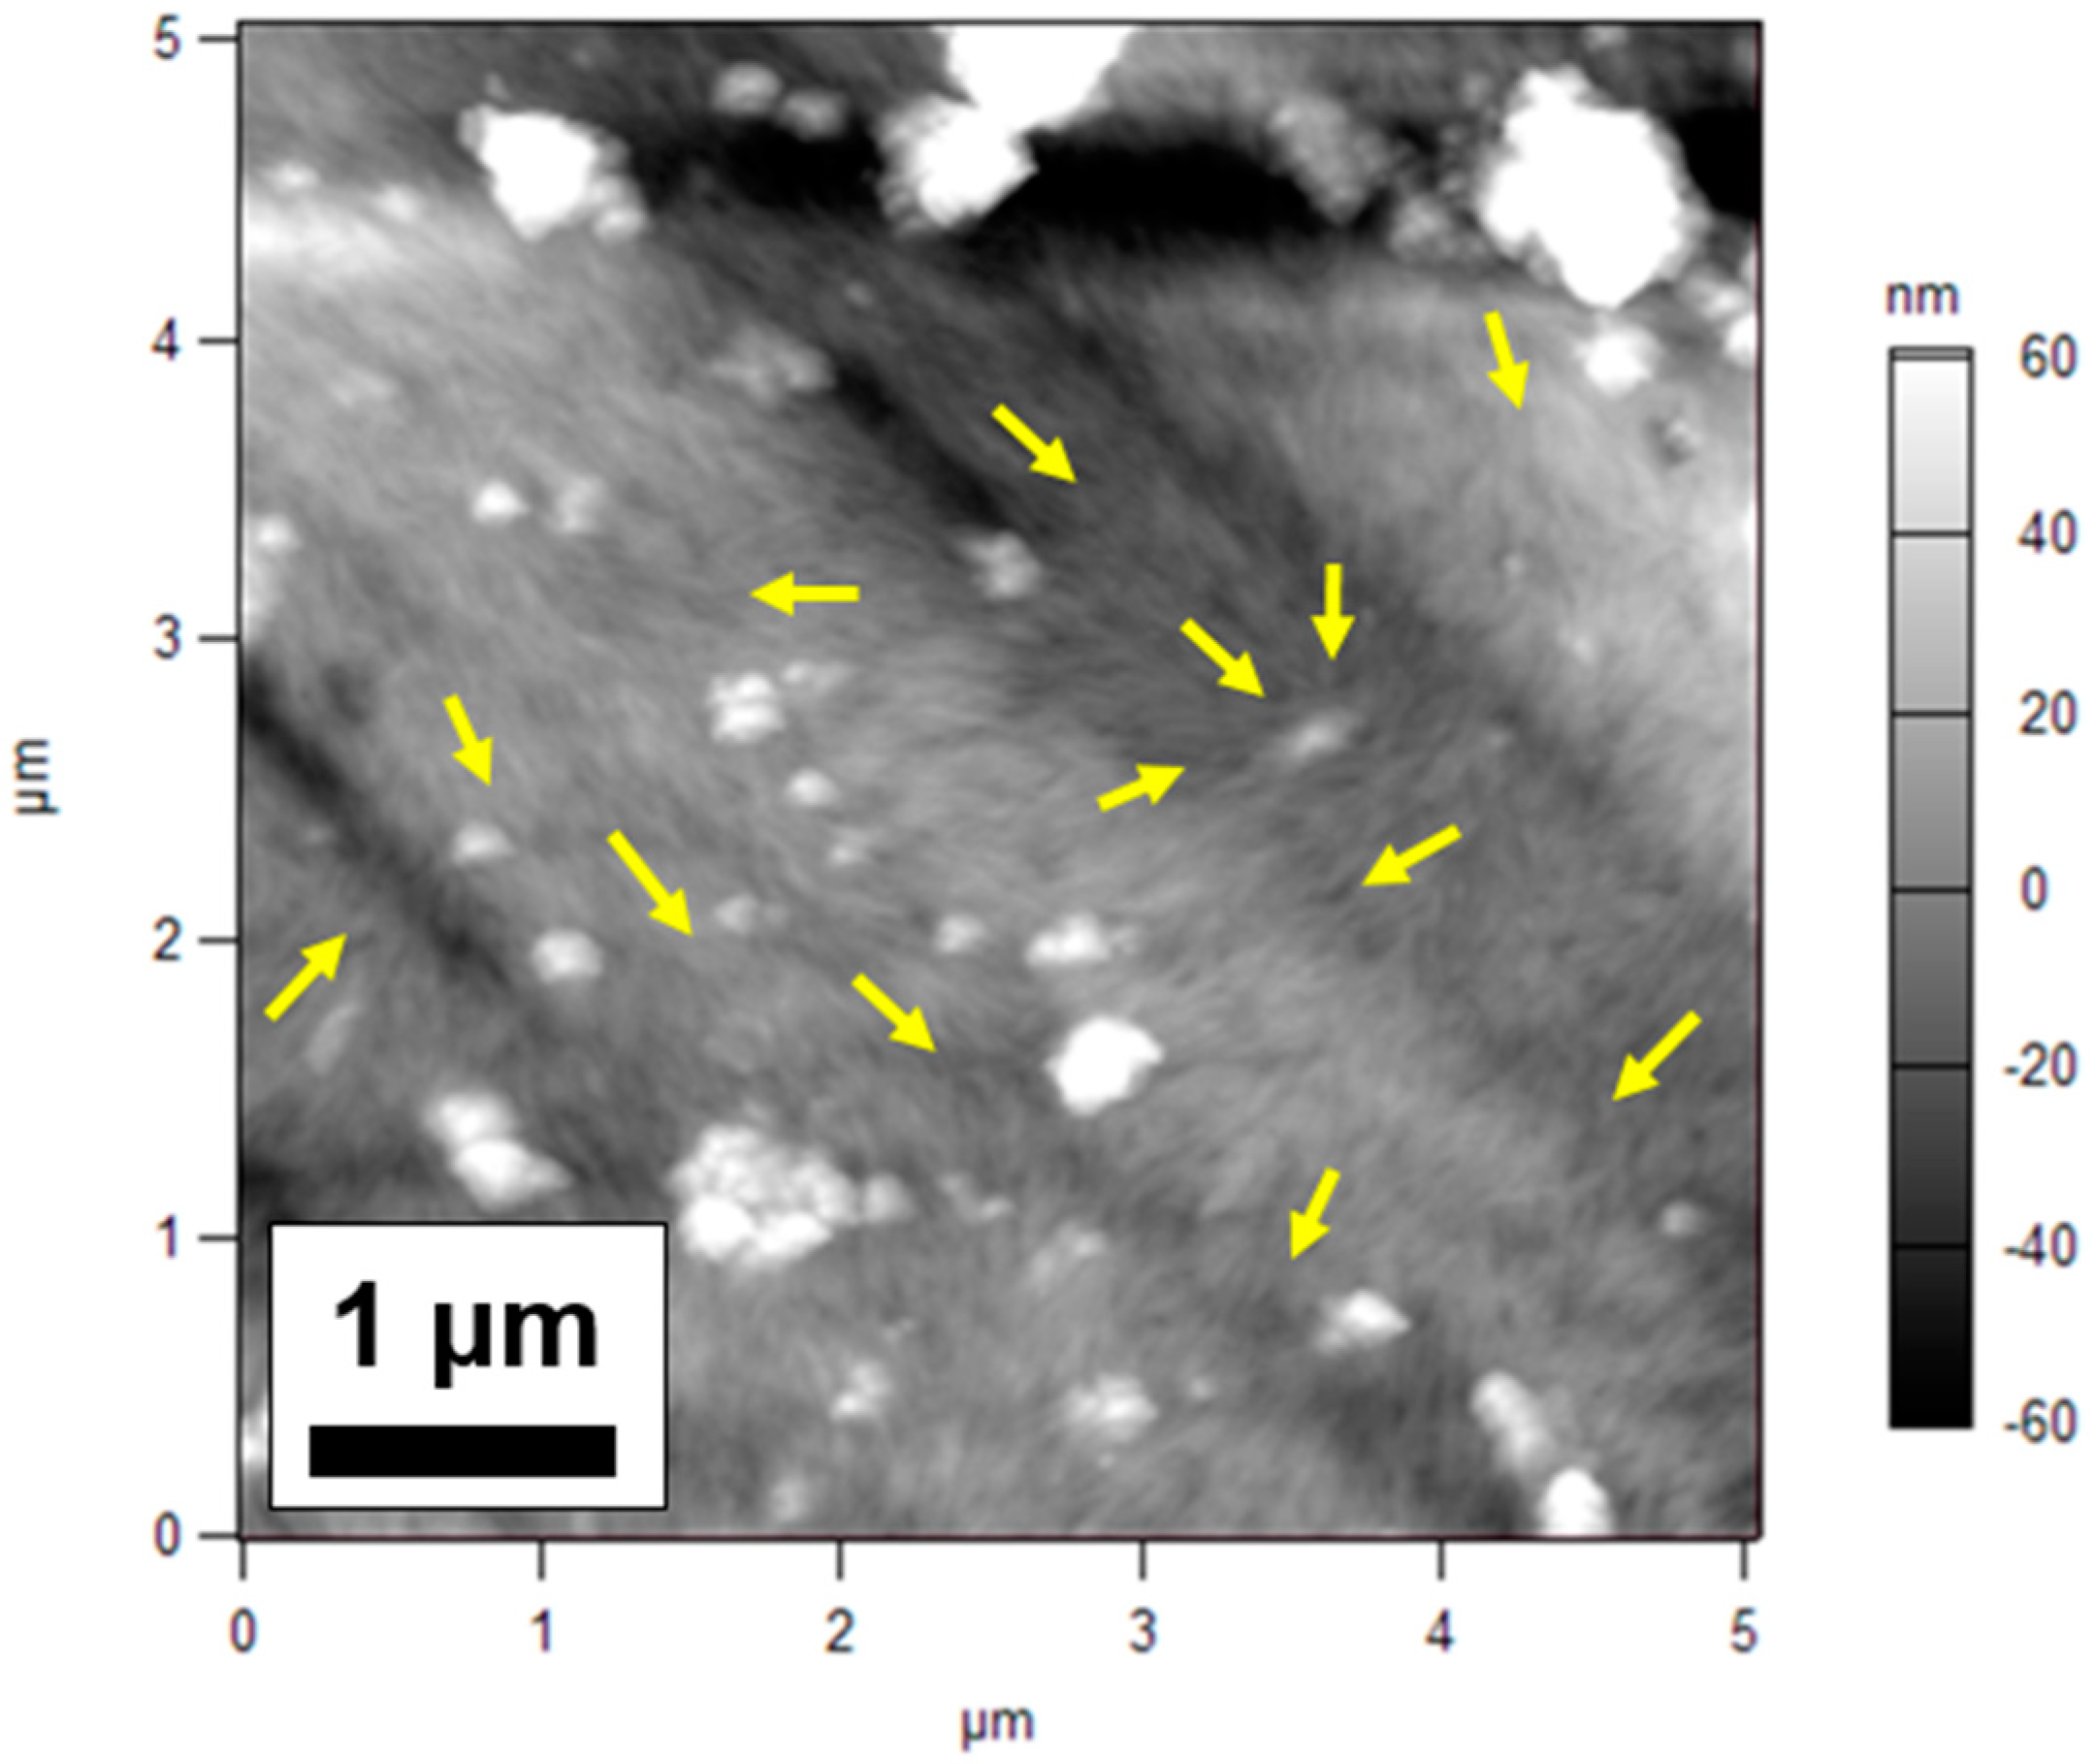
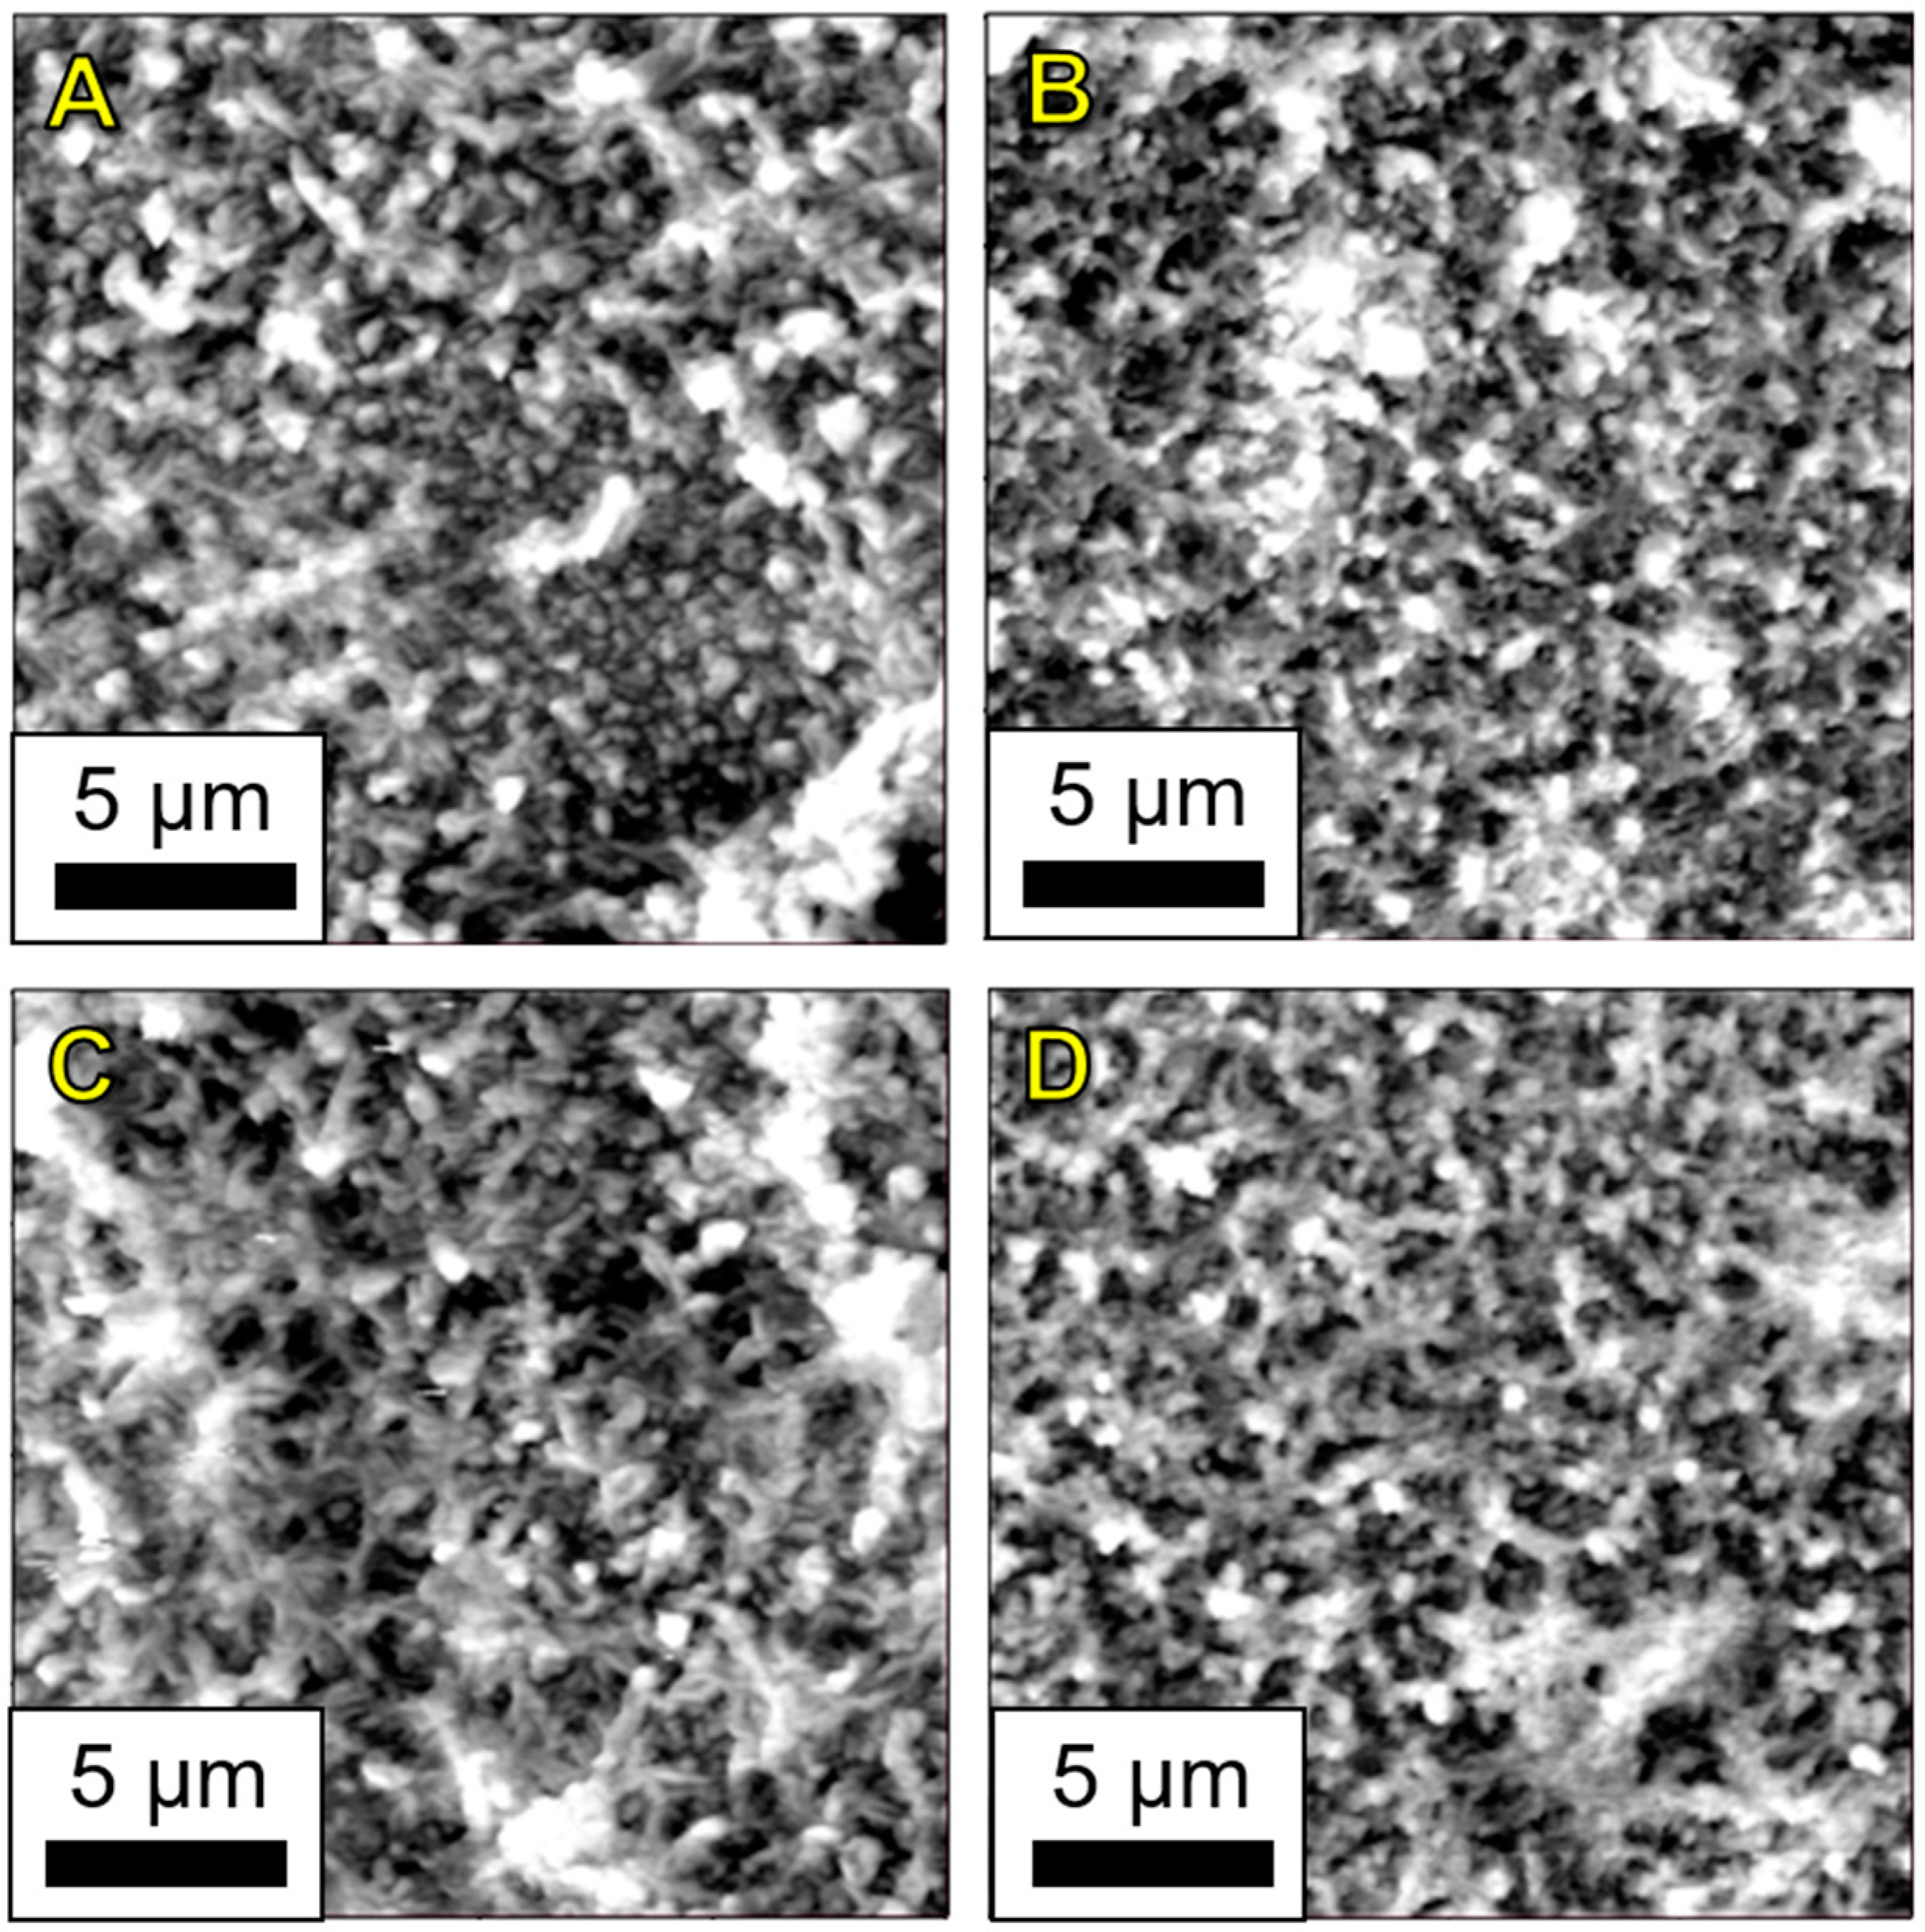
3.3. Atomic Force Microscopy (AFM)
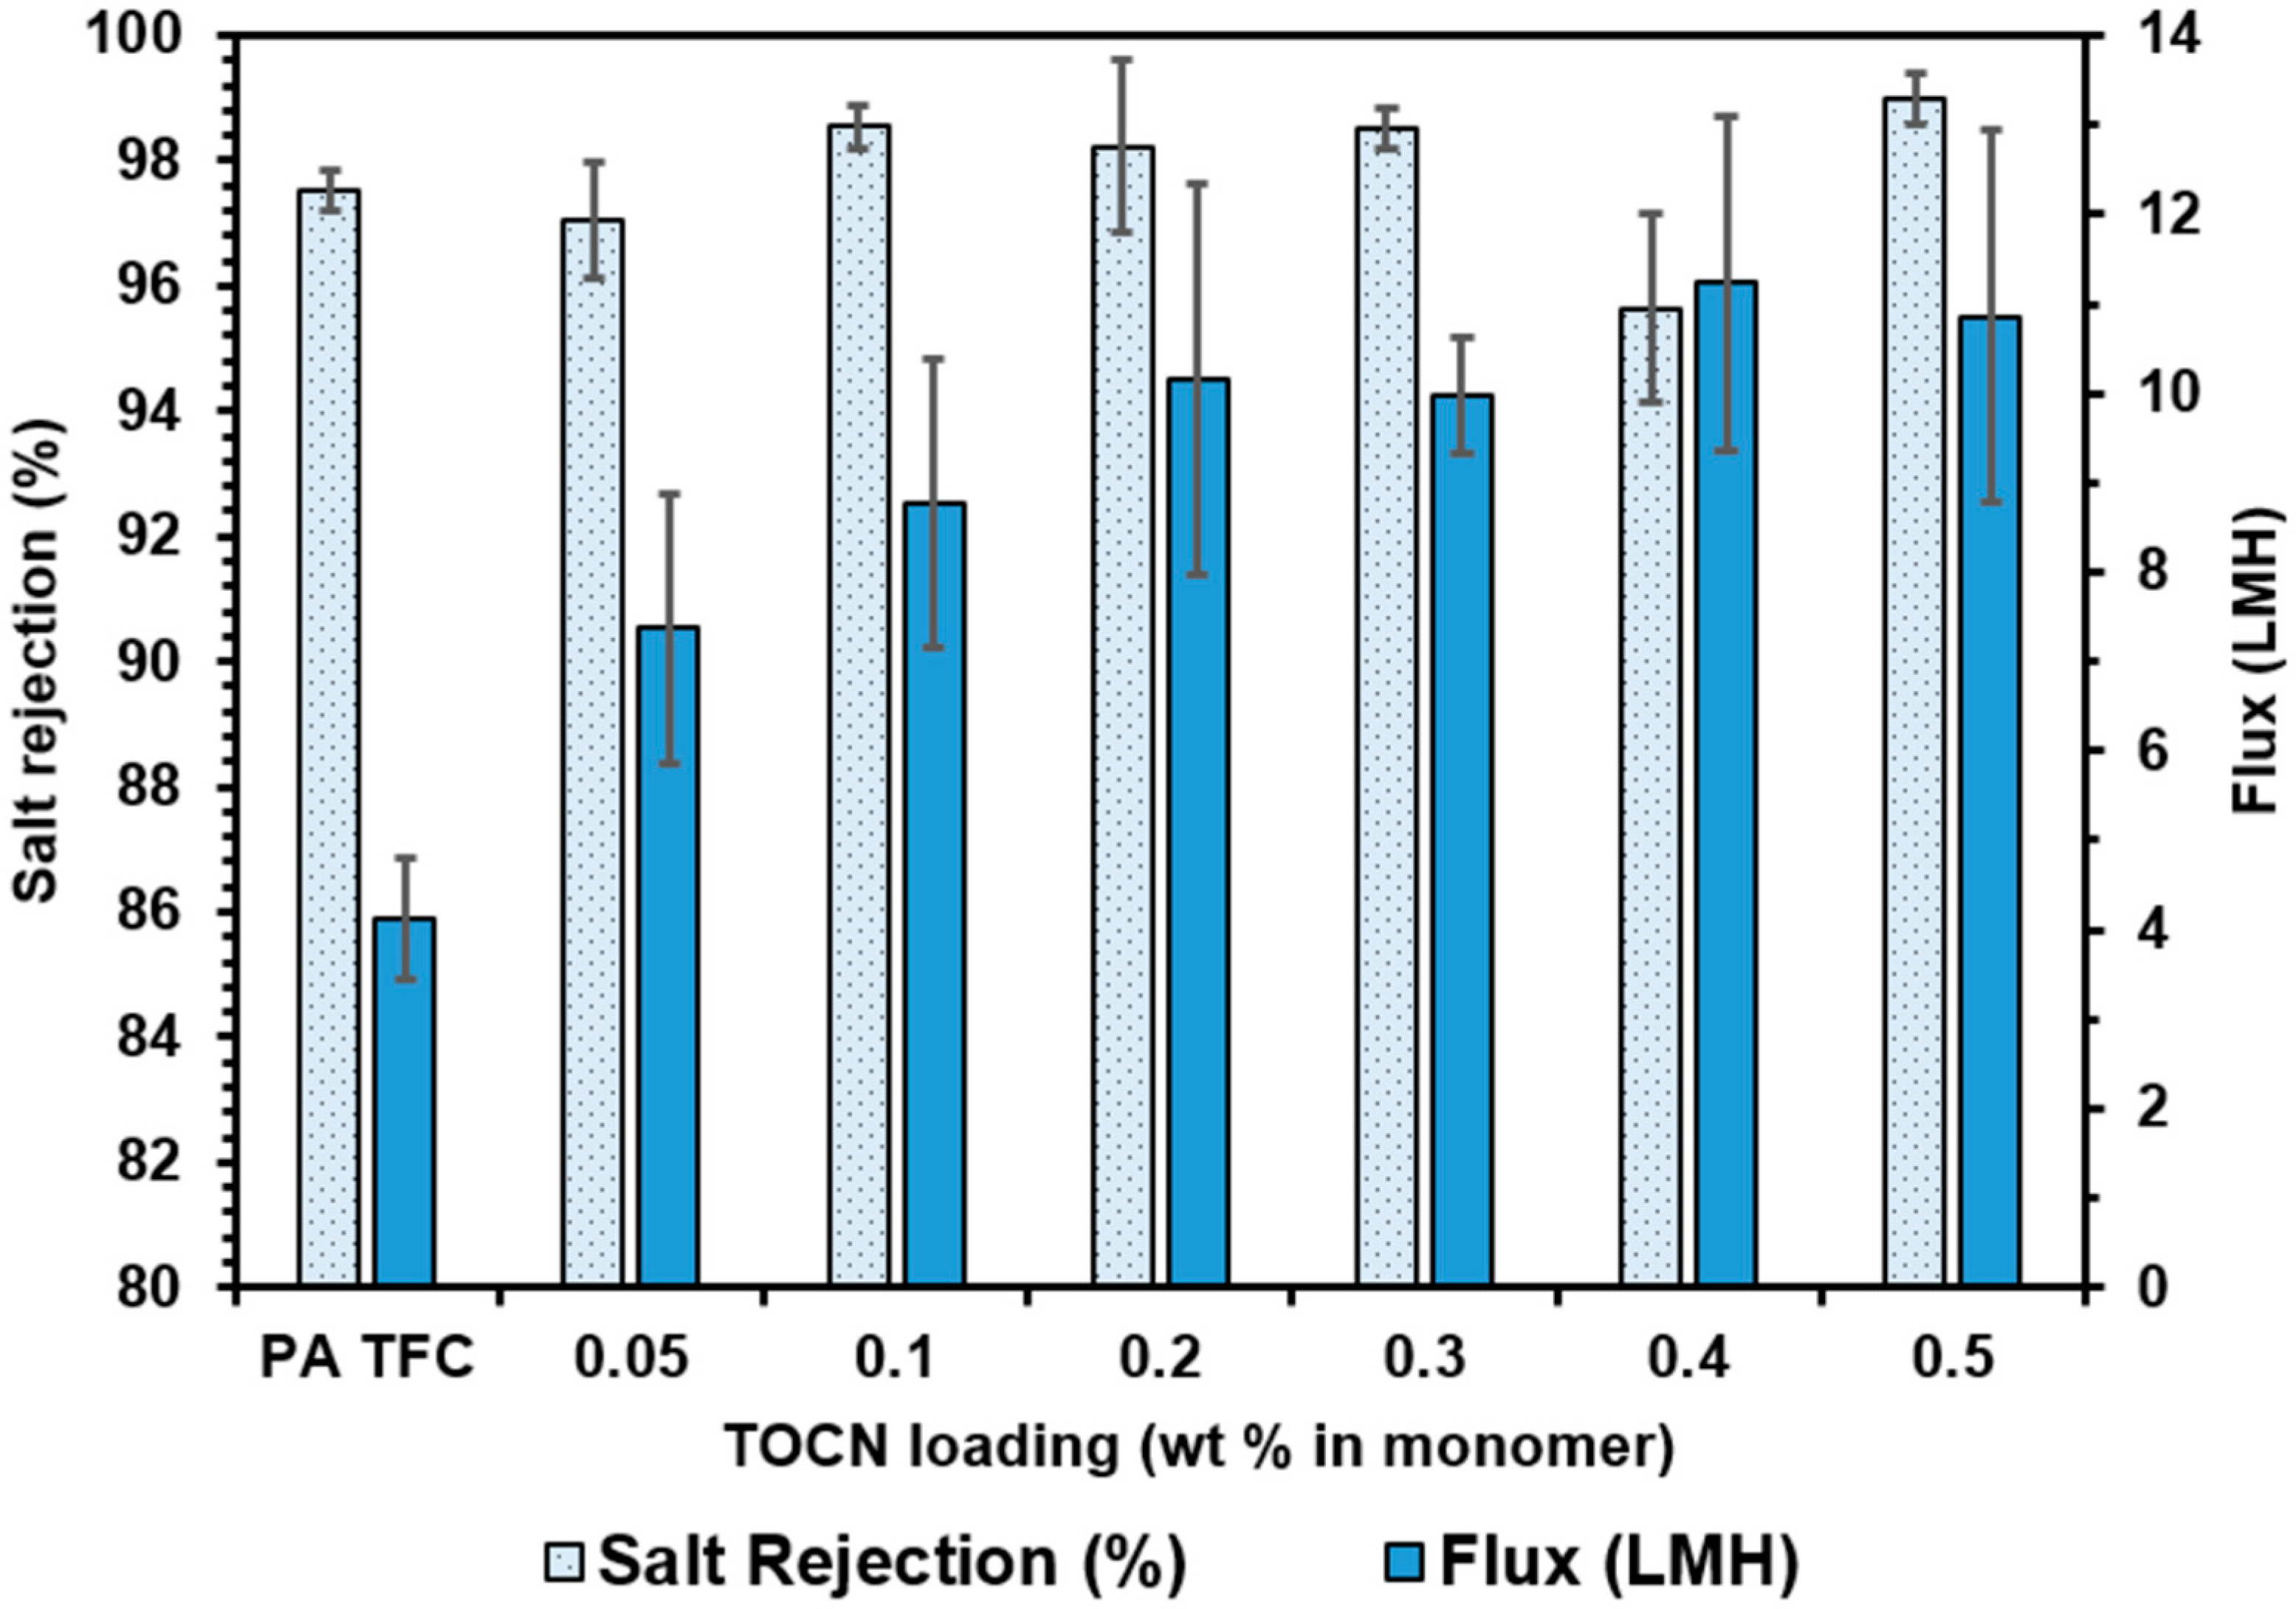
3.4. TFN Membrane Performance
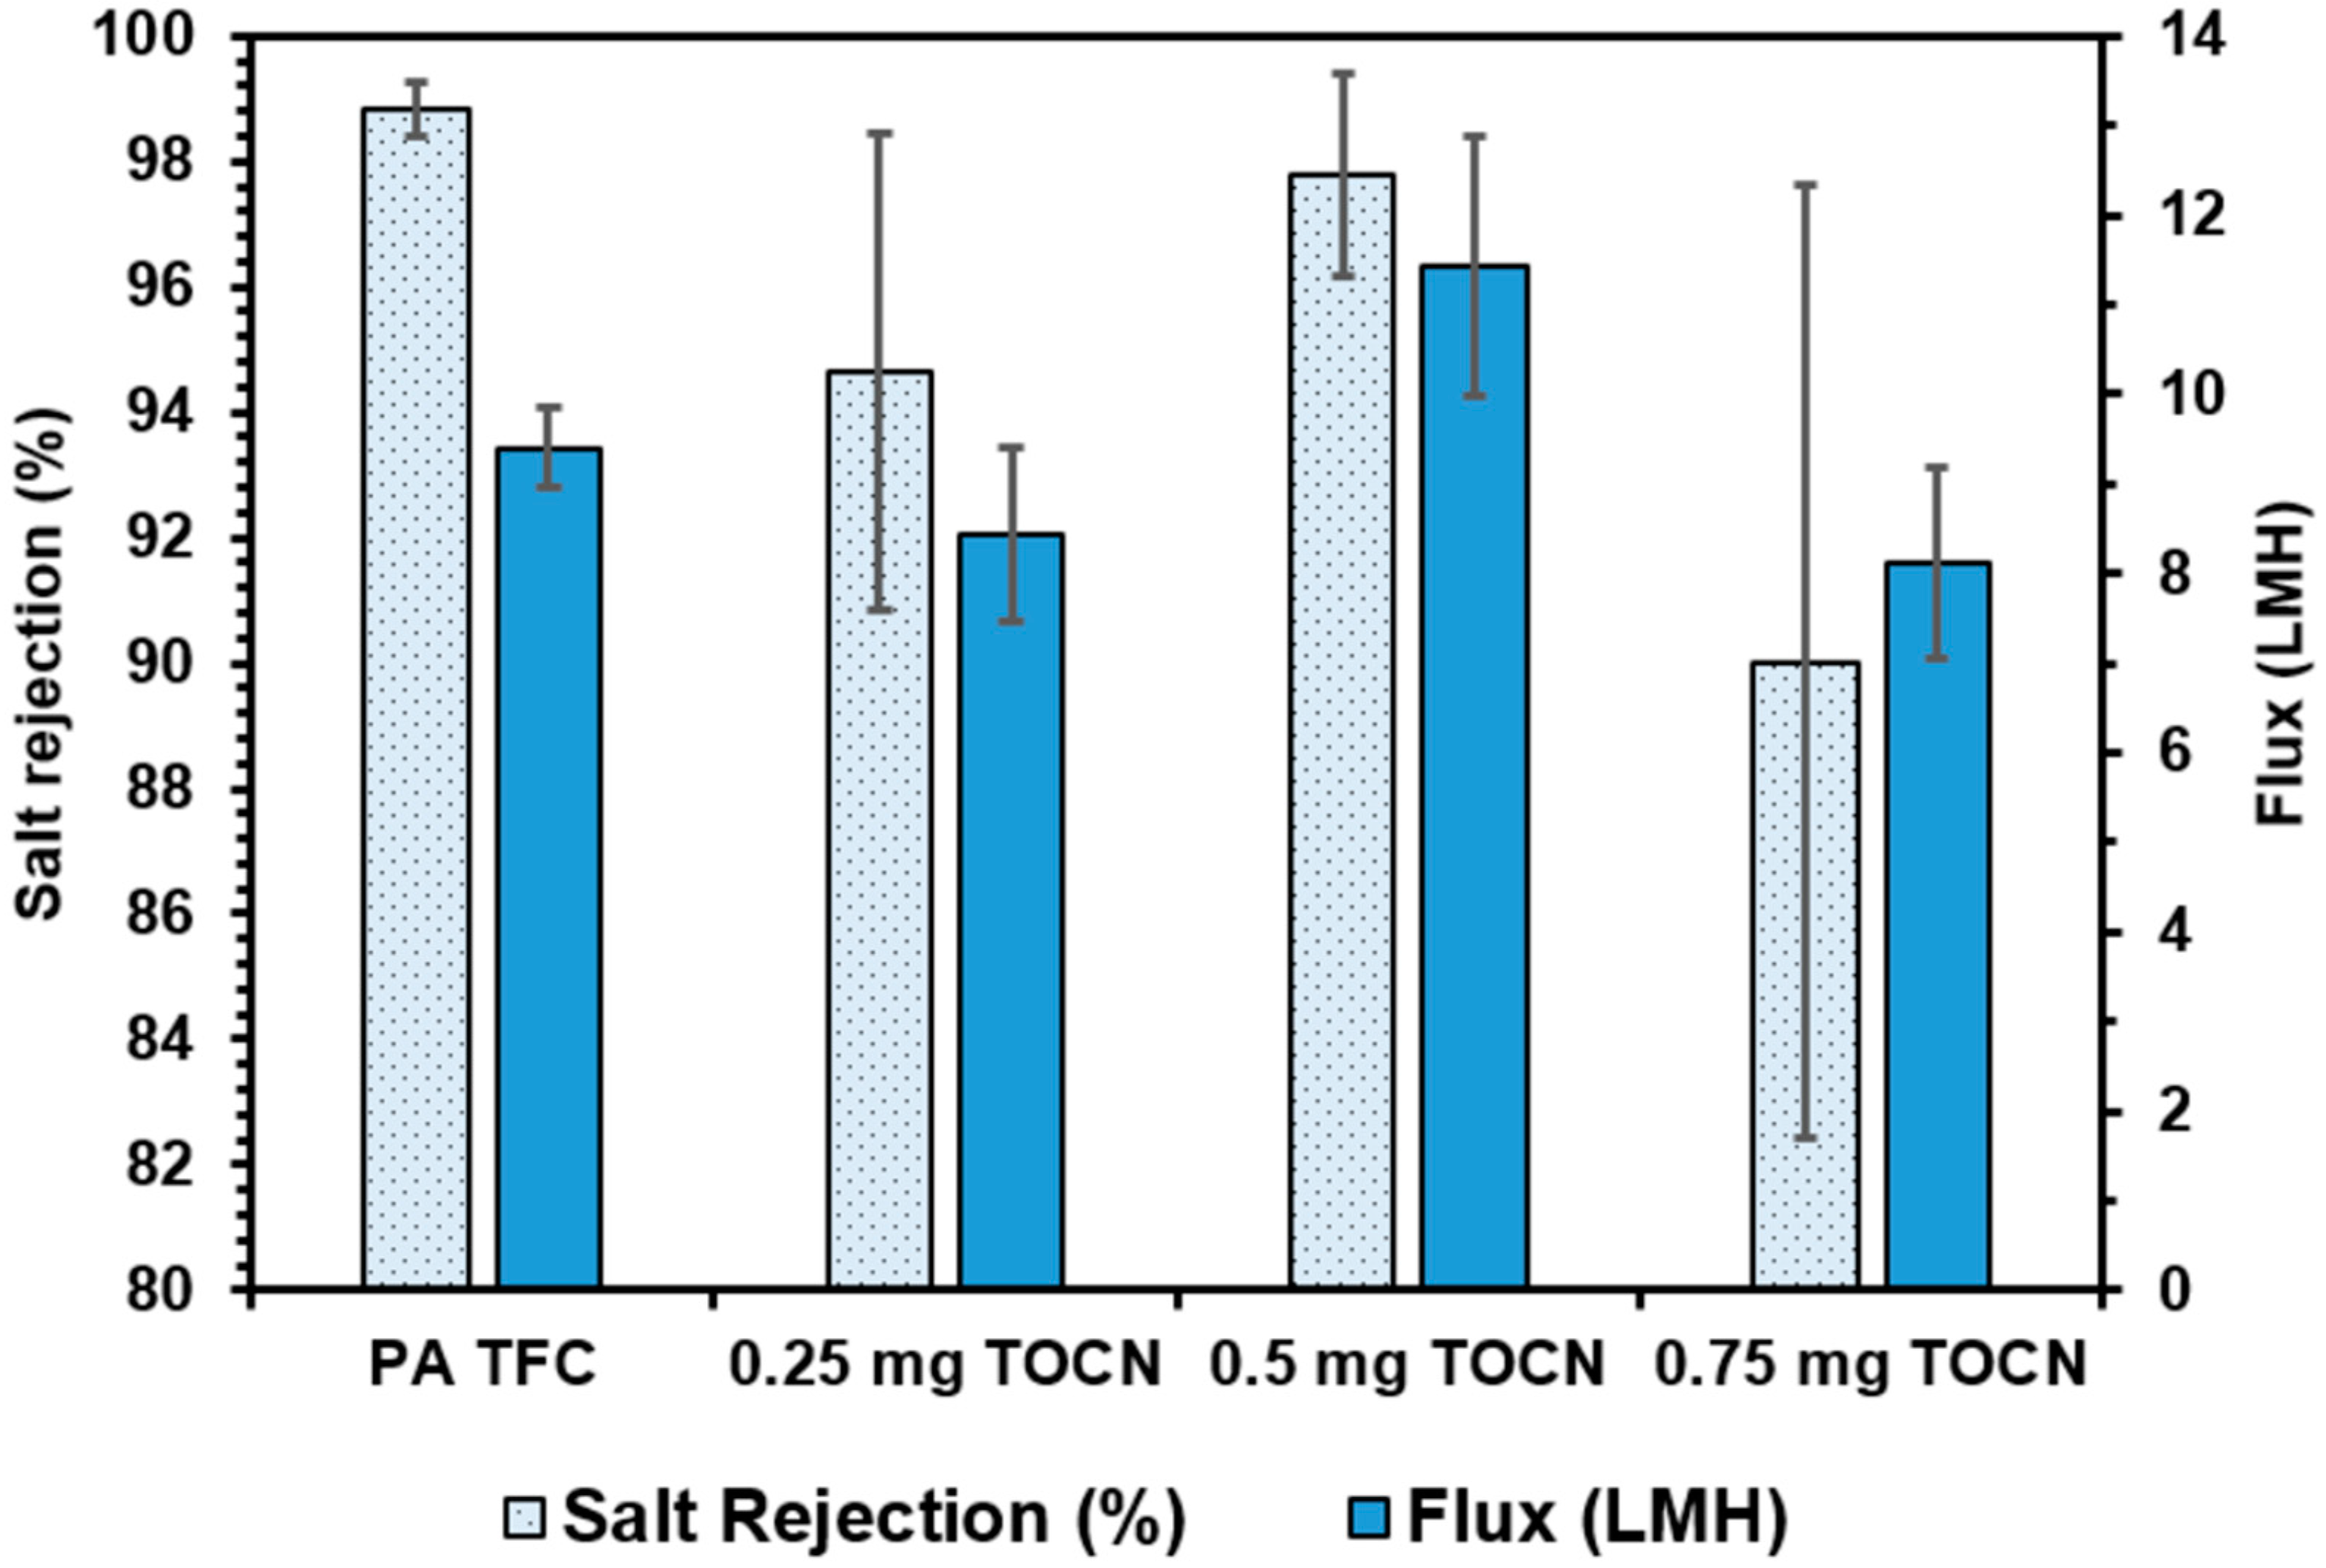
3.4.1. Vacuum Filtration Fabrication Method
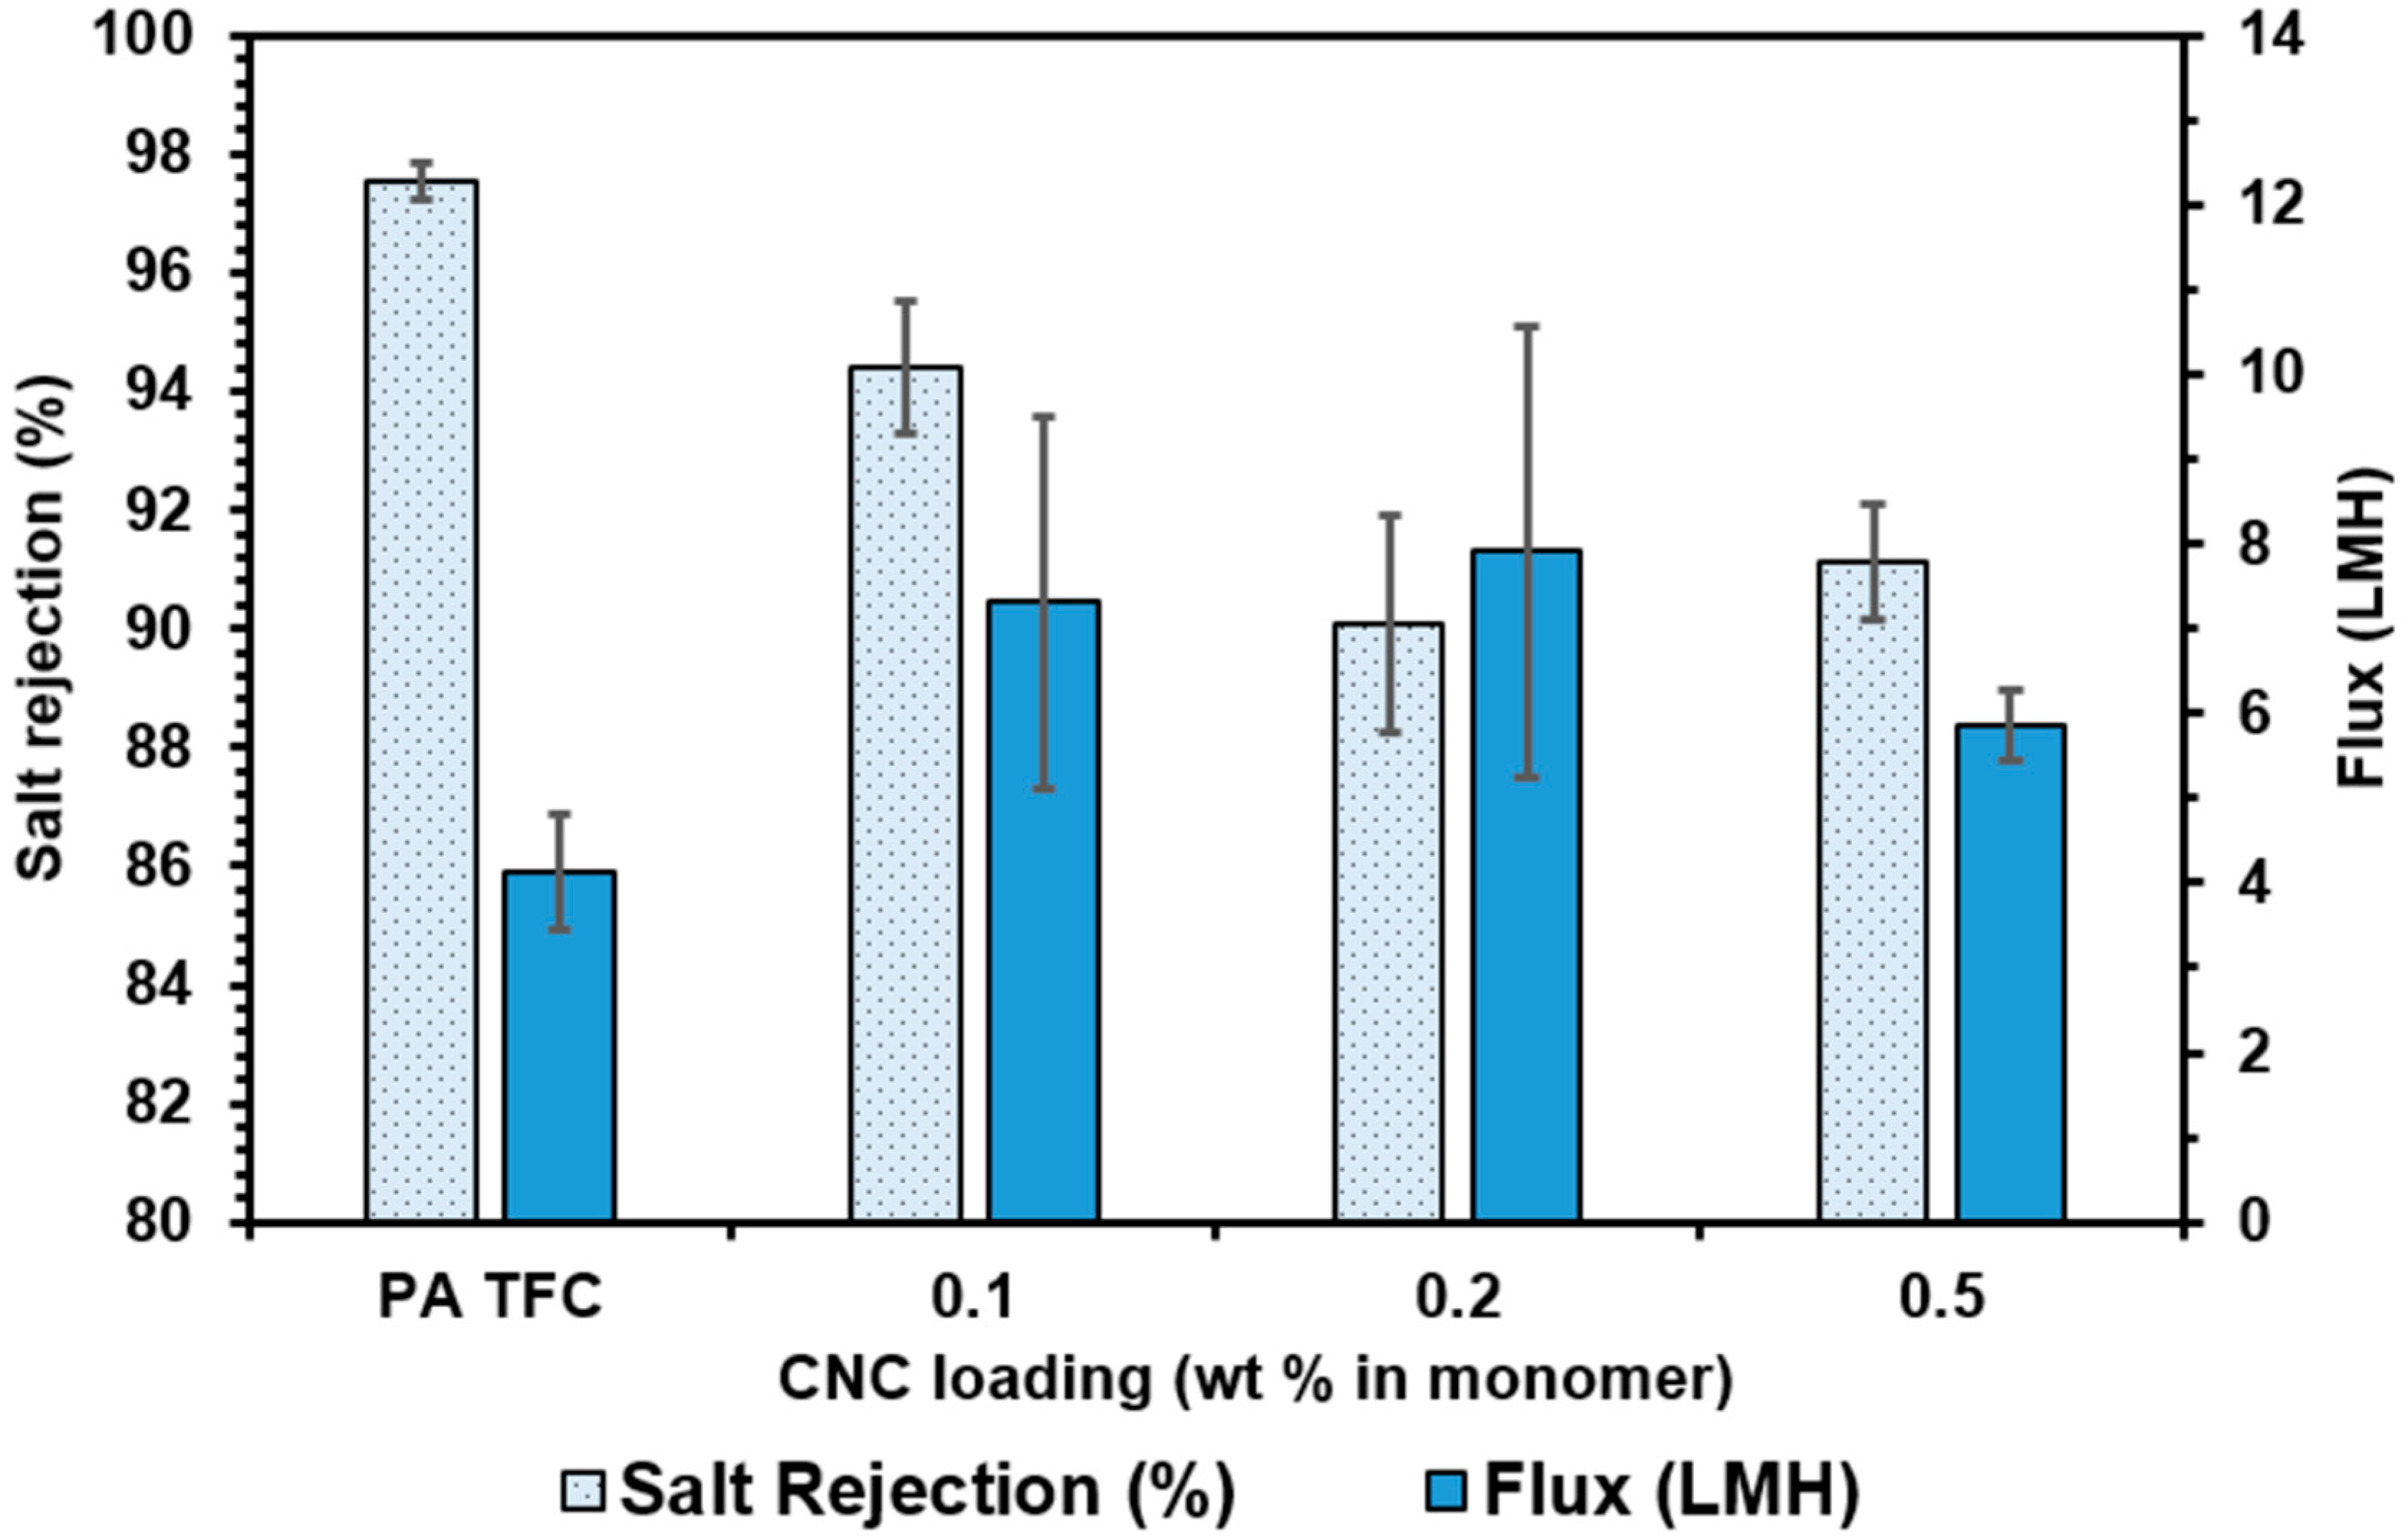
3.4.2. Dispersion Fabrication Method
4. Discussion
5. Conclusions
Author Contributions
Funding
Acknowledgments
Conflicts of Interest
Appendix A
A.1. Thin-Film Nanocomposite Performance

| Nanomaterials | Applied Pressure (psi) | Water Flux (L/m2·h) | Rejection (%) | Pure Water Permeability (L/m2·h·bar) |
|---|---|---|---|---|
| None [52] | 217 | 42 | 99.8 | 2.81 |
| SW-CNTs [8] | 350 | 36.2 | >98 | 1.5 |
| Ag [13] | 300 | 69.4 | 93.6 | 3.36 |
| Silica [14] | 250 | 15 | 95.1 | 0.87 |
| MIL-101 (Cr) [9] | 232 | 52.8 | 99.1 | 3.3 |
| TiO2 [17] | 300 | 65 | 97 | 3.14 |
A.2. TEMPO Oxidation of Cellulose Nanocrystals
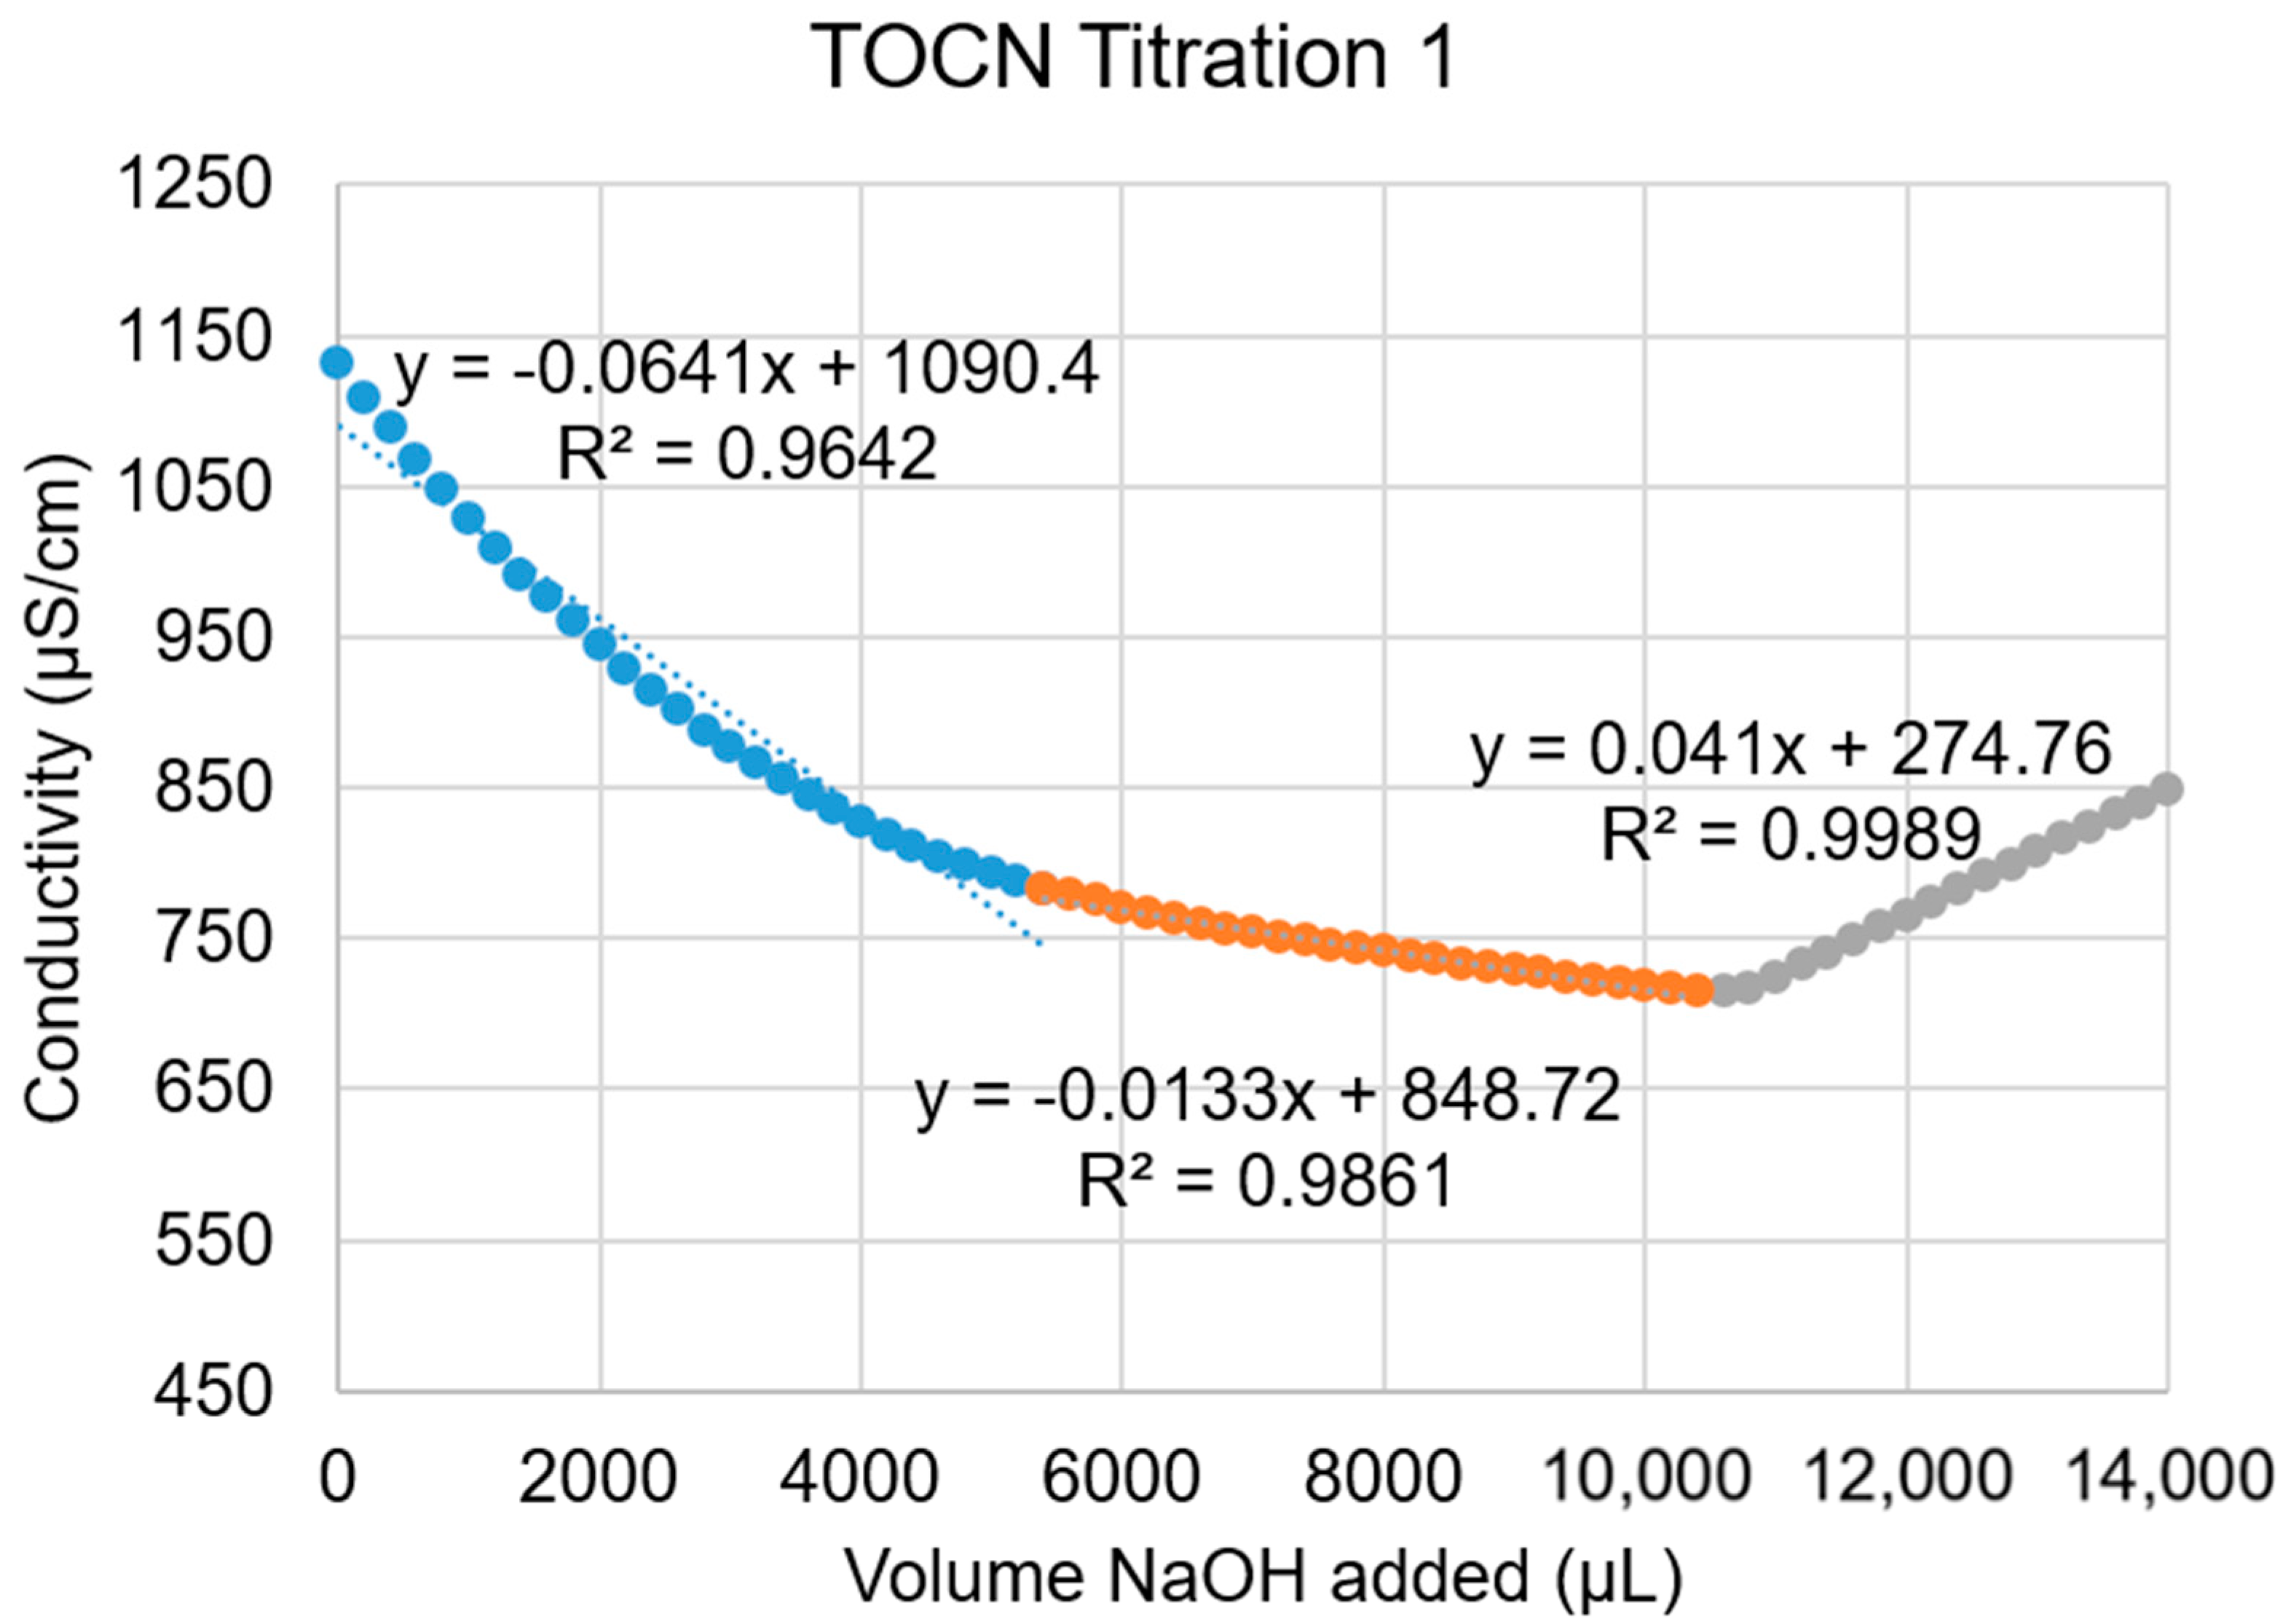
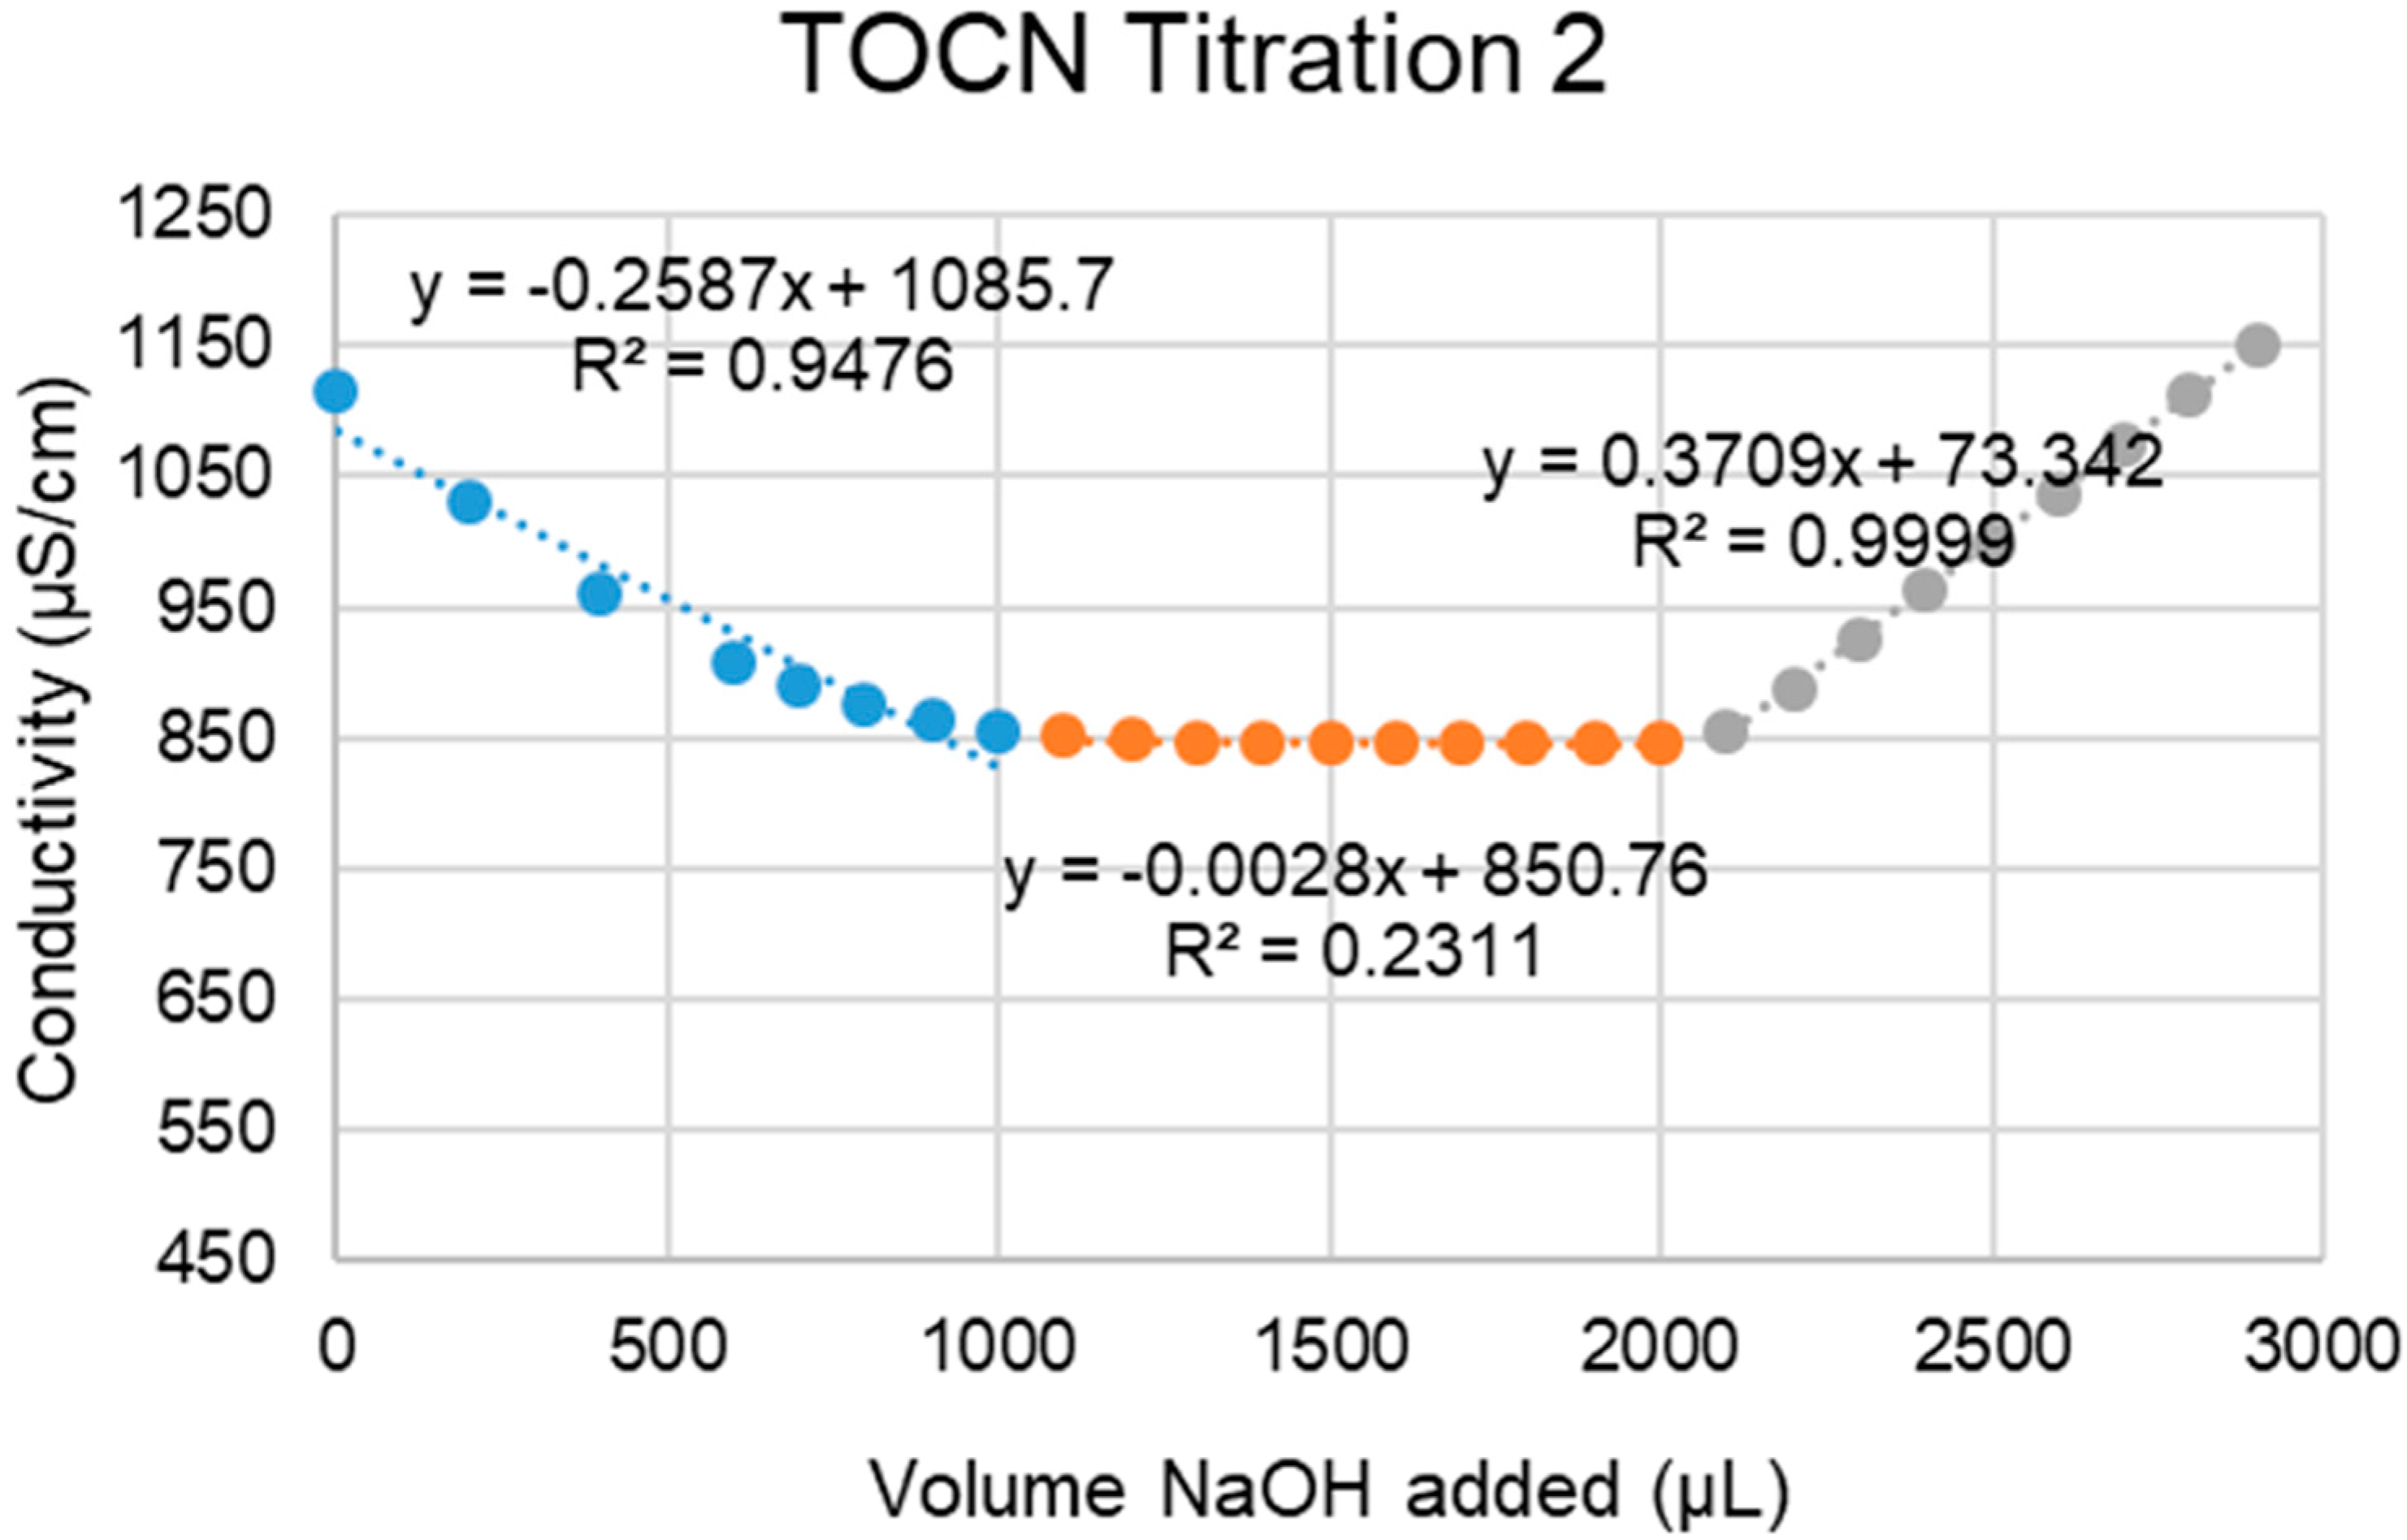
A.3. Conductometric Titration of TOCNs

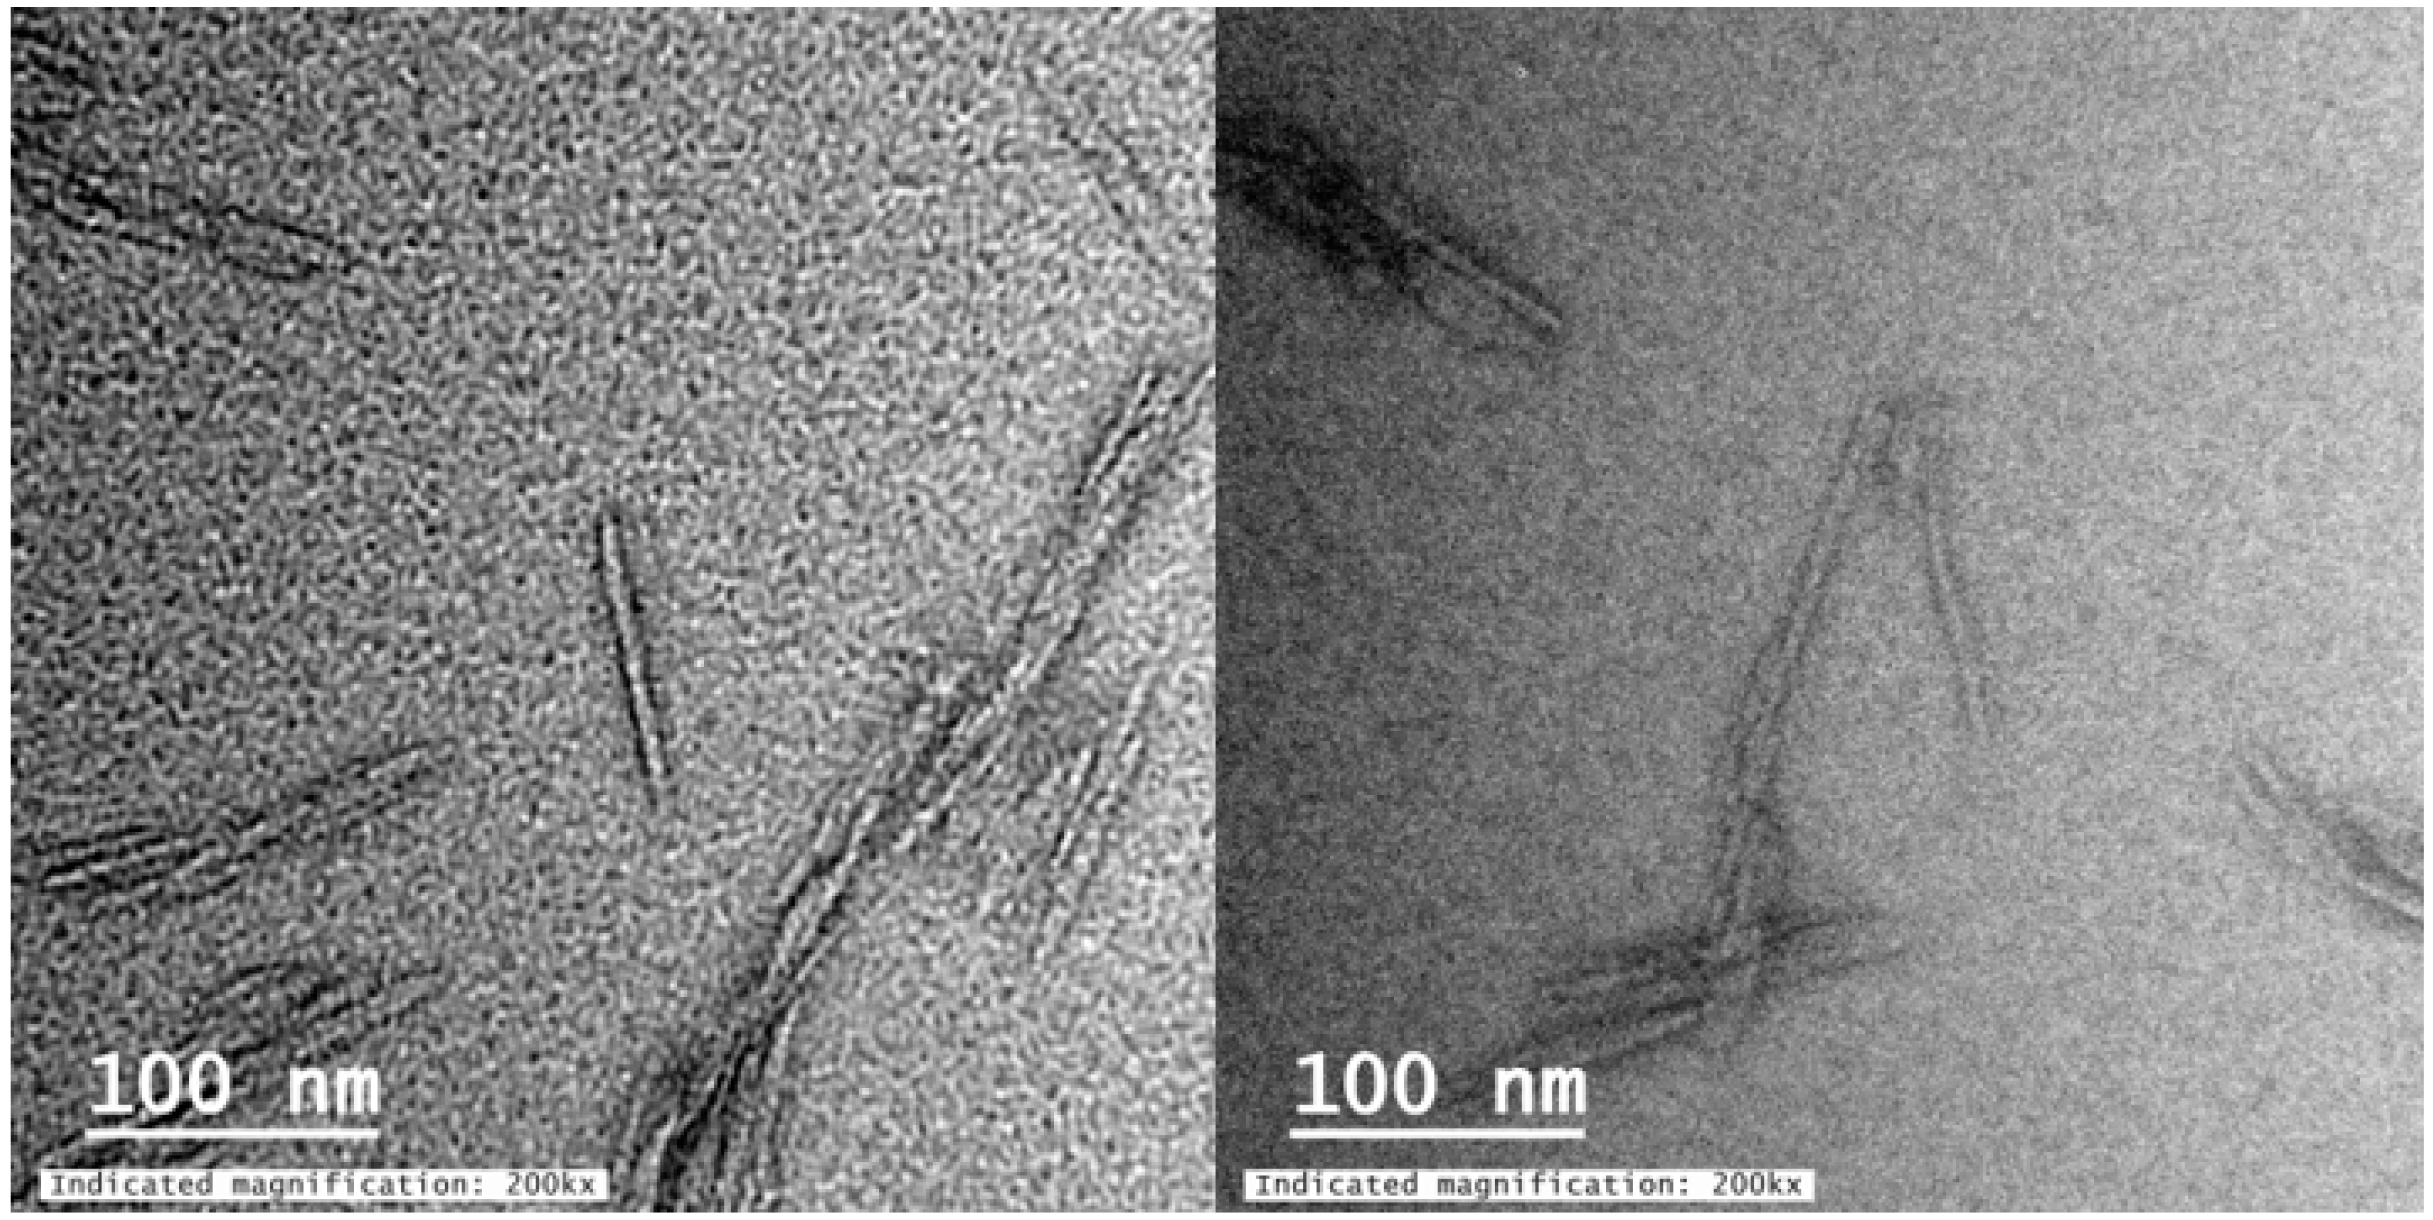
A.4. TEM Characterization of TOCNs
A.5. AFM Root Mean Square Roughness
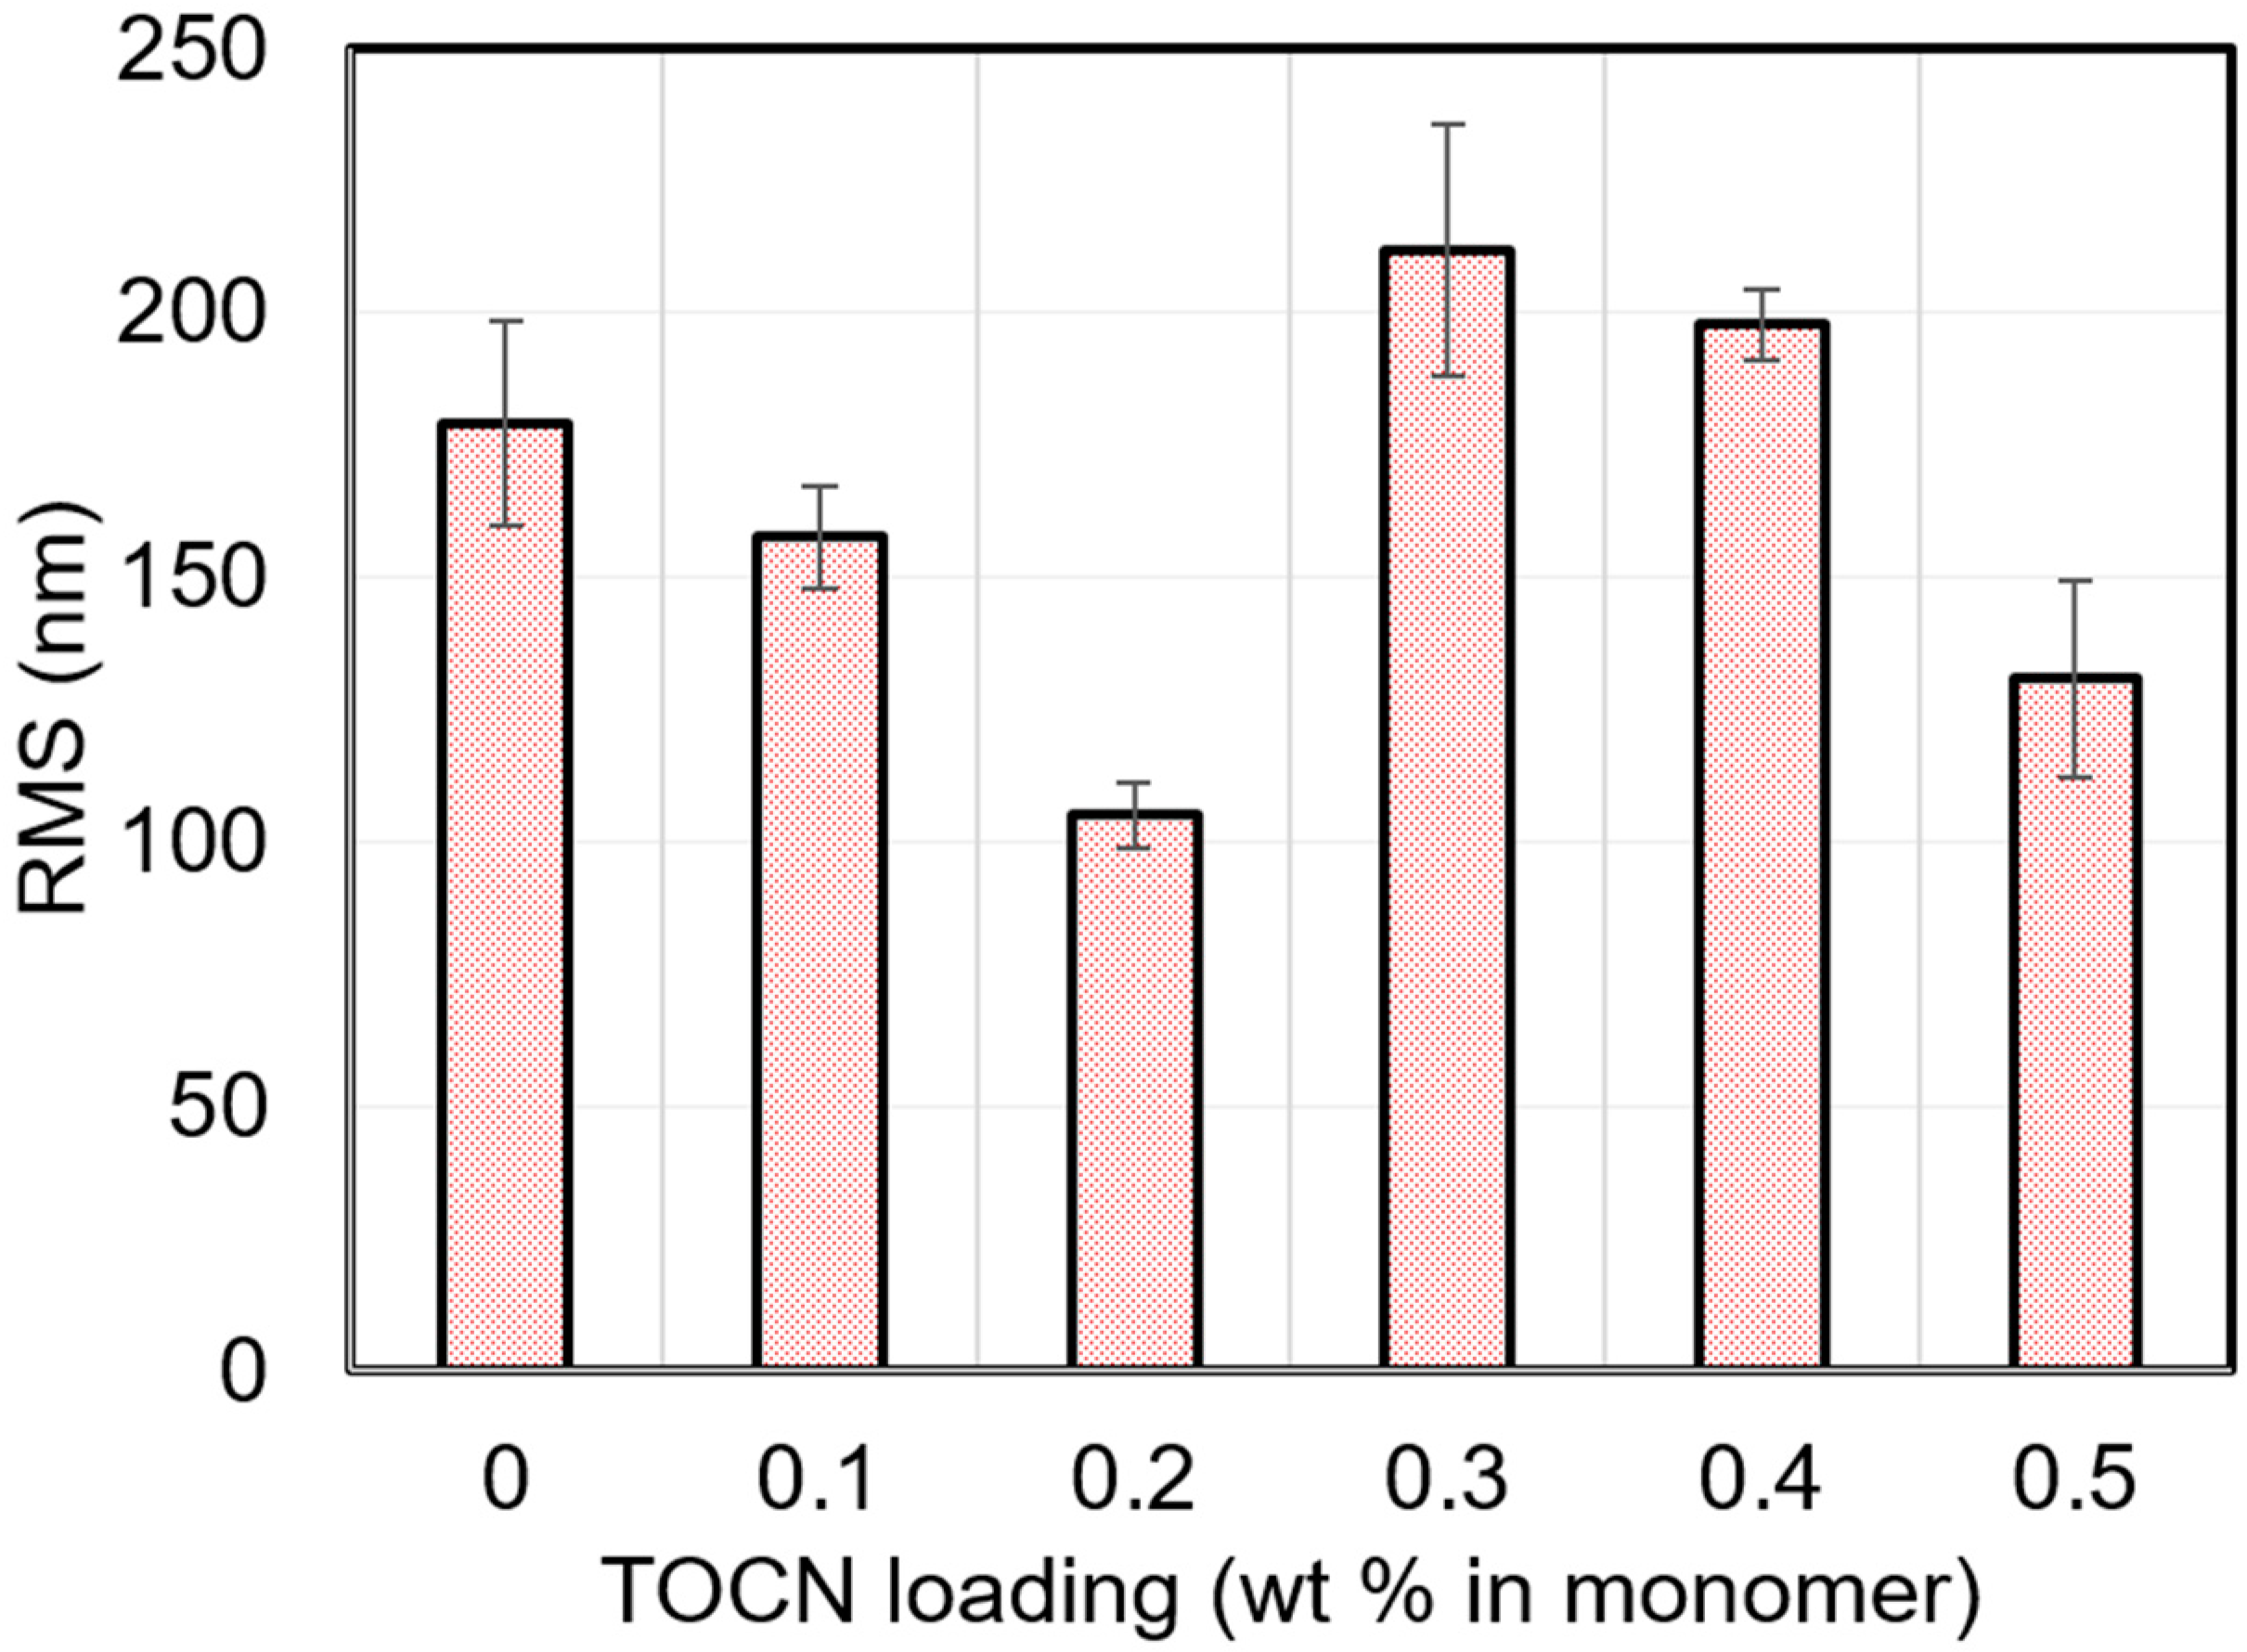
| TOCN Loading (wt % in Monomer) | RMS (nm) |
|---|---|
| 0 | 179.2 ± 19.3 |
| 0.1 | 157.6 ± 9.7 |
| 0.2 | 105.1 ± 6.3 |
| 0.3 | 211.8 ± 23.9 |
| 0.4 | 197.8 ± 6.9 |
| 0.5 | 130.8 ± 18.6 |

| TOCN Loading (mg) | RMS (nm) |
|---|---|
| 0 | 179.2 ± 19.3 |
| 0.25 | 240 ± 30 |
| 0.5 | 228 ± 17 |
| 0.75 | 212 ± 3 |
A.6. AFM Phase Images

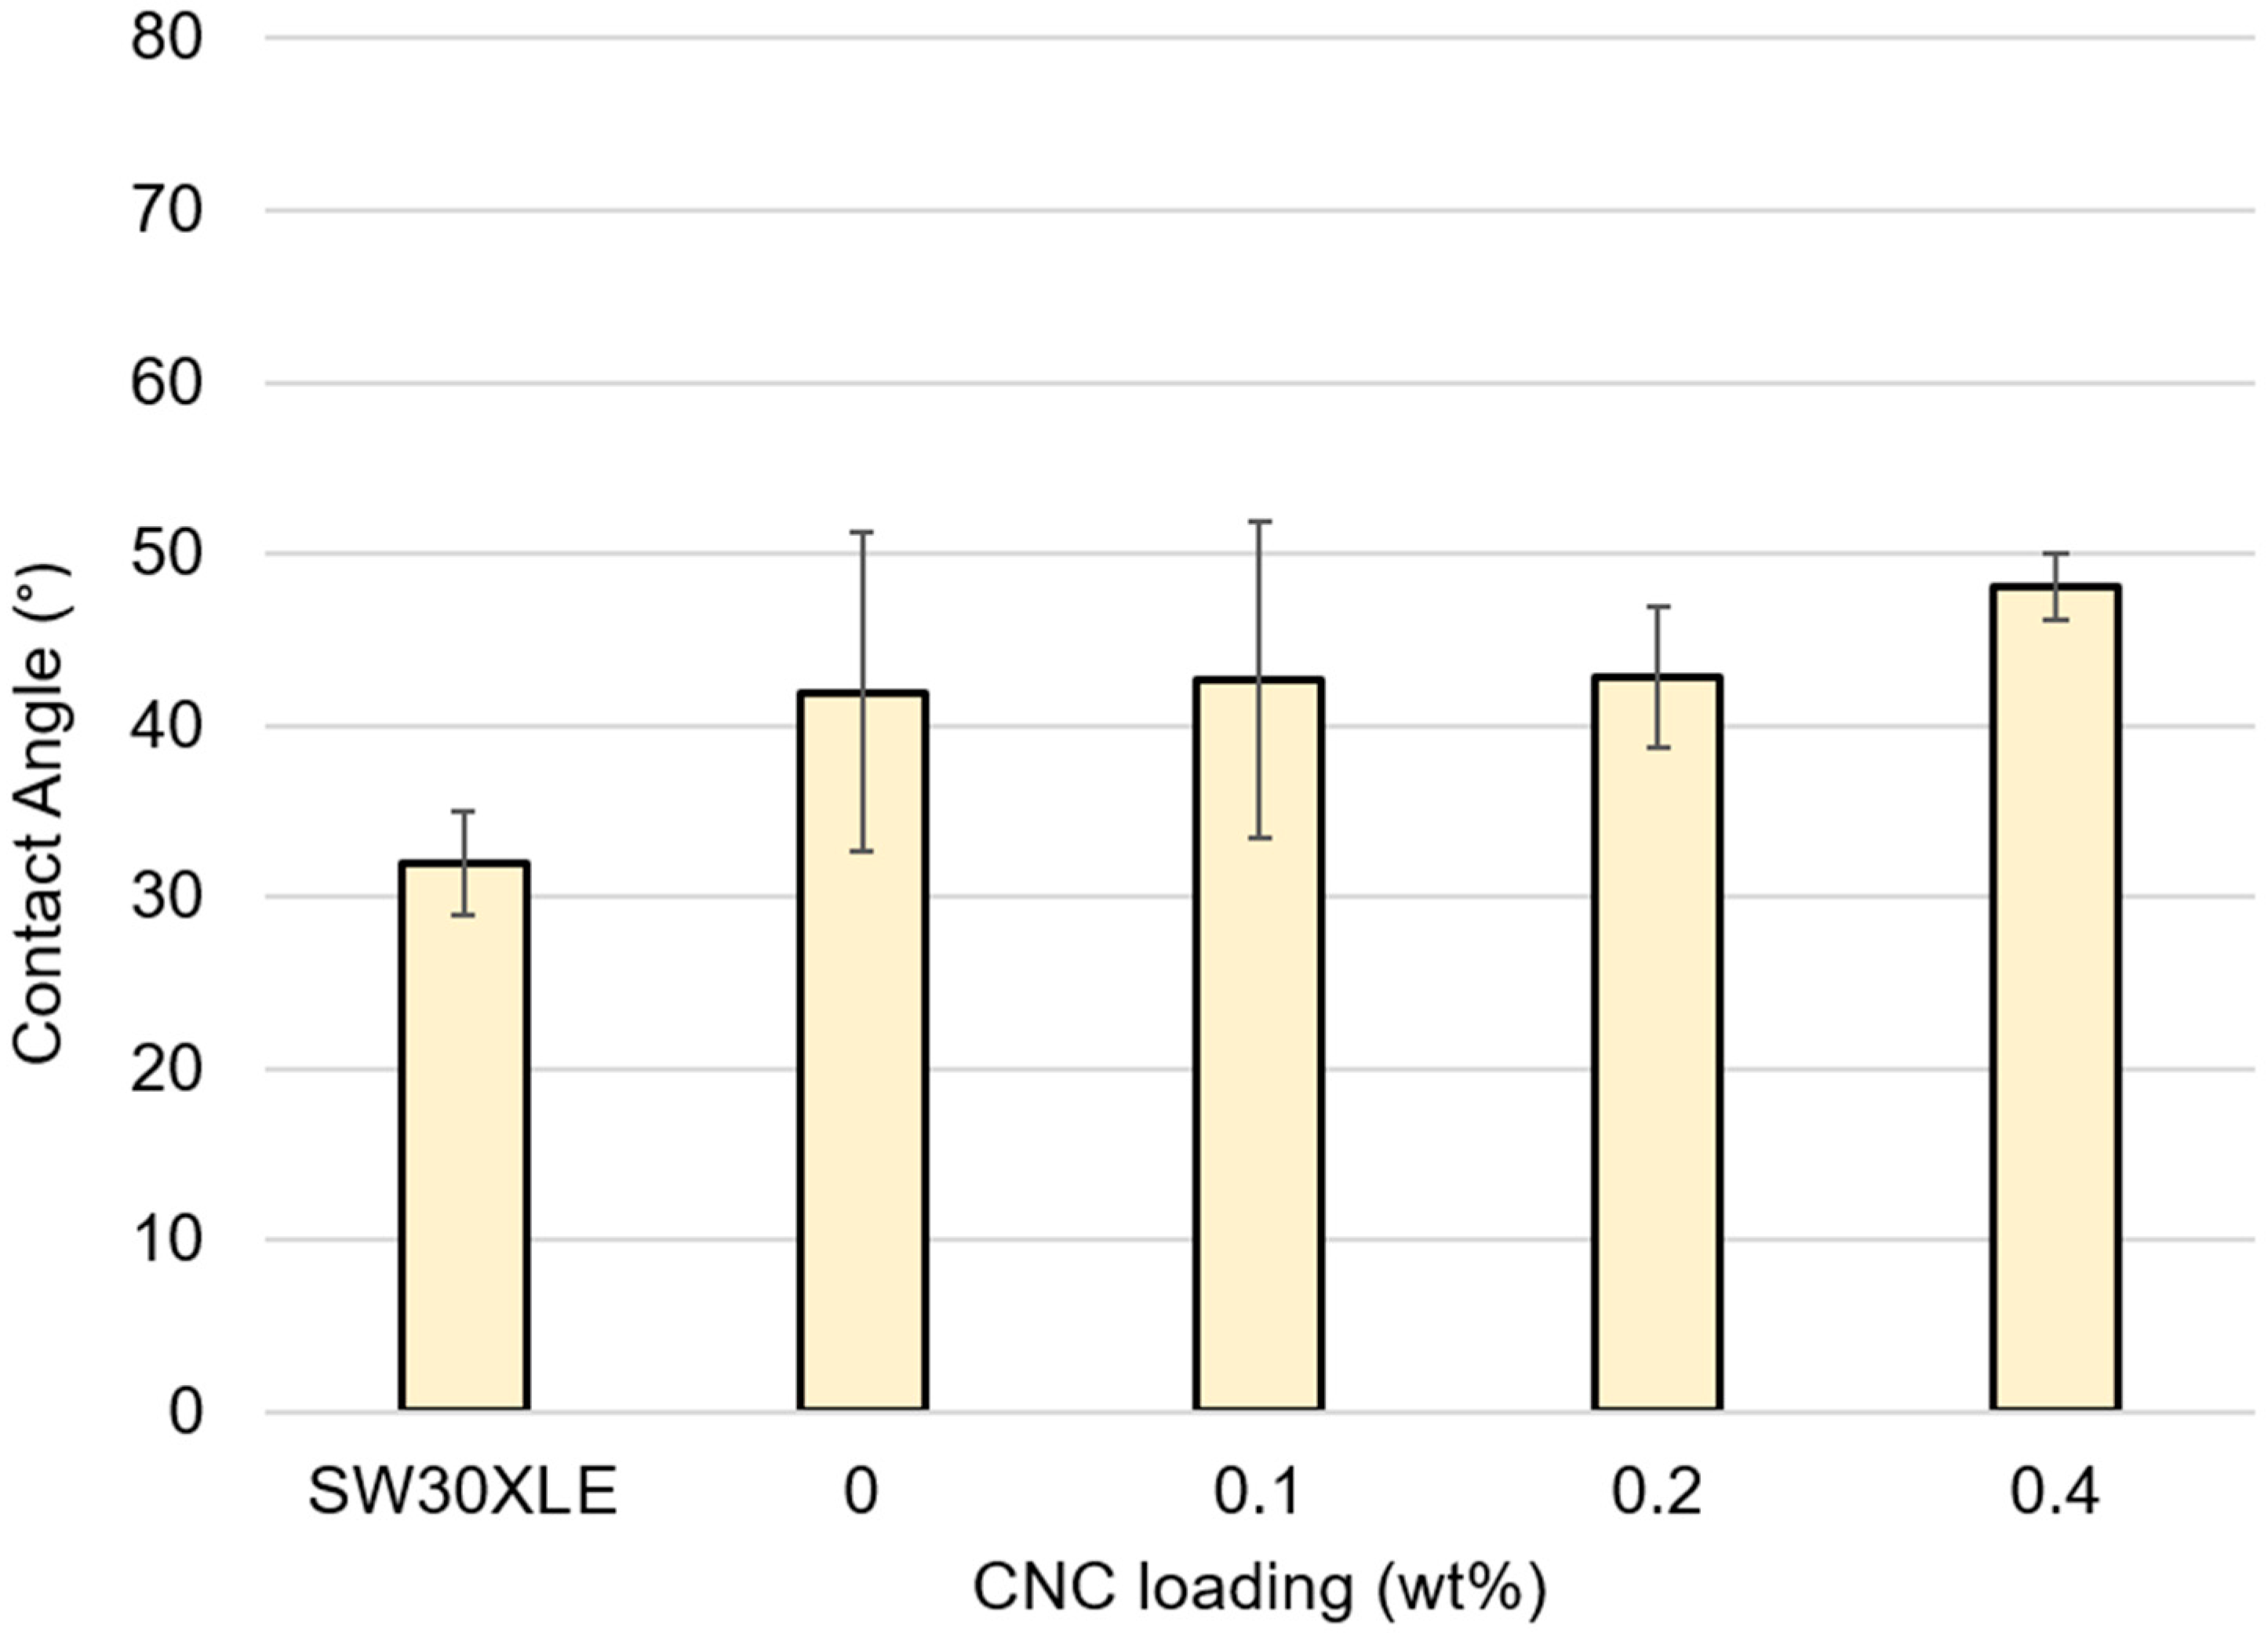
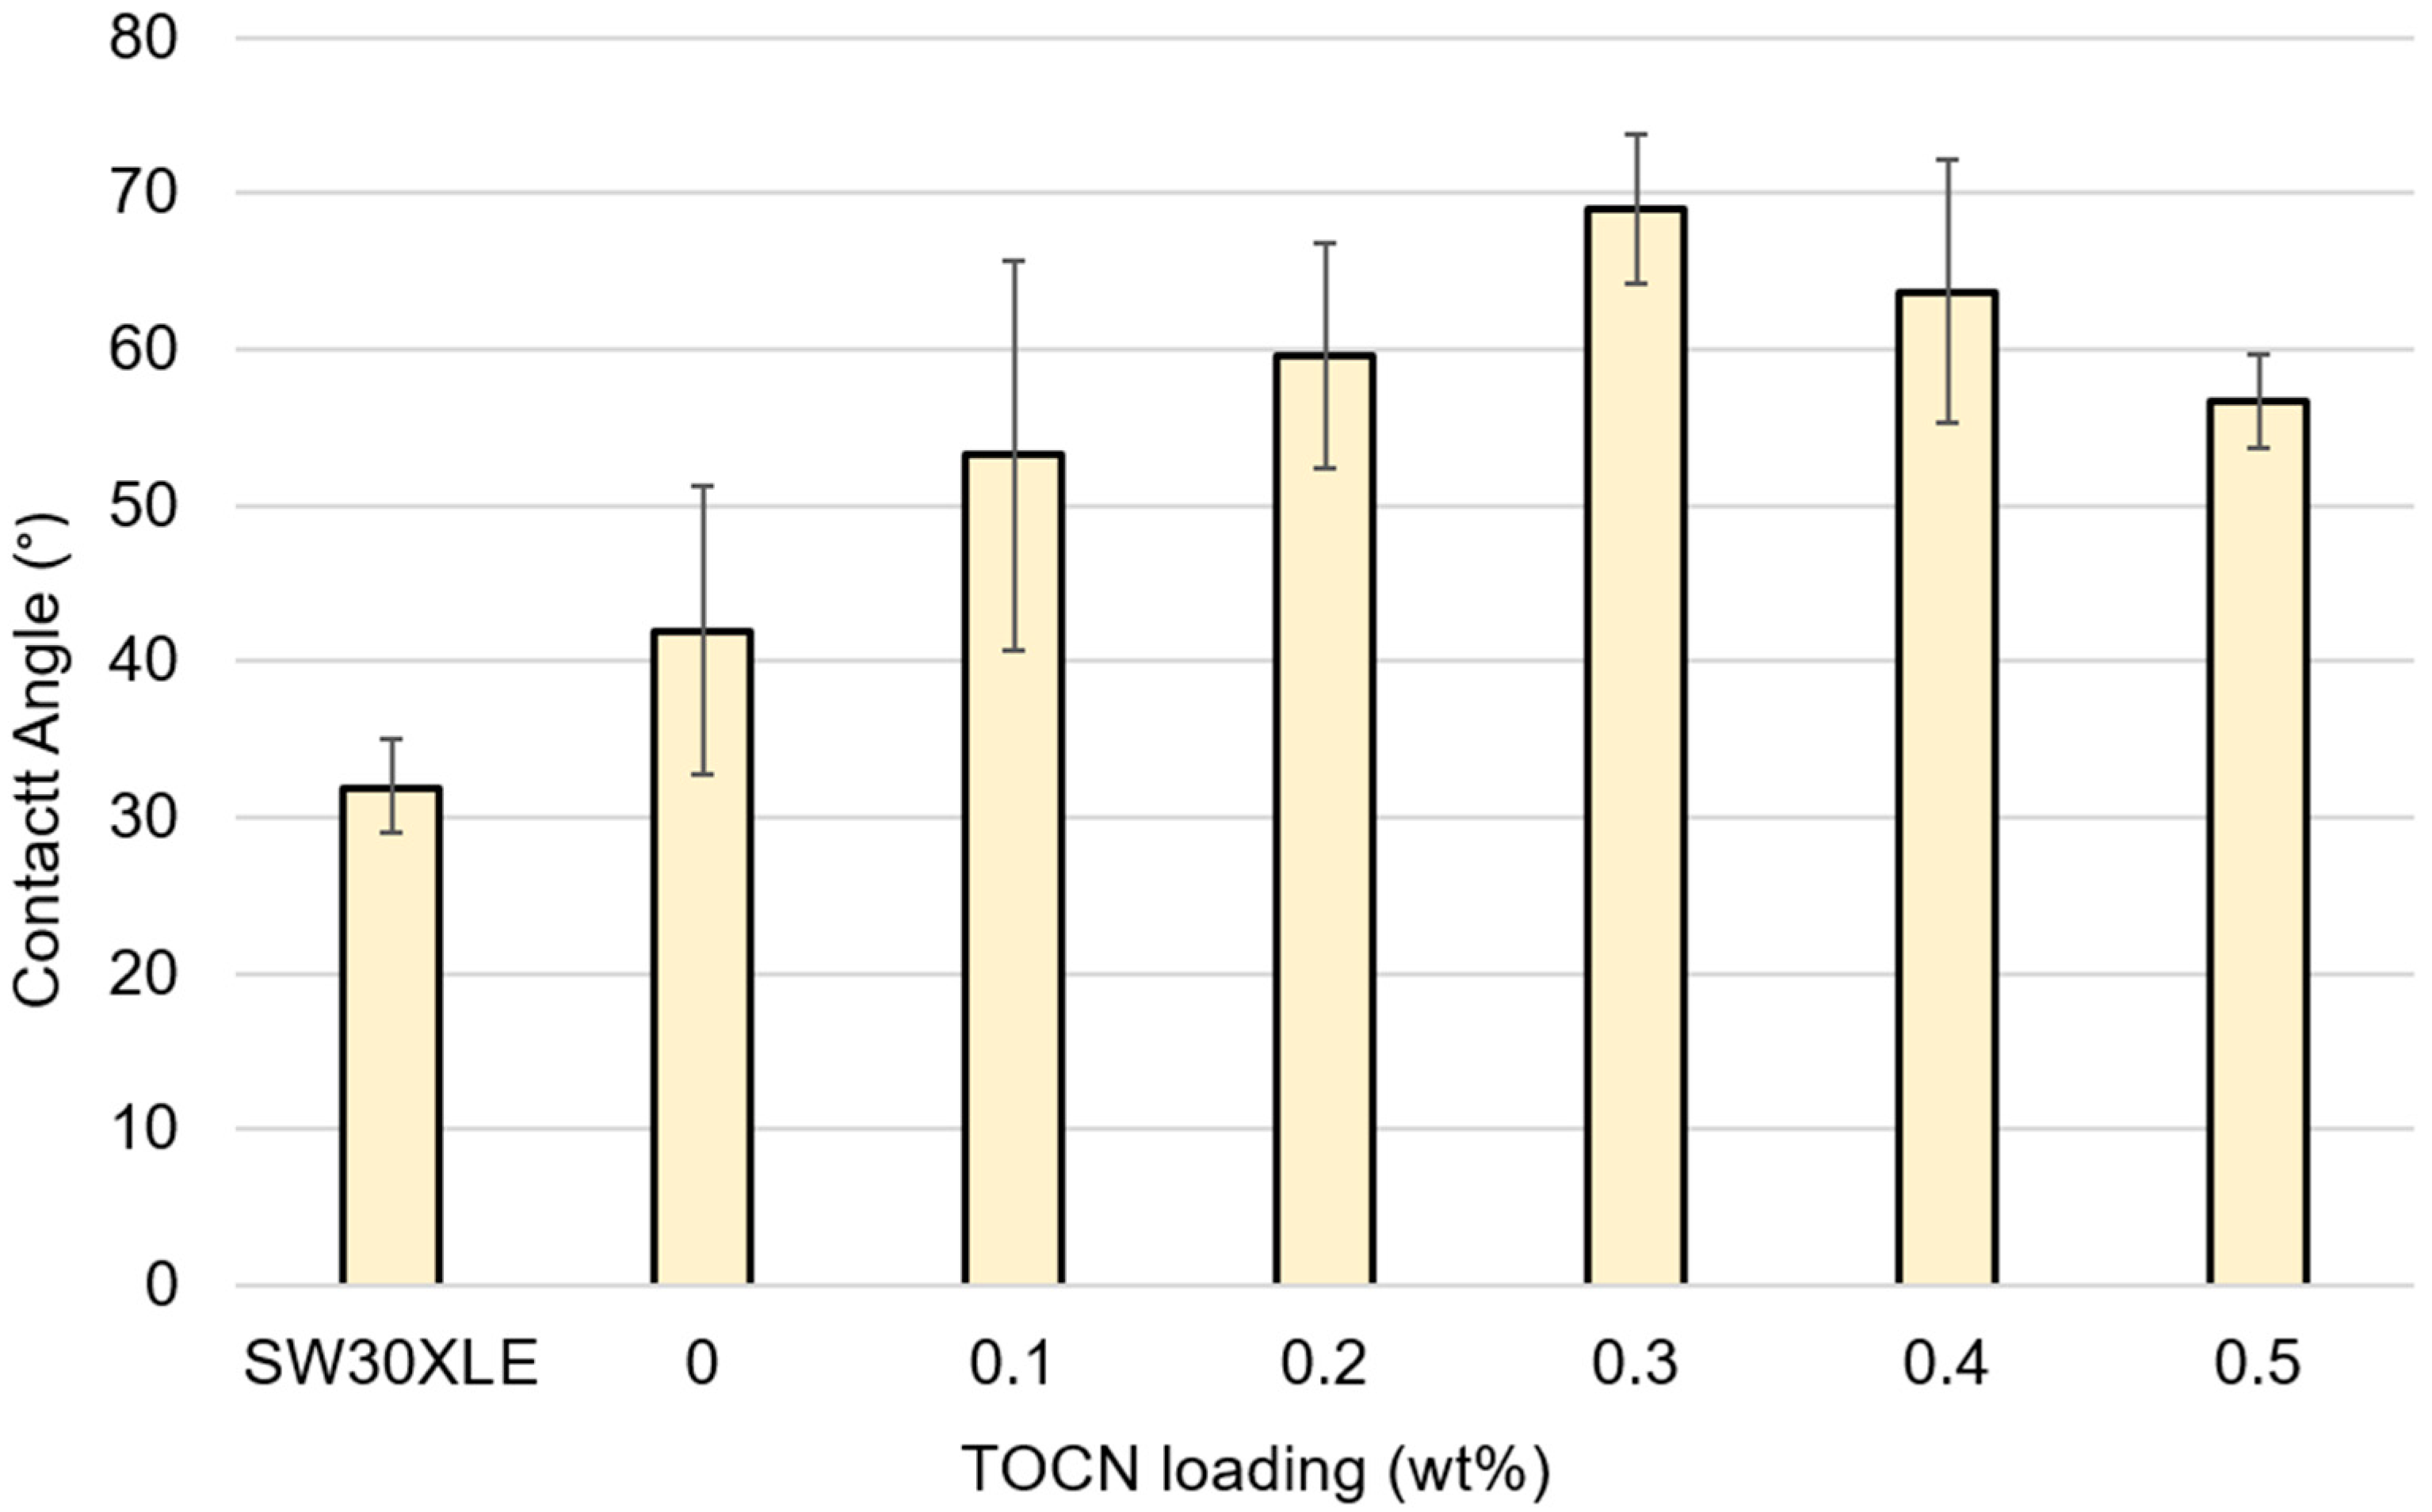
A.7. Contact Angle Goniometry
References
- Elimelech, M.; Phillip, W.A.W.A. The future of seawater desalination: Energy, technology, and the environment. Science 2011, 333, 712–717. [Google Scholar] [CrossRef] [PubMed]
- Greenlee, L.F.; Lawler, D.F.; Freeman, B.D.; Marrot, B.; Moulin, P. Reverse osmosis desalination: Water sources, technology, and today’s challenges. Water Res. 2009, 43, 2317–2348. [Google Scholar] [CrossRef]
- Ghaffour, N.; Missimer, T.M.; Amy, G.L. Technical review and evaluation of the economics of water desalination: Current and future challenges for better water supply sustainability. Desalination 2013, 309, 197–207. [Google Scholar] [CrossRef] [Green Version]
- Buonomenna, M.G. Nano-enhanced reverse osmosis membranes. Desalination 2013, 314, 73–88. [Google Scholar] [CrossRef]
- Cadotte, J.E.; Petersen, R.J.; Larson, R.E.; Erickson, E.E. A new thin-film composite seawater reverse osmosis membrane. Desalination 1980, 32, 25–31. [Google Scholar] [CrossRef]
- Petersen, R.J. Composite reverse osmosis and nanofiltration membranes. J. Membr. Sci. 1993, 83, 81–150. [Google Scholar] [CrossRef]
- Li, D.; Wang, H. Recent developments in reverse osmosis desalination membranes. J. Mater. Chem. 2010, 20, 4551–4566. [Google Scholar] [CrossRef]
- Chan, W.-F.; Marand, E.; Martin, S.M. Novel zwitterion functionalized carbon nanotube nanocomposite membranes for improved RO performance and surface anti-biofouling resistance. J. Membr. Sci. 2016, 509, 125–137. [Google Scholar] [CrossRef]
- Xu, Y.; Gao, X.; Wang, X.; Wang, Q.; Ji, Z.; Wang, X.; Wu, T.; Gao, C. Highly and stably water permeable thin film nanocomposite membranes doped with MIL-101 (Cr) nanoparticles for reverse osmosis application. Materials 2016, 9, 870. [Google Scholar] [CrossRef]
- Lind, M.L.; Ghosh, A.K.; Jawor, A.; Huang, X.; Hou, W.; Yang, Y.; Hoek, E.M.V. Influence of zeolite crystal size on zeolite-polyamide thin film nanocomposite membranes. Langmuir 2009, 25, 10139–10145. [Google Scholar] [CrossRef]
- Jeong, B.-H.; Hoek, E.M.V.; Yan, Y.; Subramani, A.; Huang, X.; Hurwitz, G.; Ghosh, A.K.; Jawor, A. Interfacial polymerization of thin film nanocomposites: A new concept for reverse osmosis membranes. J. Membr. Sci. 2007, 294, 1–7. [Google Scholar] [CrossRef]
- Lind, M.L.; Suk, D.E.; Nguyen, T.V.; Hoek, E.M.V. Tailoring the structure of thin film nanocomposite membranes to achieve seawater RO membrane performance. Environ. Sci. Technol. 2010, 44, 8230–8235. [Google Scholar] [CrossRef] [PubMed]
- Yin, J.; Yang, Y.; Hu, Z.; Deng, B. Attachment of silver nanoparticles (AgNPs) onto thin-film composite (TFC) membranes through covalent bonding to reduce membrane biofouling. J. Membr. Sci. 2013, 441, 73–82. [Google Scholar] [CrossRef]
- Jadav, G.L.; Singh, P.S. Synthesis of novel silica-polyamide nanocomposite membrane with enhanced properties. J. Membr. Sci. 2009, 328, 257–267. [Google Scholar] [CrossRef]
- Van Goethem, C.; Verbeke, R.; Pfanmöller, M.; Koschine, T.; Dickmann, M.; Timpel-Lindner, T.; Egger, W.; Bals, S.; Vankelecom, I.F.J. The role of MOFs in Thin-Film Nanocomposite (TFN) membranes. J. Membr. Sci. 2018, 563, 938–948. [Google Scholar] [CrossRef]
- Van Goethem, C.; Verbeke, R.; Hermans, S.; Bernstein, R.; Vankelecom, I.F.J. Controlled positioning of MOFs in interfacially polymerized thin-film nanocomposites. J. Mater. Chem. A 2016, 4, 16368–16376. [Google Scholar] [CrossRef]
- Al Mayyahi, A. TiO(2) Polyamide Thin Film Nanocomposite Reverses Osmosis Membrane for Water Desalination. Membranes (Basel) 2018, 8, 66. [Google Scholar] [CrossRef]
- Lee, H.S.; Im, S.J.; Kim, J.H.; Kim, H.J.; Kim, J.P.; Min, B.R. Polyamide thin-film nanofiltration membranes containing TiO2 nanoparticles. Desalination 2008, 219, 48–56. [Google Scholar] [CrossRef]
- Shafiq, M.; Sabir, A.; Islam, A.; Khan, S.M.; Gull, N.; Hussain, S.N.; Butt, M.T.Z. Cellulaose acetate based thin film nanocomposite reverse osmosis membrane incorporated with TiO2 nanoparticles for improved performance. Carbohydr. Polym. 2018, 186, 367–376. [Google Scholar] [CrossRef]
- Habibi, Y.; Lucia, L.A.; Rojas, O.J. Cellulose Nanocrystals: Chemistry, Self-Assembly, and Applications. Chem. Rev. 2009, 110, 3479–3500. [Google Scholar] [CrossRef]
- Chan, W.-F.; Chen, H.-Y.; Surapathi, A.; Taylor, M.G.; Shao, X.; Marand, E.; Johnson, J.K. Zwitterion Functionalized Carbon Nanotube/Polyamide Nanocomposite Membranes for Water Desalination. ACS Nano 2013, 7, 5308–5319. [Google Scholar] [CrossRef] [PubMed]
- Beck-Candanedo, S.; Roman, M.; Gray, D.G. Effect of reaction conditions on the properties and behavior of wood cellulose nanocrystal suspensions. Biomacromolecules 2005, 6, 1048–1054. [Google Scholar] [CrossRef] [PubMed]
- Morandi, G.; Heath, L.; Thielemans, W. Cellulose nanocrystals grafted with polystyrene chains through Surface-Initiated Atom Transfer Radical Polymerization (SI-ATRP). Langmuir 2009, 25, 8280–8286. [Google Scholar] [CrossRef] [PubMed]
- Habibi, Y.; Goffin, A.-L.; Schiltz, N.; Duquesne, E.; Dubois, P.; Dufresne, A. Bionanocomposites based on poly(ε-caprolactone)-grafted cellulose nanocrystals by ring-opening polymerization. J. Mater. Chem. 2008, 18, 5002–5010. [Google Scholar] [CrossRef]
- Kong, L.; Zhang, D.; Shao, Z.; Han, B.; Lv, Y.; Gao, K.; Peng, X. Superior effect of TEMPO-oxidized cellulose nanofibrils (TOCNs) on the performance of cellulose triacetate (CTA) ultrafiltration membrane. Desalination 2014, 332, 117–125. [Google Scholar] [CrossRef]
- Kaushik, M.; Fraschini, C.; Chauve, G.; Putaux, J.-L.; Moores, A. Transmission Electron Microscopy for the Characterization of Cellulose Nanocrystals. Transm. Electron Microsc. Theory Appl. 2015. [Google Scholar] [CrossRef] [Green Version]
- Elazzouzi-hafraoui, S.; Nishiyama, Y.; Heux, L.; Dubreuil, F.; Rochas, C.; Putaux, J.-L. The Shape and Size Distribution of Crystalline Nanoparticles Prepared by Acid Hydrolysis of Native Cellulose The Shape and Size Distribution of Crystalline Nanoparticles Prepared by Acid Hydrolysis of Native Cellulose. Biomacromolecules 2008, 9, 57–65. [Google Scholar] [CrossRef]
- Fan, Z.; Advani, S.G. Characterization of orientation state of carbon nanotubes in shear flow. Polymer 2005, 46, 5232–5240. [Google Scholar] [CrossRef]
- Ching, Y.C.; Ershad Ali, M.; Abdullah, L.C.; Choo, K.W.; Kuan, Y.C.; Julaihi, S.J.; Chuah, C.H.; Liou, N.S. Rheological properties of cellulose nanocrystal-embedded polymer composites: A review. Cellulose 2016, 23, 1011–1030. [Google Scholar] [CrossRef]
- Ebeling, T.; Paillet, M.; Borsali, R.; Diat, O.; Dufresne, A.; Cavaill, J.Y.; Chanzy, H. Shear-induced orientation phenomena in suspensions of cellulose microcrystals, revealed by small angle X-ray scattering. Langmuir 1999, 15, 6123–6126. [Google Scholar] [CrossRef]
- Kadhom, M.; Hu, W.; Deng, B. Thin film nanocomposite membrane filled with metal-organic frameworks UiO-66 and MIL-125 nanoparticles for water desalination. Membranes 2017, 7, 31. [Google Scholar] [CrossRef] [PubMed]
- Yin, J.; Kim, E.S.; Yang, J.; Deng, B. Fabrication of a novel thin-film nanocomposite (TFN) membrane containing MCM-41 silica nanoparticles (NPs) for water purification. J. Membr. Sci. 2012, 423–424, 238–246. [Google Scholar] [CrossRef]
- Kadhom, M.; Yin, J.; Deng, B. A thin film nanocomposite membrane with MCM-41 silica nanoparticles for brackish water purification. Membranes 2016, 6, 50. [Google Scholar] [CrossRef] [PubMed]
- Foster, E.J.; Moon, R.J.; Agarwal, U.; Bortner, M.J.; Bras, J.; Camarero-Espinosa, S.; Chan, K.J.; Clift, M.J.D.; Cranston, E.D.; Eichorn, S.; et al. Current characterization methods for cellulose nanomaterials. Chem. Soc. Rev. 2018, 47, 2609–2679. [Google Scholar] [CrossRef] [PubMed]
- Saito, T.; Nishiyama, Y.; Putaux, J.L.; Vignon, M.; Isogai, A. Homogeneous suspensions of individualized microfibrils from TEMPO-catalyzed oxidation of native cellulose. Biomacromolecules 2006, 7, 1687–1691. [Google Scholar] [CrossRef]
- Schindelin, J.; Arganda-Carreras, I.; Frise, E.; Kaynig, V.; Longair, M.; Pietzsch, T.; Preibisch, S.; Rueden, C.; Saalfeld, S.; Schmid, B.; et al. Fiji: An open-source platform for biological-image analysis. Nat. Methods 2012, 9, 676–682. [Google Scholar] [CrossRef] [PubMed]
- Salminen, R.; Reza, M.; Pääkkönen, T.; Peyre, J.; Kontturi, E. TEMPO-mediated oxidation of microcrystalline cellulose: Limiting factors for cellulose nanocrystal yield. Cellulose 2017, 24, 1657–1667. [Google Scholar] [CrossRef]
- Fraschini, C.; Chauve, G.; Bouchard, J. TEMPO-mediated surface oxidation of cellulose nanocrystals (CNCs). Cellulose 2017, 24, 2775–2790. [Google Scholar] [CrossRef]
- Li, B.; Xu, W.; Kronlund, D.; Määttänen, A.; Liu, J.; Smått, J.H.; Peltonen, J.; Willför, S.; Mu, X.; Xu, C. Cellulose nanocrystals prepared via formic acid hydrolysis followed by TEMPO-mediated oxidation. Carbohydr. Polym. 2015, 133, 605–612. [Google Scholar] [CrossRef] [Green Version]
- Park, S.-J.; Choi, W.; Nam, S.-E.; Hong, S.; Lee, J.S.; Lee, J.-H. Fabrication of polyamide thin film composite reverse osmosis membranes via support-free interfacial polymerization. J. Membr. Sci. 2017, 526, 52–59. [Google Scholar] [CrossRef]
- Shin, D.H.; Kim, N.; Lee, Y.T. Modification to the polyamide TFC RO membranes for improvement of chlorine-resistance. J. Membr. Sci. 2011, 376, 302–311. [Google Scholar] [CrossRef]
- Moreau, C.; Villares, A.; Capron, I.; Cathala, B. Tuning supramolecular interactions of cellulose nanocrystals to design innovative functional materials. Ind. Crop. Prod. 2015, 93, 96–107. [Google Scholar] [CrossRef]
- Stinson-Bagby, K.L.; Roberts, R.; Foster, E.J. Effective cellulose nanocrystal imaging using transmission electron microscopy. Carbohydr. Polym. 2018, 186, 429–438. [Google Scholar] [CrossRef] [PubMed]
- Milosevic, M. Internal Reflection and ATR Spectroscopy; John Wiley & Sons, Inc.: Hoboken, NJ, USA, 2012. [Google Scholar] [CrossRef]
- Bui, N.N.; Lind, M.L.; Hoek, E.M.V.; McCutcheon, J.R. Electrospun nanofiber supported thin film composite membranes for engineered osmosis. J. Membr. Sci. 2011, 385–386, 10–19. [Google Scholar] [CrossRef]
- Tatsumi, M.; Teramoto, Y.; Nishio, Y. Different orientation patterns of cellulose nanocrystal films prepared from aqueous suspensions by shearing under evaporation. Cellulose 2015, 22, 2983–2992. [Google Scholar] [CrossRef]
- Uhlig, M.; Fall, A.; Wellert, S.; Lehmann, M.; Prévost, S.; Wågberg, L.; Von Klitzing, R.; Nyström, G. Two-Dimensional Aggregation and Semidilute Ordering in Cellulose Nanocrystals. Langmuir 2016, 32, 442–450. [Google Scholar] [CrossRef]
- Moon, R.J.; Martini, A.; Nairn, J.; Simonsen, J.; Youngblood, J. Cellulose nanomaterials review: Structure, properties and nanocomposites. Chem. Soc. Rev. 2011, 40, 3941–3994. [Google Scholar] [CrossRef]
- Ghosh, A.K.; Jeong, B.H.; Huang, X.; Hoek, E.M.V. Impacts of reaction and curing conditions on polyamide composite reverse osmosis membrane properties. J. Membr. Sci. 2008, 311, 34–45. [Google Scholar] [CrossRef]
- Xie, W.; Geise, G.M.; Freeman, B.D.; Lee, H.-S.; Byun, G.; McGrath, J.E. Polyamide interfacial composite membranes prepared from m-phenylene diamine, trimesoyl chloride and a new disulfonated diamine. J. Membr. Sci. 2012, 403, 152–161. [Google Scholar] [CrossRef]
- Dong, X.M.; Revol, J.-F.; Gray, D.G. Effect of microcrystallite preparation conditions on the formation of colloid crystals of cellulose. Cellulose 1998, 5, 19–32. [Google Scholar] [CrossRef]
- Hirose, M.; Ito, H.; Kamiyama, Y. Effect of skin layer surface structures on the flux behaviour of RO membranes. J. Membr. Sci. 1996, 121, 209–215. [Google Scholar] [CrossRef]


| Membrane | Polyamide Layer Thickness (nm) |
|---|---|
| Polyamide control (FT-30) | 360 ± 70 |
| TFN 0.5 mg CNCs | 310 ± 40 |
| TFN 0.5 mg TOCNs | 365 ± 70 |
© 2019 by the authors. Licensee MDPI, Basel, Switzerland. This article is an open access article distributed under the terms and conditions of the Creative Commons Attribution (CC BY) license (http://creativecommons.org/licenses/by/4.0/).
Share and Cite
Smith, E.D.; Hendren, K.D.; Haag, J.V., IV; Foster, E.J.; Martin, S.M. Functionalized Cellulose Nanocrystal Nanocomposite Membranes with Controlled Interfacial Transport for Improved Reverse Osmosis Performance. Nanomaterials 2019, 9, 125. https://doi.org/10.3390/nano9010125
Smith ED, Hendren KD, Haag JV IV, Foster EJ, Martin SM. Functionalized Cellulose Nanocrystal Nanocomposite Membranes with Controlled Interfacial Transport for Improved Reverse Osmosis Performance. Nanomaterials. 2019; 9(1):125. https://doi.org/10.3390/nano9010125
Chicago/Turabian StyleSmith, Ethan D., Keith D. Hendren, James V. Haag, IV, E. Johan Foster, and Stephen M. Martin. 2019. "Functionalized Cellulose Nanocrystal Nanocomposite Membranes with Controlled Interfacial Transport for Improved Reverse Osmosis Performance" Nanomaterials 9, no. 1: 125. https://doi.org/10.3390/nano9010125