Effects of Ultrasonic Dispersion Energy on the Preparation of Amorphous SiO2 Nanomaterials for In Vitro Toxicity Testing

 , , ,
, , ,
Abstract
:
1. Introduction
2. Materials and Methods
2.1. Materials
2.2. Preparation of Particle Suspensions by Ultrasonic Treatment
2.3. Sterility Testing
2.4. Measurement of Particle Size and Sedimentation
2.5. Cultivation of NR8383 Macrophages and Cell Culture Assays
2.6. Particle Size Determination under Cell Culture Conditions with Particle Tracking Analysis
2.7. Electron Microscopy of NR8383 Macrophages
2.8. Statistical Evaluation
3. Results and Discussion
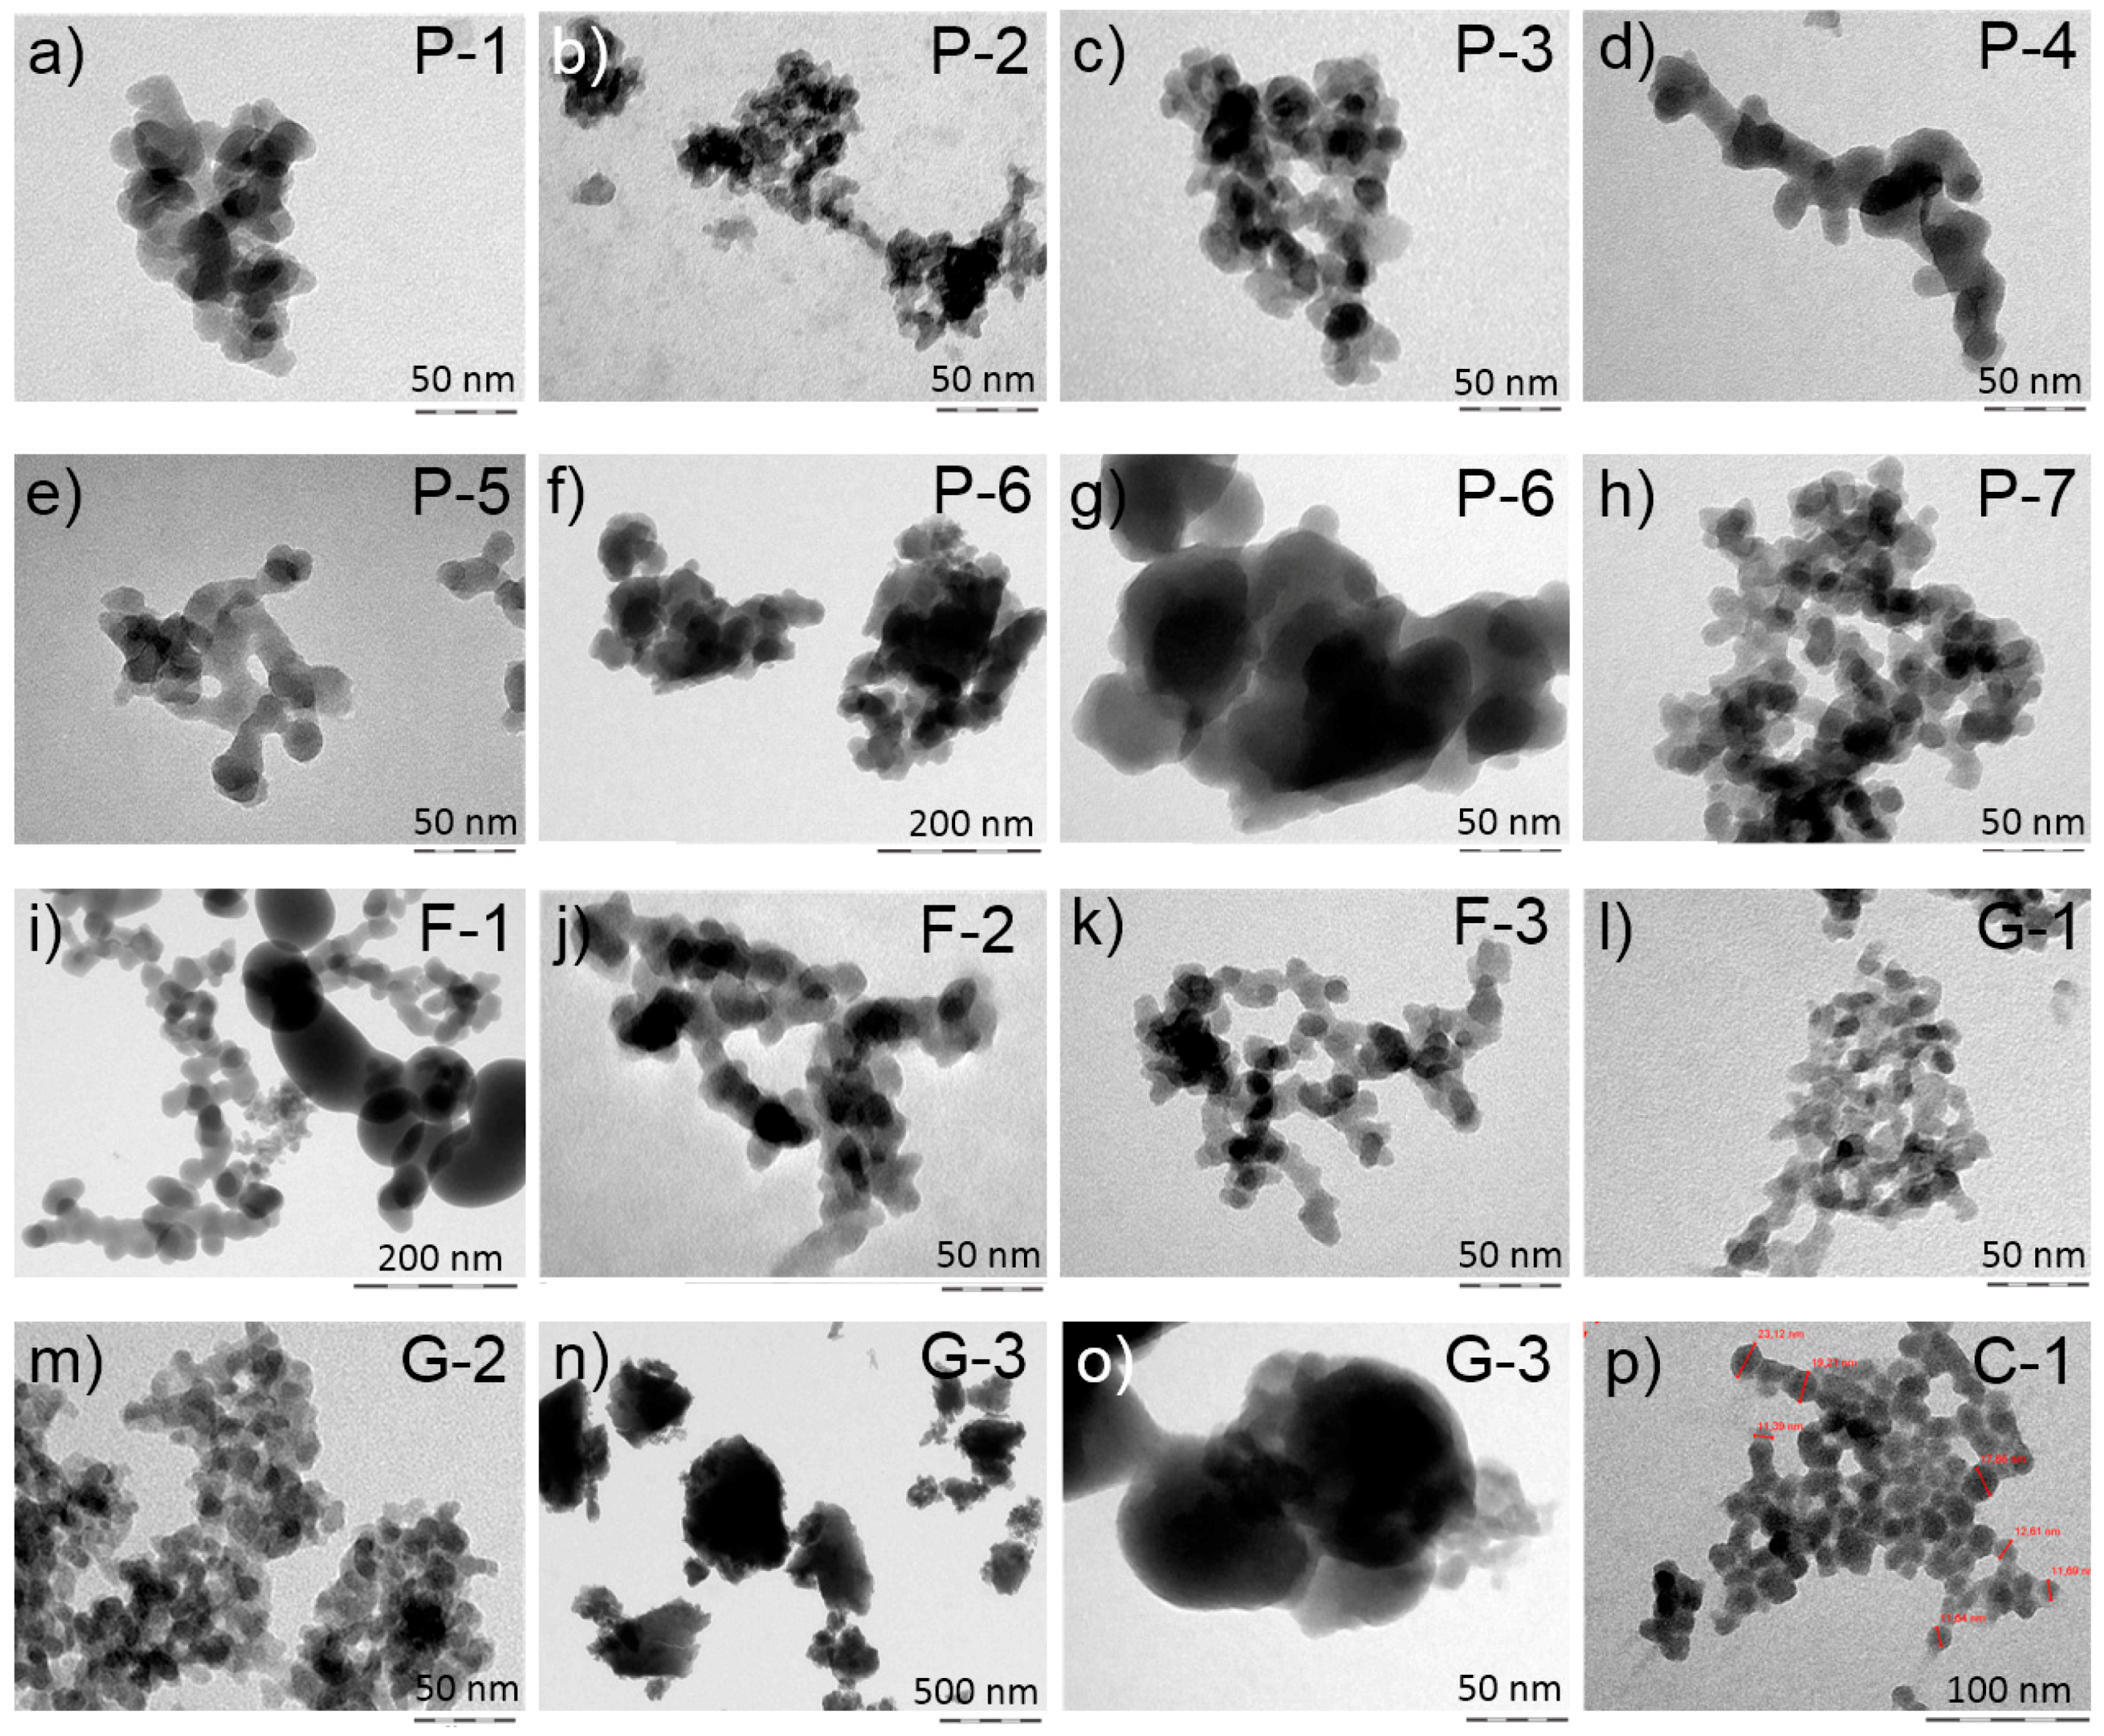
3.1. Particle Characterization
3.2. In Vitro Toxicity Determination of SAS
3.2.1. Precipitated SAS (PS)
In Vitro Test with NR8383 Macrophages
Particokinetics and Interpretation of In Vitro Findings
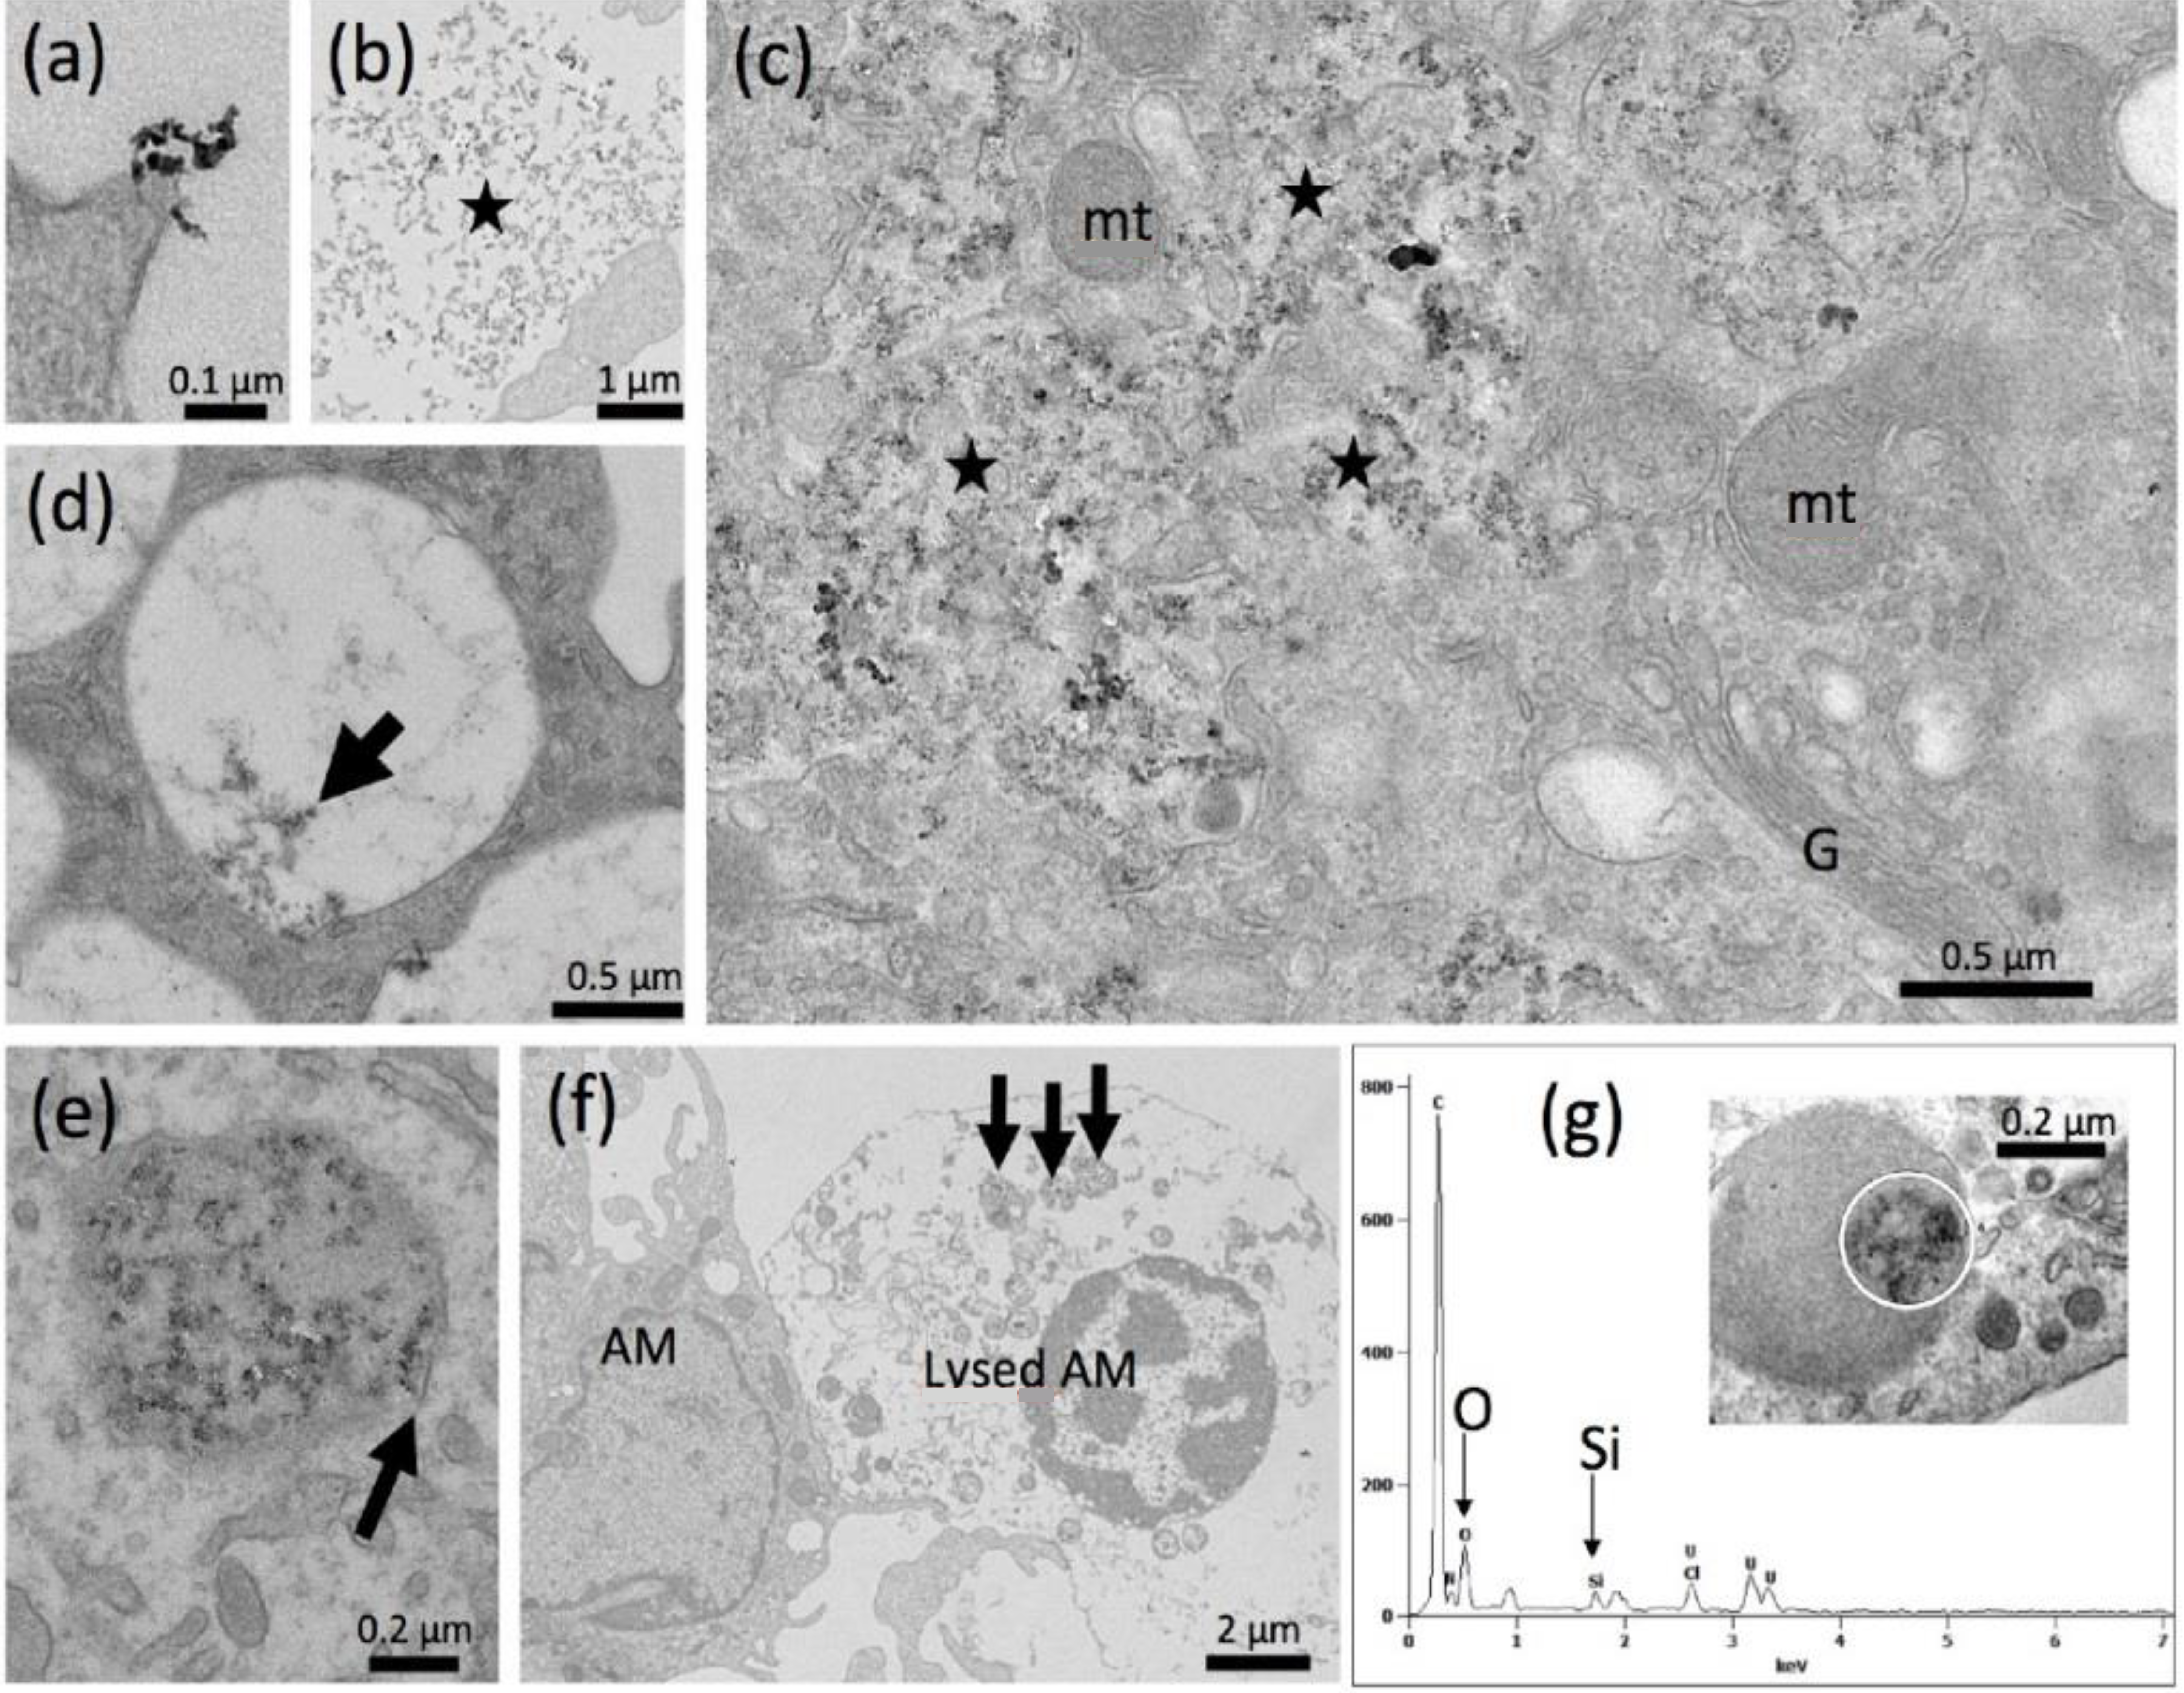
Electron Microscopy
3.2.2. Fumed Silica (FS)
In Vitro Test with NR8383 Macrophages
Particokinetics and Interpretation of In Vitro Findings
Electron Microscopy
3.2.3. Silica Gels (SG)
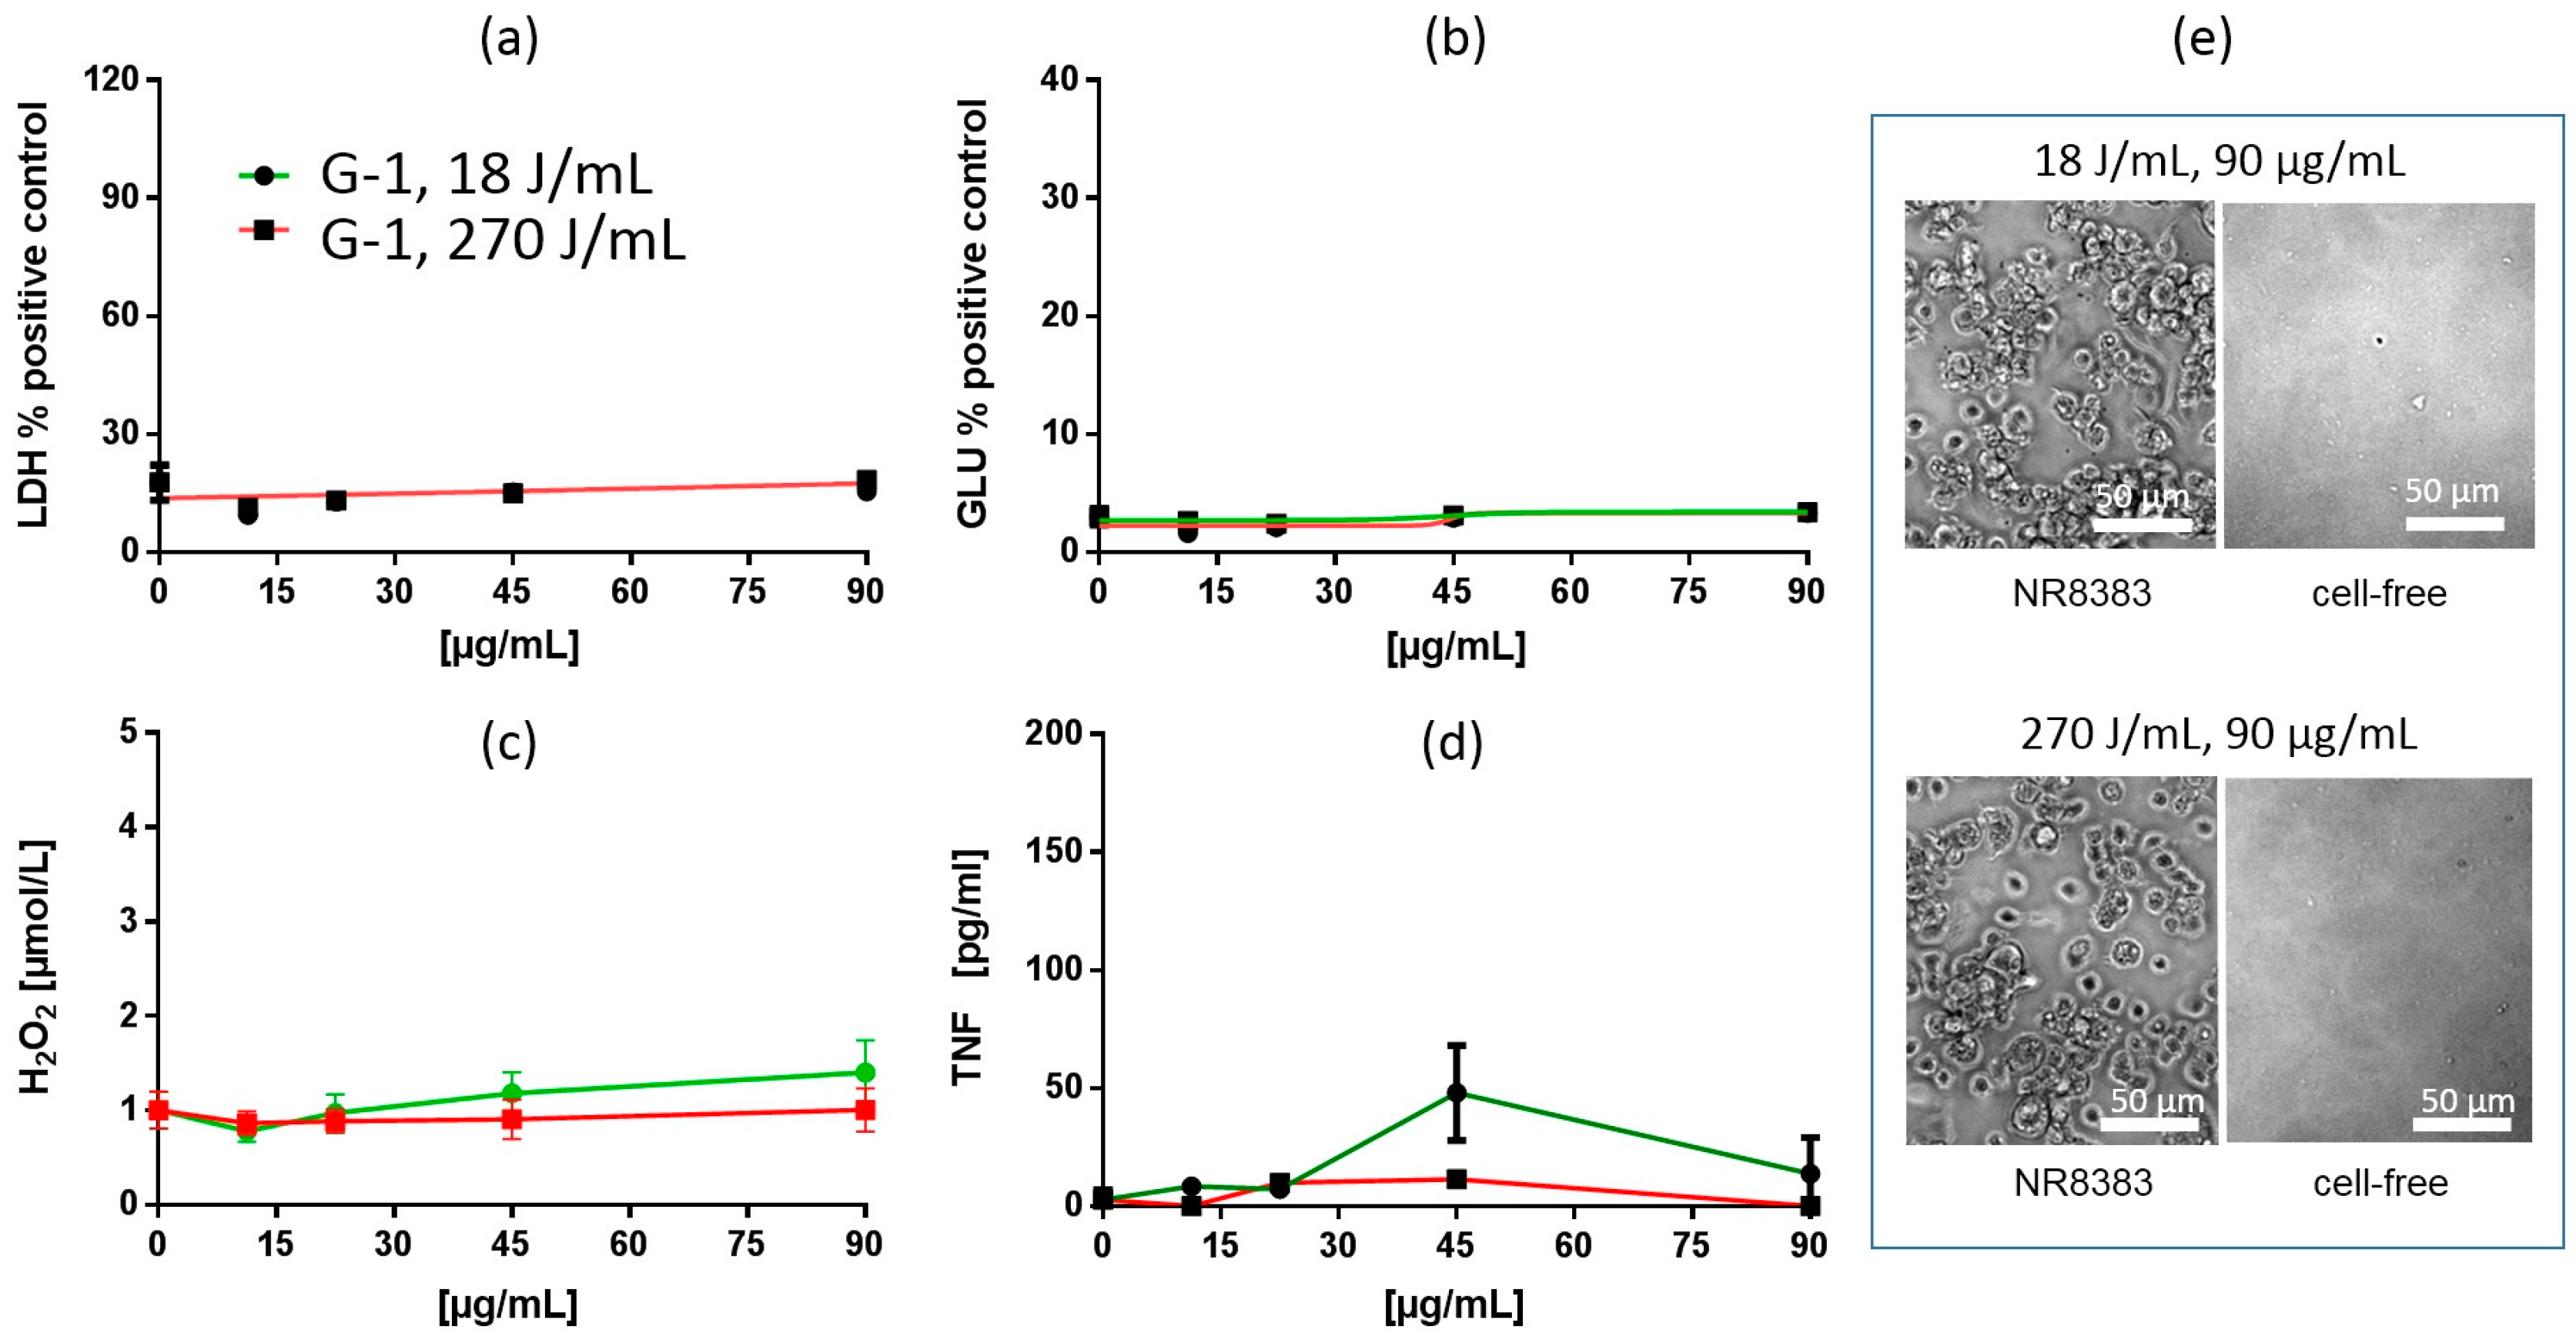
In Vitro Test with NR8383 Macrophages
Particokinetics and Interpretation of In Vitro Findings
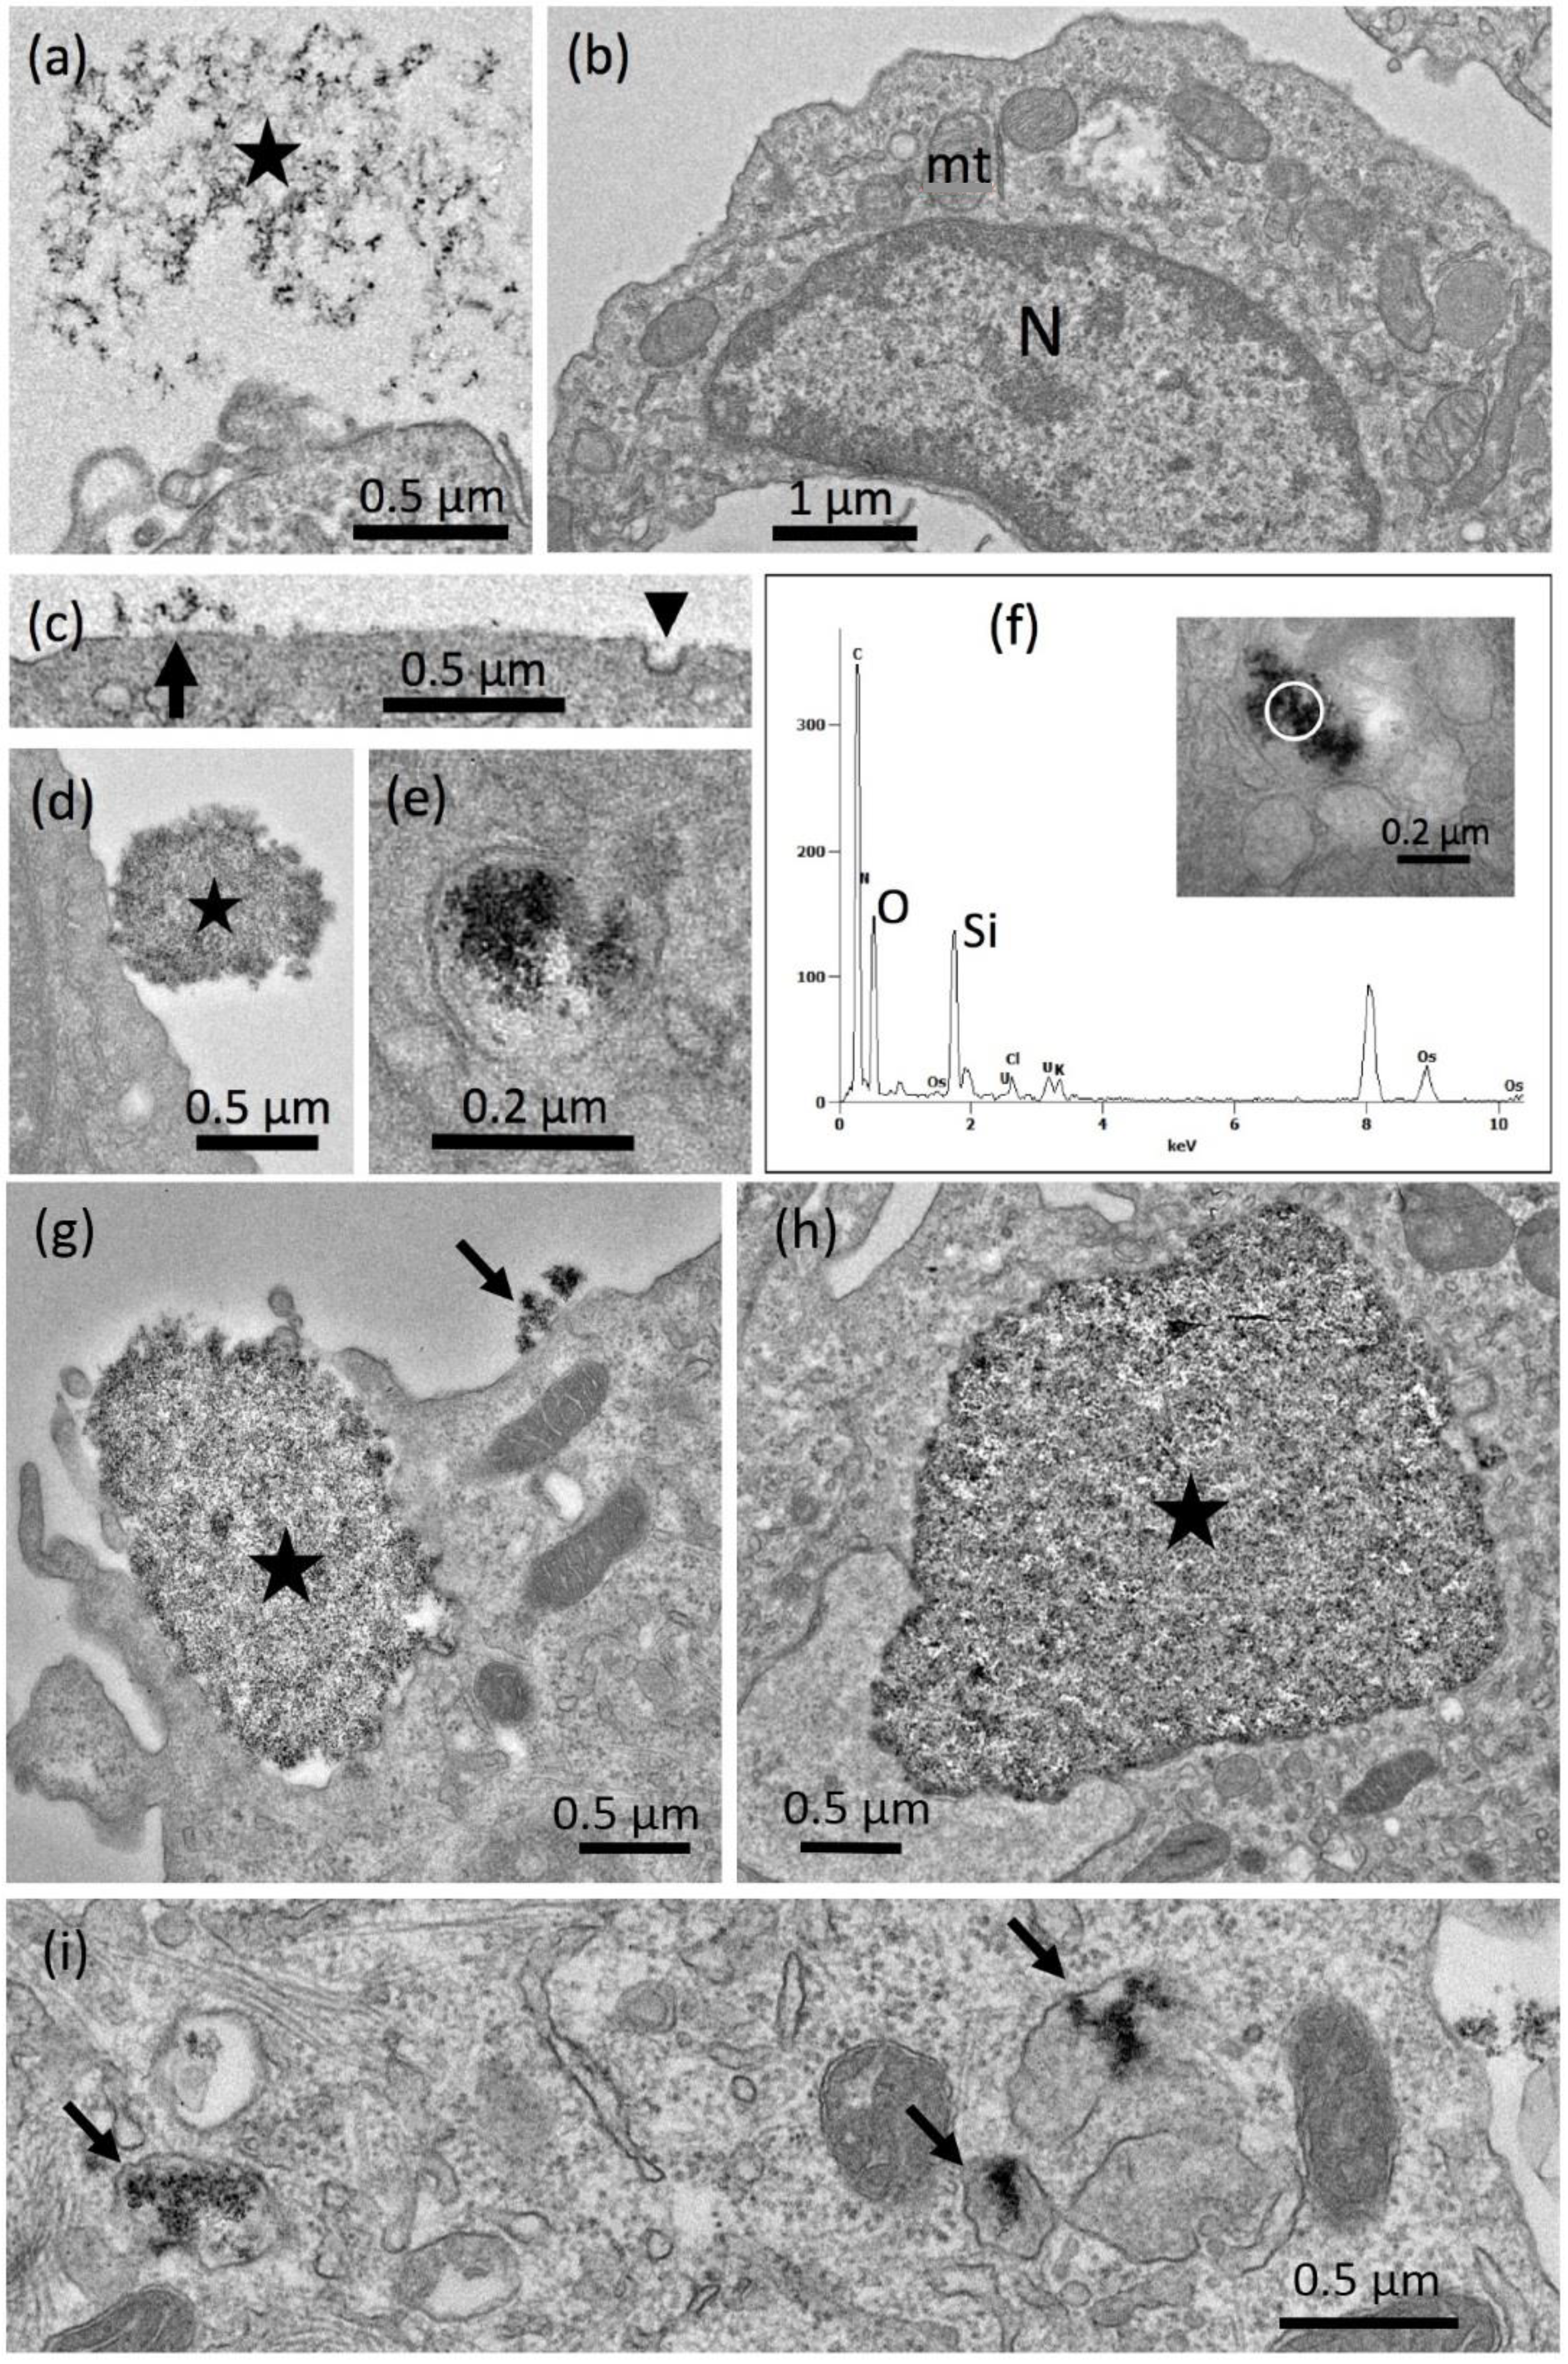
Electron Microscopy
3.2.4. Colloidal Synthetic Amorphous Silica (CS)
In Vitro Test with NR8383 Macrophages
Particokinetics and Interpretation of In Vitro Findings
Electron Microscopy of Colloidal SAS
3.3. General Discussion
3.3.1. Errors and Exactness of Measurements
3.3.2. Mechanisms of SAS Toxicity in Relation to Physico-Chemical Characterization
3.3.3. Mechanisms of SAS Toxicity in Relation to Ultrasonic Treatment
4. Conclusions
Supplementary Materials
Author Contributions
Funding
Acknowledgments
Conflicts of Interest
References
- Stark, W.J.; Stoessel, P.R.; Wohlleben, W.; Hafner, A. Industrial applications of nanoparticles. Chem. Soc. Rev. 2015, 44, 5793–5805. [Google Scholar] [CrossRef] [PubMed]
- Fruijtier-Pölloth, C. The toxicological mode of action and the safety of synthetic amorphous silica-a nanostructured material. Toxicology 2012, 294, 61–79. [Google Scholar] [CrossRef] [PubMed]
- Winkler, H.C.; Suter, M.; Naegeli, H. Critical review of the safety assessment of nano-structured silica additives in food. J. Nanobiotechnol. 2016, 14. [Google Scholar] [CrossRef] [PubMed]
- Retamal Marín, R.; Babick, F.; Lindner, G.-G.; Wiemann, M.; Stintz, M. Effects of Sample Preparation on Particle Size Distributions of Different Types of Silica in Suspensions. Nanomaterials 2018, 8, 454. [Google Scholar] [CrossRef] [PubMed]
- Dekkers, S.; Krystek, P.; Peters, R.J.B.; Lankveld, D.P.K.; Bokkers, B.G.H.; van Hoeven-Arentzen, P.H.; Bouwmeester, H.; Oomen, A.G. Presence and risks of nanosilica in food products. Nanotoxicology 2011, 5, 393–405. [Google Scholar] [CrossRef] [PubMed]
- Bagchi, D. (Ed.) Bio-nanotechnology: A Revolution in Food, Biomedical, and Health Sciences; Functional food science and technology series; Wiley-Blackwell: Chichester, West Sussex, UK; Ames, IA, USA, 2013; ISBN 978-0-470-67037-8. [Google Scholar]
- Froggett, S.J.; Clancy, S.F.; Boverhof, D.R.; Canady, R.A. A review and perspective of existing research on the release of nanomaterials from solid nanocomposites. Part. Fibre Toxicol. 2014, 11, 17. [Google Scholar] [CrossRef] [PubMed]
- Lorenz, C.; Von Goetz, N.; Scheringer, M.; Wormuth, M.; Hungerbühler, K. Potential exposure of German consumers to engineered nanoparticles in cosmetics and personal care products. Nanotoxicology 2011, 5, 12–29. [Google Scholar] [CrossRef] [PubMed]
- Napierska, D.; Thomassen, L.C.; Lison, D.; Martens, J.A.; Hoet, P.H. The nanosilica hazard: Another variable entity. Part. Fibre Toxicol. 2010, 7, 39. [Google Scholar] [CrossRef]
- Brinker, C.J.; Scherer, G.W. Sol-gel Science: The Physics and Chemistry of Sol-gel Processing; Academic Press: Boston, MA, USA, 1990; ISBN 978-0-12-134970-7. [Google Scholar]
- Babick, F. Suspensions of Colloidal Particles and Aggregates; Springer Berlin Heidelberg: New York, NY, USA, 2016; ISBN 978-3-319-30661-2. [Google Scholar]
- Taurozzi, J.S.; Hackley, V.A.; Wiesner, M.R. Ultrasonic dispersion of nanoparticles for environmental, health and safety assessment—issues and recommendations. Nanotoxicology 2011, 5, 711–729. [Google Scholar] [CrossRef]
- Landsiedel, R.; Ma-Hock, L.; Hofmann, T.; Wiemann, M.; Strauss, V.; Treumann, S.; Wohlleben, W.; Gröters, S.; Wiench, K.; van Ravenzwaay, B. Application of short-term inhalation studies to assess the inhalation toxicity of nanomaterials. Part. Fibre Toxicol. 2014, 11, 16. [Google Scholar] [CrossRef] [Green Version]
- Klein, C.L.; Wiench, K.; Wiemann, M.; Ma-Hock, L.; van Ravenzwaay, B.; Landsiedel, R. Hazard identification of inhaled nanomaterials: making use of short-term inhalation studies. Arch. Toxicol. 2012, 86, 1137–1151. [Google Scholar] [CrossRef] [PubMed]
- Morfeld, P.; Taeger, D.; Mitura, H.; Bosch, A.; Nordone, A.; Vormberg, R.; McCunney, R.; Merget, R. Cross-Sectional Study on Respiratory Morbidity in Workers After Exposure to Synthetic Amorphous Silica at Five German Production Plants: Exposure Assessment and Exposure Estimates. J. Occup. Environ. Med. 2014, 56, 72–78. [Google Scholar] [CrossRef] [PubMed]
- Stockmann-Juvala, H.; Hyytinen, E.; Taxell, P. Review on the Toxicity of Manufactured Nanomaterials Applied in the Construction Sector. Available online: http://scaffold.eu-vri.eu/filehandler.ashx?file=13721 (accessed on 18 December 2018).
- Taeger, D.; McCunney, R.; Bailer, U.; Barthel, K.; Küpper, U.; Brüning, T.; Morfeld, P.; Merget, R. Cross-Sectional Study on Nonmalignant Respiratory Morbidity due to Exposure to Synthetic Amorphous Silica. J. Occup. Environ. Med. 2016, 58, 376–384. [Google Scholar] [CrossRef] [PubMed]
- Landsiedel, R.; Sauer, U.G.; Ma-Hock, L.; Schnekenburger, J.; Wiemann, M. Pulmonary toxicity of nanomaterials: a critical comparison of published in vitro assays and in vivo inhalation or instillation studies. Nanomedicine 2014, 9, 2557–2585. [Google Scholar] [CrossRef] [PubMed]
- Arts, J.H.E.; Muijser, H.; Duistermaat, E.; Junker, K.; Kuper, C.F. Five-day inhalation toxicity study of three types of synthetic amorphous silicas in Wistar rats and post-exposure evaluations for up to 3 months. Food Chem. Toxicol. 2007, 45, 1856–1867. [Google Scholar] [CrossRef] [PubMed]
- Johnston, C.J.; Driscoll, K.E.; Finkelstein, J.N.; Baggs, R.; O’Reilly, M.A.; Carter, J.; Gelein, R.; Oberdörster, G. Pulmonary chemokine and mutagenic responses in rats after subchronic inhalation of amorphous and crystalline silica. Toxicol. Sci. 2000, 56, 405–413. [Google Scholar] [CrossRef] [PubMed]
- Murugadoss, S.; Lison, D.; Godderis, L.; Van Den Brule, S.; Mast, J.; Brassinne, F.; Sebaihi, N.; Hoet, P.H. Toxicology of silica nanoparticles: an update. Arch. Toxicol. 2017, 91, 2967–3010. [Google Scholar] [CrossRef] [Green Version]
- Burden, N.; Aschberger, K.; Chaudhry, Q.; Clift, M.J.D.; Doak, S.H.; Fowler, P.; Johnston, H.; Landsiedel, R.; Rowland, J.; Stone, V. The 3Rs as a framework to support a 21st century approach for nanosafety assessment. Nano Today 2017, 12, 10–13. [Google Scholar] [CrossRef]
- Nel, A.E.; Nasser, E.; Godwin, H.; Avery, D.; Bahadori, T.; Bergeson, L.; Beryt, E.; Bonner, J.C.; Boverhof, D.; Carter, J.; et al. A multi-stakeholder perspective on the use of alternative test strategies for nanomaterial safety assessment. ACS Nano 2013, 7, 6422–6433. [Google Scholar] [CrossRef]
- Rushton, E.K.; Jiang, J.; Leonard, S.S.; Eberly, S.; Castranova, V.; Biswas, P.; Elder, A.; Han, X.; Gelein, R.; Finkelstein, J.; Oberdörster, G. Concept of assessing nanoparticle hazards considering nanoparticle dosemetric and chemical/biological response metrics. J. Toxicol. Environ. Health Part A 2010, 73, 445–461. [Google Scholar] [CrossRef]
- Cho, W.-S.; Duffin, R.; Bradley, M.; Megson, I.L.; MacNee, W.; Lee, J.K.; Jeong, J.; Donaldson, K. Predictive value of in vitro assays depends on the mechanism of toxicity of metal oxide nanoparticles. Part. Fibre Toxicol. 2013, 10, 55. [Google Scholar] [CrossRef] [PubMed] [Green Version]
- Han, X.; Corson, N.; Wade-Mercer, P.; Gelein, R.; Jiang, J.; Sahu, M.; Biswas, P.; Finkelstein, J.N.; Elder, A.; Oberdörster, G. Assessing the relevance of in vitro studies in nanotoxicology by examining correlations between in vitro and in vivo data. Toxicology 2012, 297, 1–9. [Google Scholar] [CrossRef] [PubMed] [Green Version]
- Helmke, R.J.; Boyd, R.L.; German, V.F.; Mangos, J.A. From growth factor dependence to growth factor responsiveness: the genesis of an alveolar macrophage cell line. In Vitro Cell. Dev. Biol. 1987, 23, 567–574. [Google Scholar] [CrossRef] [PubMed]
- Helmke, R.J.; German, V.F.; Mangos, J.A. A continuous alveolar macrophage cell line: comparisons with freshly derived alveolar macrophages. In Vitro Cell. Dev. Biol. 1989, 25, 44–48. [Google Scholar] [CrossRef] [PubMed]
- Wiemann, M.; Vennemann, A.; Sauer, U.G.; Wiench, K.; Ma-Hock, L.; Landsiedel, R. An in vitro alveolar macrophage assay for predicting the short-term inhalation toxicity of nanomaterials. J. Nanobiotechnol. 2016, 14, 16. [Google Scholar] [CrossRef] [PubMed] [Green Version]
- Driscoll, K.E.; Higgins, J.M.; Leytart, M.J.; Crosby, L.L. Differential effects of mineral dusts on the in vitro activation of alveolar macrophage eicosanoid and cytokine release. Toxicol. In Vitro 1990, 4, 284–288. [Google Scholar] [CrossRef]
- Fels, A.O.; Cohn, Z.A. The alveolar macrophage. J. Appl. Physiol. 1986, 60, 353–369. [Google Scholar] [CrossRef]
- Rehn, B.; Rehn, S.; Bruch, J. Ein neues In Vitro-Prüfkonzept (Vektormodell) zum biologischen Screening und Monitoring der Lungentoxizität von Stäuben. Gefahrst. Reinhalt. Luft 1999, 59, 181–188. [Google Scholar]
- Hussell, T.; Bell, T.J. Alveolar macrophages: plasticity in a tissue-specific context. Nat. Rev. Immunol. 2014, 14, 81–93. [Google Scholar] [CrossRef]
- Albers, P.; Maier, M.; Reisinger, M.; Hannebauer, B.; Weinand, R. Physical boundaries within aggregates—Differences between amorphous, para-crystalline, and crystalline Structures. Cryst. Res. Technol. 2015, 50, 846–865. [Google Scholar] [CrossRef]
- Jensen, K.; Kembouche, Y.; Christiansen, E.; Jacobsen, N.; Wallin, H.; Guiot, C.; Spalla, O.; Witschger, O. The Generic NANOGENOTOX Dispersion Protocol: Final Protocol for Producing Suitable Manufactured Nanomaterial Exposure Media. Available online: https://www.anses.fr/en/system/files/nanogenotox _deliverable_5.pdf (accessed on 19 December 2018).
- Rasmussen, K.; Mech, A.; Mast, J.; de Temmerman, P.-J.; Waegeneers, N.; van Steen, F.; Pizzolon, J.C.; de Temmerman, L.; van Doren, E.; Jensen, K.A.; et al. Synthetic Amorphous Silicon Dioxide (NM-200, NM-201, NM-202, NM-203, NM-204): Characterisation and Physico-Chemical Properties; report EUR 26046; European Commission: Brussels, Belgium, 2013. [Google Scholar]
- Tantra, R. Nanomaterial Characterization: An Introduction; John Wiley & Sons, Inc.: Hoboken, NJ, USA, 2016; ISBN 978-1-118-75384-2. [Google Scholar]
- Pradhan, S.; Hedberg, J.; Blomberg, E.; Wold, S.; Odnevall Wallinder, I. Effect of sonication on particle dispersion, administered dose and metal release of non-functionalized, non-inert metal nanoparticles. J. Nanopart. Res. 2016, 18. [Google Scholar] [CrossRef] [PubMed] [Green Version]
- Taurozzi, J.S.; Hackley, V.A.; Wiesner, M.R. Preparation of Nanoparticle Dispersions from Powdered Material Using Ultrasonic Disruption - Version 1.1; National Institute of Standards and Technology: Gaithersburg, MD, USA, 2012. [Google Scholar]
- Bihari, P.; Vippola, M.; Schultes, S.; Praetner, M.; Khandoga, A.G.; Reichel, C.A.; Coester, C.; Tuomi, T.; Rehberg, M.; Krombach, F. Optimized dispersion of nanoparticles for biological in vitro and in vivo studies. Part. Fibre Toxicol. 2008, 5, 14. [Google Scholar] [CrossRef] [PubMed] [Green Version]
- Mandzy, N.; Grulke, E.; Druffel, T. Breakage of TiO2 agglomerates in electrostatically stabilized aqueous dispersions. Powder Technol. 2005, 160, 121–126. [Google Scholar] [CrossRef]
- Pohl, M.; Hogekamp, S.; Hoffmann, N.Q.; Schuchmann, H.P. Dispergieren und Desagglomerieren von Nanopartikeln mit Ultraschall. Chem. Ing. Tech. 2004, 76, 392–396. [Google Scholar] [CrossRef]
- Pohl, M.; Schuchmann, geb. Karbstein, H.P.; Schubert, H. Herstellung stabiler Dispersionen aus pyrogener Kieselsäure. Chem. Ing. Tech. 2005, 77, 258–262. [Google Scholar] [CrossRef]
- Frese, I.; Bantz, C.; Nolde, J.; Reisinger, M.; Heinemann, M.; Affolter, O. Streulichtanalyse zur Prüfung auf Nanopartikel-Fraktionen Erstes System zur kostengünstigen Vor-Ort-Überwachung. Sens.-Mag. 2016, 34–36. [Google Scholar]
- Brunauer, S.; Emmett, P.H.; Teller, E. Adsorption of Gases in Multimolecular Layers. J. Am. Chem. Soc. 1938, 60, 309–319. [Google Scholar] [CrossRef]
- Sears, G.W. Determination of Specific Surface Area of Colloidal Silica by Titration with Sodium Hydroxide. Anal. Chem. 1956, 28, 1981–1983. [Google Scholar] [CrossRef]
- Babick, F.; Stintz, M.; Koch, T. Standard characterisation method for the granulometric state of intensely dispersed pigments and fillers based on an interlaboratory performance study. Powder Technol. 2018, 338, 937–951. [Google Scholar] [CrossRef]
- Ullmann, C.; Babick, F.; Koeber, R.; Stintz, M. Performance of analytical centrifugation for the particle size analysis of real-world materials. Powder Technol. 2017, 319, 261–270. [Google Scholar] [CrossRef]
- Maguire, C.M.; Sillence, K.; Roesslein, M.; Hannell, C.; Suarez, G.; Sauvain, J.-J.; Capracotta, S.; Contal, S.; Cambier, S.; El Yamani, N.; et al. Benchmark of Nanoparticle Tracking Analysis on Measuring Nanoparticle Sizing and Concentration. J. Micro Nano-Manuf. 2017, 5, 041002. [Google Scholar] [CrossRef]
- Wiemann, M.; Sauer, U.; Vennemann, A.; Bäcker, S.; Keller, J.-G.; Ma-Hock, L.; Wohlleben, W.; Landsiedel, R. In Vitro and In Vivo Short-Term Pulmonary Toxicity of Differently Sized Colloidal Amorphous SiO2. Nanomaterials 2018, 8, 160. [Google Scholar] [CrossRef] [PubMed]
- Champion, J.A.; Walker, A.; Mitragotri, S. Role of Particle Size in Phagocytosis of Polymeric Microspheres. Pharm. Res. 2008, 25, 1815–1821. [Google Scholar] [CrossRef] [PubMed] [Green Version]
- Aderem, A.; Underhill, D.M. Mechanisms of phagocytosis in macrophages. Annu. Rev. Immunol. 1999, 17, 593–623. [Google Scholar] [CrossRef] [PubMed]
- Binnemars-Postma, K.A.; ten Hoopen, H.W.; Storm, G.; Prakash, J. Differential uptake of nanoparticles by human M1 and M2 polarized macrophages: protein corona as a critical determinant. Nanomedicine 2016, 11, 2889–2902. [Google Scholar] [CrossRef] [PubMed]
- Al-Rawi, M.; Diabaté, S.; Weiss, C. Uptake and intracellular localization of submicron and nano-sized SiO2 particles in HeLa cells. Arch. Toxicol. 2011, 85, 813–826. [Google Scholar] [CrossRef] [PubMed]
- Barrett, E.G.; Johnston, C.; Oberdörster, G.; Finkelstein, J.N. Silica Binds Serum Proteins Resulting in a Shift of the Dose-Response for Silica-Induced Chemokine Expression in an Alveolar Type II Cell Line. Toxicol. Appl. Pharmacol. 1999, 161, 111–122. [Google Scholar] [CrossRef] [PubMed]
- Panas, A.; Marquardt, C.; Nalcaci, O.; Bockhorn, H.; Baumann, W.; Paur, H.-R.; Mülhopt, S.; Diabaté, S.; Weiss, C. Screening of different metal oxide nanoparticles reveals selective toxicity and inflammatory potential of silica nanoparticles in lung epithelial cells and macrophages. Nanotoxicology 2012, 7, 259–273. [Google Scholar] [CrossRef]
- Fubini, B.; Zanetti, G.; Altilia, S.; Tiozzo, R.; Lison, D.; Saffiotti, U. Relationship between Surface Properties and Cellular Responses to Crystalline Silica: Studies with Heat-Treated Cristobalite. Chem. Res. Toxicol. 1999, 12, 737–745. [Google Scholar] [CrossRef]
- Turci, F.; Pavan, C.; Leinardi, R.; Tomatis, M.; Pastero, L.; Garry, D.; Anguissola, S.; Lison, D.; Fubini, B. Revisiting the paradigm of silica pathogenicity with synthetic quartz crystals: the role of crystallinity and surface disorder. Part. Fibre Toxicol. 2015, 13. [Google Scholar] [CrossRef]
- Li, Y.; Sun, L.; Jin, M.; Du, Z.; Liu, X.; Guo, C.; Li, Y.; Huang, P.; Sun, Z. Size-dependent cytotoxicity of amorphous silica nanoparticles in human hepatoma HepG2 cells. Toxicol. in Vitro 2011, 25, 1343–1352. [Google Scholar] [CrossRef] [PubMed]
- Mendoza, A.; Torres-Hernandez, J.A.; Ault, J.G.; Pedersen-Lane, J.H.; Gao, D.; Lawrence, D.A. Silica nanoparticles induce oxidative stress and inflammation of human peripheral blood mononuclear cells. Cell Stress Chaperon. 2014, 19, 777–790. [Google Scholar] [CrossRef] [PubMed] [Green Version]
- Gehrke, H.; Frühmesser, A.; Pelka, J.; Esselen, M.; Hecht, L.L.; Blank, H.; Schuchmann, H.P.; Gerthsen, D.; Marquardt, C.; Diabaté, S.; et al. In vitro toxicity of amorphous silica nanoparticles in human colon carcinoma cells. Nanotoxicology 2013, 7, 274–293. [Google Scholar] [CrossRef] [PubMed]
- Napierska, D.; Thomassen, L.C.J.; Vanaudenaerde, B.; Luyts, K.; Lison, D.; Martens, J.A.; Nemery, B.; Hoet, P.H.M. Cytokine production by co-cultures exposed to monodisperse amorphous silica nanoparticles: The role of size and surface area. Toxicol. Lett. 2012, 211, 98–104. [Google Scholar] [CrossRef] [PubMed]
- Parveen, A.; Rizvi, S.H.M.; Sushma; Mahdi, F.; Ahmad, I.; Singh, P.P.; Mahdi, A.A. Intranasal exposure to silica nanoparticles induces alterations in pro-inflammatory environment of rat brain: Involvement of oxidative stress. Toxicol. Ind. Health 2017, 33, 119–132. [Google Scholar] [CrossRef] [PubMed]
- Passagne, I.; Morille, M.; Rousset, M.; Pujalté, I.; L’Azou, B. Implication of oxidative stress in size-dependent toxicity of silica nanoparticles in kidney cells. Toxicology 2012, 299, 112–124. [Google Scholar] [CrossRef] [PubMed]
- Fritsch-Decker, S.; Marquardt, C.; Stoeger, T.; Diabaté, S.; Weiss, C. Revisiting the stress paradigm for silica nanoparticles: decoupling of the anti-oxidative defense, pro-inflammatory response and cytotoxicity. Arch. Toxicol. 2018, 92, 2163–2174. [Google Scholar] [CrossRef] [PubMed]
- Yang, M.; Jing, L.; Wang, J.; Yu, Y.; Cao, L.; Zhang, L.; Zhou, X.; Sun, Z. Macrophages participate in local and systemic inflammation induced by amorphous silica nanoparticles through intratracheal instillation. Int. J. Nanomed. 2016, 11, 6217–6228. [Google Scholar] [CrossRef] [Green Version]
- Schütz, I.; Lopez-Hernandez, T.; Gao, Q.; Puchkov, D.; Jabs, S.; Nordmeyer, D.; Schmudde, M.; Rühl, E.; Graf, C.M.; Haucke, V. Lysosomal Dysfunction Caused by Cellular Accumulation of Silica Nanoparticles. J. Biol. Chem. 2016, 291, 14170–14184. [Google Scholar] [CrossRef] [Green Version]
- Krętowski, R.; Kusaczuk, M.; Naumowicz, M.; Kotyńska, J.; Szynaka, B.; Cechowska-Pasko, M. The Effects of Silica Nanoparticles on Apoptosis and Autophagy of Glioblastoma Cell Lines. Nanomaterials 2017, 7, 230. [Google Scholar] [CrossRef]
- Li, R.; Ji, Z.; Qin, H.; Kang, X.; Sun, B.; Wang, M.; Chang, C.H.; Wang, X.; Zhang, H.; Zou, H.; Nel, A.E.; Xia, T. Interference in Autophagosome Fusion by Rare Earth Nanoparticles Disrupts Autophagic Flux and Regulation of an Interleukin-1β Producing Inflammasome. ACS Nano 2014, 8, 10280–10292. [Google Scholar] [CrossRef] [PubMed]
- Wei, F.; Wang, Y.; Luo, Z.; Li, Y.; Duan, Y. New findings of silica nanoparticles induced ER autophagy in human colon cancer cell. Sci. Rep. 2017, 7, 42591. [Google Scholar] [CrossRef] [PubMed] [Green Version]
- Wang, J.; Li, Y.; Duan, J.; Yang, M.; Yu, Y.; Feng, L.; Yang, X.; Zhou, X.; Zhao, Z.; Sun, Z. Silica nanoparticles induce autophagosome accumulation via activation of the EIF2AK3 and ATF6 UPR pathways in hepatocytes. Autophagy 2018, 14, 1185–1200. [Google Scholar] [CrossRef] [PubMed]
- Marquardt, C.; Fritsch-Decker, S.; Al-Rawi, M.; Diabaté, S.; Weiss, C. Autophagy induced by silica nanoparticles protects RAW264.7 macrophages from cell death. Toxicology 2017, 379, 40–47. [Google Scholar] [CrossRef] [PubMed]
- Hsiao, I.-L.; Gramatke, A.; Joksimovic, R.; Sokolowski, M.; Gradzielski, M.; Haase, A. Size and Cell Type Dependent Uptake of Silica Nanoparticles. J. Nanomed. Nanotechnol. 2014, 05. [Google Scholar] [CrossRef]
- Retamal Marín, R.R.; Babick, F.; Stintz, M. Ultrasonic dispersion of nanostructured materials with probe sonication—Practical aspects of sample preparation. Powder Technol. 2017, 318, 451–458. [Google Scholar] [CrossRef]


| Particle Name (Abbreviation) | BET 1) [m2/g] | CTAB 2) [m2/g] | DOA Number 3) [mL/100 g] | Sears Number 4) [mL/1.5 g] | pH 5) | Loss on Drying 6) [%] | Loss on Ignition 7) [%] | Zeta-Potential 8) [mV] | Point of Zero Charge 9) [pH] | Solubility 10) [mg/L] | Primary Particle Size by TEM 11) [nm] | Aggregate Size by TEM ECD 12) [NM] | Particle Size 13) Mean/d50 [μm] |
|---|---|---|---|---|---|---|---|---|---|---|---|---|---|
| SIPERNAT® 160 (P-1) | 180 | 178 | 268 | 11.1 | 6.1 | 4.0 | 6.5 | −53 | 1.8 | 112.1 | 12.2 ± 2.7 | 58.3 | 12.7/11.3 |
| SIPERNAT® 50 (P-2) | 460 | 326 | 285 | 16.3 | 6.3 | 5.9 | 10.7 | −21 | 2.4 | 113.9 | 3.1 ± 0.7 | 59.8 | 53.4/43.2 |
| Exp. Prec. 1 (P-3) | 255 | 255 | 349 | 14.1 | 7.0 | 5.4 | 10.1 | −37 | 2.3 | 103.0 | 13.2 ± 5.2 | 72.05 | 26.4/21.6 |
| Exp. Prec. 2 (P-4) | 170 | 141 | 233 | 13.4 | 6.9 | 6.5 | 10.1 | −70 | 1.8 | 89.4 | 19.3 ± 6.3 | 94.8 | 12.3/10.5 |
| SIPERNAT® 22 (P-5) | 180 | 176 | 213 | 12.9 | 6.5 | 6.1 | 10.2 | −39 | 2.2 | 109.4 | 10.0 ± 2.6 | 82.2 | 116.6/117.8 |
| Exp. Prec. 3 (P-6) | 40 | 37 | 92 | 5.0 | 6.7 | 3.8 | 6.9 | −35 | 2.1 | 112.3 | 63.8 ± 29.4 | 211.01 | 10.8/7.9 |
| ULTRASIL® 9100 (P-7) | 235 | 201 | 195 | 12.5 | 6.7 | 6.4 | 10.5 | −31 | 2.4 | 122.5 | 16.7 ± 4.0 | 126.1 | n.d. 14) |
| AEROSIL® OX50 (F-1) | 45 | 69 | 164 | 1.8 | 4.6 | <0.1 | 0.3 | −40 | 2.8 | 117.9 | 41.4 ± 18.3 | 233.7 | n.d. |
| AEROSIL® 200 F (F-2) | 210 | 226 | 294 | 8.0 | 4.2 | 0.4 | 0.7 | −27 | 2.6 | 194.0 | 13.5 ± 2.5 | 161.1 | n.d. |
| AEROSIL® 380 F (F-3) | 390 | 300 | 317 | 14.5 | 4.2 | 0.6 | 1.2 | −36 | 2.6 | 226.0 | 8.0 ± 2.7 | 101.9 | n.d. |
| Silca Gel 1 (G-1) | 720 | 170 | 279 | - | 3.6 | 1.5 | 8.0 | −29 | 2.8 | 94.2 | 4.9 ± 2.8 | 27.9 | 8.1/7.1 |
| Silca Gel 2 (G-2) | 340 | 348 | 287 | 11.8 | 7.5 | 5.0 | 8.3 | −31 | 2.2 | 107.6 | n.d. | 211.6 | 3.1/2.7 |
| Silca Gel 3 (G-3) | 295 | 331 | 84 | 10.6 | 3.6 | 4.1 | 7.3 | −28 | 2.6 | 194.5 | n.d. | 173.4 | 3.7/3.6 |
| Colloidal Silca (C-1) | 200 | n.d. | n.d. | n.d. | n.d. | n.d. | n.d. | −36 | 4.4 | n.d. | 15.0 | n.d. | n.d. |
| Particle Name | [μg/mL] | LDH [% of pos. Control] | GLU [% of pos. Control] | H2O2 [μmol/L] | TNF [pg/mL] | ||||
|---|---|---|---|---|---|---|---|---|---|
| 18 J/mL | 270 J/mL | 18 J/mL | 270 J/mL | 18 J/mL | 270 J/mL | 18 J/mL | 270 J/mL | ||
| SIPERNAT® 160 (P-1) | 0 | 17.72 ± 4.48 | 17.72 ± 4.48 | 3.02 ± 0.90 | 3.02 ± 0.90 | 0.93 ± 0.09 | 0.93 ± 0.09 | 2.72 ± 4.21 | 2.72 ± 4.21 |
| 11.25 | 31.34 ± 2.28 | 23.47 ± 2.78 | 7.19 ± 0.44 | 4.12 ± 0.33 | 1.17 ± 0.15 | 0.94 ± 0.12 | 8.56 ± 0.93 | 2.52 ± 0.64 | |
| 22.5 | 70.52 ± 1.98 | 85.58 ± 3.11 | 17.93 ± 0.25 | 21.17 ± 0.53 | 1.50 ± 0.29 | 1.08 ± 0.11 | 28.85 ± 1.43 | 33.13 ± 1.33 | |
| 45 | 91.21 ± 2.77 | 105.54 ± 4.65 | 28.72 ± 1.71 | 28.38 ± 0.93 | 1.97 ± 0.51 | 0.94 ± 0.17 | 43.16 ± 1.07 | 74.72 ± 4.32 | |
| 90 | 95.36 ± 3.81 | 96.75 ± 4.31 | 25.94 ± 1.80 | 25.93 ± 2.38 | 2.38 ± 0.60 | 0.66 ± 0.25 | 13.12 ± 2.62 | 15.66 ± 0.38 | |
| SIPERNAT® 50 (P-2) | 0 | 16.54 ± 2.04 | 16.54 ± 2.04 | 3.28 ± 1.31 | 3.28 ± 1.31 | 0.74 ± 0.06 | 0.74 ± 0.06 | 2.72 ± 4.21 | 2.72 ± 4.21 |
| 11.25 | 18.96 ± 1.16 | 15.02 ± 1.33 | 3.85 ± 0.24 | 2.62 ± 0.14 | 0.48 ± 0.07 | 0.78 ± 0.05 | 3.49 ± 3.82 | 10.25 ± 2.80 | |
| 22.5 | 31.80 ± 1.16 | 31.04 ± 2.36 | 6.91 ± 0.60 | 5.81 ± 0.38 | 0.98 ± 0.18 | 0.59 ± 0.10 | 5.86 ± 6.78 | 30.11 ± 0.75 | |
| 45 | 69.15 ± 3.92 | 75.60 ± 6.41 | 15.03 ± 1.16 | 19.76 ± 0.70 | 2.01 ± 0.40 | 1.20 ± 0.08 | 24.40 ± 5.67 | 77.28 ± 8.36 | |
| 90 | 83.27 ± 0.91 | 91.62 ± 3.61 | 20.28 ± 0.70 | 25.84 ± 0.52 | 3.57 ± 1.02 | 1.59 ± 0.37 | 28.39 ± 4.54 | 61.15 ± 5.21 | |
| Exp. Prec. 1 (P-3) | 0 | 16.54 ± 2.04 | 16.54 ± 2.04 | 3.28 ± 1.31 | 3.28 ± 1.31 | 0.74 ± 0.06 | 0.74 ± 0.06 | 2.72 ± 4.21 | 2.72 ± 4.21 |
| 11.25 | 22.75 ± 3.80 | 16.22 ± 2.86 | 4.34 ± 0.12 | 2.85 ± 0.12 | 0.77 ± 0.06 | 0.81 ± 0.07 | 4.94 ± 5.16 | 4.79 ± 5.01 | |
| 22.5 | 54.37 ± 4.79 | 64.41 ± 5.41 | 9.81 ± 0.50 | 13.75 ± 0.82 | 1.04 ± 0.16 | 0.71 ± 0.14 | 6.96 ± 5.44 | 57.96 ± 18.52 | |
| 45 | 95.91 ± 3.64 | 98.38 ± 3.66 | 25.26 ± 1.38 | 25.82 ± 0.68 | 1.79 ± 0.23 | 0.79 ± 0.15 | 54.26 ± 7.59 | 70.88 ± 10.12 | |
| 90 | 104.08 ± 3.92 | 103.36 ± 6.20 | 25.29 ± 1.16 | 30.36 ± 1.01 | 1.76 ± 0.42 | 0.94 ± 0.18 | 45.52 ± 11.88 | 67.10 ± 5.16 | |
| Exp. Prec. 2 (P-4) | 0 | 17.37 ± 6.04 | 16.47 ± 3.59 | 2.39 ± 0.48 | 2.14 ± 0.24 | 0.99 ± 0.09 | 1.00 ± 0.03 | 6.74 ± 2.37 | 0.70 ± 1.57 |
| 11.25 | 32.63 ± 0.31 | 28.44 ± 4.82 | 6.59 ± 0.79 | 4.81 ± 0.33 | 0.62 ± 0.45 | 0.66 ± 0.36 | 29.69 ± 1.81 | 9.02 ± 4.85 | |
| 22.5 | 84.07 ± 1.81 | 97.31 ± 2.76 | 21.20 ± 1.07 | 23.92 ± 0.45 | 1.02 ± 0.35 | 0.12 ± 0.19 | 36.88 ± 3.07 | 43.96 ± 5.71 | |
| 45 | 107.61 ± 1.37 | 105.62 ± 9.60 | 28.15 ± 1.14 | 28.84 ± 1.64 | 1.79 ± 0.44 | 0.19 ± 0.04 | 40.17 ± 11.90 | 33.69 ± 3.85 | |
| 90 | 92.57 ± 5.06 | 87.72 ± 3.98 | 25.59 ± 1.51 | 26.01 ± 1.80 | 2.34 ± 0.54 | 1.20 ± 0.32 | 19.05 ± 5.23 | 3.32 ± 0.82 | |
| SIPERNAT® 22 (P-5) | 0 | 18.38 ± 3.55 | 18.38 ± 3.55 | 2.69 ± 0.79 | 2.69 ± 0.79 | 0.66 ± 0.05 | 0.66 ± 0.05 | 1.09 ± 0.40 | 1.09 ± 0.40 |
| 11.25 | 24.87 ± 1.35 | 13.67 ± 0.98 | 4.32 ± 0.22 | 3.12 ± 0.16 | 0.53 ± 0.08 | 0.68 ± 0.11 | 4.49 ± 0.61 | 6.28 ± 0.93 | |
| 22.5 | 56.95 ± 5.61 | 67.32 ± 3.37 | 13.22 ± 0.91 | 14.40 ± 0.78 | 0.66 ± 0.14 | 0.47 ± 0.11 | 18.69 ± 1.09 | 48.10 ± 0.27 | |
| 45 | 101.68 ± 2.58 | 97.86 ± 3.06 | 27.08 ± 0.34 | 27.29 ± 0.66 | 1.36 ± 0.18 | 0.43 ± 0.13 | 53.68 ± 1.30 | 95.73 ± 11.95 | |
| 90 | 98.00 ± 1.50 | 98.25 ± 4.15 | 26.00 ± 0.22 | 28.59 ± 0.69 | 1.89 ± 0.27 | 0.92 ± 0.20 | 43.79 ± 1.33 | 73.25 ± 5.33 | |
| Exp. Prec. 3 (P-6) | 0 | 18.38 ± 3.55 | 18.38 ± 3.55 | 2.69 ± 0.79 | 2.69 ± 0.79 | 0.66 ± 0.05 | 0.66 ± 0.05 | 1.09 ± 0.40 | 1.09 ± 0.40 |
| 11.25 | 16.39 ± 2.06 | 14.59 ± 2.38 | 3.20 ± 0.22 | 2.55 ± 0.16 | 0.79 ± 0.11 | 0.70 ± 0.07 | 0.85 ± 0.49 | 3.36 ± 0.97 | |
| 22.5 | 17.52 ± 0.69 | 14.55 ± 1.09 | 4.14 ± 0.12 | 3.81 ± 0.11 | 0.70 ± 0.16 | 0.86 ± 0.06 | 4.40 ± 2.53 | 0.93 ± 0.46 | |
| 45 | 30.58 ± 0.49 | 31.23 ± 3.74 | 6.79 ± 0.21 | 6.49 ± 0.78 | 1.01 ± 0.13 | 0.91 ± 0.10 | 9.45 ± 3.69 | 22.82 ± 1.25 | |
| 90 | 56.48 ± 4.05 | 50.77 ± 14.52 | 14.63 ± 0.83 | 18.98 ± 3.23 | 1.32 ± 0.17 | 1.12 ± 0.06 | 33.03 ± 4.61 | 16.82 ± 6.99 | |
| ULTRASIL® 9100 (P-7) | 0 | 16.28 ± 2.32 | 16.28 ± 2.32 | 2.96 ± 0.51 | 2.96 ± 0.51 | 0.64 ± 0.06 | 0.64 ± 0.06 | 1.09 ± 0.40 | 1.09 ± 0.40 |
| 11.25 | 19.06 ± 1.27 | 16.65 ± 2.45 | 3.83 ± 0.17 | 3.42 ± 0.25 | 0.77 ± 0.11 | 0.76 ± 0.05 | 0.90 ± 1.38 | 2.05 ± 0.12 | |
| 22.5 | 41.03 ± 0.47 | 44.56 ± 7.93 | 10.07 ± 0.23 | 12.15 ± 1.36 | 0.66 ± 0.25 | 0.88 ± 0.08 | 17.90 ± 0.27 | 5.56 ± 0.33 | |
| 45 | 99.27 ± 1.69 | 101.62 ± 4.39 | 29.38 ± 0.60 | 30.64 ± 1.83 | 1.43 ± 0.32 | 1.01 ± 0.18 | 67.77 ± 6.03 | 161.59 ± 37.26 | |
| 90 | 101.74 ± 1.70 | 104.91 ± 6.60 | 27.08 ± 0.78 | 32.55 ± 0.78 | 1.12 ± 0.73 | 1.00 ± 0.21 | 73.29 ± 14.88 | 84.35 ± 11.28 | |
| AEROSIL® OX50 (F-1) | 0 | 17.37 ± 6.04 | 16.47 ± 3.59 | 2.39 ± 0.48 | 2.14 ± 0.24 | 0.99 ± 0.09 | 1.00 ± 0.03 | 6.74 ± 2.37 | 0.70 ± 1.57 |
| 11.25 | 13.29 ± 2.22 | 13.66 ± 0.58 | 1.89 ± 0.28 | 1.67 ± 0.10 | 0.08 ± 0.40 | 0.02 ± 0.19 | 57.56 ± 6.18 | 52.81 ± 2.43 | |
| 22.5 | 46.20 ± 5.31 | 29.23 ± 4.02 | 8.05 ± 0.86 | 3.60 ± 0.61 | 1.18 ± 0.62 | 0.76 ± 0.35 | 107.88 ± 22.71 | 113.81 ± 15.79 | |
| 45 | 101.31 ± 2.25 | 95.30 ± 6.10 | 30.97 ± 1.04 | 27.03 ± 1.18 | 0.85 ± 0.64 | 0.29 ± 0.38 | 98.99 ± 22.55 | 173.36 ± 7.10 | |
| 90 | 99.83 ± 4.76 | 93.81 ± 7.83 | 33.16 ± 1.53 | 31.15 ± 3.49 | 0.91 ± 0.64 | 0.11 ± 0.27 | 19.95 ± 1.61 | 45.55 ± 1.26 | |
| AEROSIL® 200 F (F-2) | 0 | 16.17 ± 2.56 | 14.48 ± 1.34 | 1.96 ± 0.19 | 2.15 ± 0.18 | 0.65 ± 0.10 | 0.65 ± 0.35 | 0.56 ± 1.67 | 1.85 ± 3.09 |
| 11.25 | 69.85 ± 3.91 | 62.47 ± 3.93 | 16.16 ± 1.39 | 14.09 ± 0.48 | 0.36 ± 0.08 | 0.12 ± 0.39 | 47.99 ± 4.48 | 38.25 ± 3.99 | |
| 22.5 | 107.20 ± 3.17 | 102.69 ± 0.62 | 29.04 ± 0.97 | 32.28 ± 0.84 | 0.77 ± 0.05 | 0.32 ± 0.37 | 101.55 ± 2.42 | 148.70 ± 14.48 | |
| 45 | 102.91 ± 2.83 | 105.01 ± 2.99 | 26.21 ± 1.13 | 32.43 ± 0.74 | 1.75 ± 0.10 | 0.82 ± 0.15 | 45.86 ± 4.85 | 68.39 ± 0.43 | |
| 90 | 98.75 ± 9.23 | 105.50 ± 7.97 | 23.61 ± 1.39 | 28.74 ± 0.89 | 3.54 ± 0.18 | 2.63 ± 0.25 | 30.77 ± 0.14 | 33.92 ± 6.19 | |
| AEROSIL® 380 F (F-3) | 0 | 16.17 ± 2.56 | 14.48 ± 1.34 | 1.96 ± 0.19 | 2.15 ± 0.18 | 0.65 ± 0.10 | 0.65 ± 0.35 | 0.56 ± 1.67 | 1.85 ± 3.09 |
| 11.25 | 53.86 ± 4.19 | 35.54 ± 4.71 | 10.88 ± 0.56 | 9.45 ± 0.48 | 0.43 ± 0.13 | 0.62 ± 0.61 | 39.02 ± 5.22 | 33.53 ± 0.51 | |
| 22.5 | 90.08 ± 3.57 | 93.39 ± 1.87 | 20.88 ± 1.65 | 23.02 ± 0.64 | 0.91 ± 0.20 | −0.01 ± 0.39 | 70.98 ± 0.36 | 97.19 ± 3.04 | |
| 45 | 103.77 ± 5.81 | 105.42 ± 5.13 | 23.32 ± 0.69 | 26.57 ± 0.70 | 3.21 ± 0.58 | 1.57 ± 1.38 | 56.25 ± 1.15 | 117.19 ± 2.00 | |
| 90 | 94.26 ± 4.74 | 114.29 ± 5.53 | 21.71 ± 0.71 | 24.91 ± 1.05 | 3.70 ± 0.23 | 0.90 ± 1.34 | 23.77 ± 8.34 | 3.41 ± 2.08 | |
| Silca Gel 1 (G-1) | 0 | 17.72 ± 4.48 | 17.72 ± 4.48 | 3.02 ± 0.90 | 3.02 ± 0.90 | 0.93 ± 0.09 | 0.93 ± 0.09 | 2.72 ± 4.21 | 2.72 ± 4.21 |
| 11.25 | 9.45 ± 1.20 | 11.33 ± 1.60 | 2.66 ± 0.18 | 1.61 ± 0.36 | 0.73 ± 0.05 | 0.81 ± 0.03 | 8.45 ± 2.05 | 0.04 ± 0.40 | |
| 22.5 | 12.83 ± 0.84 | 13.16 ± 1.64 | 2.41 ± 0.39 | 2.11 ± 0.35 | 1.08 ± 0.07 | 0.86 ± 0.06 | 7.31 ± 3.15 | 9.86 ± 3.27 | |
| 45 | 15.28 ± 0.82 | 14.92 ± 0.74 | 3.10 ± 0.30 | 2.90 ± 0.22 | 0.99 ± 0.07 | 0.98 ± 0.09 | 48.01 ± 20.13 | 11.38 ± 0.73 | |
| 90 | 15.47 ± 0.97 | 18.37 ± 1.92 | 3.40 ± 0.36 | 3.32 ± 0.21 | 1.49 ± 0.21 | 0.90 ± 0.13 | 13.72 ± 15.30 | 0.05 ± 0.87 | |
| Silca Gel 2 (G-2) | 0 | 17.37 ± 6.04 | 16.47 ± 3.59 | 2.39 ± 0.48 | 2.14 ± 0.24 | 0.99 ± 0.09 | 1.00 ± 0.03 | 6.74 ± 2.37 | 0.70 ± 1.57 |
| 11.25 | 14.58 ± 0.61 | 15.09 ± 1.13 | 2.57 ± 0.33 | 2.13 ± 0.13 | 1.08 ± 0.58 | 0.59 ± 0.37 | 3.30 ± 2.52 | 5.40 ± 3.50 | |
| 22.5 | 46.90 ± 4.29 | 45.49 ± 2.04 | 7.58 ± 0.65 | 5.87 ± 0.47 | 2.00 ± 0.62 | 1.09 ± 0.18 | 6.90 ± 8.81 | 16.58 ± 1.64 | |
| 45 | 98.36 ± 1.97 | 98.74 ± 4.41 | 22.83 ± 0.44 | 20.14 ± 0.34 | 2.58 ± 0.43 | 1.43 ± 0.17 | 55.51 ± 32.93 | 194.66 ± 3.91 | |
| 90 | 102.07 ± 3.96 | 101.71 ± 7.64 | 27.21 ± 0.84 | 25.83 ± 0.57 | 4.00 ± 0.53 | 1.96 ± 0.22 | 25.61 ± 2.66 | 15.08 ± 8.74 | |
| Silca Gel 3 (G-3) | 0 | 16.17 ± 2.56 | 14.48 ± 1.34 | 1.96 ± 0.19 | 2.15 ± 0.18 | 0.65 ± 0.10 | 0.65 ± 0.35 | 0.56 ± 1.67 | 1.85 ± 3.09 |
| 11.25 | 28.95 ± 5.99 | 30.99 ± 3.07 | 3.36 ± 0.75 | 3.90 ± 0.21 | 0.24 ± 0.07 | 0.13 ± 0.29 | 14.43 ± 5.20 | 18.69 ± 5.53 | |
| 22.5 | 86.50 ± 4.12 | 93.39 ± 1.35 | 13.21 ± 1.54 | 22.80 ± 1.66 | 0.76 ± 0.08 | 0.81 ± 0.48 | 12.61 ± 7.23 | 20.58 ± 7.85 | |
| 45 | 107.37 ± 3.98 | 92.33 ± 3.96 | 24.79 ± 0.68 | 25.92 ± 1.28 | 1.44 ± 0.13 | 0.41 ± 0.40 | 38.03 ± 11.77 | 26.80 ± 6.19 | |
| 90 | 91.04 ± 5.42 | 105.12 ± 7.87 | 24.61 ± 0.87 | 25.75 ± 0.85 | 1.28 ± 0.16 | 0.98 ± 0.49 | 7.06 ± 2.01 | 7.80 ± 7.24 | |
| Colloidal Silca (C-1) | 0 | 17.37 ± 6.04 | 16.47 ± 3.59 | 2.39 ± 0.48 | 2.14 ± 0.24 | 0.99 ± 0.09 | 1.00 ± 0.03 | 0.70 ± 1.57 | 6.74 ± 2.37 |
| 11.25 | 41.77 ± 2.82 | 37.78 ± 3.66 | 8.25 ± 1.29 | 4.90 ± 1.18 | 0.74 ± 0.60 | 0.55 ± 0.45 | 5.74 ± 1.53 | 2.83 ± 2.32 | |
| 22.5 | 54.30 ± 2.98 | 58.49 ± 2.05 | 11.61 ± 0.23 | 8.43 ± 0.75 | 0.59 ± 0.24 | 0.52 ± 0.15 | 22.19 ± 2.13 | 3.28 ± 2.99 | |
| 45 | 82.47 ± 2.60 | 88.31 ± 3.78 | 21.20 ± 0.22 | 17.20 ± 1.26 | 2.34 ± 0.63 | 0.85 ± 0.06 | 46.20 ± 12.09 | 27.68 ± 2.29 | |
| 90 | 103.84 ± 8.36 | 103.71 ± 12.16 | 28.12 ± 0.54 | 25.21 ± 1.27 | 2.72 ± 0.77 | 1.09 ± 0.04 | 1.49 ± 0.63 | 8.59 ± 2.09 | |
| Particle Name (Abbreviation) | Dispersion Energy | LDH | GLU | H2O2 | TNF | ||||||
|---|---|---|---|---|---|---|---|---|---|---|---|
| EC50 | Hill Slope | Goodness of Fit (R2) | LOEC [μg/mL], Level of Significance | EC50 | Hill Slope | Goodness of Fit (R2) | LOEC [μg/mL], Level of Significance | LOEC [μg/mL], Level of Significance | LOEC [μg/mL], Level of Significance | ||
| Corundum | 18 J/mL | - | - | - | ns | - | - | - | ns | 90 (***) | ns |
| Quartz DQ12 | 18 J/mL | 30.88 | 0.03 | 0.97 | 22.5 (***) | 43.39 | 0.03 | 0.9866 | 22.5 (***) | 90 (**) | 45 (***) |
| SIPERNAT® 160 (P-1) | 18 J/mL | 16.34 | 0.05 | 0.97 | 11.25 (***) | 19.22 | 0.09 | 0.97 | 11.25 (***) | 22.5 (*) | 22.5 (***) |
| 270 J/mL | 15.53 | 0.10 | 0.95 | 22.5 (***) | 19.04 | 0.17 | 0.98 | 22.5 (***) | ns | 22.5 (***) | |
| SIPERNAT® 50 (P-2) | 18 J/mL | 35.29 | 0.02 | 0.94 | 22.5 (***) | 35.23 | 0.04 | 0.99 | 22.5 (***) | 45 (***) | 45 (**) |
| 270 J/mL | 31.72 | 0.03 | 0.96 | 22.5 (***) | 36.25 | 0.06 | 0.99 | 22.5 (**) | 90 (***) | 22.5 (***) | |
| Exp. Prec. 1 (P-3) | 18 J/mL | 20.80 | 0.05 | 0.98 | 22.5 (***) | 26.50 | 0.10 | 0.99 | 22.5 (***) | 45 (***) | 45 (***) |
| 270 J/mL | 19.29 | 0.07 | 0.96 | 22.5 (***) | 24.20 | 0.10 | 0.98 | 22.5 (***) | ns | 22.5 (***) | |
| Exp. Prec. 2 (P-4) | 18 J/mL | 14.12 | 0.07 | 0.95 | 11.25 (***) | 17.28 | 0.11 | 0.99 | 11.25 (***) | 90 (***) | 11.25 (***) |
| 270 J/mL | 13.87 | 0.14 | 0.92 | 11.25 (***) | 16.79 | 0.16 | 0.98 | 11.25 (***) | ns | 22.5 (***) | |
| SIPERNAT® 22 (P-5) | 18 J/mL | 19.45 | 0.05 | 0.97 | 22.5 (***) | 23.53 | 0.10 | 1.00 | 22.5 (***) | 45 (**) | 22.5 (*) |
| 270 J/mL | 19.04 | 0.08 | 0.95 | 22.5 (***) | 22.93 | 0.14 | 1.00 | 22.5 (***) | ns | 22.5 (***) | |
| Exp. Prec. 3 (P-6) | 18 J/mL | 80.02 | 0.01 | 0.95 | 45 (***) | 56.74 | 0.03 | 0.99 | 45 (***) | 90 (**) | 90 (***) |
| 270 J/mL | 88.32 | 0.01 | 0.80 | 45 (***) | 57.11 | 0.04 | 0.96 | 45 (***) | ns | 45 (**) | |
| ULTRASIL® 9100 (P-7) | 18 J/mL | 23.99 | 0.05 | 0.97 | 22.5 (***) | 25.32 | 0.15 | 0.99 | 22.5 (***) | 45 (***) | 45 (***) |
| 270 J/mL | 23.25 | 0.05 | 0.96 | 22.5 (***) | 26.03 | 0.10 | 0.99 | 22.5 (***) | ns | 22.5 (*) | |
| Particle | Fluid | USD [J/mL] | Concentration [μg/mL] | Vsed [μm/s] | Vsed [mm/d] | Xcum [nm] | PDI - |
|---|---|---|---|---|---|---|---|
| P-1 | H2O | 18 | 485 | 0.584 | 50.49 | 720 | 0.55 |
| H2O | 270 | 485 | 0.041 | 3.52 | 318 | 0.25 | |
| F-12K | 18 | 485 | 0.11 | 9.51 | 768 | 0.45 | |
| F-12K | 270 | 485 | 0.033 | 2.83 | 316 | 0.33 | |
| P-2 | H2O | 18 | 625 | 1.083 | 93.59 | 695 | 0.64 |
| H2O | 270 | 625 | 0.68 | 58.73 | 487 | 0.43 | |
| F-12K | 18 | 625 | 1.041 | 89.96 | 656 | 0.74 | |
| F-12K | 270 | 625 | 0.535 | 46.19 | 473 | 0.43 | |
| F-1 | H2O | 18 | 985 | 0.0464 | 4.01 | 364 | 0.16 |
| H2O | 270 | 985 | 0.0228 | 1.97 | 257 | 0.09 | |
| F-12K | 18 | 985 | 0.0495 | 4.27 | 410 | 0.16 | |
| F-12K | 270 | 985 | 0.0255 | 2.2 | 260 | 0.13 | |
| F-2 | H2O | 18 | 755 | 0.0071 | 0.62 | 234 | 0.10 |
| H2O | 270 | 755 | 0.0033 | 0.28 | 177 | 0.12 | |
| F-12K | 18 | 755 | 0.0071 | 0.61 | 235 | 0.16 | |
| F-12K | 270 | 755 | 0.004 | 0.34 | 171 | 0.10 | |
| G-1 | H2O | 18 | 800 | 1.42 | 123.09 | 1512 | 0.89 |
| H2O | 270 | 800 | 1.35 | 116.33 | 1032 | 0.65 | |
| F-12K | 18 | 800 | 1.03 | 88.8 | 2244 | 0.92 | |
| F-12K | 270 | 800 | 1.21 | 104.27 | 1004 | 0.76 | |
| G-2 | H2O | 18 | 945 | 0.35 | 29.84 | 805 | 0.48 |
| H2O | 270 | 945 | 0.33 | 28.78 | 391 | 0.35 | |
| F-12K | 18 | 945 | 0.3 | 25.97 | 652 | 0.45 | |
| F-12K | 270 | 945 | 0.31 | 26.96 | 500 | 0.35 | |
| C-1 | H2O | n.m. | 5000 | 0.00024 | 0.021 | n.m. | n.m. |
| F-12K | n.m. | 5000 | 0.00026 | 0.023 | n.m. | n.m. |
| Particle Name (Abbreviation) | Fluid | USD [J/mL] | DF 1) | Particle Size in [nm] | ||||
|---|---|---|---|---|---|---|---|---|
| Mean | Mode | d10 | d50 | d90 | ||||
| SIPERNAT® 160 (P-1) | H2O | 18 | 20 | 200.6 ± 5.2 | 127.2 ± 0.2 | 114.4 ± 1.4 | 174.5 ± 5.5 | 308.2 ± 2.7 |
| H2O | 270 | 80 | 183.8 ± 4.0 | 135.4 ± 6.1 | 112.5 ± 0.6 | 154.0 ± 3.1 | 279.0 ± 14.8 | |
| F-12K | 18 | 60 | 134.0 ± 7.1 | 113.3 ± 3.1 | 78.5 ± 2.5 | 114.4 ± 6.3 | 212.1 ± 17.1 | |
| F-12K | 270 | 60 | 147.2 ± 5.9 | 102.6 ± 12.3 | 79.0 ± 1.7 | 116.3 ± 4.3 | 258.2 ± 15.7 | |
| SIPERNAT® 50 (P-2) | H2O | 18 | 30 | 180.6 ± 5.6 | 137.7 ± 10.9 | 104.0 ± 3.2 | 149.0 ± 4.4 | 288.9 ± 19.0 |
| H2O | 270 | 120 | 141.3 ± 1.5 | 105.0 ± 5.3 | 83.0 ± 0.8 | 118.5 ± 2.1 | 213.3 ± 5.3 | |
| F-12K | 18 | 1 | 190.8 ± 6.1 | 121.2 ± 6.6 | 103.4 ± 2.4 | 159.3 ± 2.7 | 325.7 ± 11.0 | |
| F-12K | 270 | 2 | 162.6 ± 6.9 | 113.7 ± 10.9 | 86.9 ± 0.4 | 130.4 ± 5.1 | 276.8 ± 20.5 | |
| Exp. Prec. 1 (P-3) | H2O | 18 | 50 | 148.6 ± 3.6 | 116.1 ± 9.6 | 88.8 ± 1.0 | 126.6 ± 3.4 | 225.9 ± 13.9 |
| H2O | 270 | 100 | 147.5 ± 3.3 | 97.5 ± 2.4 | 84.6 ± 1.4 | 124.3 ± 4.2 | 233.7 ± 13.9 | |
| F-12K | 18 | 1 | 197.8 ± 3.0 | 139.6 ± 14.6 | 101.9 ± 1.0 | 156.0 ± 5.0 | 370.9 ± 23.2 | |
| F-12K | 270 | 2 | 174.3 ± 3.4 | 122.9 ± 17.3 | 85.5 ± 4.3 | 144.0 ± 3.7 | 266.5 ± 13.9 | |
| Exp. Prec. 2 (P-4) | H2O | 18 | 60 | 150.1 ± 3.9 | 118.3 ± 4.0 | 92.2 ± 1.2 | 125.9 ± 1.5 | 225.7 ± 9.5 |
| H2O | 270 | 120 | 138.3 ± 2.2 | 93.3 ± 2.4 | 85 ± 1.0 | 119.7 ± 2.1 | 192.0 ± 6.0 | |
| F-12K | 18 | 24 | 151.0 ± 3.0 | 117.0 ± 10.9 | 89.2 ± 1.0 | 126.4 ± 2.7 | 245.5 ± 16.3 | |
| F-12K | 270 | 64 | 166.6 ± 4.1 | 125.7 ± 9.1 | 98.4 ± 2.9 | 137.1 ± 2.9 | 258.7 ± 29.0 | |
| SIPERNAT® 22 (P-5) | H2O | 18 | 240 | 158.0 ± 1.1 | 115.6 ± 3.1 | 98.8 ± 2.4 | 135.5 ± 2.1 | 226.5 ± 1.9 |
| H2O | 270 | 240 | 132.8 ± 3.2 | 103.5 ± 5.0 | 86.4 ± 2.1 | 115.6 ± 2.1 | 181.1 ± 11.8 | |
| F-12K | 18 | 20 | 104.3 ± 0.9 | 79.9 ± 2.6 | 51.0 ± 1.3 | 84.6 ± 1.4 | 164.3 ± 3.5 | |
| F-12K | 270 | 40 | 103.0 ± 1.9 | 73.9 ± 9.2 | 50.7 ± 1.5 | 80.9 ± 1.6 | 159.9 ± 6.2 | |
| Exp. Prec. 3 (P-6) | H2O | 18 | 10 | 216.6 ± 4.7 | 145.6 ± 6.8 | 128.7 ± 3.5 | 184.3 ± 5.2 | 338.2 ± 6.0 |
| H2O | 270 | 20 | 184.3 ± 4.0 | 138.1 ± 6.7 | 113.4 ± 2.3 | 156.4 ± 2.2 | 274.3 ± 21.9 | |
| F-12K | 18 | 20 | 99.5 ± 2.4 | 86.2 ± 15.6 | 59.0 ± 1.8 | 88.3 ± 6.7 | 142.1 ± 7.0 | |
| F-12K | 270 | 20 | 100.6 ± 2.8 | 82.0 ± 4.8 | 54.9 ± 1.6 | 86.4 ± 2.4 | 146.1 ± 6.2 | |
| ULTRASIL® 9100 (P-7) | H2O | 18 | 50 | 157.1 ± 5.5 | 115.4 ± 3.9 | 95.8 ± 3.2 | 134.0 ± 4.1 | 233.9 ± 7.1 |
| H2O | 270 | 100 | 137.0 ± 3.1 | 100.1 ± 3.7 | 85.1 ± 0.6 | 118.1 ± 2.3 | 196.4 ± 7.9 | |
| F-12K | 18 | 10 | 87.3 ± 1.9 | 70.5 ± 5.1 | 45.5 ± 2.3 | 69.5 ± 2.2 | 134.7 ± 14 | |
| F-12K | 270 | 10 | 101.5 ± 2.7 | 67.5 ± 2.0 | 53.7 ± 1.5 | 78.3 ± 0.8 | 144.2 ± 4.2 | |
| AEROSIL® OX50 (F-1) | H2O | 18 | 100 | 218.5 ± 2.2 | 160.2 ± 6.2 | 138.9 ± 0.7 | 201.2 ± 3.1 | 306.0 ± 3.3 |
| H2O | 270 | 100 | 166.4 ± 1.6 | 144.4 ± 14.5 | 112.2 ± 1.3 | 154.1 ± 2.8 | 220.7 ± 5.1 | |
| F-12K | 18 | 10 | 190.8 ± 0.6 | 150.2 ± 2.2 | 121.5 ± 1.8 | 172.8 ± 1.3 | 263.5 ± 2.8 | |
| F-12K | 270 | 10 | 164.4 ± 0.4 | 133.1 ± 9.2 | 109.1 ± 0.5 | 150.6 ± 0.5 | 224.2 ± 3.5 | |
| AEROSIL® 200 F (F-2) | H2O | 18 | 400 | 154.1 ± 2.2 | 120.2 ± 8.7 | 98.0 ± 2.2 | 137.8 ± 3.1 | 205.7 ± 6.1 |
| H2O | 270 | 800 | 137.1 ± 2.4 | 115.6 ± 4.9 | 88.7 ± 1.1 | 125.0 ± 1.7 | 188.1 ± 6.7 | |
| F-12K | 18 | 100 | 134.9 ± 1.7 | 116.1 ± 3.0 | 76.7 ± 2.1 | 118.8 ± 0.4 | 194.9 ± 6.3 | |
| F-12K | 270 | 200 | 116.3 ± 1.8 | 102.0 ± 10.6 | 62.5 ± 4.5 | 109.2 ± 2.3 | 164.4 ± 5.0 | |
| AEROSIL® 380 F (F-3) | H2O | 18 | 400 | 141.0 ± 0.9 | 116.9 ± 11.4 | 89.5 ± 1.0 | 127.9 ± 0.3 | 194.7 ± 1.2 |
| H2O | 270 | 400 | 123.5 ± 1.4 | 106.0 ± 3.7 | 80.8 ± 1.6 | 110.4 ± 0.4 | 167.3 ± 3.6 | |
| F-12K | 18 | 2 | 177.3 ± 1.9 | 152.0 ± 7.4 | 115.1 ± 3.3 | 161.2 ± 0.3 | 247.9 ± 6.3 | |
| F-12K | 270 | 4 | 156.4 ± 1.6 | 118.7 ± 3.0 | 101.6 ± 1.9 | 139.8 ± 3.7 | 218.9 ± 4.4 | |
| Silica Gel 1 (G-1) | H2O | 18 | 5 | 209.7 ± 6.5 | 145.9 ± 9.1 | 130.0 ± 5.1 | 190.9 ± 5.5 | 302.6 ± 10.9 |
| H2O | 270 | 5 | 185.3 ± 6.9 | 158.3 ± 18.2 | 108.9 ± 2.1 | 167.4 ± 8.1 | 278.9 ± 17.2 | |
| F-12K | 18 | 1 | 212.9 ± 13.1 | 175.0 ± 33.2 | 123.2 ± 1.2 | 200.6 ± 15.5 | 316.5 ± 42.6 | |
| F-12K | 270 | 1 | 189.6 ± 11.9 | 143.0 ± 9.3 | 114.6 ± 8.6 | 162.1 ± 2.0 | 285.8 ± 32.6 | |
| Silica Gel 2 (G-2) | H2O | 18 | 20 | 247.9 ± 5.2 | 158.9 ± 17.5 | 133.5 ± 4.6 | 219.9 ± 2.3 | 392.0 ± 12.4 |
| H2O | 270 | 40 | 196.1 ± 0.5 | 148.2 ± 7.7 | 110.4 ± 2.9 | 164.4 ± 3.8 | 310.1 ± 7.1 | |
| F-12K | 18 | 1 | 251.3 ± 3.8 | 155.4 ± 4.0 | 138.5 ± 5.4 | 217.3 ± 5.2 | 410.0 ± 2.1 | |
| F-12K | 270 | 2 | 201.1 ± 7.3 | 135.7 ± 6.2 | 113.6 ± 2.4 | 170.4 ± 6.3 | 323.4 ± 21.2 | |
| Silica Gel 3 (G-3) | H2O | 18 | 80 | 154.1 ± 4.6 | 119.6 ± 7.3 | 81.9 ± 3.4 | 124.8 ± 4.4 | 255.7 ± 5.3 |
| H2O | 270 | 80 | 139.7 ± 1.2 | 100.9 ± 3.3 | 79.8 ± 1.2 | 118.5 ± 2.1 | 200.6 ± 3.0 | |
| F-12K | 18 | 16 | 118.4 ± 3.4 | 104.3 ± 7.1 | 65.5 ± 0.9 | 100.5 ± 4.9 | 185.7 ± 3.7 | |
| F-12K | 270 | 32 | 122.2 ± 4.6 | 82.4 ± 6.4 | 67.2 ± 2.1 | 102.0 ± 4.4 | 187.8 ± 17.3 | |
| Colloidal Silica (C-1) | H2O | 18 | 1 | 166.2 ± 11.7 | 105.3 ± 14 | 84.0 ± 6.3 | 145.5 ± 21.9 | 291.3 ± 41.4 |
| H2O | 270 | 1 | 136.5 ± 3.1 | 119.6 ± 12.3 | 78.3 ± 3.9 | 124.5 ± 1.2 | 195.3 ± 7.2 | |
| F-12K | 18 | 1 | 95.5 ± 15.4 | 75.8 ± 10.5 | 18.9 ± 6.9 | 93.1 ± 9.4 | 162.5 ± 33.8 | |
| F-12K | 270 | 8 | 78.8 ± 5.6 | 62.7 ± 4.5 | 41.3 ± 14.5 | 60.6 ± 4.2 | 128.7 ± 11.6 | |
| Particle Name (Abbreviation) | Dispersion Energy | LDH | GLU | H2O2 | TNF | ||||||
|---|---|---|---|---|---|---|---|---|---|---|---|
| EC50 | Hill Slope | Goodness of Fit (R2) | LOEC [μg/mL], Level of Significance | EC50 | Hill Slope | Goodness of Fit (R2) | LOEC [μg/mL], Level of Significance | LOEC [μg/mL], Level of Significance | LOEC [μg/mL], Level of Significance | ||
| AEROSIL® OX50 (F-1) | 18 J/mL | 23.19 | 0.06 | 0.96 | 22.5 (***) | 30.26 | 0.08 | 1.00 | 22.5 (***) | ns | 11.25 (***) |
| 270 J/mL | 27.70 | 0.05 | 0.95 | 22.5 (***) | 36.35 | 0.09 | 0.99 | 45 (***) | ns | 11.25 (***) | |
| AEROSIL® 200 F (F-2) | 18 J/mL | 7.35 | 0.11 | 0.95 | 11.25 (***) | 10.02 | 0.10 | 0.93 | 11.25 (***) | 45 (***) | 11.25 (***) |
| 270 J/mL | 8.62 | 0.10 | 0.97 | 11.25 (***) | 12.53 | 0.10 | 0.97 | 11.25 (***) | 90 (***) | 11.25 (***) | |
| AEROSIL® 380 F (F-3) | 18 J/mL | 10.12 | 0.07 | 0.98 | 11.25 (***) | 12.33 | 0.13 | 0.99 | 11.25 (***) | 45 (***) | 11.25 (***) |
| 270 J/mL | 13.20 | 0.10 | 0.96 | 11.25 (***) | 13.99 | 0.12 | 0.99 | 11.25 (***) | 45 (***) | 11.25 (***) | |
| Silca Gel 1 (G-1) | 18 J/mL | n.d | n.s. | n.d | n.s. | 90 (*) | 45 (***) | ||||
| 270 J/mL | n.d | n.s. | n.d | n.s. | n.s. | n.s. | |||||
| Silca Gel 2 (G-2) | 18 J/mL | 14.63 | 0.05 | 0.97 | 22.5 (***) | 33.14 | 0.06 | 1.00 | 22.5 (***) | 22.5 (*) | 45 (***) |
| 270 J/mL | 13.89 | 0.05 | 0.97 | 22.5 (***) | 36.46 | 0.06 | 1.00 | 22.5 (***) | 90 (*) | 22.5 (*) | |
| Silca Gel 3 (G-3) | 18 J/mL | 19.40 | 0.09 | 0.97 | 11.25 (**) | 22.78 | 0.10 | 0.99 | 22.5 (***) | ns | 45 (***) |
| 270 J/mL | 18.31 | 0.11 | 0.95 | 11.25 (***) | 17.68 | 0.17 | 0.99 | 22.5 (***) | ns | 11.25 (*) | |
| Colloidal Silca (C-1) | 18 J/mL | 19.40 | 0.03 | 0.97 | 11.25 (**) | 30.92 | 0.03 | 0.98 | 11.25 (***) | 45 (***) | 22.5 (**) |
| 270 J/mL | 18.31 | 0.04 | 0.97 | 11.25 (***) | 37.15 | 0.04 | 0.98 | 11.25 (**) | ns | 45 (**) | |
© 2018 by the authors. Licensee MDPI, Basel, Switzerland. This article is an open access article distributed under the terms and conditions of the Creative Commons Attribution (CC BY) license (http://creativecommons.org/licenses/by/4.0/).
Share and Cite
Wiemann, M.; Vennemann, A.; Stintz, M.; Retamal Marín, R.R.; Babick, F.; Lindner, G.-G.; Schuster, T.B.; Brinkmann, U.; Krueger, N. Effects of Ultrasonic Dispersion Energy on the Preparation of Amorphous SiO2 Nanomaterials for In Vitro Toxicity Testing. Nanomaterials 2019, 9, 11. https://doi.org/10.3390/nano9010011
Wiemann M, Vennemann A, Stintz M, Retamal Marín RR, Babick F, Lindner G-G, Schuster TB, Brinkmann U, Krueger N. Effects of Ultrasonic Dispersion Energy on the Preparation of Amorphous SiO2 Nanomaterials for In Vitro Toxicity Testing. Nanomaterials. 2019; 9(1):11. https://doi.org/10.3390/nano9010011
Chicago/Turabian StyleWiemann, Martin, Antje Vennemann, Michael Stintz, Rodrigo R. Retamal Marín, Frank Babick, Gottlieb-Georg Lindner, Tobias B. Schuster, Ulrich Brinkmann, and Nils Krueger. 2019. "Effects of Ultrasonic Dispersion Energy on the Preparation of Amorphous SiO2 Nanomaterials for In Vitro Toxicity Testing" Nanomaterials 9, no. 1: 11. https://doi.org/10.3390/nano9010011
APA StyleWiemann, M., Vennemann, A., Stintz, M., Retamal Marín, R. R., Babick, F., Lindner, G.-G., Schuster, T. B., Brinkmann, U., & Krueger, N. (2019). Effects of Ultrasonic Dispersion Energy on the Preparation of Amorphous SiO2 Nanomaterials for In Vitro Toxicity Testing. Nanomaterials, 9(1), 11. https://doi.org/10.3390/nano9010011