Toward Accurate Quantitative Elasticity Mapping of Rigid Nanomaterials by Atomic Force Microscopy: Effect of Acquisition Frequency, Loading Force, and Tip Geometry


Abstract
:1. Introduction
2. Materials and Methods
2.1. Materials
2.2. AFM Setup and Operation
2.3. Data Analysis
3. Results and Discussion
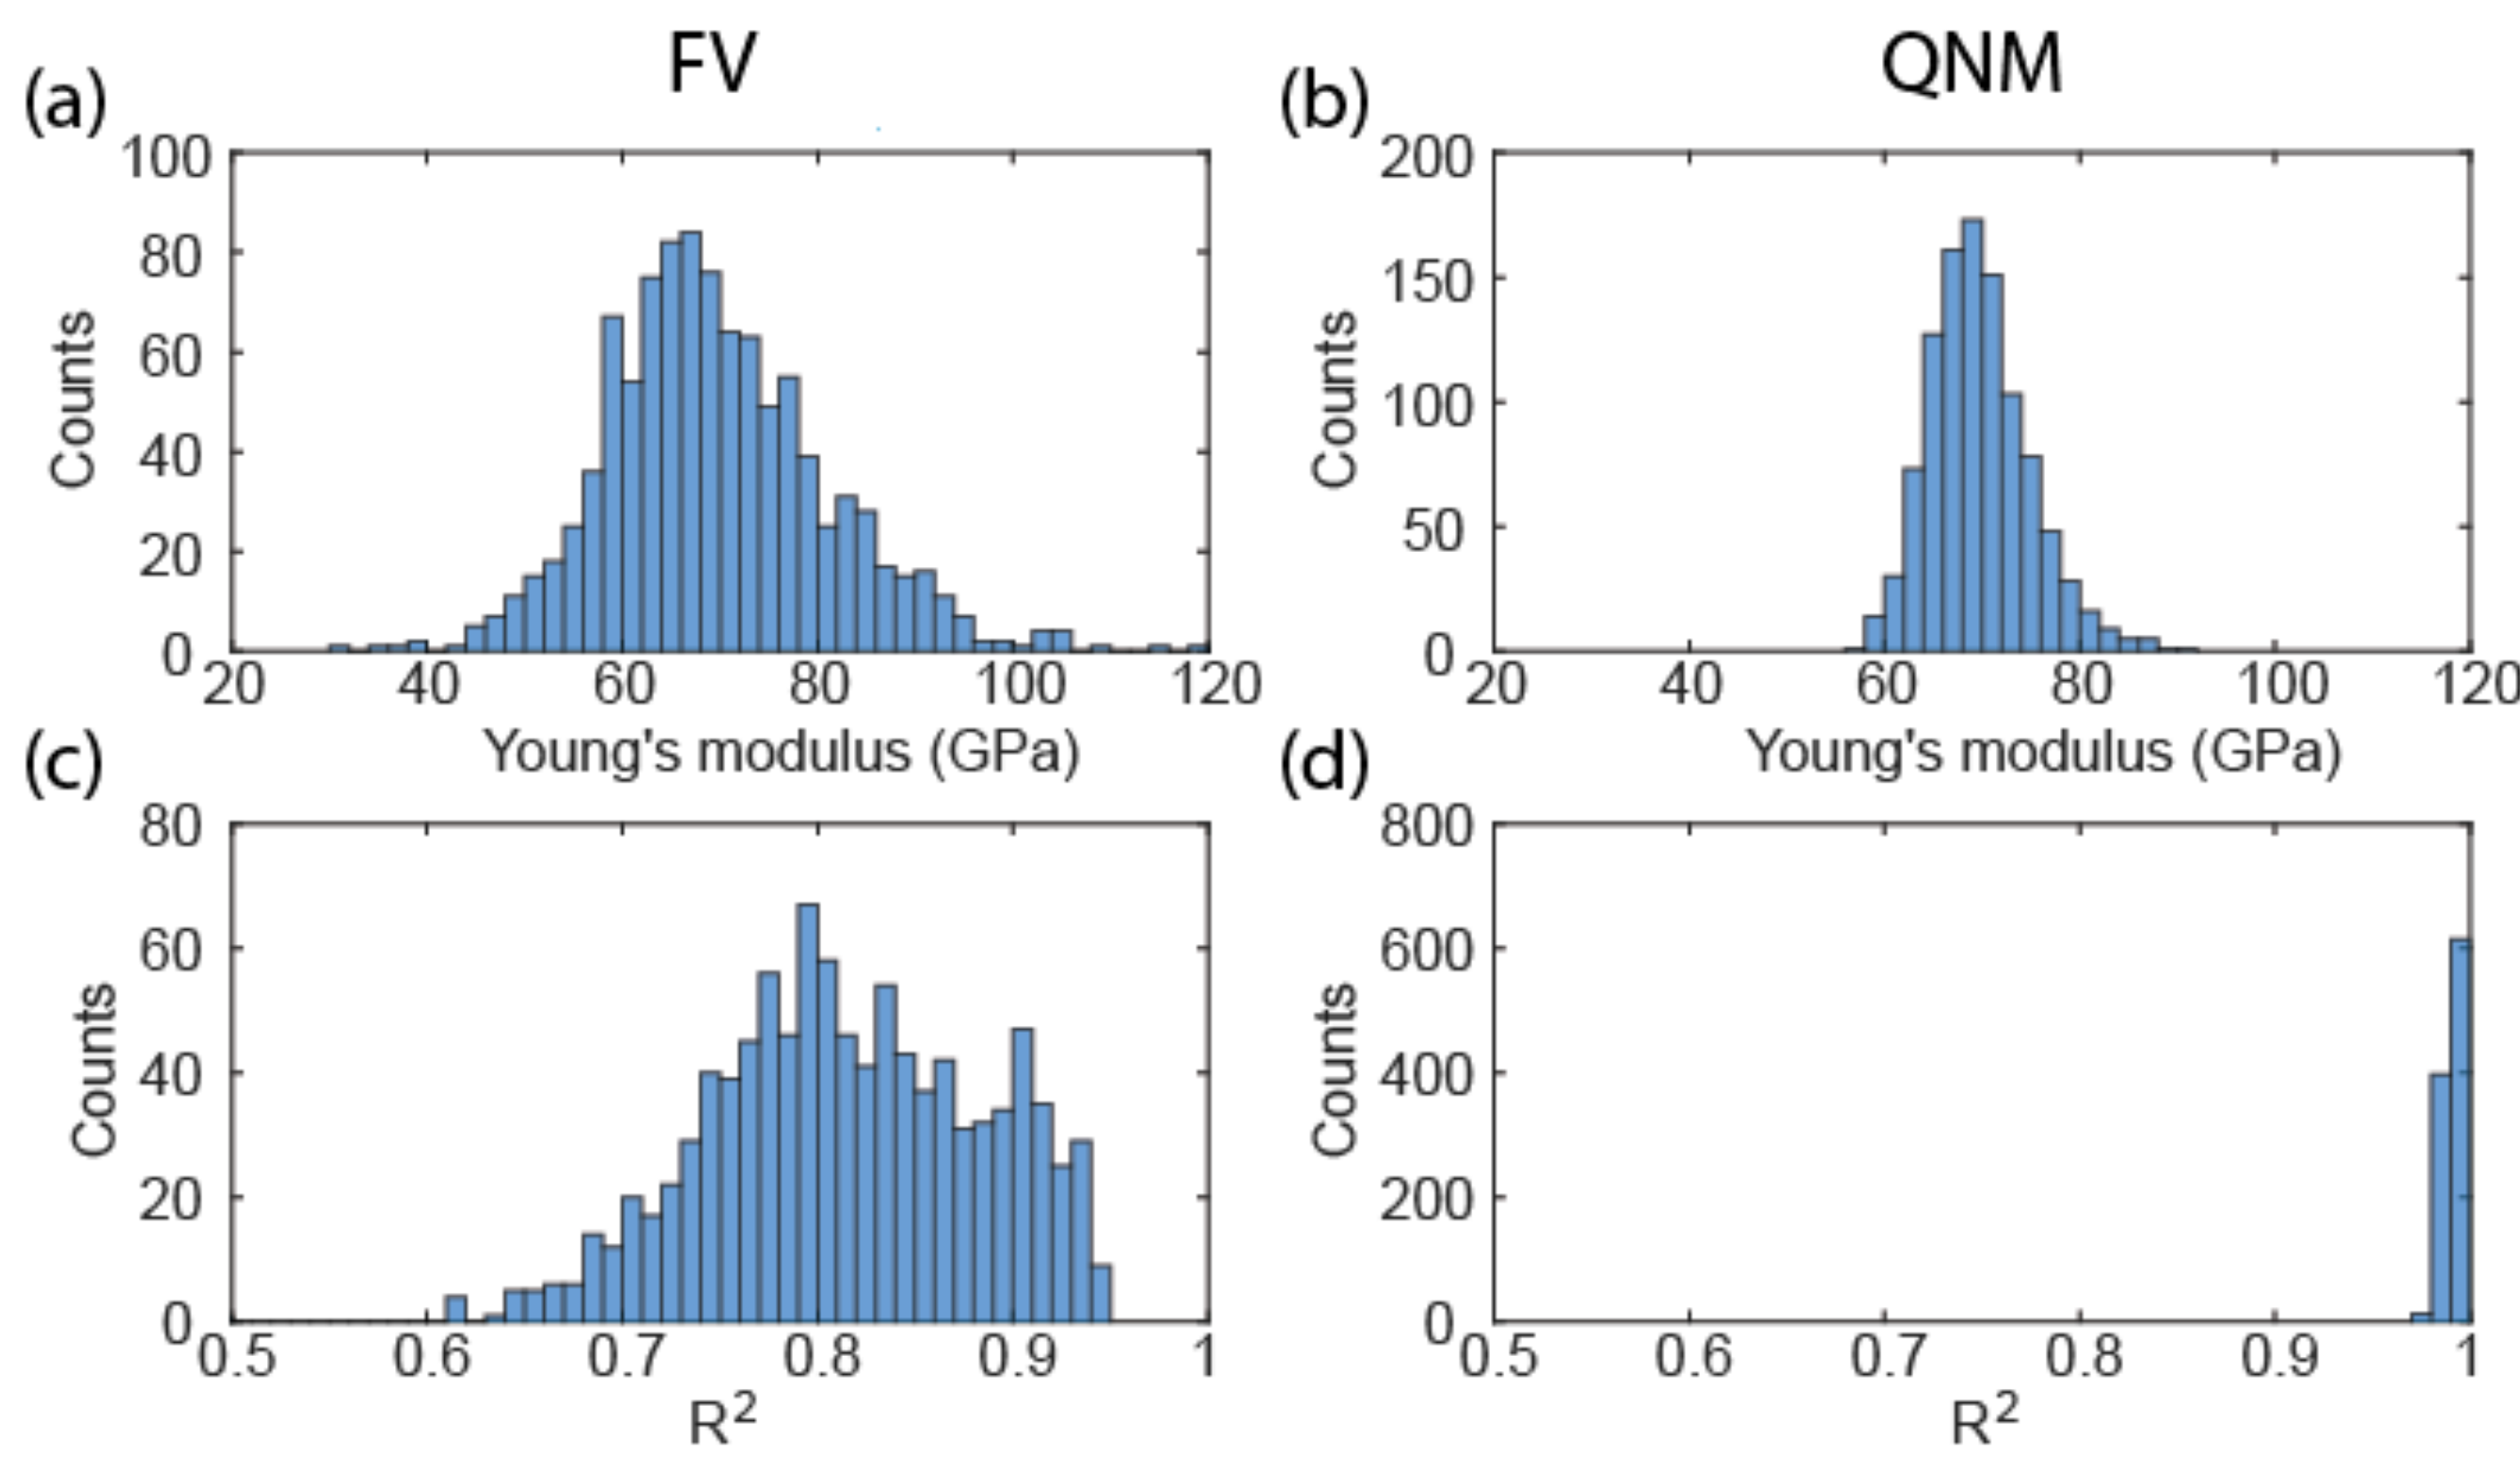
3.1. Effect of Acquisition Frequency
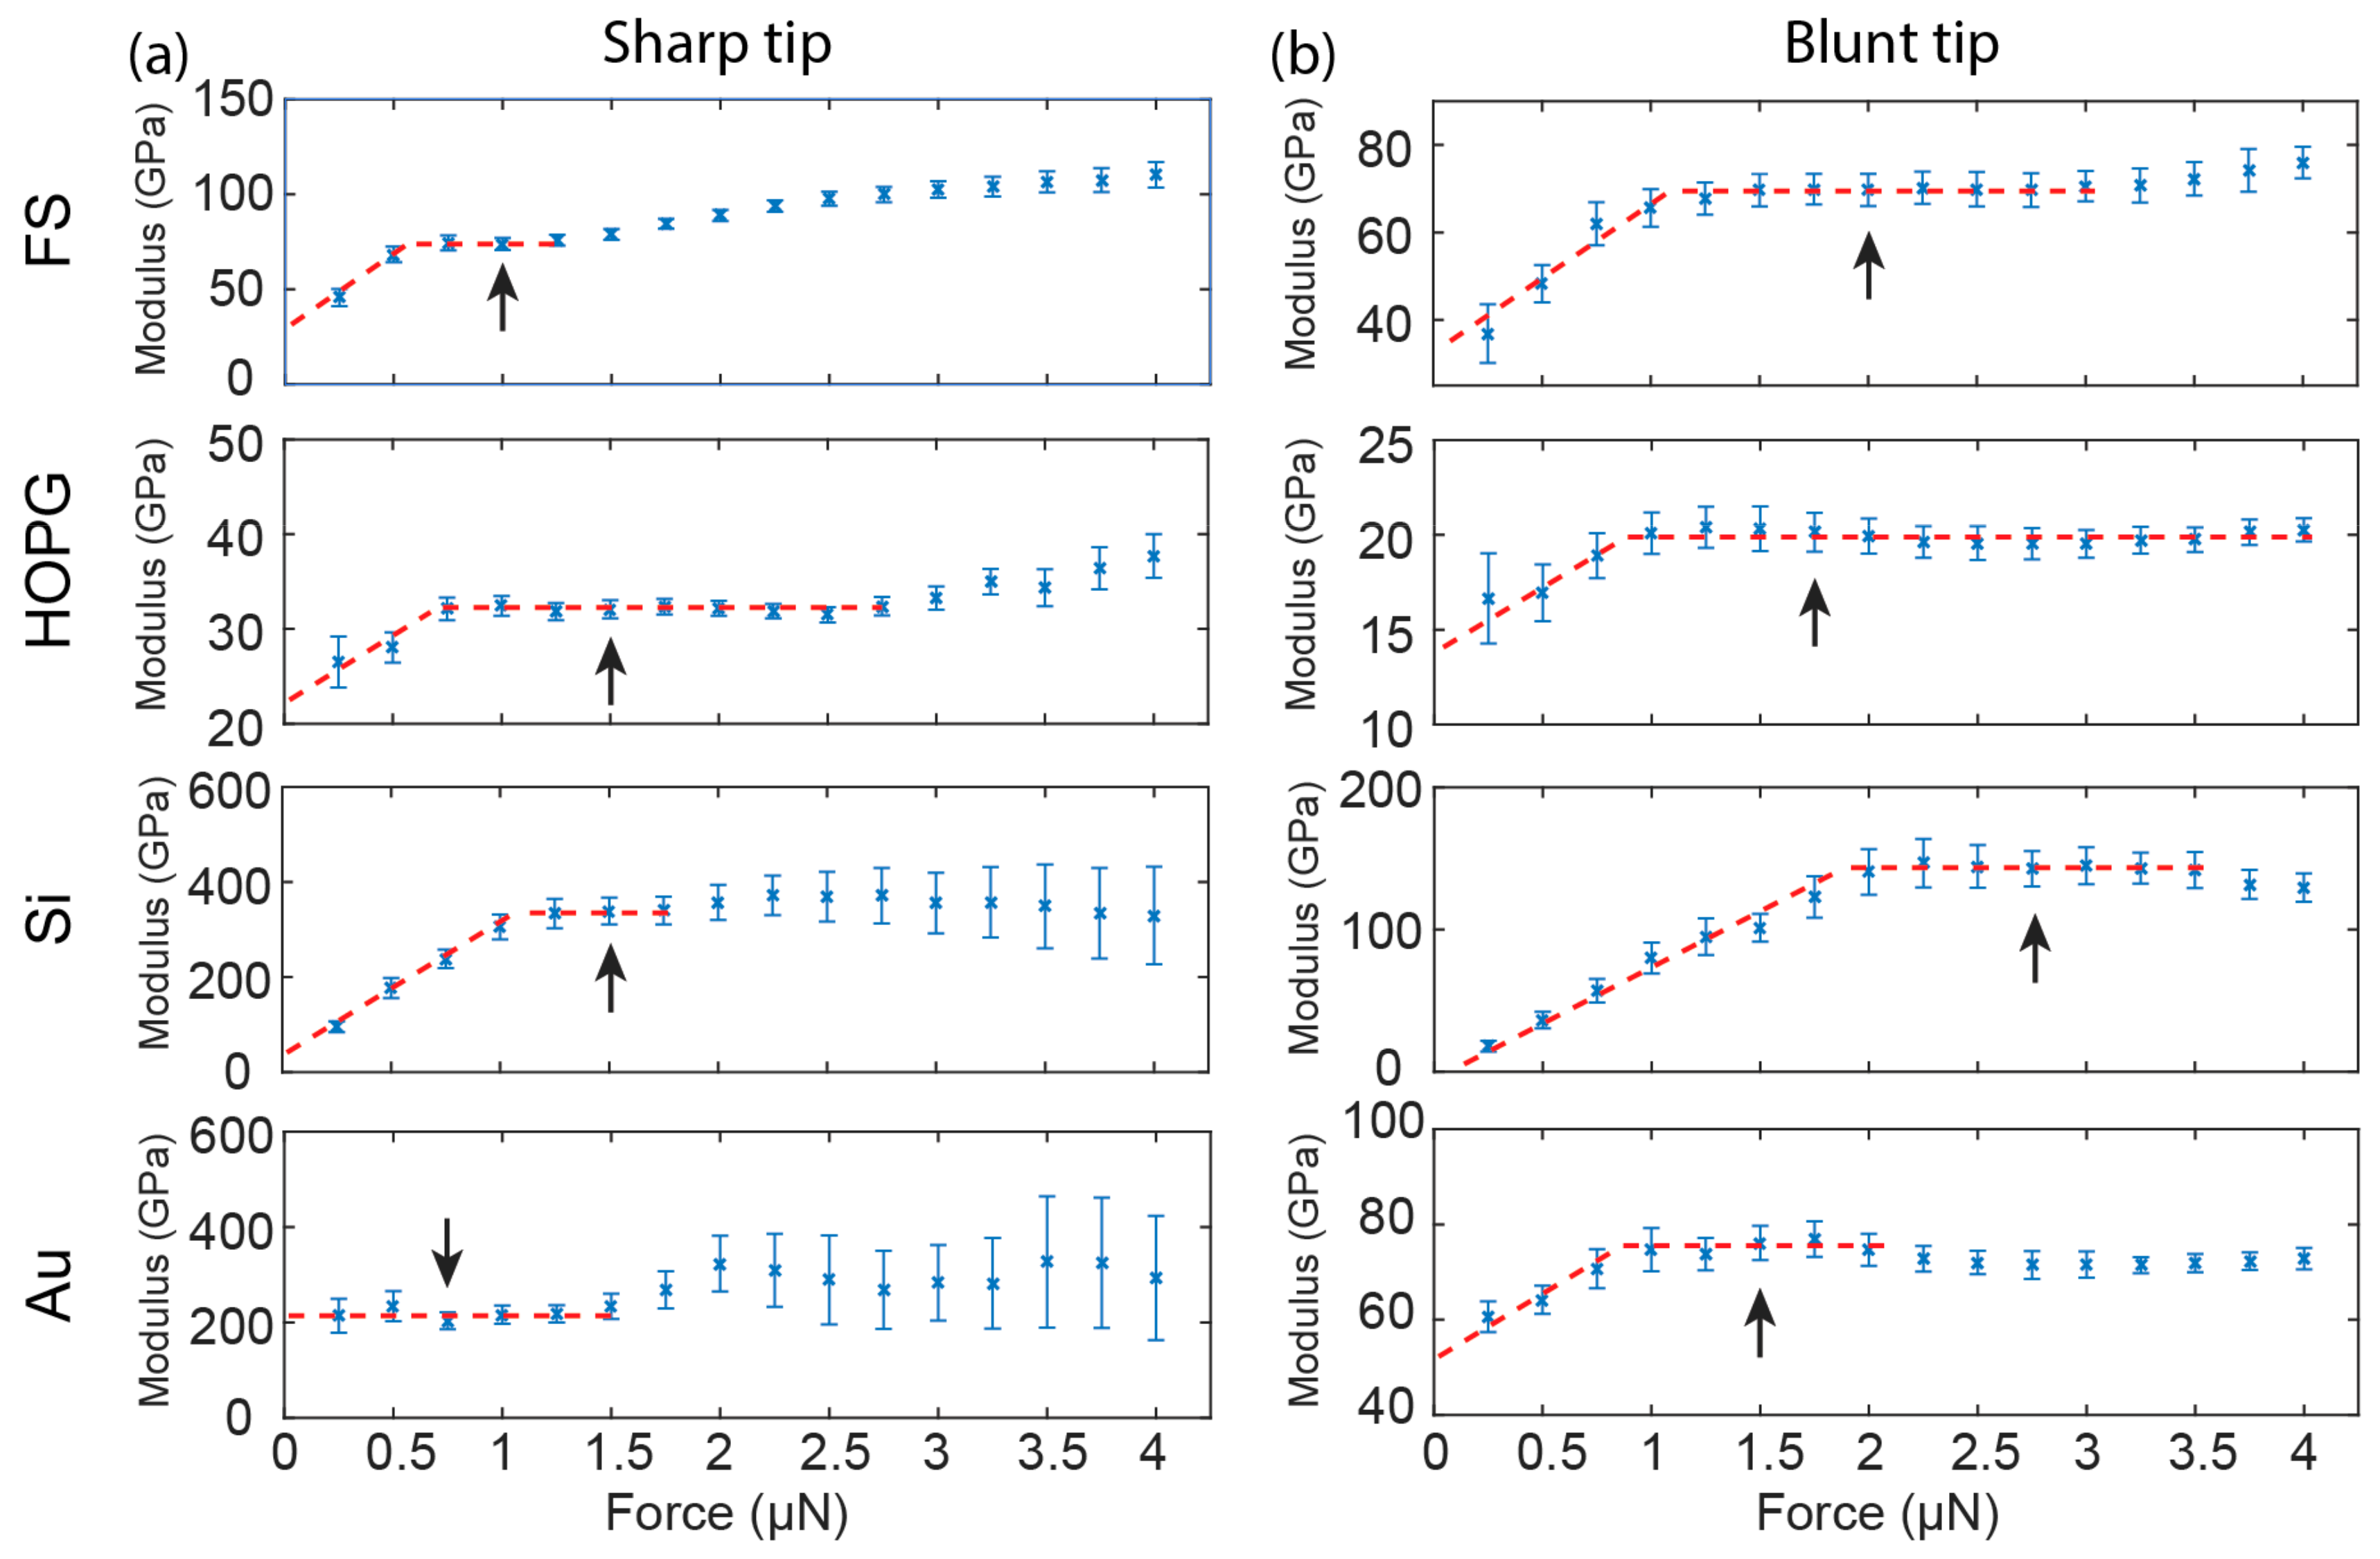
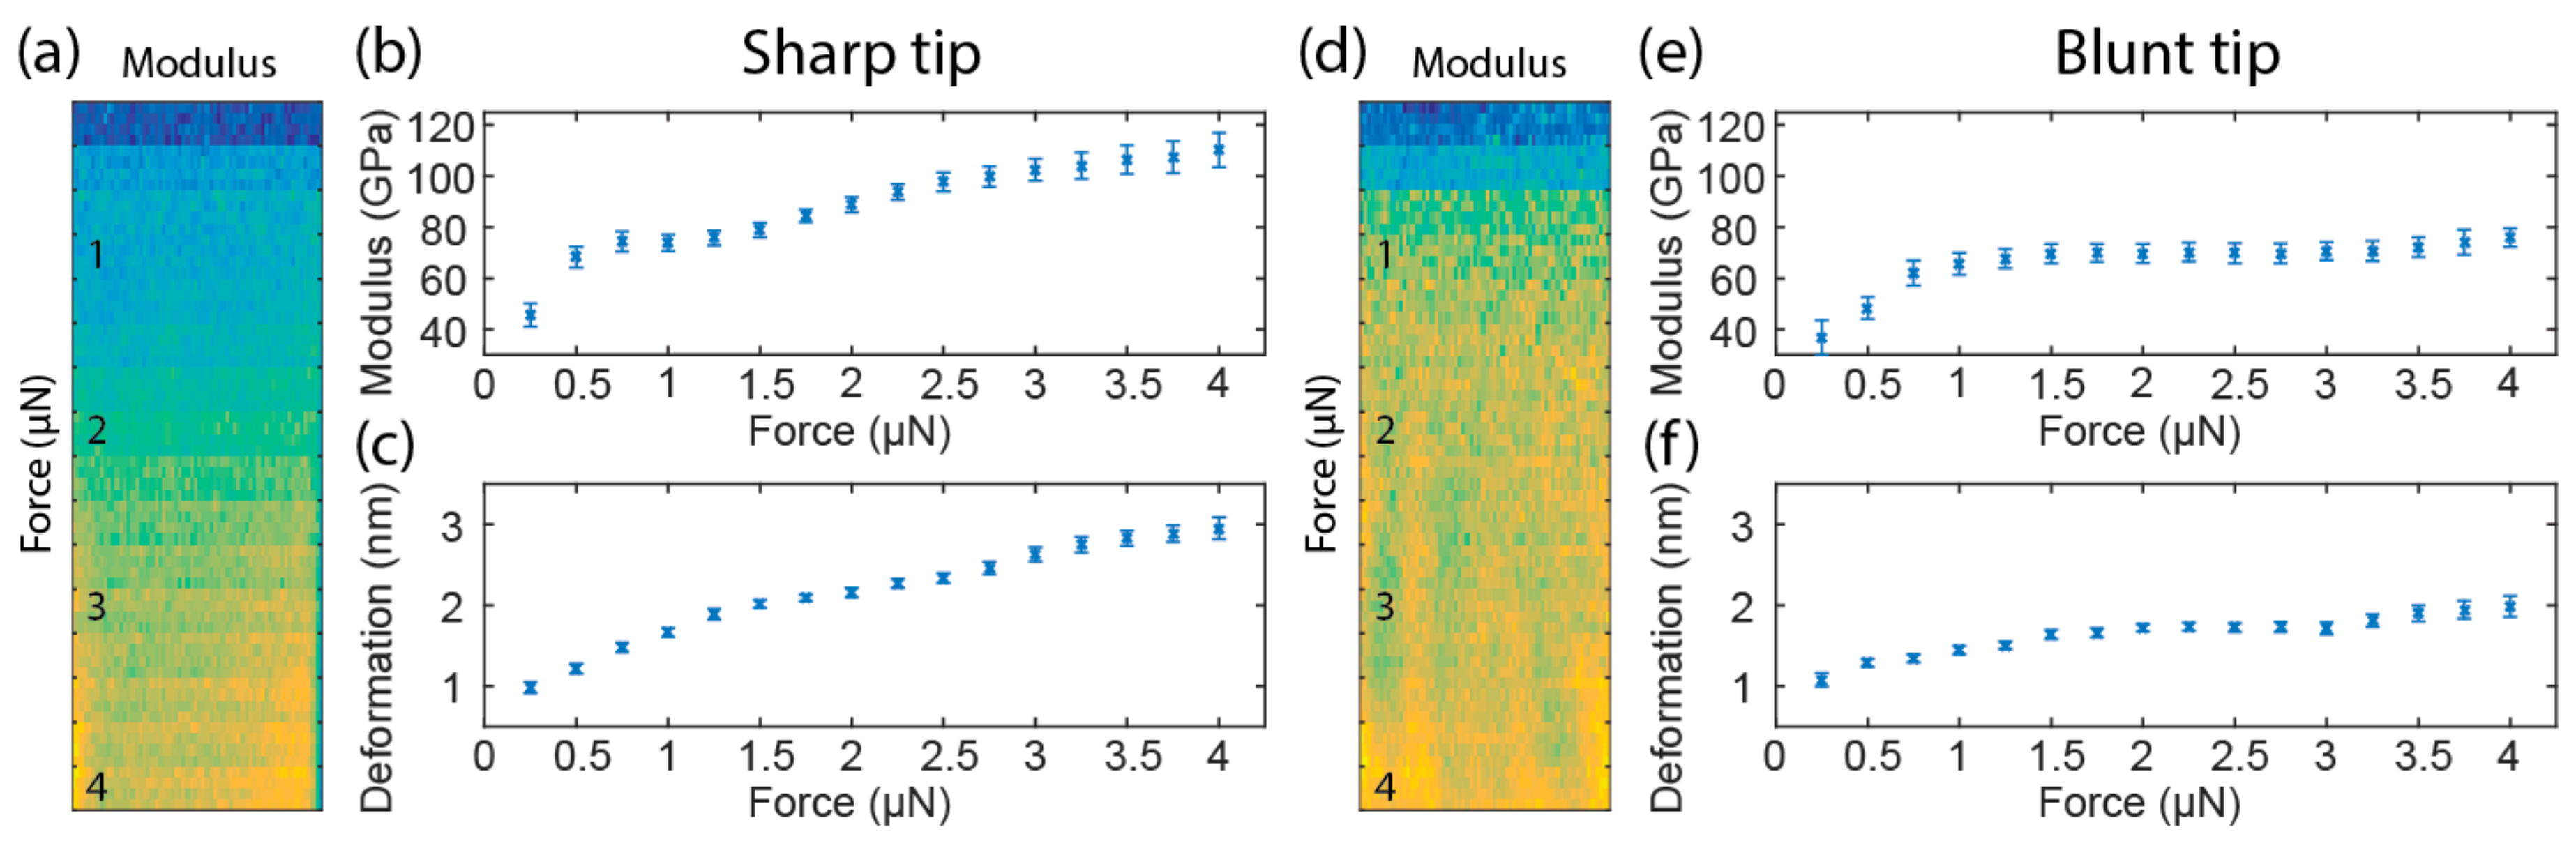
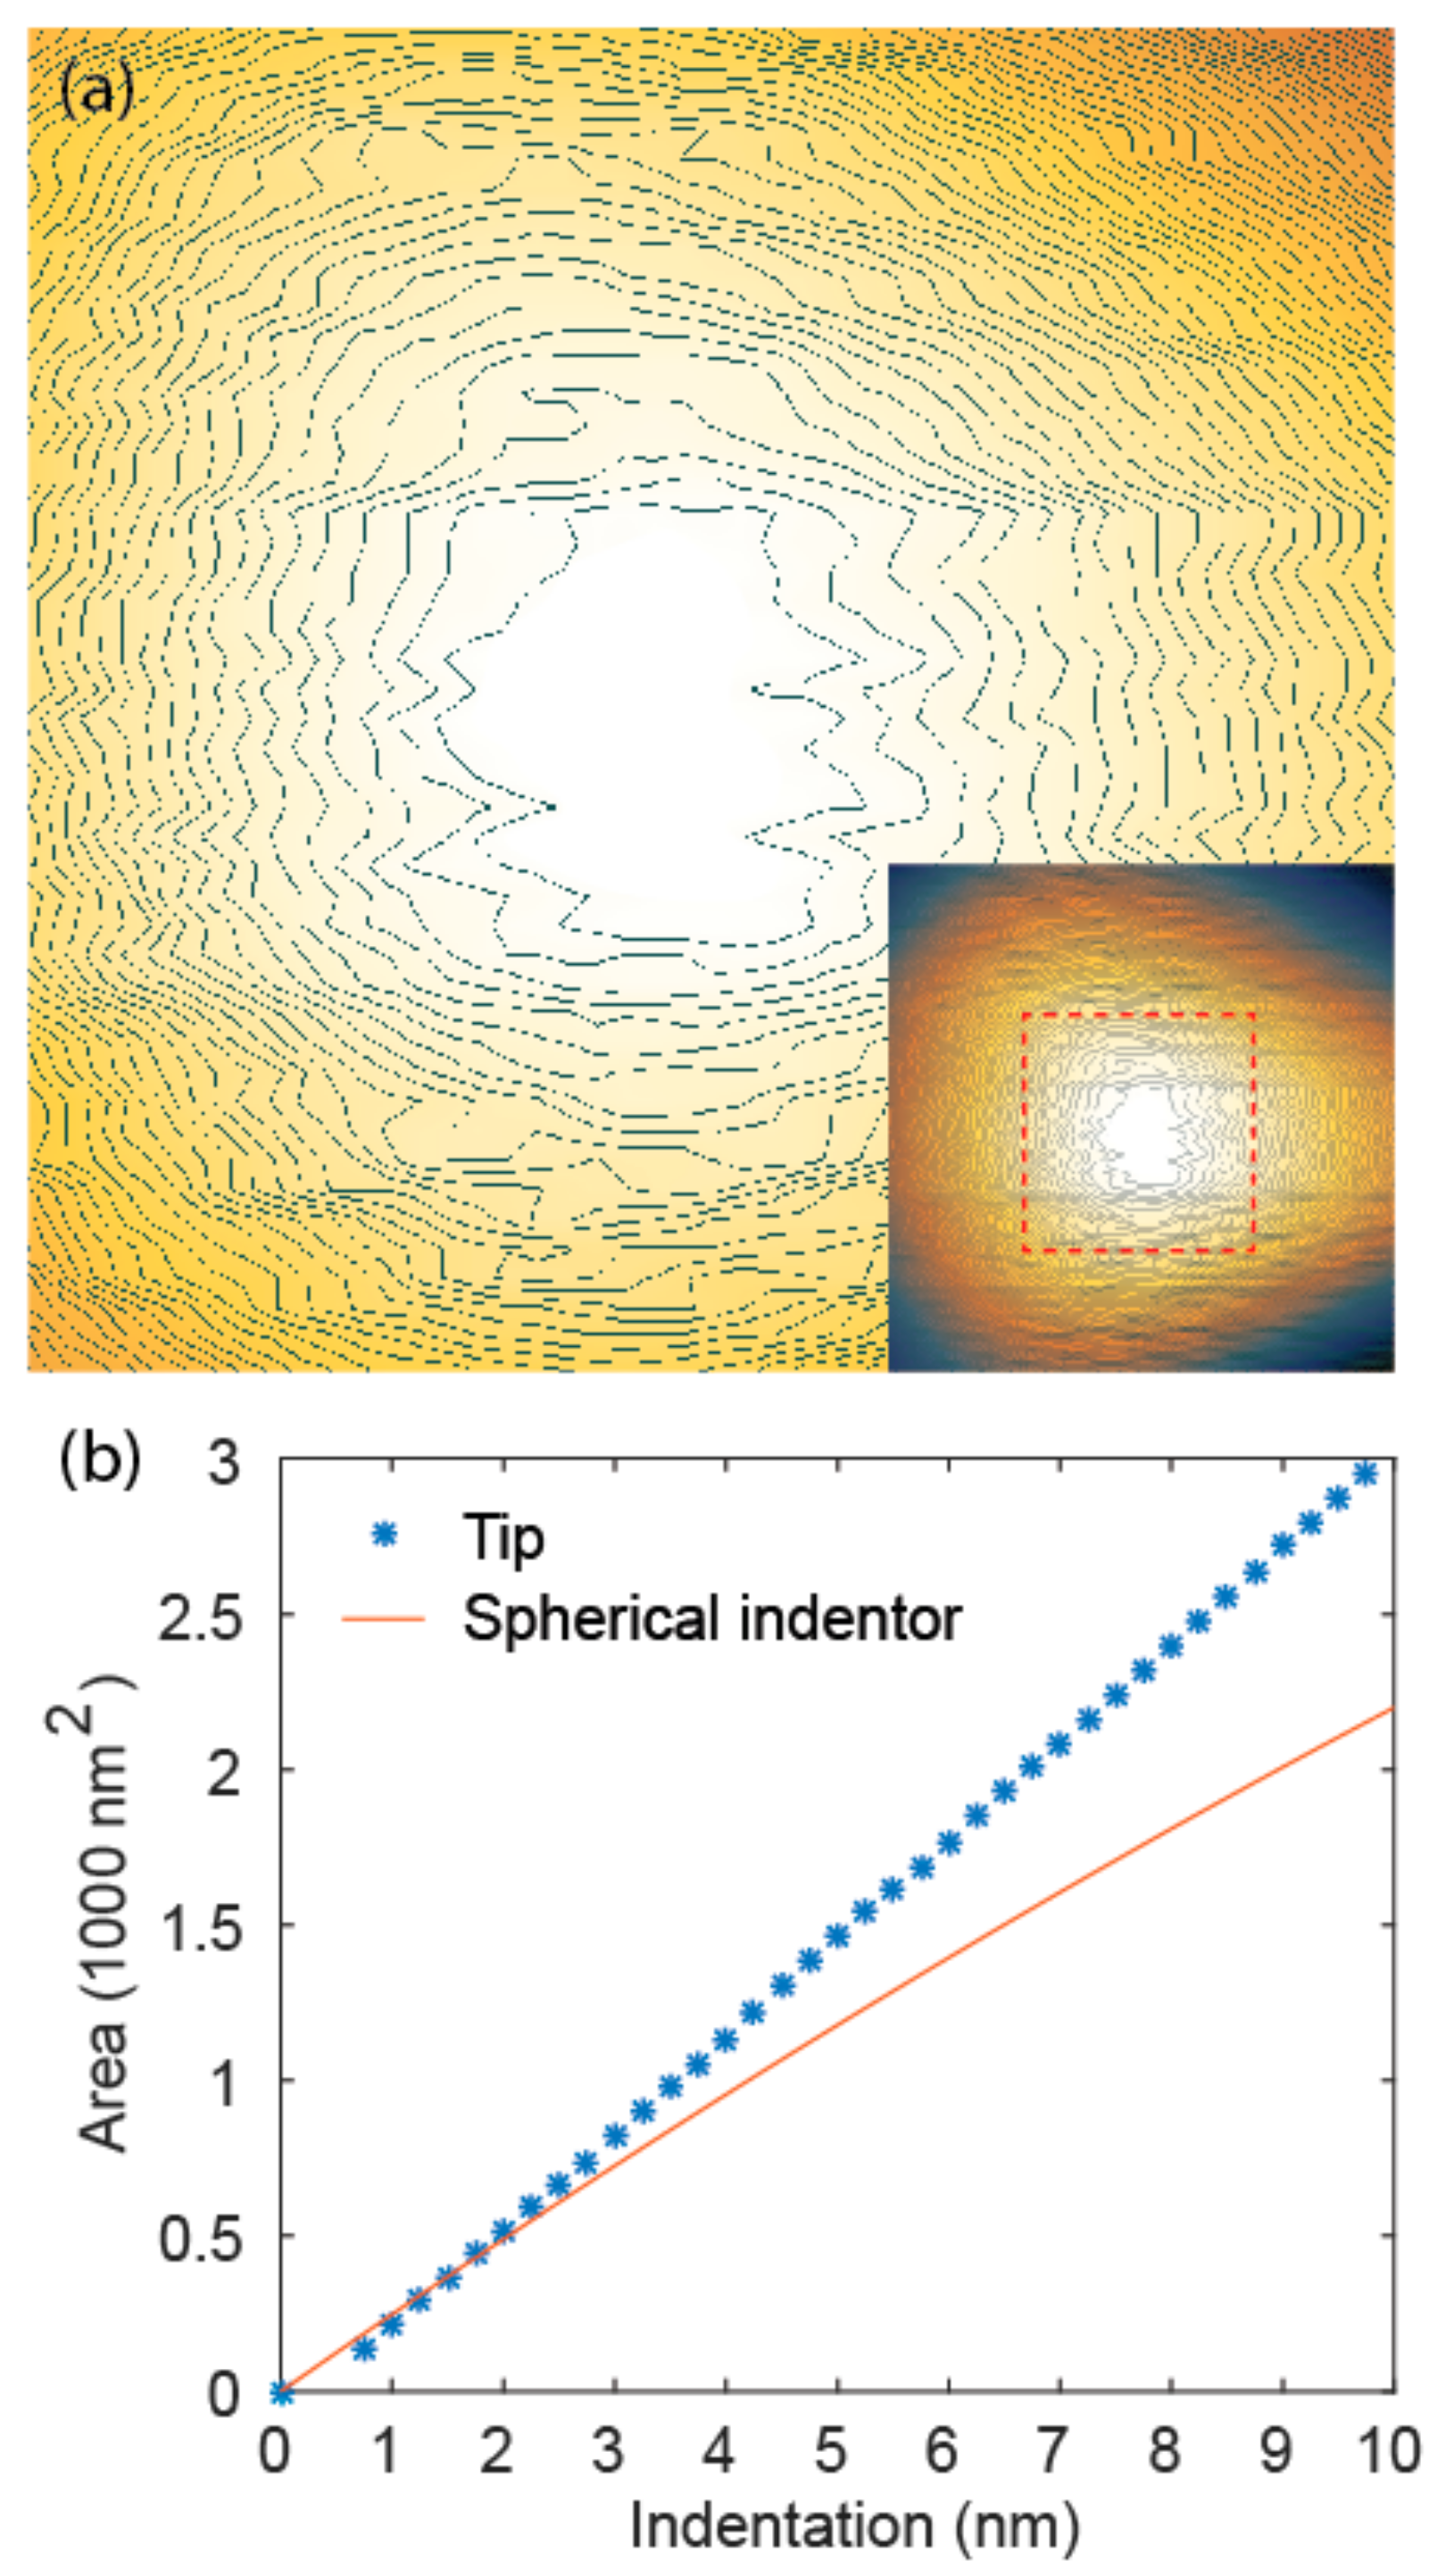
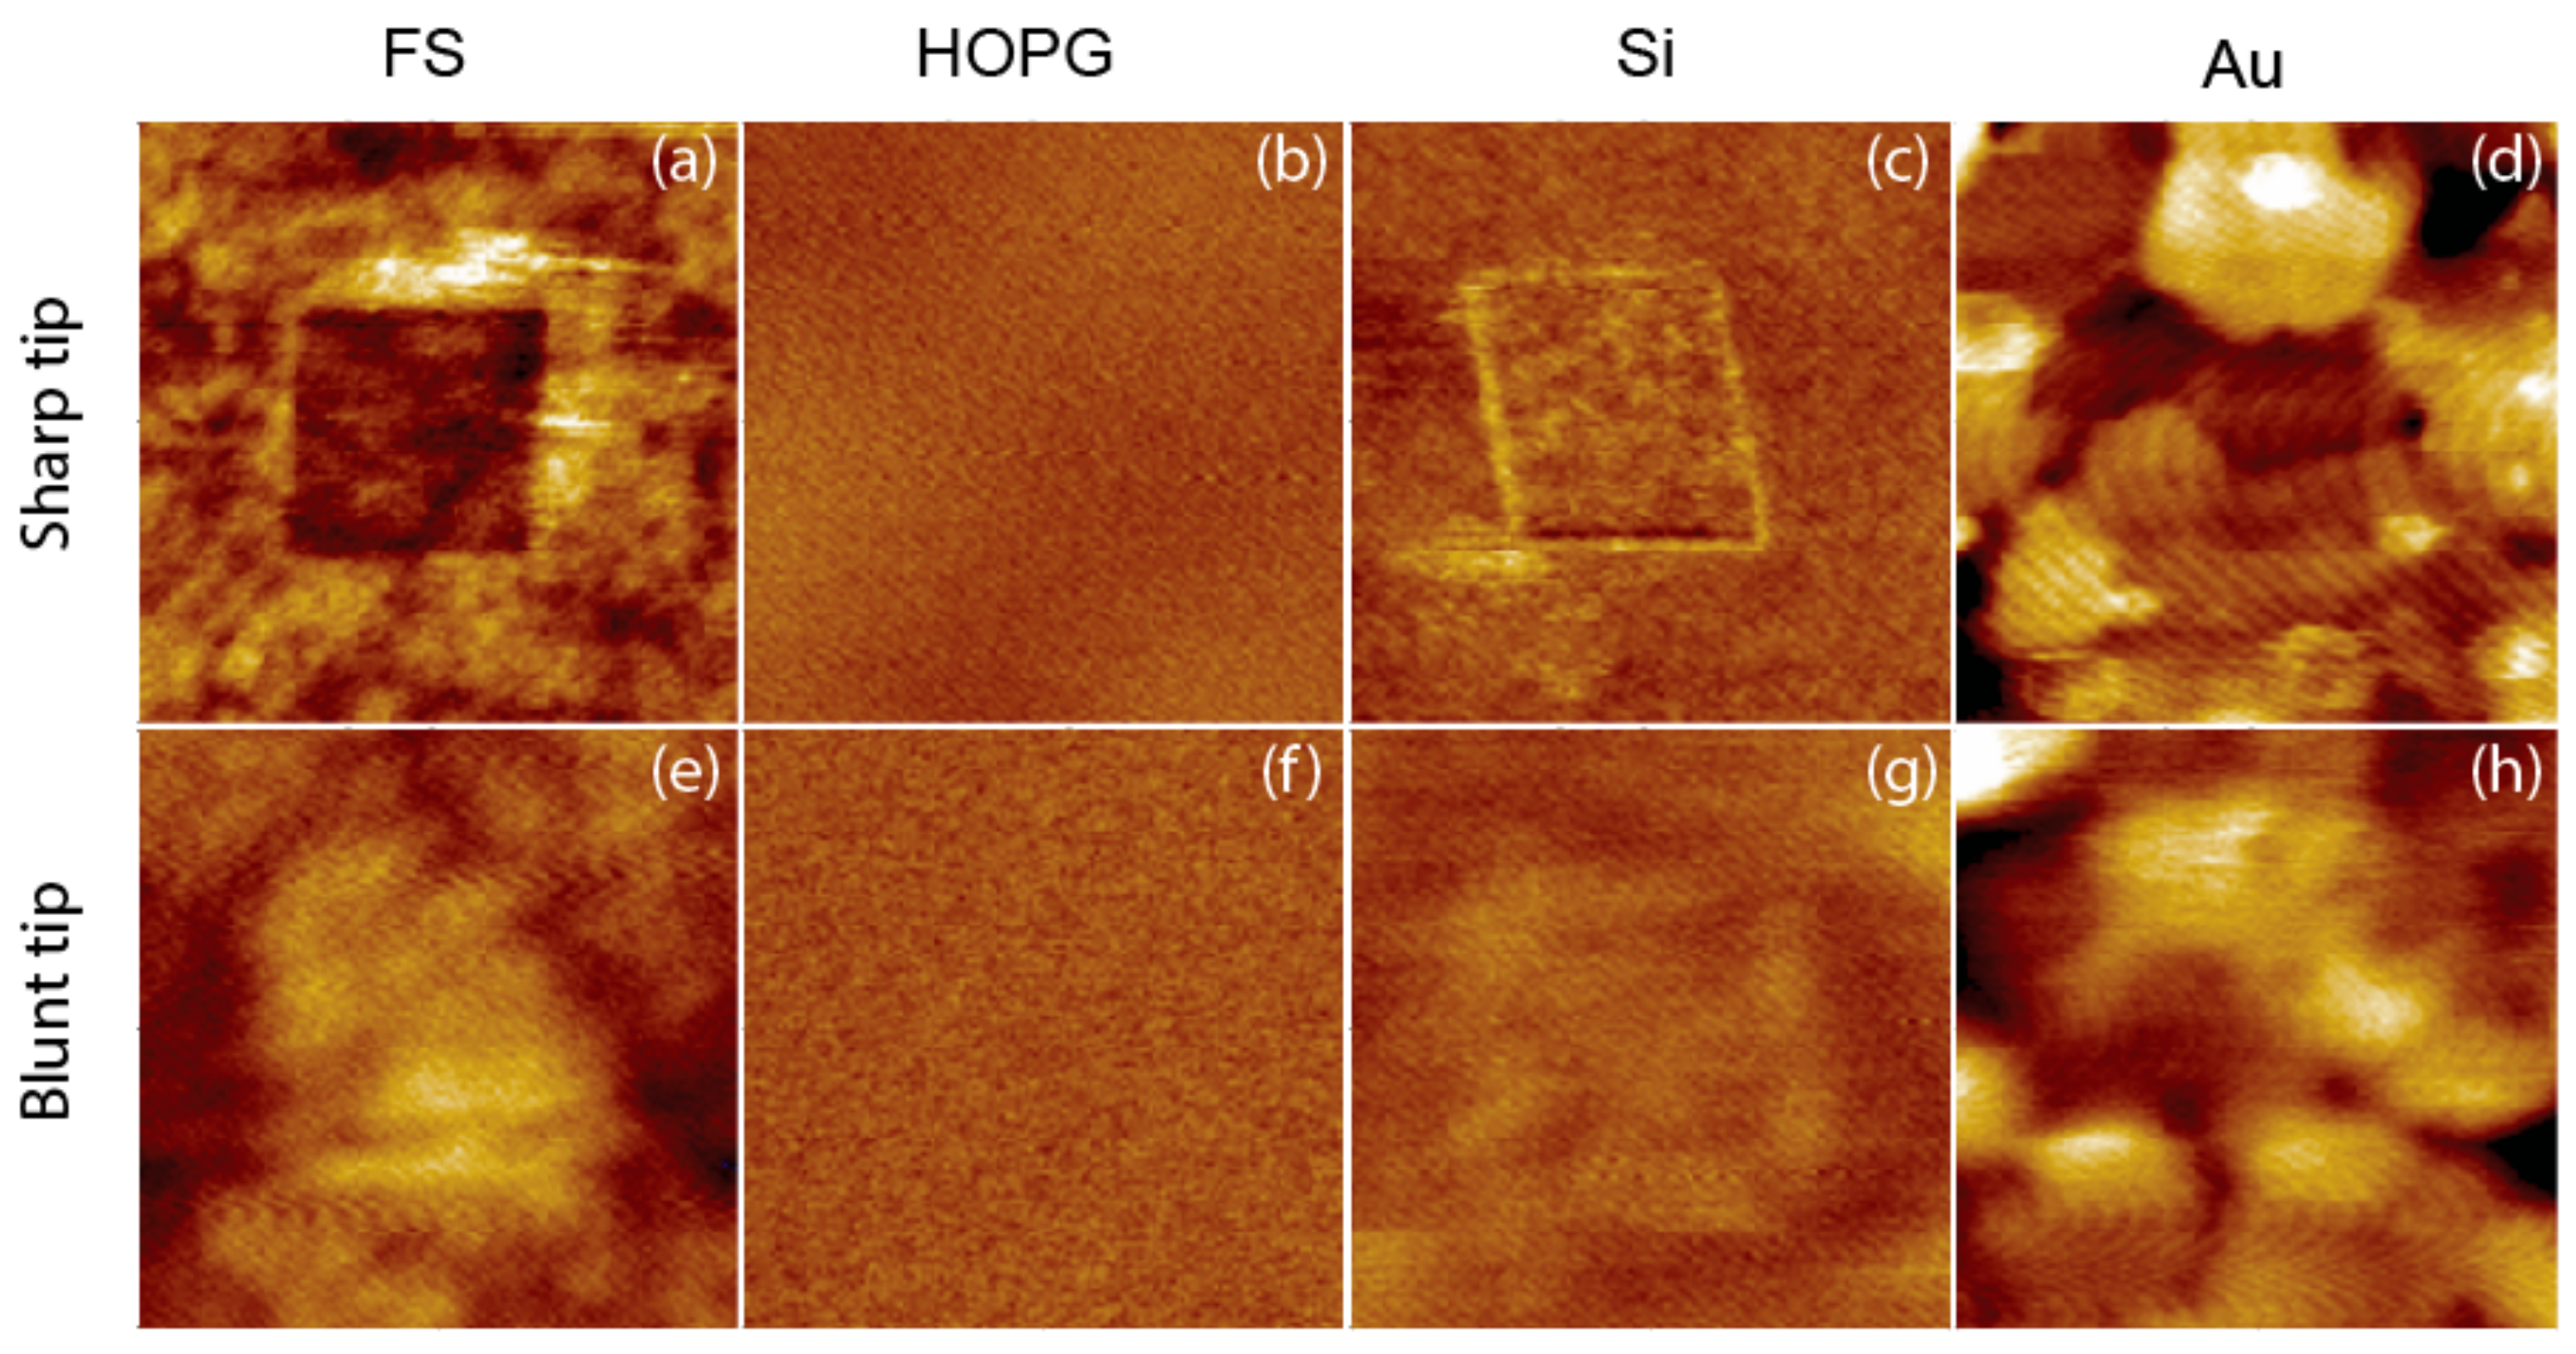
3.2. Effect of Loading Force and Tip Geometry
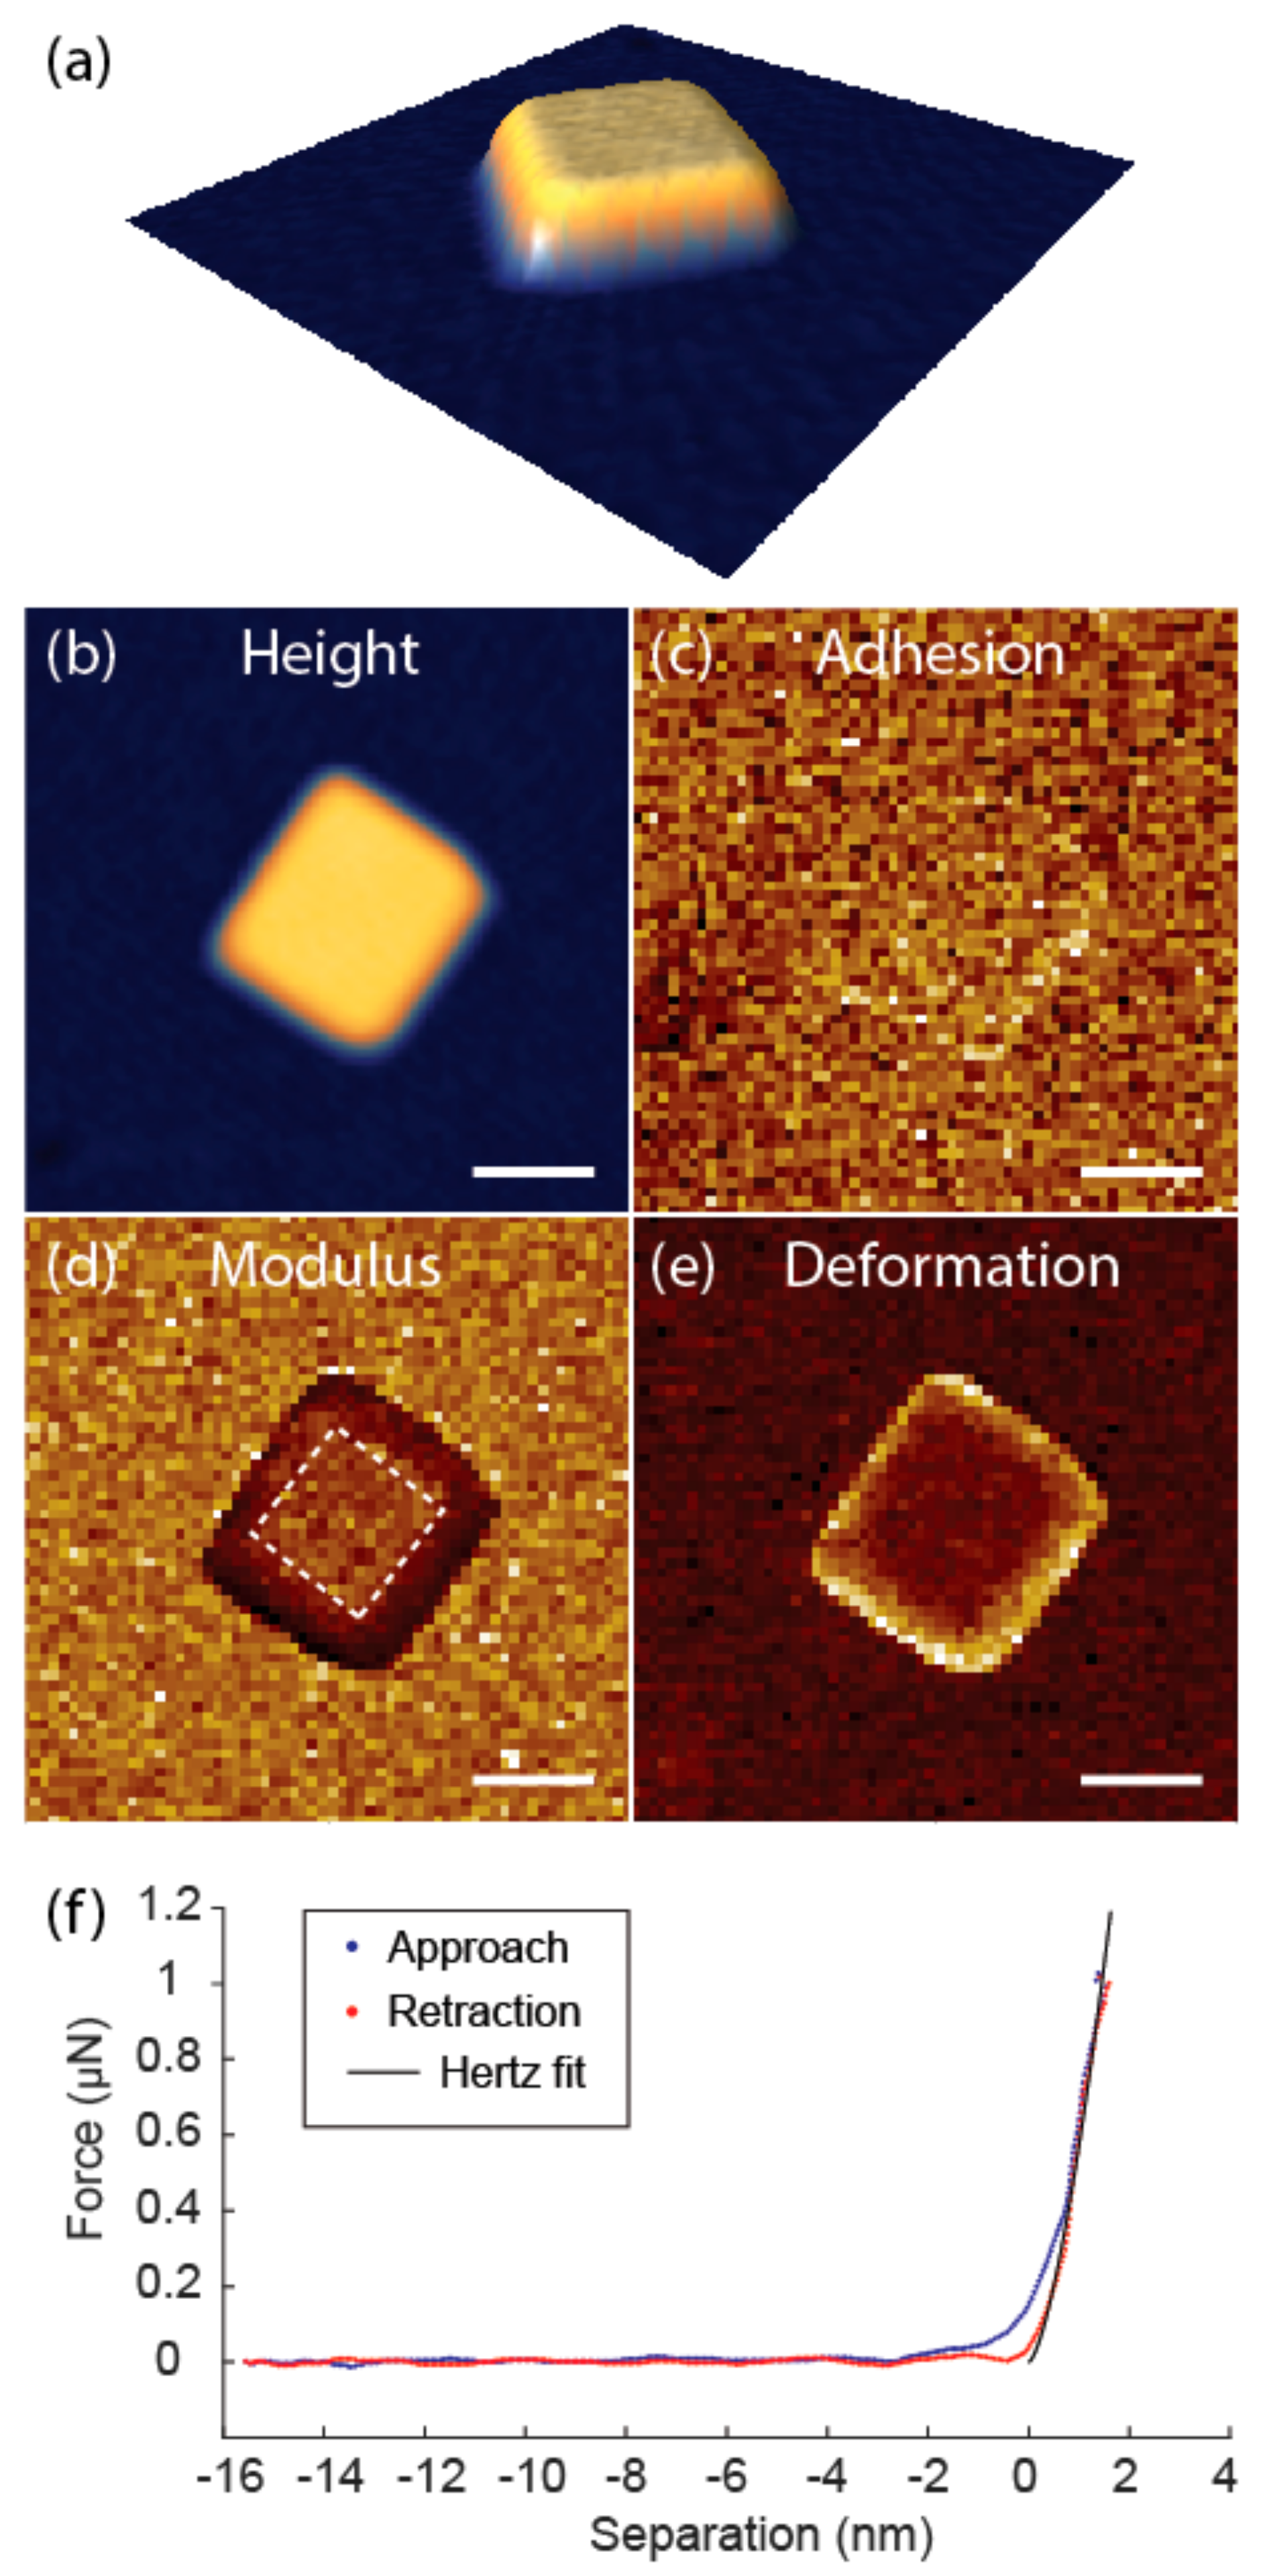
3.3. Imaging Capabilities
4. Conclusions
Author Contributions
Funding
Acknowledgments
Conflicts of Interest
References
- VanLandingham, M.R. Review of instrumented indentation. J. Res. Natl. Inst. Stand. Technol. 2003, 108, 249. [Google Scholar] [CrossRef] [PubMed]
- Sokolov, I.; Dokukin, M.; Guz, N. Method for quantitative measurements of the elastic modulus of biological cells in AFM indentation experiments. Methods 2013, 60, 202–213. [Google Scholar] [CrossRef] [PubMed]
- Oliver, W.C.; Pharr, G.M. An improved technique for determining hardness and elastic modulus using load and displacement sensing indentation experiments. J. Mater. Res. 1992, 7, 1564–1583. [Google Scholar] [CrossRef]
- Oliver, W.C.; Pharr, G.M. Measurement of hardness and elastic modulus by instrumented indentation: Advances in understanding and refinements to methodology. J. Mater. Res. 2004, 19, 3–20. [Google Scholar] [CrossRef] [Green Version]
- Wen, B.; Sader, J.E.; Boland, J.J. Mechanical properties of ZnO nanowires. Phys. Rev. Lett. 2008, 101, 175502. [Google Scholar] [CrossRef] [PubMed]
- Varghese, B.; Zhang, Y.; Dai, L.; Tan, V.B.; Lim, C.; Sow, C.-H. Structure-mechanical property of individual cobalt oxide nanowires. Nano Lett. 2008, 8, 3226–3232. [Google Scholar] [CrossRef] [PubMed]
- Suk, J.W.; Piner, R.D.; An, J.; Ruoff, R.S. Mechanical properties of monolayer graphene oxide. ACS Nano 2010, 4, 6557–6564. [Google Scholar] [CrossRef] [PubMed]
- Smolyakov, G.; Formosa-Dague, C.; Severac, C.; Duval, R.E.; Dague, E. High speed indentation measures by FV, QI and QNM introduce a new understanding of bionanomechanical experiments. Micron 2016, 85, 8–14. [Google Scholar] [CrossRef] [PubMed]
- Young, T.J.; Monclus, M.A.; Burnett, T.L.; Broughton, W.R.; Ogin, S.L.; Smith, P.A. The use of the PeakForceTM quantitative nanomechanical mapping AFM-based method for high-resolution Young’s modulus measurement of polymers. Meas. Sci. Technol. 2011, 22, 125703. [Google Scholar] [CrossRef]
- Dokukin, M.; Sokolov, I. Quantitative Mapping of the Elastic Modulus of Soft Materials with HarmoniX and PeakForce QNM AFM Modes. Langmuir 2012, 28, 16060–16071. [Google Scholar] [CrossRef] [PubMed]
- Grutzik, S.; Gates, R.; Gerbig, Y.; Smith, D.; Cook, R.; Zehnder, A. Accurate spring constant calibration for very stiff atomic force microscopy cantilevers. Rev. Sci. Instrum. 2013, 84, 113706. [Google Scholar] [CrossRef] [PubMed]
- Wagner, R.; Moon, R.; Pratt, J.; Shaw, G.; Raman, A. Uncertainty quantification in nanomechanical measurements using the atomic force microscope. Nanotechnology 2011, 22, 455703. [Google Scholar] [CrossRef] [PubMed]
- Lin, D.; Dimitriadis, E.; Horkay, F. Robust Strategies for Automated AFM Force Curve Analysis—I. Non-adhesive Indentation of Soft, Inhomogeneous Materials. J. Biomech. Eng. 2007, 129, 430–440. [Google Scholar] [CrossRef] [PubMed]
- Vanlandingham, M.; McKnight, S.; Palmese, G.; Elings, J.; Huang, X.; Bogetti, T.; Eduljee, R.J., Jr. Nanoscale Indentation of Polymer Systems Using the Atomic Force Microscope. J. Adhes. 1997, 64, 31–59. [Google Scholar] [CrossRef]
- Huang, L.; Meyer, C.; Prater, C. Prater eliminating lateral forces during AFM Indentation. J. Phys. Conf. Ser. 2007, 61, 805. [Google Scholar] [CrossRef]
- Villarrubia, J.S. Algorithms for Scanned Probe Microscope Image Simulation, Surface Reconstruction, and Tip Estimation. J. Res. Natl. Inst. Stand. Technol. 1997, 102, 425–454. [Google Scholar] [CrossRef] [PubMed]
- Tranchida, D.; Kiflie, Z. Piccarolo Atomic force microscope nanoindentations to reliably measure the Young’s modulus of soft matter. In Modern Research and Educational Topics in Microscopy; Méndez-Vilas, A., Díaz, J., Eds.; FORMATEX: Badajoz, Spain, 2007; Volume 2, ISBN (13) 978-84-611-9420-9. [Google Scholar]
- Eskelsen, J.; Qi, Y.; Schneider-Pollack, S.; Schmitt, S.; Hipps, K.W.; Mazur, U. Correlating elastic properties and molecular organization of an ionic organic nanostructure. Nanoscale 2013, 6, 316–327. [Google Scholar] [CrossRef] [PubMed]
- Kim, J.; Cho, D.; Muller, R.S. Why is (111) Silicon a Better Mechanical Material for MEMS? In Transducers ’01 Eurosensors XV; Springer: Berlin, Germany, 2001; pp. 662–665. [Google Scholar] [CrossRef]
- Salmeron, M.; Folch, A.; Neubauer, G.; Tomitori, M.; Ogletree, D.F.; Kolbe, W. Nanometer scale mechanical properties of gold(111) thin films. Langmuir 1992, 8, 2832–2842. [Google Scholar] [CrossRef]
- Dokukin, M.; Sokolov, I. On the Measurements of Rigidity Modulus of Soft Materials in Nanoindentation Experiments at Small Depth. Macromolecules 2012, 45, 4277–4288. [Google Scholar] [CrossRef]
- Bendavid, A.; Martin, P.J.; Jamting, Å.; Takikawa, H. Structural and optical properties of titanium oxide thin films deposited by filtered arc deposition. Thin Solid Films 1999, 355, 6–11. [Google Scholar] [CrossRef]


| Sharp Tip | Blunt Tip | ||||||
|---|---|---|---|---|---|---|---|
| Sample | E/GPa | Poisson’s Ratio | E*/GPa | E*/GPa | Δ% | E*/GPa | Δ% |
| FS | 72.0 a | 0.17 | 69.7 | 69.7 (0.4) | - | 69.7 (3.5) | - |
| HOPG | 18.0 b | 0.20 | 18.4 | 31.1 (1.0) | 69 | 20.8 (1.4) | 13 |
| Si(111) | 168.9 c | 0.26 | 156.8 | 347.6 (7.6) | 122 | 147.2 (10.3) | −6 |
| Au(111) | 78.5 d | 0.42 | 88.0 | 179.8 (21.6) | 104 | 88.2 (1.4) | 0 |
© 2018 by the authors. Licensee MDPI, Basel, Switzerland. This article is an open access article distributed under the terms and conditions of the Creative Commons Attribution (CC BY) license (http://creativecommons.org/licenses/by/4.0/).
Share and Cite
Zeng, G.; Dirscherl, K.; Garnæs, J. Toward Accurate Quantitative Elasticity Mapping of Rigid Nanomaterials by Atomic Force Microscopy: Effect of Acquisition Frequency, Loading Force, and Tip Geometry. Nanomaterials 2018, 8, 616. https://doi.org/10.3390/nano8080616
Zeng G, Dirscherl K, Garnæs J. Toward Accurate Quantitative Elasticity Mapping of Rigid Nanomaterials by Atomic Force Microscopy: Effect of Acquisition Frequency, Loading Force, and Tip Geometry. Nanomaterials. 2018; 8(8):616. https://doi.org/10.3390/nano8080616
Chicago/Turabian StyleZeng, Guanghong, Kai Dirscherl, and Jørgen Garnæs. 2018. "Toward Accurate Quantitative Elasticity Mapping of Rigid Nanomaterials by Atomic Force Microscopy: Effect of Acquisition Frequency, Loading Force, and Tip Geometry" Nanomaterials 8, no. 8: 616. https://doi.org/10.3390/nano8080616