Cement-Induced Coagulation of Aqueous Graphene Oxide with Ultrahigh Capacity and High Rate Behavior

College of Materials Science and Engineering, Chongqing Jiaotong University, Chongqing 400074, China
*
Author to whom correspondence should be addressed.
Nanomaterials 2018, 8(8), 574; https://doi.org/10.3390/nano8080574
Submission received: 4 July 2018
/
Revised: 20 July 2018
/
Accepted: 23 July 2018
/
Published: 27 July 2018
Abstract
:Graphene oxide (GO) has excellent physicochemical properties and is used in multiple areas. However, the potential toxicity and environmental problems associated with GO increase its risk to the ecological system. In this study, cement was employed as a coagulant to eliminate GO from aqueous solutions. The effects of the cement dosage, the contact time, and the concentration and volume of the aqueous GO solution on the GO coagulation capacity were investigated in detail. The results showed that the dosage of cement had a significant effect on the coagulation process, and coagulation equilibrium was achieved in less than 1 h. Compared to coagulants used to remove GO from water in other reports, cement exhibited an ultrahigh coagulation capacity of approximately 5981.2 mg/g with 0.4 mg/mL GO solution. The kinetic analysis showed that the GO removal behavior could be described by a pseudo second-order model. The in-depth mechanism of GO coagulation using cement included Ca2+-induced coagulation of GO and adsorption by the hydrated product of cement paste. The present study revealed that cement could be a very cheap and promising material for the efficient elimination of GO from aqueous solutions.
1. Introduction
Graphene oxide (GO) is one of the most important graphene derivatives and has many unique features, such as excellent mechanical properties, high surface functionalization, high surface area and good dispersibility in aqueous solutions [1]. GO is used in multiple areas, such as water treatment [2], nanosensors [3], supercapacitors [4] and nanomedicine [5,6,7]. It has abundant epoxy and hydroxyl functional groups at its basal plane, as well as carbonyl and carboxyl groups situated at the edges [8]. Due to the large number of hydrophilic groups within its structure, GO has good wettability and surface activity, and can be dispersed in water to form a stable colloidal suspension; however, parts of GO are inevitably released into the natural environment during its manufacture and use. There are many concerns about its ecological security as GO has recently been demonstrated to be one of the most toxic graphene-based materials [9]. Souza et al. evaluated GO effects with an effective concentration during acute exposure of 1.25 mg/L of GO. Chronic exposure resulted in a significant decrease in the number of neonates [10] and GO was also highly toxic to one of the most common fresh water ciliate protists, paramecium caudatum, at low concentrations [11]. The potential toxicity and high mobility of GO can cause serious long-term cumulative toxic effects in living organisms, and it has been demonstrated that GO and its derivatives can accumulate in the lung, liver and spleen for a long time [12,13,14]. Unlike organic pollutants, GO is not easily converted into harmless end products, or degraded to non-toxic small molecules, and tends to aggregate in living organisms with strong van der Waals forces [15,16]. Therefore, it is urgent that GO be removed from the natural aquatic environment.
During the past decade, many technologies have been applied to deal with various pollutants (e.g., organic dyes and heavy metal ions), including ion exchange [17,18], adsorption [19,20], coagulation [21], chemical precipitation [22] and membrane separation [23]. In comparison with these technologies, coagulation has been considered a promising potential method for the removal and aggregation of GO or other nanomaterials. For instance, Wang et al. reported that Mg/Al/La-CLDHs and Ca/Al/La-CLDHs exhibited maximum GO removal capacities of 565.8 and 558.6 mg/g, respectively, with the coagulation of GO on La-doped LDH mainly dominated by electrostatic attraction and hydrogen bonding [24,25,26,27,28]. A study by Yuan et al. found that calcined MgAl-layered double hydroxides (MgAl-LDH) showed moderate removal capacity of 984.2 mg/g towards GO, due to the memory effect of calcined LDH [20]. However, these methods for removing GO are slow and time-consuming because of the dominance of physical absorption or coagulation in most cases. Additionally, the coagulants usually used to remove GO are expensive and have low removal capacity. Therefore, it is necessary to develop low-cost and highly efficient coagulants to remove GO from the aquatic environment.
Cement is the key component of concrete and mortar, which are two of the most important and widely used building materials. Cement gradually congeals and hardens upon contact with water. In this process, cement clinker minerals undergo a series of complex chemical reactions with water to generate hydrous calcium silicate gel (C-S-H) and calcium lanthanum, Ettringite crystal (AFt), calcium hydroxide crystals (CH), and monoculture calcium aluminosilicate (AFm) crystals [27]. Furthermore, C-S-H gels have extremely high specific surface energy and ion exchange capacity, and can be chemically displaced through adsorption, symbiosis, and intercalation. Using methods such as curing foreign ions, Ettringite can also be replaced by chemical substitution in the crystal column, and the channel contains many external ions [28]. Moreover, a large amount of OH− is released during the cement hydration process, which makes the cement paste highly basic. In this study, cement was employed to remove GO from an aqueous solution, and the effects of the cement dosage, the GO concentration and volume, and the amount of hydrated cement paste prepared with different contact times, on GO coagulation behavior were investigated in detail.
2. Experimental Section
2.1. Materials
Cement was purchased from Huaying TCC Cement Co., Ltd. (Chongqing, China). The cement type was ordinary silicate P.O. 42.5R, which was used directly without further purification. The GO was provided by the Chongqing Institute of Green and Intelligent Technology, Chinese Academy of Sciences. Prior to experiments, the GO was dispersed into ultrapure water to prepare a stock suspension (0.2 mg/mL, 0.4 mg/mL and 0.6 mg/mL) at room temperature and was used in the following experiments.
2.2. Characterization
The samples were characterized by X-ray diffraction (XRD) using a Brooke D8 diffractometer at a voltage of 40 kV and a current of 40 mA, with Cu Kα radiation (k = 1.541 Å), to analyze the crystal structure. The XRD pattern was recorded with a scanning rate of 0.1°s−1 in the 2θ ranging from 5° to 100°. Scanning electron microscopy (SEM) images were obtained with a ZEISS SIGMA 300 field emission scanning electron microscope, with acceleration voltage of 30 kV. High-resolution transmission electron microscopy (HRTEM) was performed on a FEI Tecnai G2 F20 field-emission transmission electron microscopy, at an accelerating voltage of 200 kV. X-ray photoelectron spectroscopy (XPS) measurements were performed on a Thermo Fisher ESCALAB 250XI photoelectron spectrometer using monochromatic Al Kα X-ray source (hv = 1486.6 eV). Raman scattering measurements were carried out at room temperature with a LabRAM HR Evolution micro-Raman spectrometer (HORIBA Jobin Yvon S.A.S, Paris, France).
2.3. Coagulation Tests
The batch coagulation experiments using cement were carried out in conical flasks of 500 mL or 1000 mL, at a constant magnetic stirring speed of 1000 rpm. The typical procedure was as follows: a certain amount of cement was added to the pre-prepared GO solution and, at given time intervals, 5 mL of the aliquot was withdrawn, centrifuged, and the supernatant GO concentration was monitored by UV-Vis spectrometer at the wavelength of 227 nm. The effects of the dosage of cement and GO concentration, on the removal efficiency of GO were investigated.
According to the blank tests, the coagulation of GO onto the transparent bottle-wall was negligible. So the amount of GO coagulated by cement was calculated from the difference between the initial concentration (C0) and the equilibrium concentration (Ce). The coagulation capacity (qe) of GO onto cement and the removal percentage (R), were calculated using the following equations:
where qe (mg/g) was the amount of GO adsorbed at equilibrium, C0 and Ce (mg/mL) were the initial and equilibrium concentrations of GO in the solution, V was the volume of the suspension (mL), m was the mass of cement (g), and R meant the removal percentage of GO.
3. Results and Discussion
3.1. Batch Coagulation Experiments
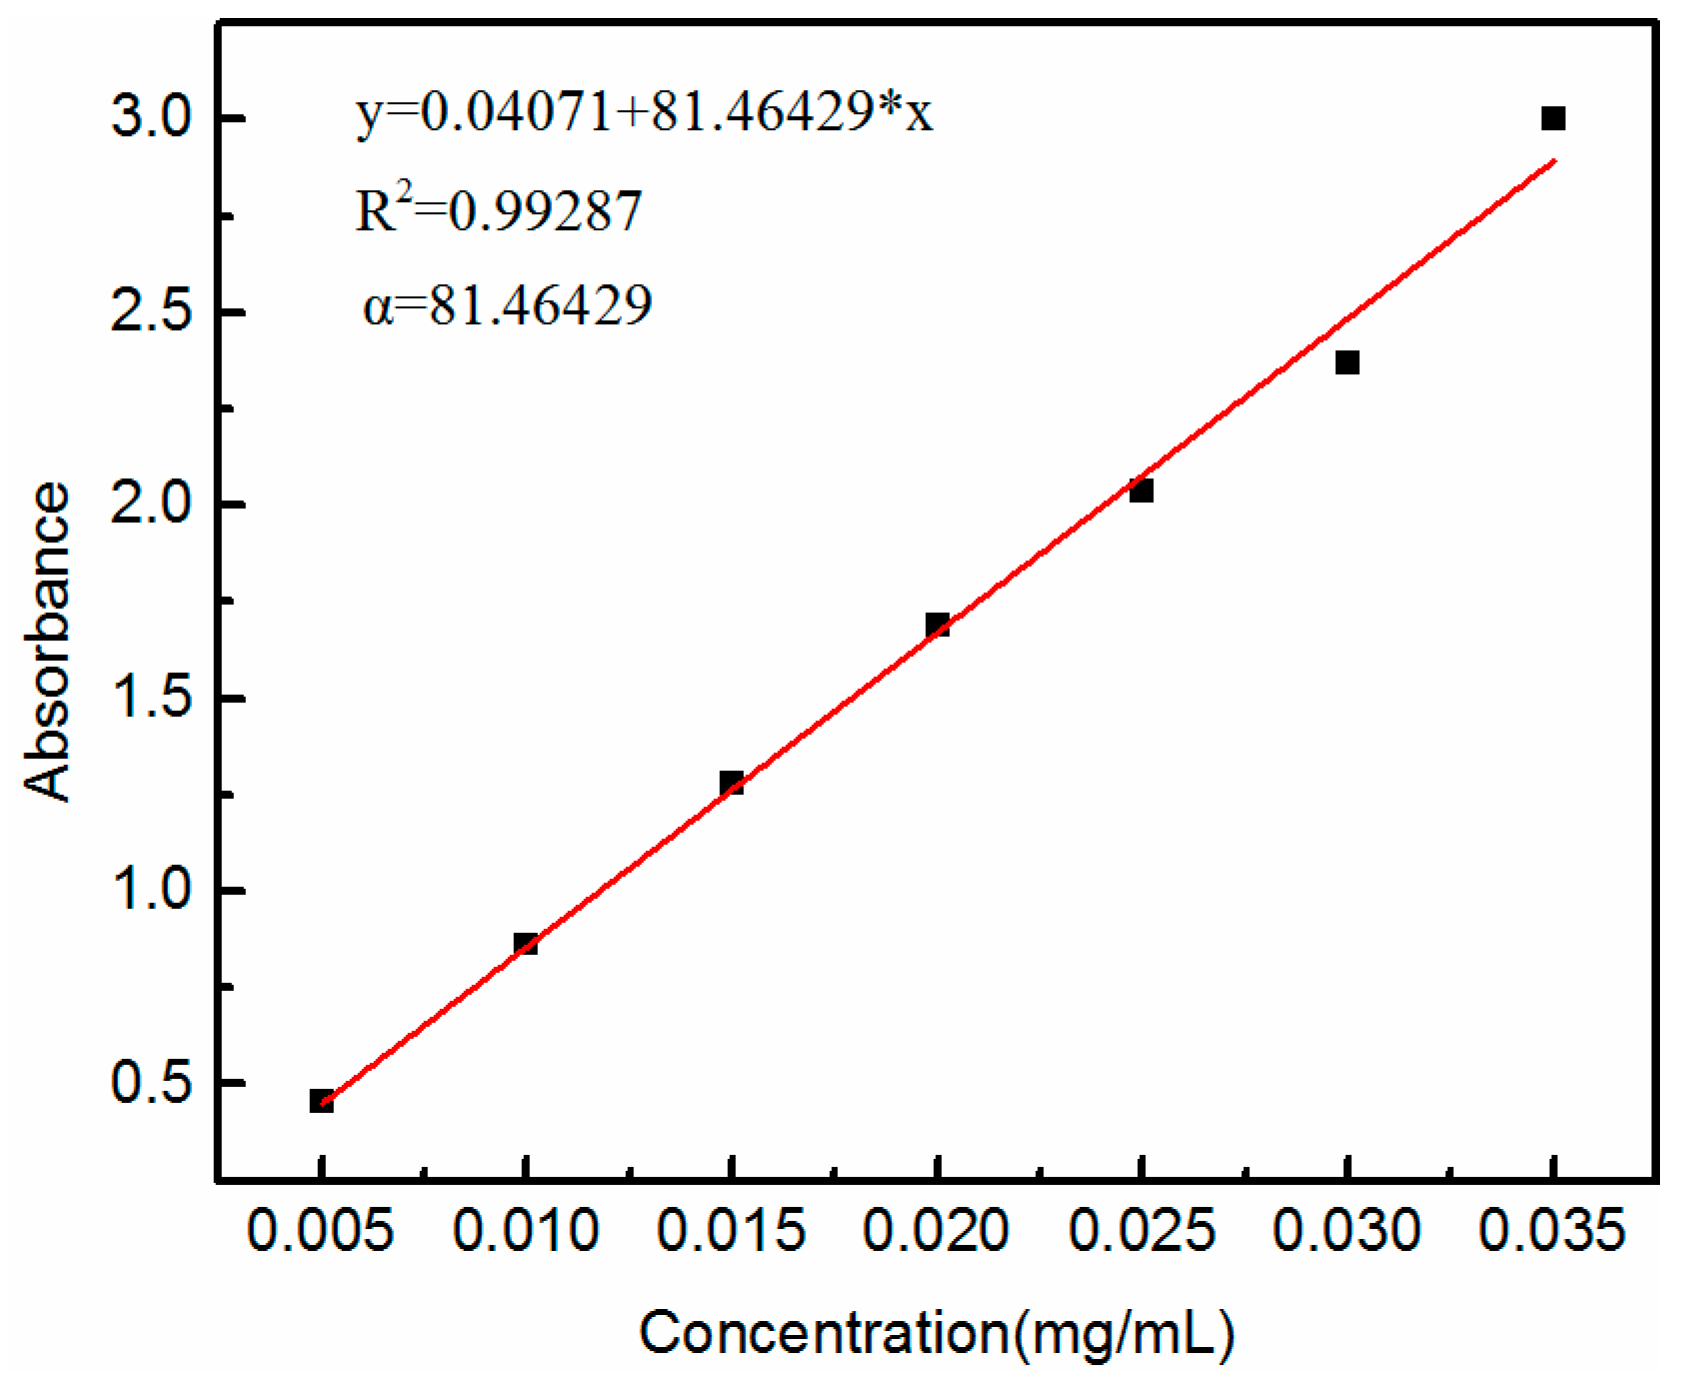
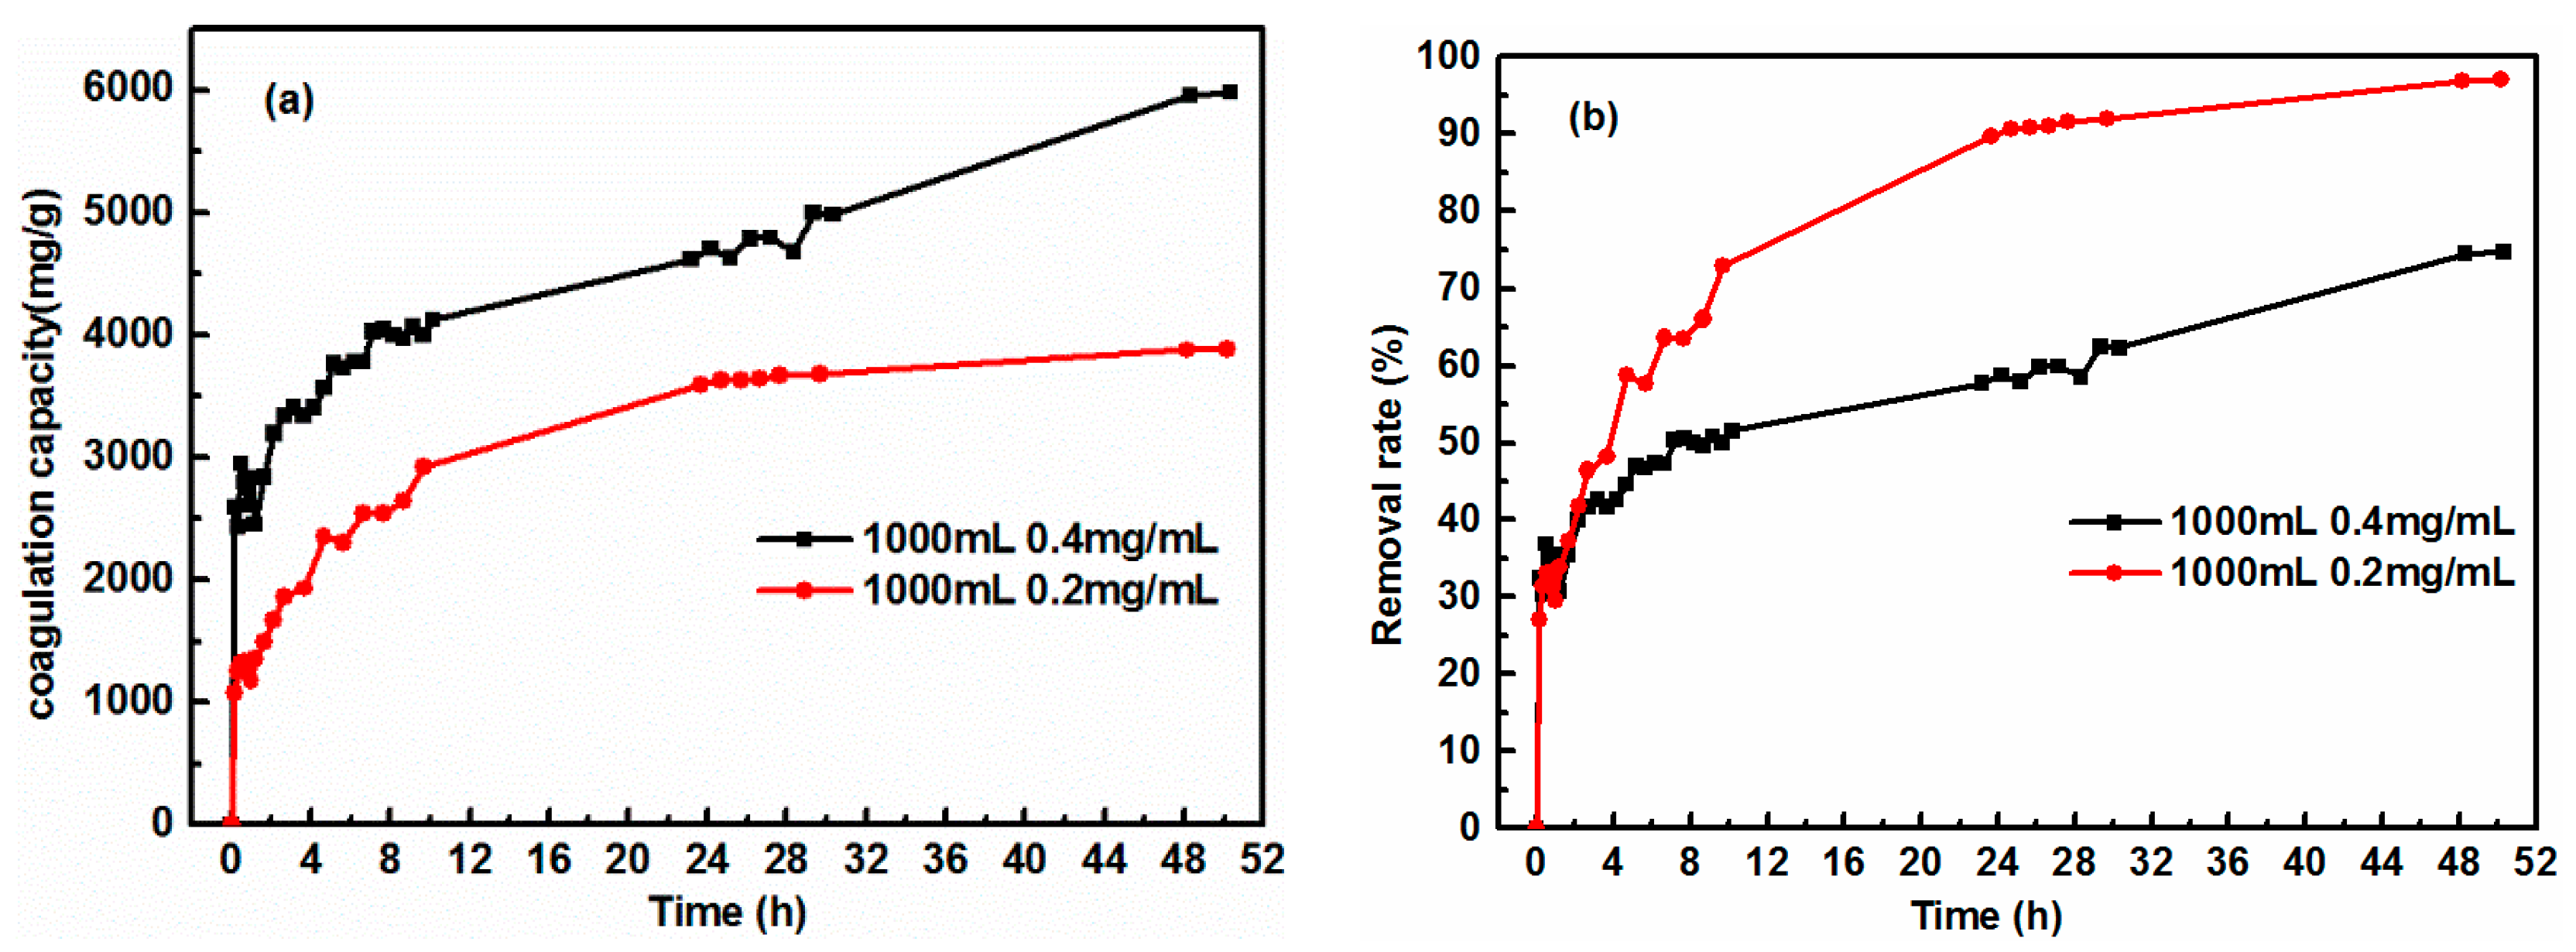
Cement dosage is an important factor affecting the coagulation property of GO, due to the active sites and effective contact areas of cement, and should be considered in low-cost practical environmental remediation [29]. Before conducting the GO coagulation experiments, one must consider how to precisely monitor the concentration of GO solution during the whole coagulation process. Several control experiments were tried and it was found that the adsorption intensity of aqueous GO solution at 227 nm obeys Beer-Lambert Law at GO concentration below 0.03 mg/mL (Figure 1) [21]. The absorption coefficient (α) for GO at the wavelength of 227 nm was 81.46429 L/(g·cm). In order to obtain the removal rate of cement for GO, a well-designed experiment to achieve equilibrium of coagulation using low sorbent loading and high GO concentration (0.4 and 0.6 mg/mL) was attempted. Figure 2 shows the variation of coagulation capacity and removal percentage of GO, using different volumes (500 and 1000 mL) and concentrations (0.4 and 0.6 mg/mL) of GO solution, and 0.1 g cement. Unexpectedly, cement could completely remove GO within one hour, indicating that cement exhibited superfast coagulation behavior toward aqueous GO. In order to obtain the equilibrium coagulation capacity of cement for GO, further reductions in the dosage of cement were conducted. Figure 3 presents the effect of contact time on the coagulation capacity of cement with 0.2 and 0.4 mg/mL GO concentrations and 0.05 g cement. As the contact time was extended, the coagulation capacity gradually increased. Note that the coagulation rate was very fast within the first period of 8 h, then gradually slowed down and plateaued after 32 h, suggesting that coagulation equilibrium was achieved within 50 h. Meanwhile, when the dosage of cement was 0.05 g, a significantly high GO coagulation capacity of 3884.4 and 5981.2 mg/g was successfully achieved with GO concentrations of 0.2 and 0.4 mg/mL, respectively.
According to the recent literature surveyed, several adsorbents/coagulants have been used to remove GO, and these are listed in Table 1. Compared to the findings reported in other papers, it is clear that the cement in our study exhibited superhigh coagulation capacity with a very fast removal rate, as discussed above. Moreover, cement, as a common building material, is cheaper than other coagulants/adsorbents, whose price is about $57 per ton. In brief, cement may be the most promising coagulant for the removal of GO from water.
3.2. Coagulation Kinetics
Coagulation kinetics were investigated to better understand the mechanism of GO coagulation. The experimental data were modeled using the pseudo first-order and pseudo second-order models to evaluate the coagulation kinetics of GO. Pseudo-first-order (Equation (3)) and pseudo-second-order (Equation (4)) models [20] were used to fit the coagulation data as follows:
where qe and qt (mg/g) are the coagulation capacity of GO at equilibrium and at times t, respectively. The values of qe and k1 can be determined from the intercept and slope of the linear plot of ln(qe − qt) vs. t where k1 (1/h) is the rate constant of the pseudo first-order and k2 (g/mg·h) is the rate constant of the pseudo second-order coagulation. The values of qe and k2 can be obtained from the slope and intercept of the plots of t/qt against t as shown in Figure 4 and Figure 5.
Table 2 lists the kinetic parameters calculated from the linear regression for the pseudo first-order equation (qe, k1) and the pseudo second-order kinetic model (qe, k2). For each case, the corresponding correlation coefficients R2 are also shown.
The comparison between the experimental coagulation capacity (qexp) value and the calculated coagulation capacity (qcal) value showed that the qcal value was very close to the qexp value for the pseudo second-order kinetics (Figure 5). Therefore, the GO coagulation process by cement could be approximated by a pseudo second-order model, which was further confirmed by the correlation coefficient value R2 for the pseudo second-order model (Figure 5), which was higher than that for the pseudo first-order model (Figure 4). Such a finding is also in good agreement with previous studies about wastewater treatments [31,32].
3.3. Structure Analysis of Cement-Induced GO Coagulation Products
In order to further understand the state of functional groups and to explore the possible coagulation mechanism, a number of characterizations and control experiments were performed.
The morphology of the coagulation products of GO by cement (CPGC) are shown in Figure 6. The CPGC were obtained with 0.4 mg/mL GO aggregated by 0.1 g cement for 10 h. From Figure 6a,b, it can be seen that the GO were restacked together, further confirming the successful GO aggregate induced by cement. In Figure 6c,d, silk-like films, characteristic of multilayers of GO sheets, were clearly detected. Needle rod crystals were also observed, assigned to the AFt (an early hydration product of cement). Moreover, the TEM images revealing the fine-structure of the CPGC are more clearly are shown in Figure 7. The relatively transparent areas indicated the fine structure of few-layered GO nanosheets (Figure 7a), and the darker areas were due to the hydration products of cement (Figure 7b). The hydrated products of cement were clearly found to be randomly distributed on the surface of the GO nanosheets because of the large specific surface of GO [33]. The overall morphology of the CPGC composite was the relatively heterogeneous amorphous characteristic and the silk-like flakey structure (Figure 7a–c). The spacing between graphene oxide nanoplatelets was 0.34 nm (Figure 7d).
Figure 8 depicts the XRD patterns for the GO coagulation products using cement at different contact times. For the purpose of comparison, all XRD peaks for hydration products of cement aged for 24 h (HPC 24 h, in which the same dosage of cement to distilled water was used, hydration products of cement were collected for 24 h, and hydration was terminated with anhydrous ethanol) were also marked in the XRD patterns. An initial comparison of the peak intensities between CPGC and the cement hydration products provided some insights into the composition of GO coagulation products induced by cement. During the cement hydration process, a series of complex chemical reactions between cement clinker minerals and water take place, generating C-S-H, AFt, CH and AFm [34]. These hydrated products were also found in the XRD diffraction of CPGC. In the XRD pattern, intensive peak at 2θ = 11.8° was assigned to the characteristic peak of GO, and the basal space value of (d001) was 0.34 nm, which was highly consistent with the interlayer value calculated by TEM (shown in Figure 7d), indicating that the oxygen-containing functional groups were introduced into the GO sheets [35]. Furthermore, the diffraction peaks at 2θ = 18°, 22°, 29.6°, 32°, 33°, 34°, 41.8°, 52° correspond to CH, gypsum, alite, belite, aluminate, ferrite, periclase, and alite, indicating that GO-coagulation did not affect the intrinsic hydration of the cement [36,37].
In order to give more detailed information about the coagulation mechanism, the CPGC were analyzed using XPS (Figure 9). The XPS survey spectra of the CPGC revealed that Fe, O, Ca, C, Si and Al were the predominant elements of the as-prepared product from the binding energy values of Fe 2p3, O 1s, Ca 2p, C 1s, Si 2p and Al 2p upon hydration of cement in aqueous GO solution, confirming the hydration products of cement and GO phases in the CPGC composite. The high-resolution C1s spectra of CPGC composite could be further deconvoluted into three components: the non-oxygenated ring C (284.8 eV); the carbon in C-O (286.7 eV); and the carboxylate carbon (O-C=O, 289.0 eV) [38], which further suggested the successful GO coagulation induced by cement.
Figure 10 depicts the Raman spectrum of the CPGC. Raman scattering is strongly sensitive to the electronic structure, and has proved to be an essential tool for characterizing graphite and graphene materials [39,40]. Raman spectroscopy of graphene is generally characterized by two main features: the G-peak, which arises from first-order scattering of the E2g phonon from sp2 carbon atoms (generally observed at 1575 cm−1); and the D-peak (1355 cm−1), which arises from the breathing mode of κ-point photons of A1g symmetry [41]. Our results showed that the G-band and D-band of GO appeared at 1568 cm−1 and 1342 cm−1, respectively. Compared to those for pure GO, the G-band and D-band peaks exhibited significant blue-shift, suggesting a strong interfacial interaction between the cement hydration products and GO. The peaks of CGPC at 931, 1006 and 1137 cm−1 were attributed to AFt, gypsum, and C-S-H [42].
3.4. Coagulation Mechanism
The cement hydration process produces a large number of calcium ions, and it has been reported that Ca2+ has an aggressive effect on the colloidal stability of GO solution [43]. In order to clarify the role of Ca2+ in cement-induced coagulation of GO, a well-designed experiment was attempted to measure the Ca2+ concentration released by cement hydration while depositing GO with the same concentration of Ca2+. One gram of cement was put into 500 mL of distilled water, and the maximum amount of Ca2+ was 6.87 × 10⁻⁴ mol as measured by the ethylenediaminetetraacetic acid (EDTA) method [44]. Then, using CaCl2 as the Ca2+ source, the equal molar amount of CaCl2 (0.0508 g) was added to a 500 mL solution of 0.4 mg/mL GO. After being stirred for 50 h at 1000 rpm, the supernatant GO solution was collected. By measuring the concentration difference before and after the addition of CaCl2, Ca2+-induced coagulation capacity was calculated to be 3940.7 mg/g, which accounted for more than 50% in the maximum GO coagulation capacity of cement. This confirmed that Ca2+ decreased the stability of GO and displayed an aggressive ability in GO aggregation [45] because of the binding capacity of Ca2+ ions with hydroxyl and carboxyl functional groups of GO [46]. Therefore, we believe that one of the mechanisms of GO removal by cement was Ca2+-induced coagulation.
An experiment was devised in order to further elaborate the possible mechanism of GO removal caused by the physical adsorption of HPC. The cement was put into water to start a hydration reaction, and the solid samples of HPC were taken at 2, 6 and 24 h, respectively. The initial coagulation rate of GO by cement was very fast. Likewise, the amount of Ca2+ released was highest during the first two hours of the cement hydration process. Hence, we chose to stop the hydration at two hours and make it an adsorbent. The hydration process of each sample was terminated with anhydrous ethanol [47]. Then, adsorption experiments were conducted using 0.05 g of solid sample of the above HPC prepared at different times and 1000 mL of 0.4 mg/mL GO solution. As shown in Figure 11, it was found that the adsorption capacities were 5362, 5700 and 5956 mg/g for the HPC samples at 2, 6, and 24 h (abbreviated as HPC 2 h, HPC 6 h, HPC 24 h), respectively. The adsorption capacity of HPC gradually increased as the hydration time increased and its value was high enough that it was, to some extent, responsible for the ultrahigh capacity of GO coagulation caused by cement. Therefore, one can easily conclude that the adsorption of HPC for GO was also an indispensable mechanism involved in the cement-induced GO coagulation process described.
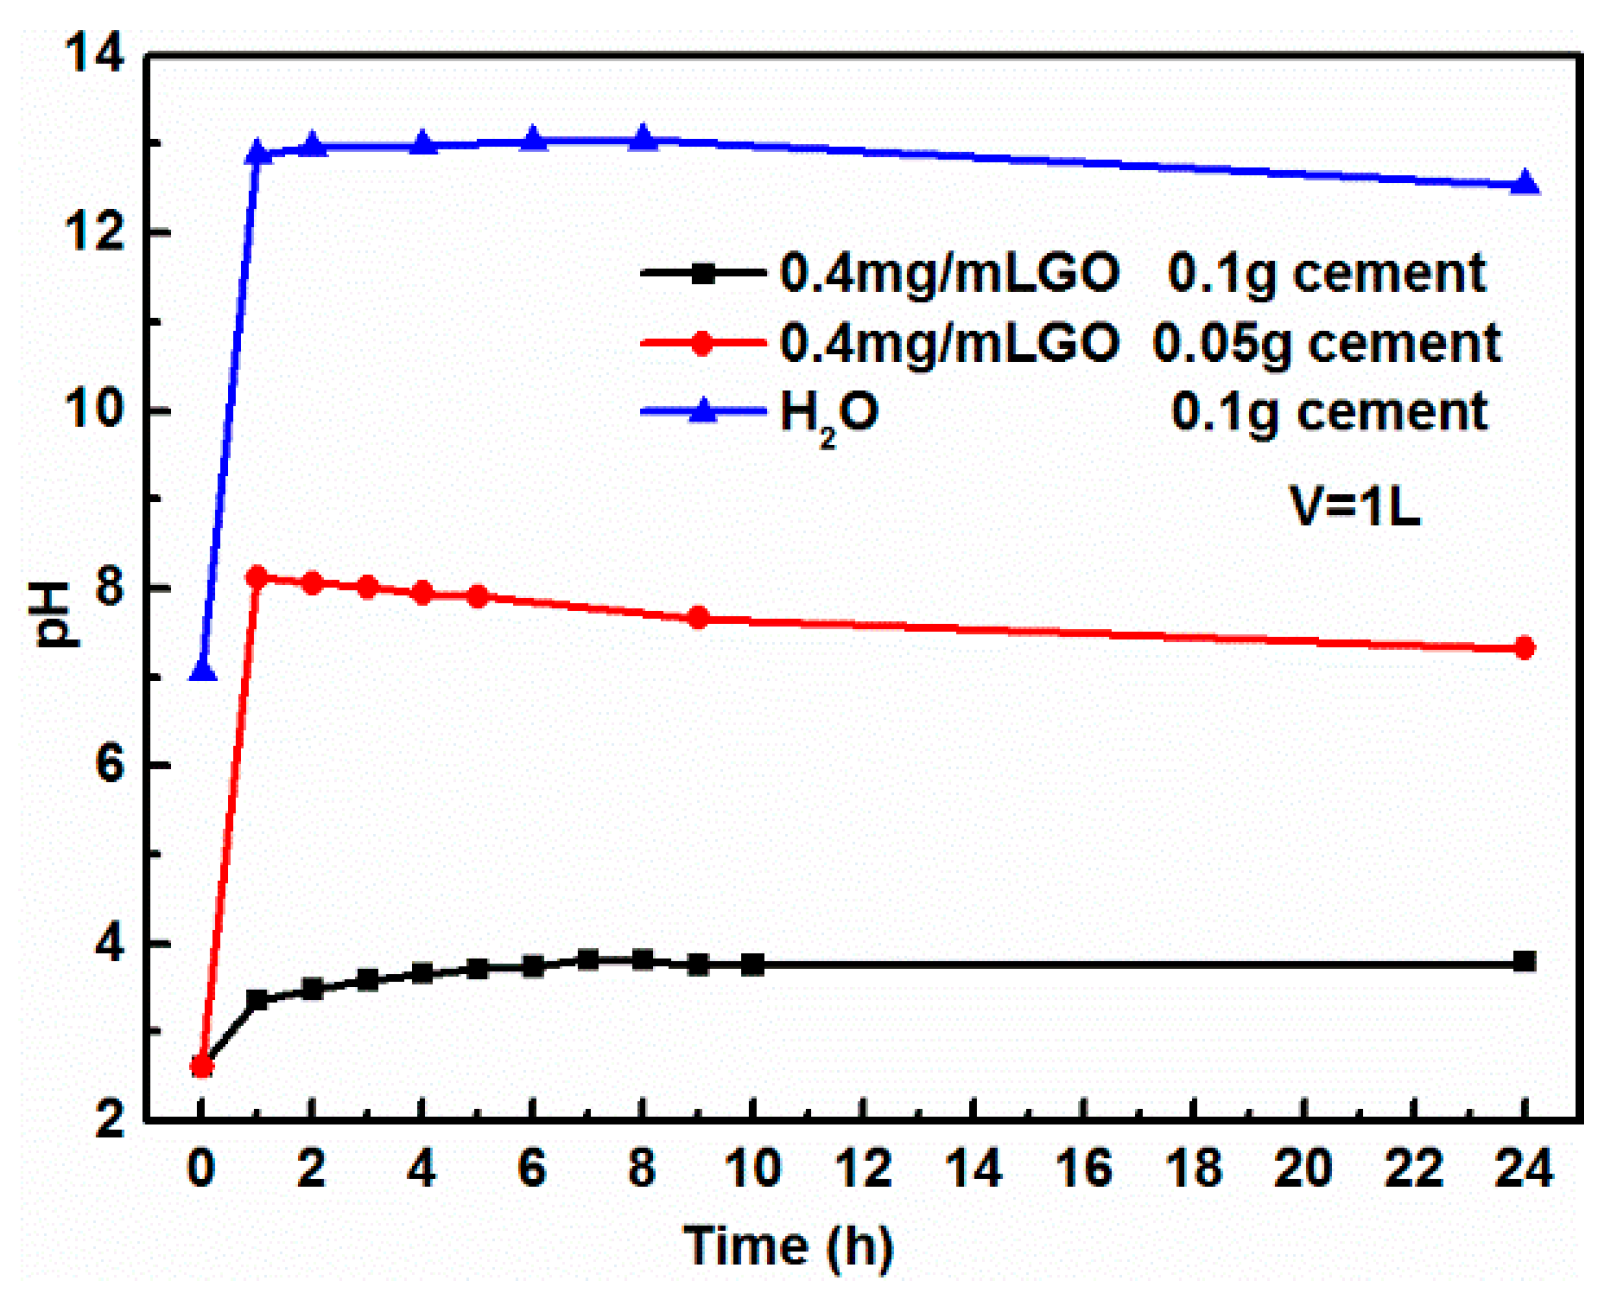
It has been reported that the critical concentration of GO, above which the stacking interactions play a role, is 0.017 mg/mL for a phosphate buffer of pH 7.4 [7]. It can be seen in Figure 12 that the initial pH of GO was 2.62, much lower than the pH of the phosphate buffer, while GO is very stable under acidic conditions. The coagulation of GO was pH-dependent. As soon as the cement hydration began, the pH of the slurry quickly increased slightly to about 13.0 because a lot of OH− were rapidly released from the surface of the cement particles [48]. As shown in Figure 12, when cement was added to the GO solution, the pH value sharply increased within 1 h. However, the pH of the mixture solution decreased slowly until stable after contact time of 24 h. Combined with the Raman analysis above, it could be inferred that there was a chemical reaction between OH− produced by cement hydration and the carboxyl and epoxy groups on the surface of the GO nanosheets, which could account for the slight decrease in the solution pH at the last stage of this coagulation.
4. Conclusions
Cement-induced coagulation of aqueous GO exhibited ultrahigh capacity and high rate behavior. The GO removal capacity of cement was dependent on contact time, the dosage of cement, and the concentration and volume of the aqueous GO solution. This coagulation process was well-fitted by the pseudo-second-order model. The coagulation mechanism of GO on the cement included Ca2+-induced coagulation of GO and adsorption by the cement hydration products. The study demonstrated that cement is a promising adsorbent for the coagulation of GO from water. It is worthy of note that the GO coagulation product using cement can be further used as high-performance building material [49].
Author Contributions
X.Y. conceived and designed the experiments; J.N. and J.Z. conducted the experiments; J.N. and Q.J. analyzed the data; all the authors contributed to the paper preparation; X.Y. and J.N. wrote the paper.
Funding
The National Natural Science Foundation of China (No. 51402030); the Natural Science Foundation of the Chongqing Science and Technology Commission (cstc2017jcyjBX0028).
Conflicts of Interest
The authors declare no conflicts of interest.
References
- Stankovich, S.; Piner, R.D.; Nguyen, S.T.; Ruoff, R.S. Synthesis and exfoliation of isocyanate-treated graphene oxide nanoplatelets. Carbon 2006, 44, 3342–3347. [Google Scholar] [CrossRef]
- Qi, C.; Zhao, L.; Lin, Y.; Wu, D. Graphene oxide/chitosan sponge as a novel filtering material for the removal of dye from water. J. Colloid Interface Sci. 2018, 517, 18–27. [Google Scholar] [CrossRef] [PubMed]
- Dou, M.; Sanjay, S.T.; Dominguez, D.C.; Zhan, S.; Li, X. A paper/polymer hybrid cd-like microfluidic spinchip integrated with DNA-functionalized graphene oxide nanosensors for multiplex qlamp detection. Chem. Commun. 2017, 53, 10886–10889. [Google Scholar] [CrossRef] [PubMed]
- Ogata, C.; Kurogi, R.; Hatakeyama, K.; Taniguchi, T.; Koinuma, M.; Matsumoto, Y. All-graphene oxide device with tunable supercapacitor and battery behaviour by the working voltage. Chem. Commun. 2016, 52, 3919–3922. [Google Scholar] [CrossRef] [PubMed]
- Del Mercato, L.L.; Guerra, F.; Lazzari, G.; Nobile, C.; Bucci, C.; Rinaldi, R. Biocompatible multilayer capsules engineered with a graphene oxide derivative: Synthesis, characterization and cellular uptake. Nanoscale 2016, 8, 7501–7512. [Google Scholar] [CrossRef] [PubMed]
- Ratajczak, K.; Krazinski, B.; Kowalczyk, A.; Dworakowska, B.; Jakiela, S.; Stobiecka, M. Optical biosensing system for the detection of survivin mRNA in colorectal cancer cells using a graphene oxide carrier-bound oligonucleotide molecular beacon. Nanomaterials 2018, 8. [Google Scholar] [CrossRef] [PubMed]
- Stobiecka, M.; Dworakowska, B.; Jakiela, S.; Lukasiak, A.; Chalupa, A.; Zembrzycki, K. Sensing of survivin mrna in malignant astrocytes using graphene oxide nanocarrier-supported oligonucleotide molecular beacons. Sens. Actuators B Chem. 2016, 235, 136–145. [Google Scholar] [CrossRef]
- Yu, S.; Wang, X.; Zhang, R.; Yang, T.; Ai, Y.; Wen, T.; Huang, W.; Hayat, T.; Alsaedi, A.; Wang, X. Complex roles of solution chemistry on graphene oxide coagulation onto titanium dioxide: Batch experiments, spectroscopy analysis and theoretical calculation. Sci. Rep. 2017, 7, 39625. [Google Scholar] [CrossRef] [PubMed]
- Pecoraro, R.; D’Angelo, D.; Filice, S.; Scalese, S.; Capparucci, F.; Marino, F.; Iaria, C.; Guerriero, G.; Tibullo, D.; Scalisi, E.M.; et al. Toxicity evaluation of graphene oxide and titania loaded nafion membranes in zebrafish. Front. Physiol. 2018, 8, 1039. [Google Scholar] [CrossRef] [PubMed]
- Souza, J.P.; Venturini, F.P.; Santos, F.; Zucolotto, V. Chronic toxicity in ceriodaphnia dubia induced by graphene oxide. Chemosphere 2018, 190, 218–224. [Google Scholar] [CrossRef] [PubMed]
- Kryuchkova, M.; Danilushkina, A.; Lvov, Y.; Fakhrullin, R. Evaluation of toxicity of nanoclays and graphene oxide in vivo: A paramecium caudatum study. Environ. Sci. Nano 2016, 3, 442–452. [Google Scholar] [CrossRef]
- Li, X.; Li, F.; Gao, Z.; Fang, L. Toxicology of graphene oxide nanosheets against paecilomyces catenlannulatus. Bull. Environ. Contam. Toxicol. 2015, 95, 25–30. [Google Scholar] [CrossRef] [PubMed]
- Ghorbanpour, M.; Khaltabadi Farahani, A.H.; Hadian, J. Potential toxicity of nano-graphene oxide on callus cell of plantago major l. Under polyethylene glycol-induced dehydration. Ecotoxicol. Environ. Saf. 2018, 148, 910–922. [Google Scholar] [CrossRef]
- Wen, K.-P.; Chen, Y.-C.; Chuang, C.-H.; Chang, H.-Y.; Lee, C.-Y.; Tai, N.-H. Accumulation and toxicity of intravenously-injected functionalized graphene oxide in mice. J. Appl. Toxicol. 2015, 35, 1211–1218. [Google Scholar] [CrossRef] [PubMed]
- Chen, M.; Yin, J.; Liang, Y.; Yuan, S.; Wang, F.; Song, M.; Wang, H. Oxidative stress and immunotoxicity induced by graphene oxide in zebrafish. Aquat. Toxicol. 2016, 174, 54–60. [Google Scholar] [CrossRef] [PubMed] [Green Version]
- Zou, Y.; Wang, X.; Chen, Z.; Yao, W.; Ai, Y.; Liu, Y.; Hayat, T.; Alsaedi, A.; Alharbi, N.S.; Wang, X. Superior coagulation of graphene oxides on nanoscale layered double hydroxides and layered double oxides. Environ. Pollut. 2016, 219, 107–117. [Google Scholar] [CrossRef] [PubMed]
- Zamri, M.F.M.A.; Kamaruddin, M.A.; Yusoff, M.S.; Aziz, H.A.; Foo, K.Y. Semi-aerobic stabilized landfill leachate treatment by ion exchange resin: Isotherm and kinetic study. Appl. Water Sci. 2017, 7, 581–590. [Google Scholar] [CrossRef]
- Guo, S.; Jiang, Y.; Li, L.; Huang, X.; Zhuang, Z.; Yu, Y. Thin cuox-based nanosheets for efficient phenol removal benefitting from structural memory and ion exchange of layered double oxides. J. Mater. Chem. A 2018, 6, 4167–4178. [Google Scholar] [CrossRef]
- Yuan, X.; Wang, Y.; Wang, J.; Zhou, C.; Tang, Q.; Rao, X. Calcined graphene/MgAl-layered double hydroxides for enhanced Cr(VI) removal. Chem. Eng. J. 2013, 221, 204–213. [Google Scholar] [CrossRef]
- Yuan, X.; Niu, J.; Lv, Y.; Jing, Q.; Li, L. Ultrahigh-capacity and fast-rate removal of graphene oxide by calcined mgal layered double hydroxide. Appl. Clay Sci. 2018, 156, 61–68. [Google Scholar] [CrossRef]
- Wang, J.; Wang, X.; Tan, L.; Chen, Y.; Hayat, T.; Hu, J.; Alsaedi, A.; Ahmad, B.; Guo, W.; Wang, X. Performances and mechanisms of Mg/Al and Ca/Al layered double hydroxides for graphene oxide removal from aqueous solution. Chem. Eng. J. 2016, 297, 106–115. [Google Scholar] [CrossRef]
- Matlock, M.M.; Howerton, B.S.; Atwood, D.A. Chemical precipitation of lead from lead battery recycling plant wastewater. Ind. Eng. Chem. Res. 2002, 41, 1579–1582. [Google Scholar] [CrossRef]
- Ghaffar, A.; Zhang, L.; Zhu, X.; Chen, B. Porous PVdF/GO nanofibrous membranes for selective separation and recycling of charged organic dyes from water. Environ. Sci. Technol. 2018, 52, 4265–4274. [Google Scholar] [CrossRef] [PubMed]
- Luo, Y.; Gao, B.; Yue, Q.; Li, R. Application of enteromorpha polysaccharides as coagulant aid in the simultaneous removal of CuO nanoparticles and Cu2+: Effect of humic acid concentration. Chemosphere 2018, 204, 492–500. [Google Scholar] [CrossRef] [PubMed]
- Zou, Y.; Wang, X.; Ai, Y.; Liu, Y.; Li, J.; Ji, Y.; Wang, X. Coagulation behavior of graphene oxide on nanocrystallined mg/al layered double hydroxides: Batch experimental and theoretical calculation study. Environ. Sci. Technol. 2016, 50, 3658–3667. [Google Scholar] [CrossRef] [PubMed]
- Wang, J.; Li, Y.; Chen, W.; Peng, J.; Hu, J.; Chen, Z.; Wen, T.; Lu, S.; Chen, Y.; Hayat, T.; et al. The rapid coagulation of graphene oxide on la-doped layered double hydroxides. Chem. Eng. J. 2017, 309, 445–453. [Google Scholar] [CrossRef]
- Wang, Q.; Shiyu, L.I.; Wang, J.; Pan, S.; Chunxiang, L.V.; Cui, X.; Guo, Z. Effect of graphene oxide on hydration process and main hydration products of cement. J. Chin. Ceram. Soc. 2018, 46, 163–172. [Google Scholar]
- Yao, Y.; Wang, X.; Yan, B.L.; Wang, L.; Liu, C. The research on heavy metal ions curing and its influence on the cement hydration process. Bull. Chin. Ceram. Soc. 2012, 7, e31494. [Google Scholar]
- Liu, B.; Qu, F.; Chen, W.; Liang, H.; Wang, T.; Cheng, X.; Yu, H.; Li, G.; Van der Bruggen, B. Microcystis aeruginosa-laden water treatment using enhanced coagulation by persulfate/fe(ii), ozone and permanganate: Comparison of the simultaneous and successive oxidant dosing strategy. Water Res. 2017, 125, 72–80. [Google Scholar] [CrossRef] [PubMed]
- Ren, X.; Li, J.; Tan, X.; Shi, W.; Chen, C.; Shao, D.; Wen, T.; Wang, L.; Zhao, G.; Sheng, G.; et al. Impact of Al2O3 on the aggregation and deposition of graphene oxide. Environ. Sci. Technol. 2014, 48, 5493–5500. [Google Scholar] [CrossRef] [PubMed]
- Ren, R.; Liu, D.; Li, K.; Sun, J.; Zhang, C. Adsorption of quaternary ammonium compounds onto activated sludge. J. Water Resour. Prot. 2011, 3, 105–133. [Google Scholar] [CrossRef]
- Li, Z.; Sun, Y.; Xing, J.; Xing, Y.; Meng, A. One step synthesis of co/cr-codoped zno nanoparticle with superb adsorption properties for various anionic organic pollutants and its regeneration. J. Hazard. Mater. 2018, 352, 204–214. [Google Scholar] [CrossRef] [PubMed]
- Zhang, R.; Cao, Y.; Li, P.; Zang, X.; Sun, P.; Wang, K.; Zhong, M.; Wei, J.; Wu, D.; Kang, F.; et al. Three-dimensional porous graphene sponges assembled with the combination of surfactant and freeze-drying. Nano Res. 2014, 7, 1477–1487. [Google Scholar] [CrossRef]
- Liu, G.Y.; Fan, L.; Gao, P.F.; Jin, D.Z. Early-age hydrates and paste structure of glass powder cement paste. Bull. Chin. Ceram. Soc. 2018, 37, 86–91. [Google Scholar]
- Zhu, X.H.; Kang, X.J.; Yang, K.; Yang, C.H. Effect of graphene oxide on the mechanical properties and the formation of layered double hydroxides (ldhs) in alkali-activated slag cement. Constr. Build. Mater. 2017, 132, 290–295. [Google Scholar] [CrossRef]
- Du, S. Effect of curing conditions on properties of cement asphalt emulsion mixture. Constr. Build. Mater. 2018, 164, 84–93. [Google Scholar] [CrossRef]
- Park, S.M.; Jang, J.G. Carbonation-induced weathering effect on cesium retention of cement paste. J. Nucl. Mater. 2018, 505, 159–164. [Google Scholar] [CrossRef]
- Wen, T.; Wu, X.; Tan, X.; Wang, X.; Xu, A. One-pot synthesis of water-swellable mgÔÇôal layered double hydroxides and graphene oxide nanocomposites for efficient removal of as(v) from aqueous solutions. ACS Appl. Mater. Interfaces 2013, 5, 3304–3311. [Google Scholar] [CrossRef] [PubMed]
- López-Díaz, D.; López Holgado, M.; García-Fierro, J.L.; Velázquez, M.M. Evolution of the raman spectrum with the chemical composition of graphene oxide. J. Phys. Chem. C 2017, 121, 20489–20497. [Google Scholar] [CrossRef]
- Li, Z.; Jiang, S.; Huo, Y.; Ning, T.; Liu, A.; Zhang, C.; He, Y.; Wang, M.; Li, C.; Man, B. 3D silver nanoparticles with multilayer graphene oxide as a spacer for surface enhanced raman spectroscopy analysis. Nanoscale 2018, 10, 5897–5905. [Google Scholar] [CrossRef] [PubMed]
- Gurunathan, S.; Han, J.W.; Dayem, A.A.; Eppakayala, V.; Kim, J.H. Oxidative stress-mediated antibacterial activity of graphene oxide and reduced graphene oxide in pseudomonas aeruginosa. Int. J. Nanomed. 2012, 7, 5901–5914. [Google Scholar] [CrossRef] [PubMed]
- Renaudin, G.; Segni, R.; Mentel, D.; Nedelec, J.-M.; Leroux, F.; Taviot-Gueho, C. A raman study of the sulfated cement hydrates: Ettringite and monosulfoaluminate. J. Adv. Concr. Technol. 2007, 5, 299–312. [Google Scholar] [CrossRef]
- Terracciano, A.; Zhang, J.; Christodoulatos, C.; Wu, F.; Meng, X. Adsorption of Ca2+ on single layer graphene oxide. J. Environ. Sci. 2017, 57, 8–14. [Google Scholar] [CrossRef] [PubMed]
- Cash, D. Edta Titrations 2: Analysis of Calcium in a Supplement Tablet; Analysis of Magnesium in Epsom Salt; Hardness of Water; Mohawk College of Applied Arts and Technology: Hamilton, ON, Canada, 2008. [Google Scholar]
- Yang, K.; Chen, B.; Zhu, X.; Xing, B. Aggregation, adsorption, and morphological transformation of graphene oxide in aqueous solutions containing different metal cations. Environ. Sci. Technol. 2016, 50, 11066–11075. [Google Scholar] [CrossRef] [PubMed]
- Fathy, M.; Abdel Moghny, T.; Mousa, M.A.; El-Bellihi, A.-H.A.A.; Awadallah, A.E. Absorption of calcium ions on oxidized graphene sheets and study its dynamic behavior by kinetic and isothermal models. Appl. Nanosci. 2016, 6, 1105–1117. [Google Scholar] [CrossRef] [Green Version]
- Wang, P.; Linglin, X.U.; Zhang, G. Hydration properties of portland cement at 0 °C to 20 °C. Mater. Rev. 2012, 27, 253–260. [Google Scholar]
- MacLaren, D.C.; White, M.A. Cement: Its chemistry and properties. J. Chem. Educ. 2003, 80, 623. [Google Scholar] [CrossRef]
- Lu, Z.; Hanif, A.; Sun, G.; Liang, R.; Parthasarathy, P.; Li, Z. Highly dispersed graphene oxide electrodeposited carbon fiber reinforced cement-based materials with enhanced mechanical properties. Cem. Concr. Compos. 2018, 87, 220–228. [Google Scholar] [CrossRef]
Figure 1.
The correlation between graphene oxide (GO) concentrations and its UV absorbance intensity at 227 nm.
Figure 1.
The correlation between graphene oxide (GO) concentrations and its UV absorbance intensity at 227 nm.

Figure 2.
(a) Coagulation capacity, and (b) removal rate of GO vs. contact time using 0.1 g cement.

Figure 3.
(a) Coagulation capacity, and (b) removal rate of GO vs. contact time using 0.05 g cement with the GO volume of 1000 mL, 0.2 and 0.4 mg/mL, respectively.
Figure 3.
(a) Coagulation capacity, and (b) removal rate of GO vs. contact time using 0.05 g cement with the GO volume of 1000 mL, 0.2 and 0.4 mg/mL, respectively.

Figure 4.
Pseudo first-order kinetics with different GO concentrations.
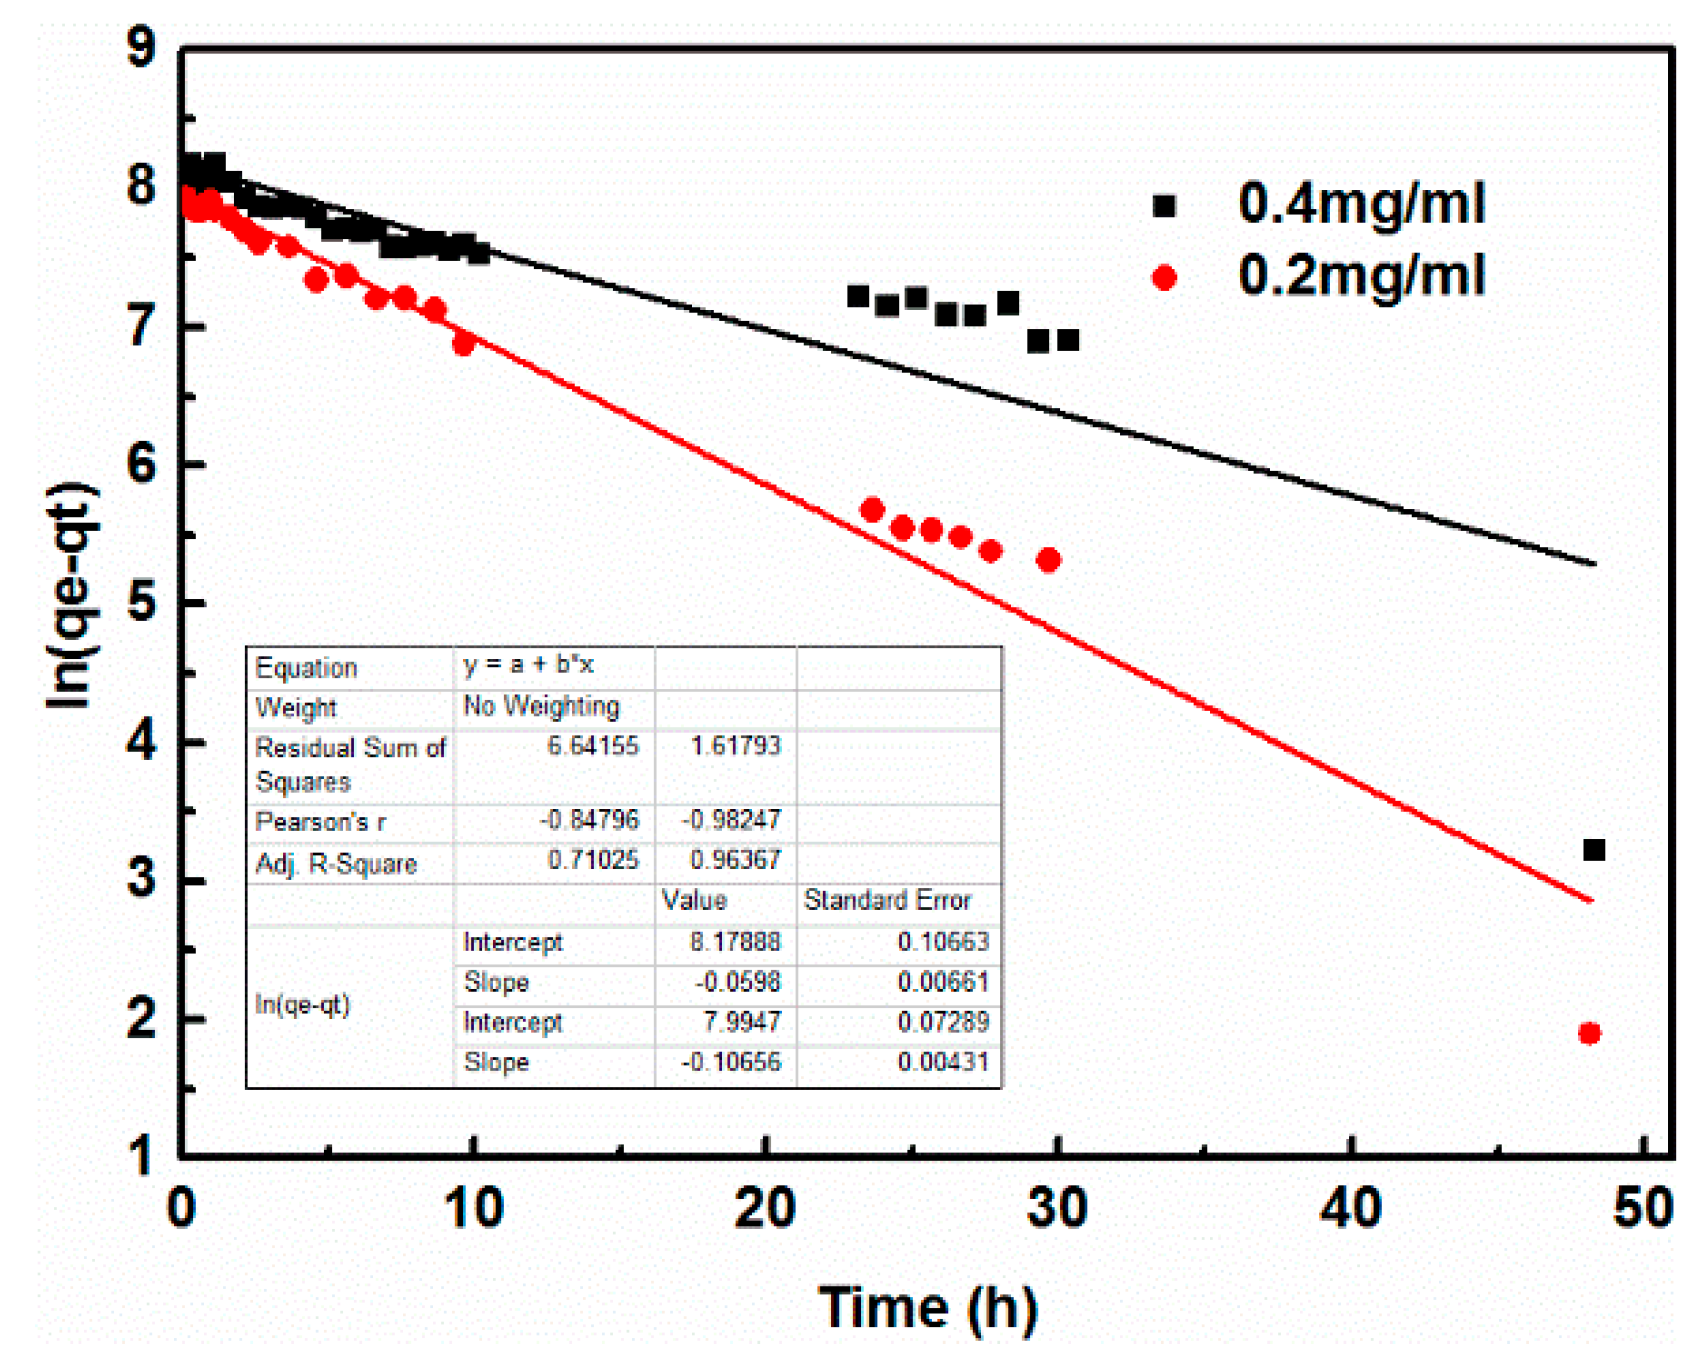
Figure 5.
Pseudo second-order kinetics with different GO concentrations.
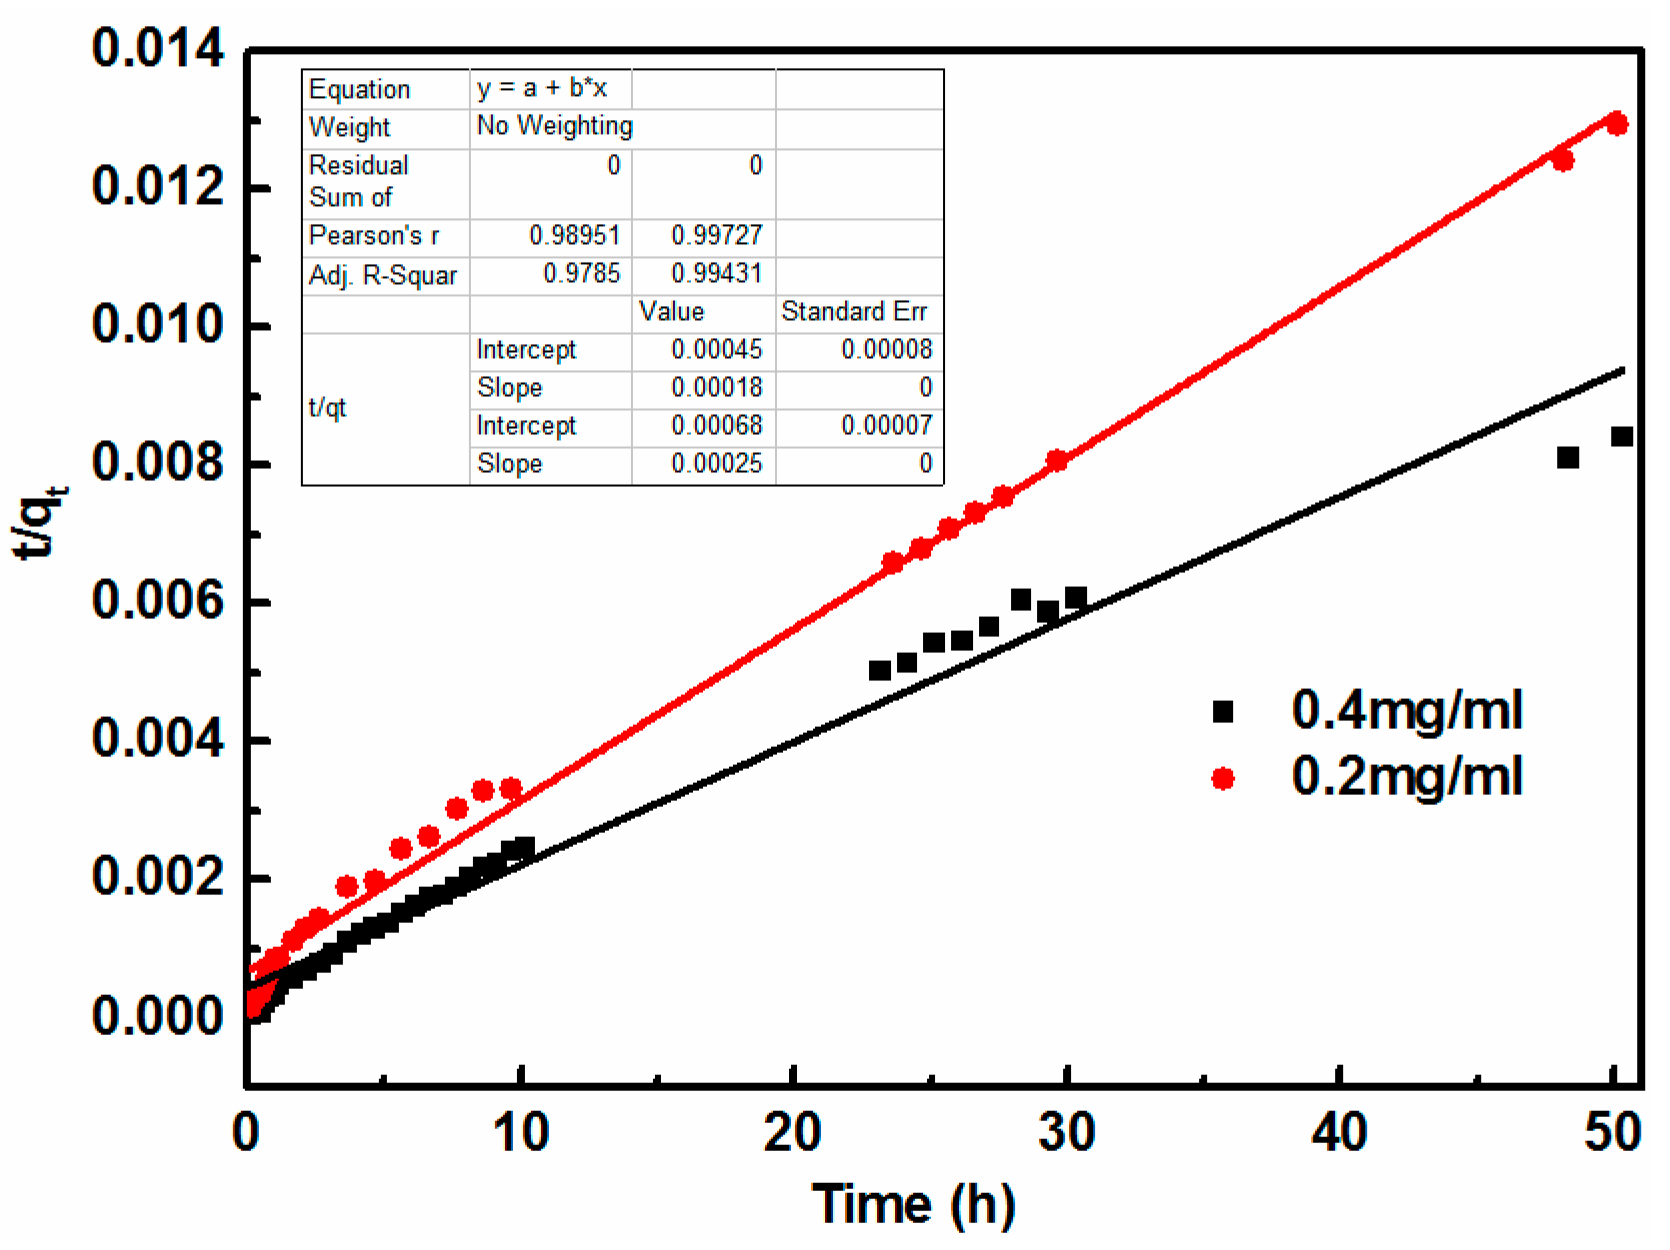
Figure 6.
SEM images recorded for coagulation products of GO by cement (CPGC) for 10 h with different scale bar (a) 2 μm; (b) 1 μm; (c) 1 μm; (d) 300 nm.
Figure 6.
SEM images recorded for coagulation products of GO by cement (CPGC) for 10 h with different scale bar (a) 2 μm; (b) 1 μm; (c) 1 μm; (d) 300 nm.
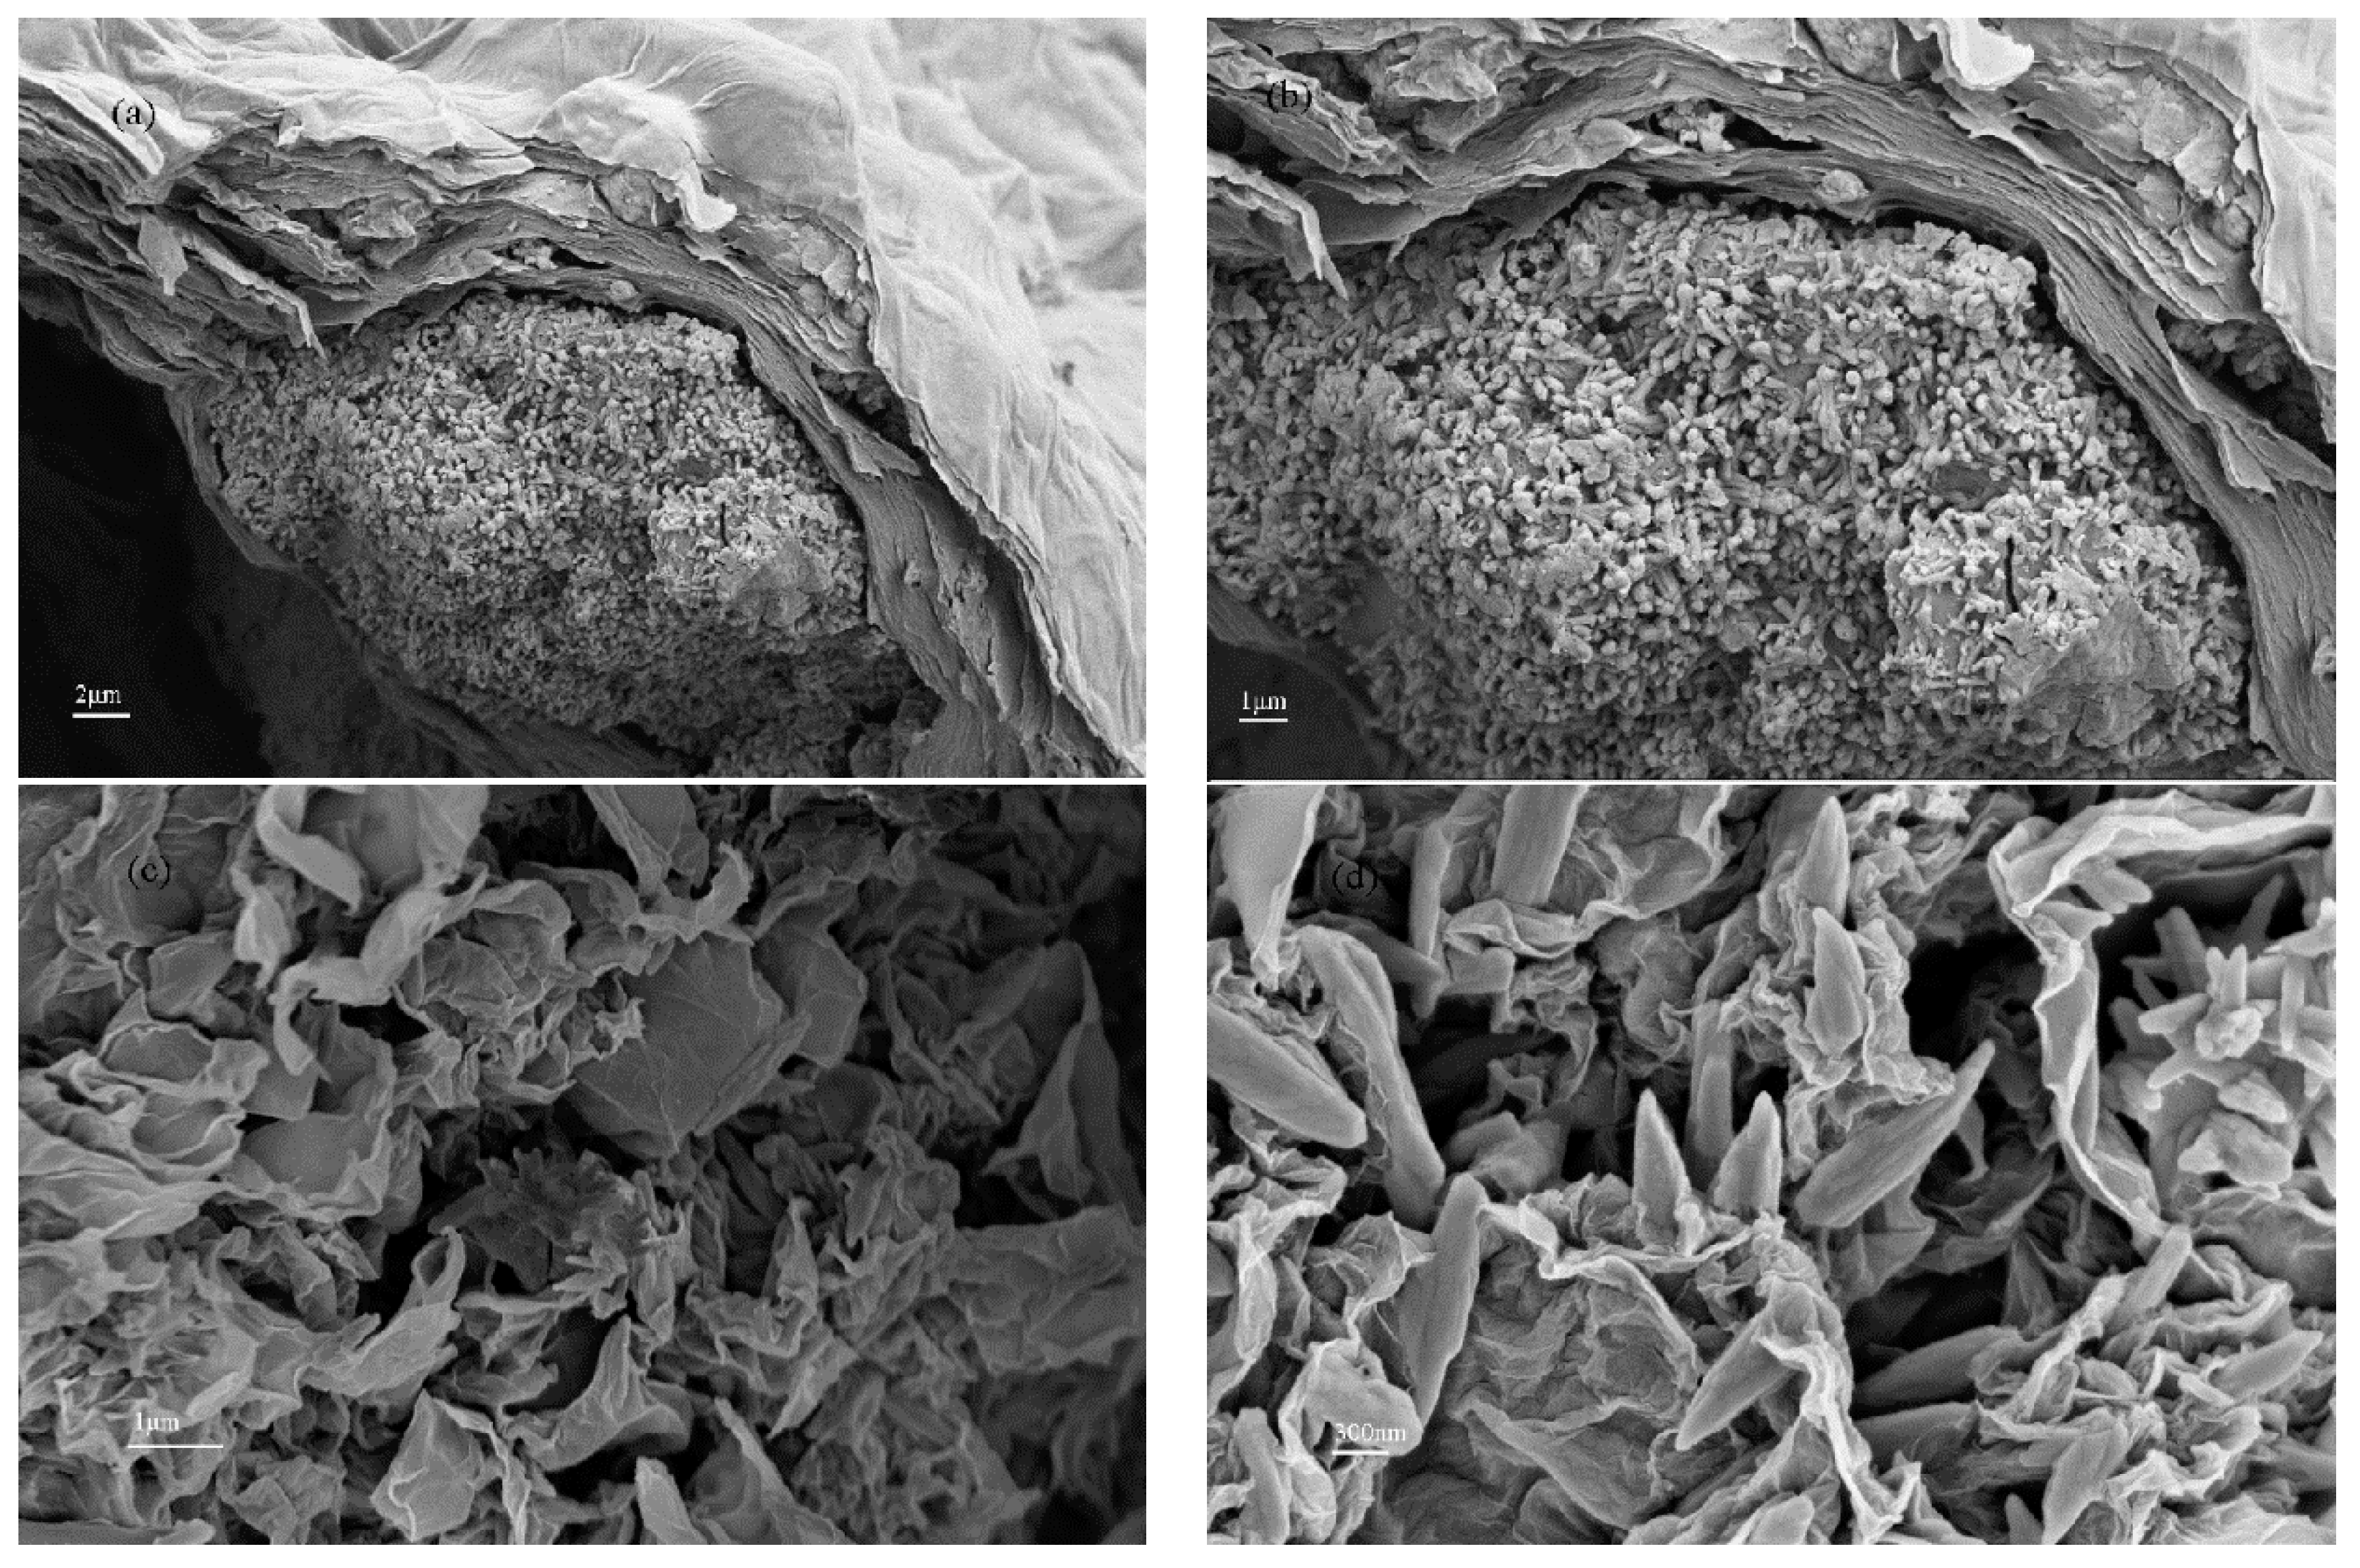
Figure 7.
TEM images of the CPGC for 10 h with different scale bar (a) 1 μm; (b) 100 nm; (c) 50 nm; (d) 300 nm.
Figure 7.
TEM images of the CPGC for 10 h with different scale bar (a) 1 μm; (b) 100 nm; (c) 50 nm; (d) 300 nm.

Figure 8.
XRD patterns for CPGC and hydration products of cement (HPC).
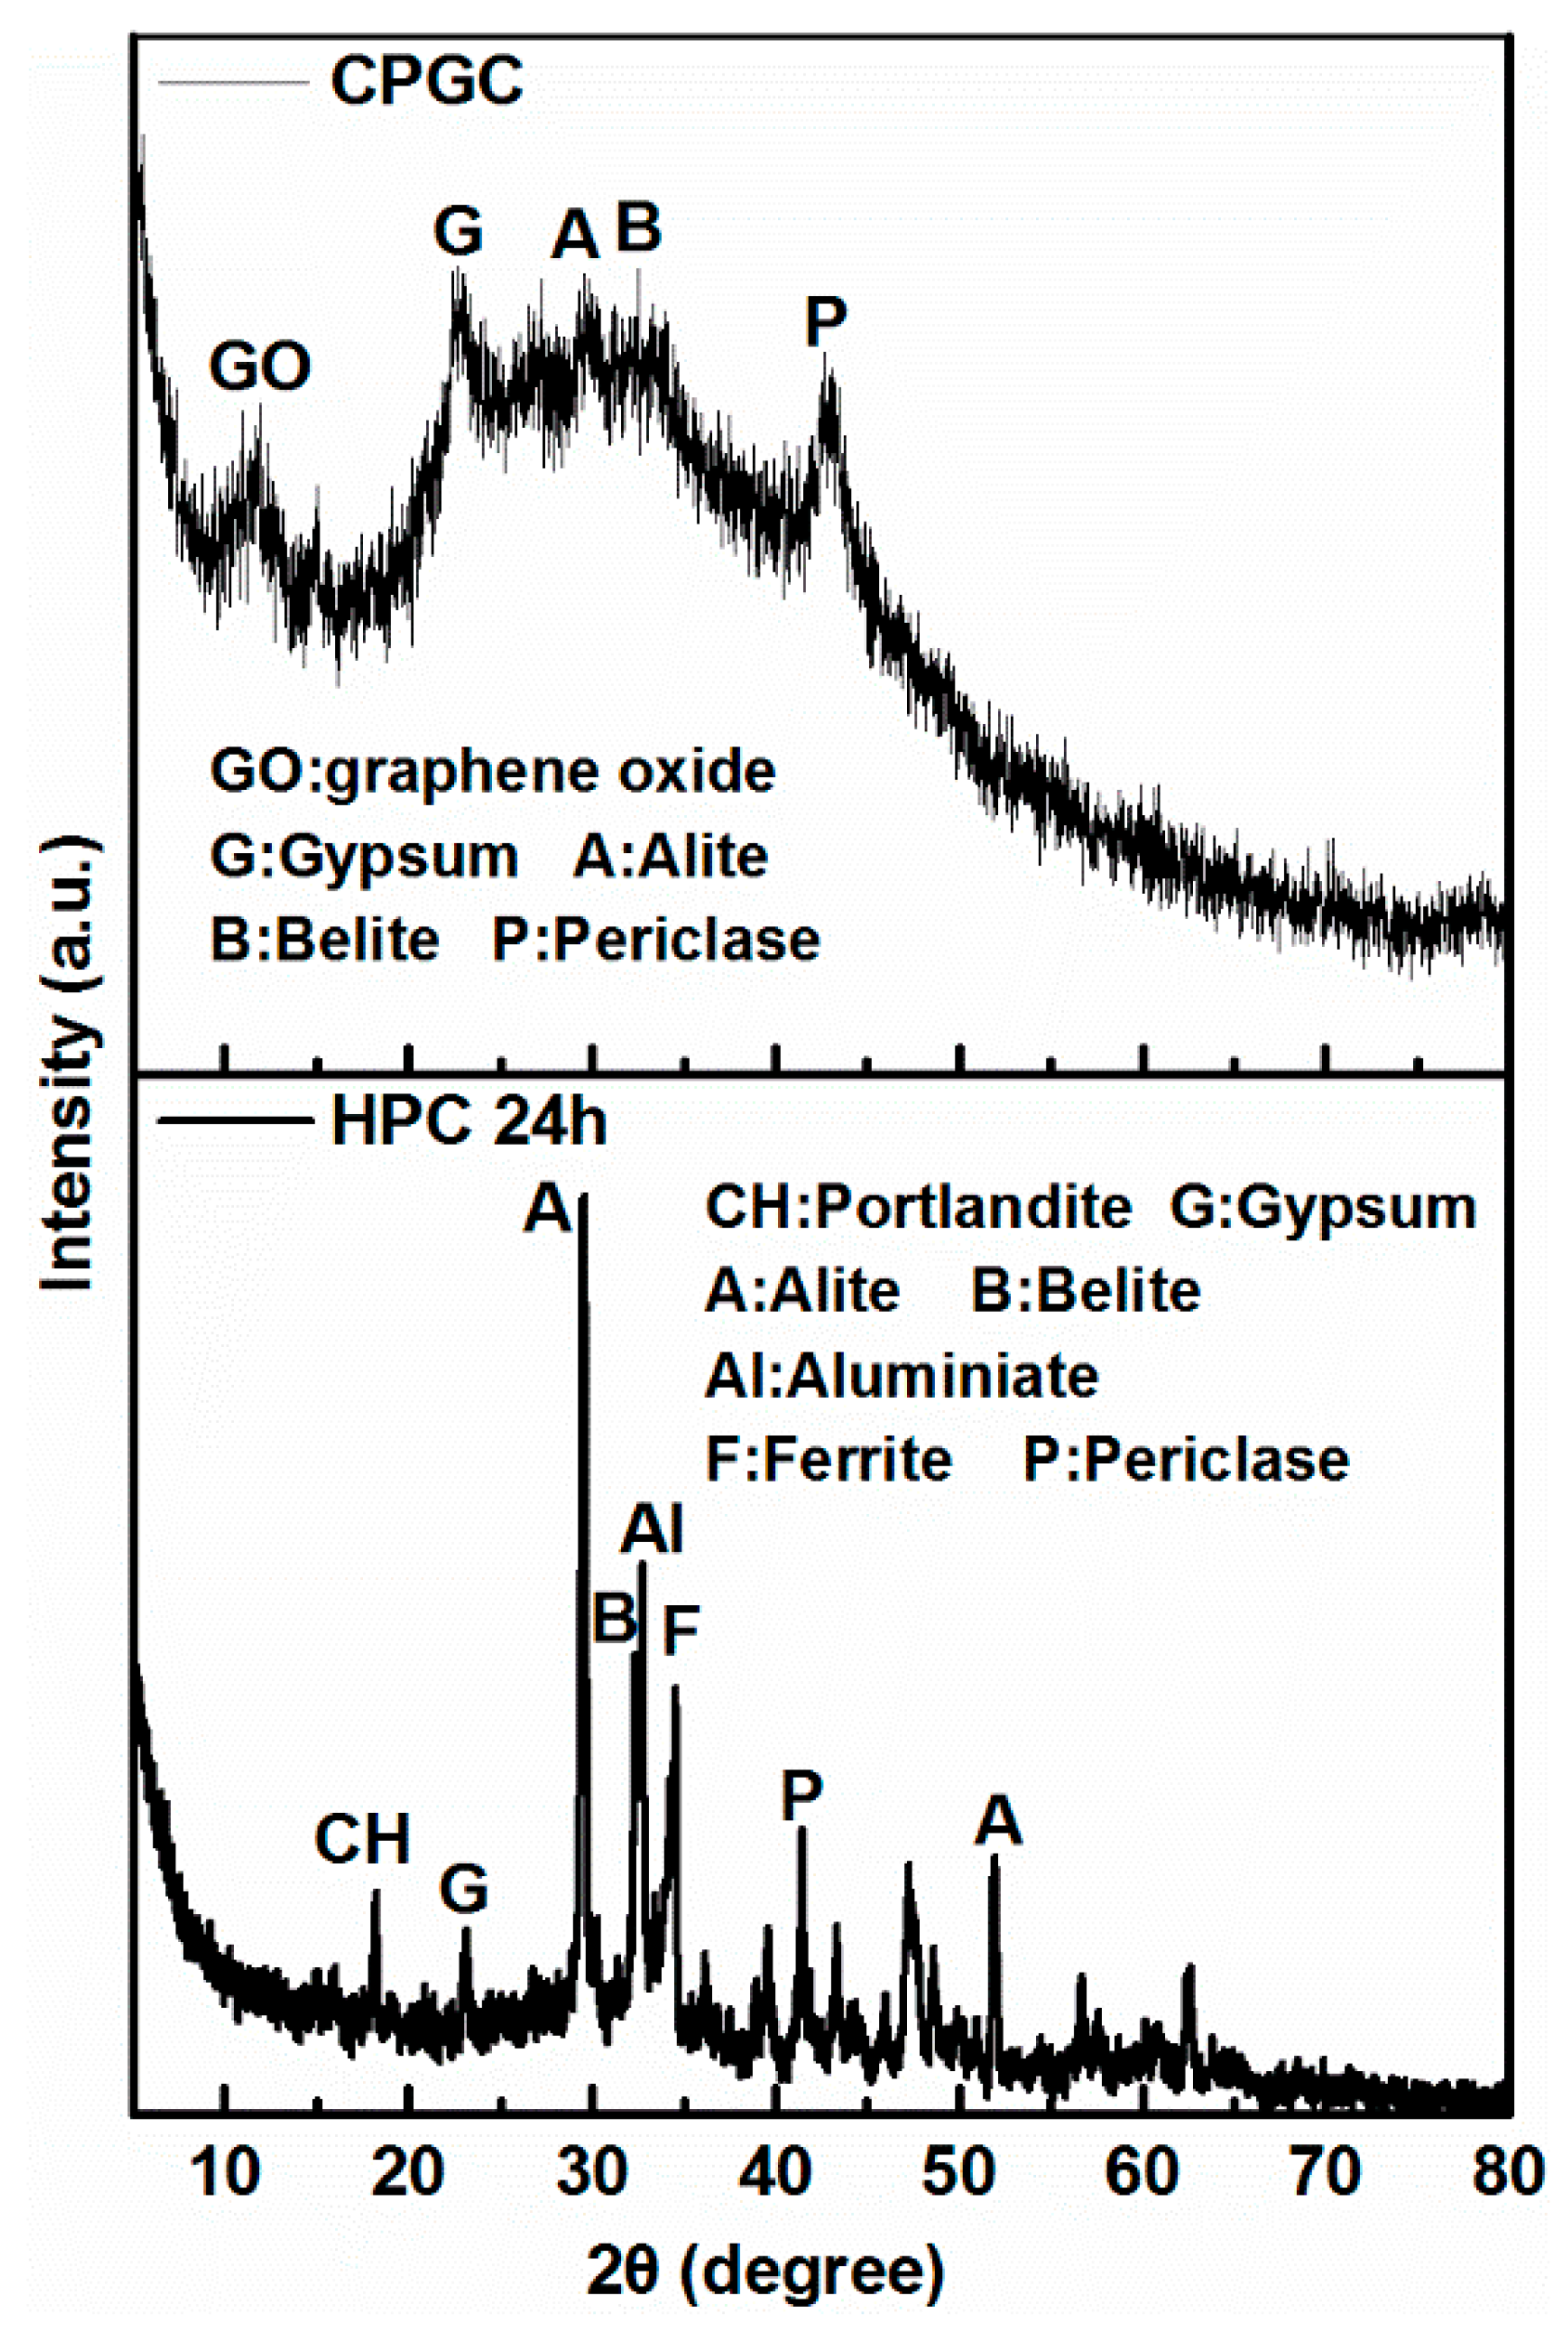
Figure 9.
(a) X-ray photoelectron spectroscopy (XPS) survey spectra, and (b) deconvoluted C1s spectra of CGPC.
Figure 9.
(a) X-ray photoelectron spectroscopy (XPS) survey spectra, and (b) deconvoluted C1s spectra of CGPC.

Figure 10.
Raman spectrum of the CPGC and GO.
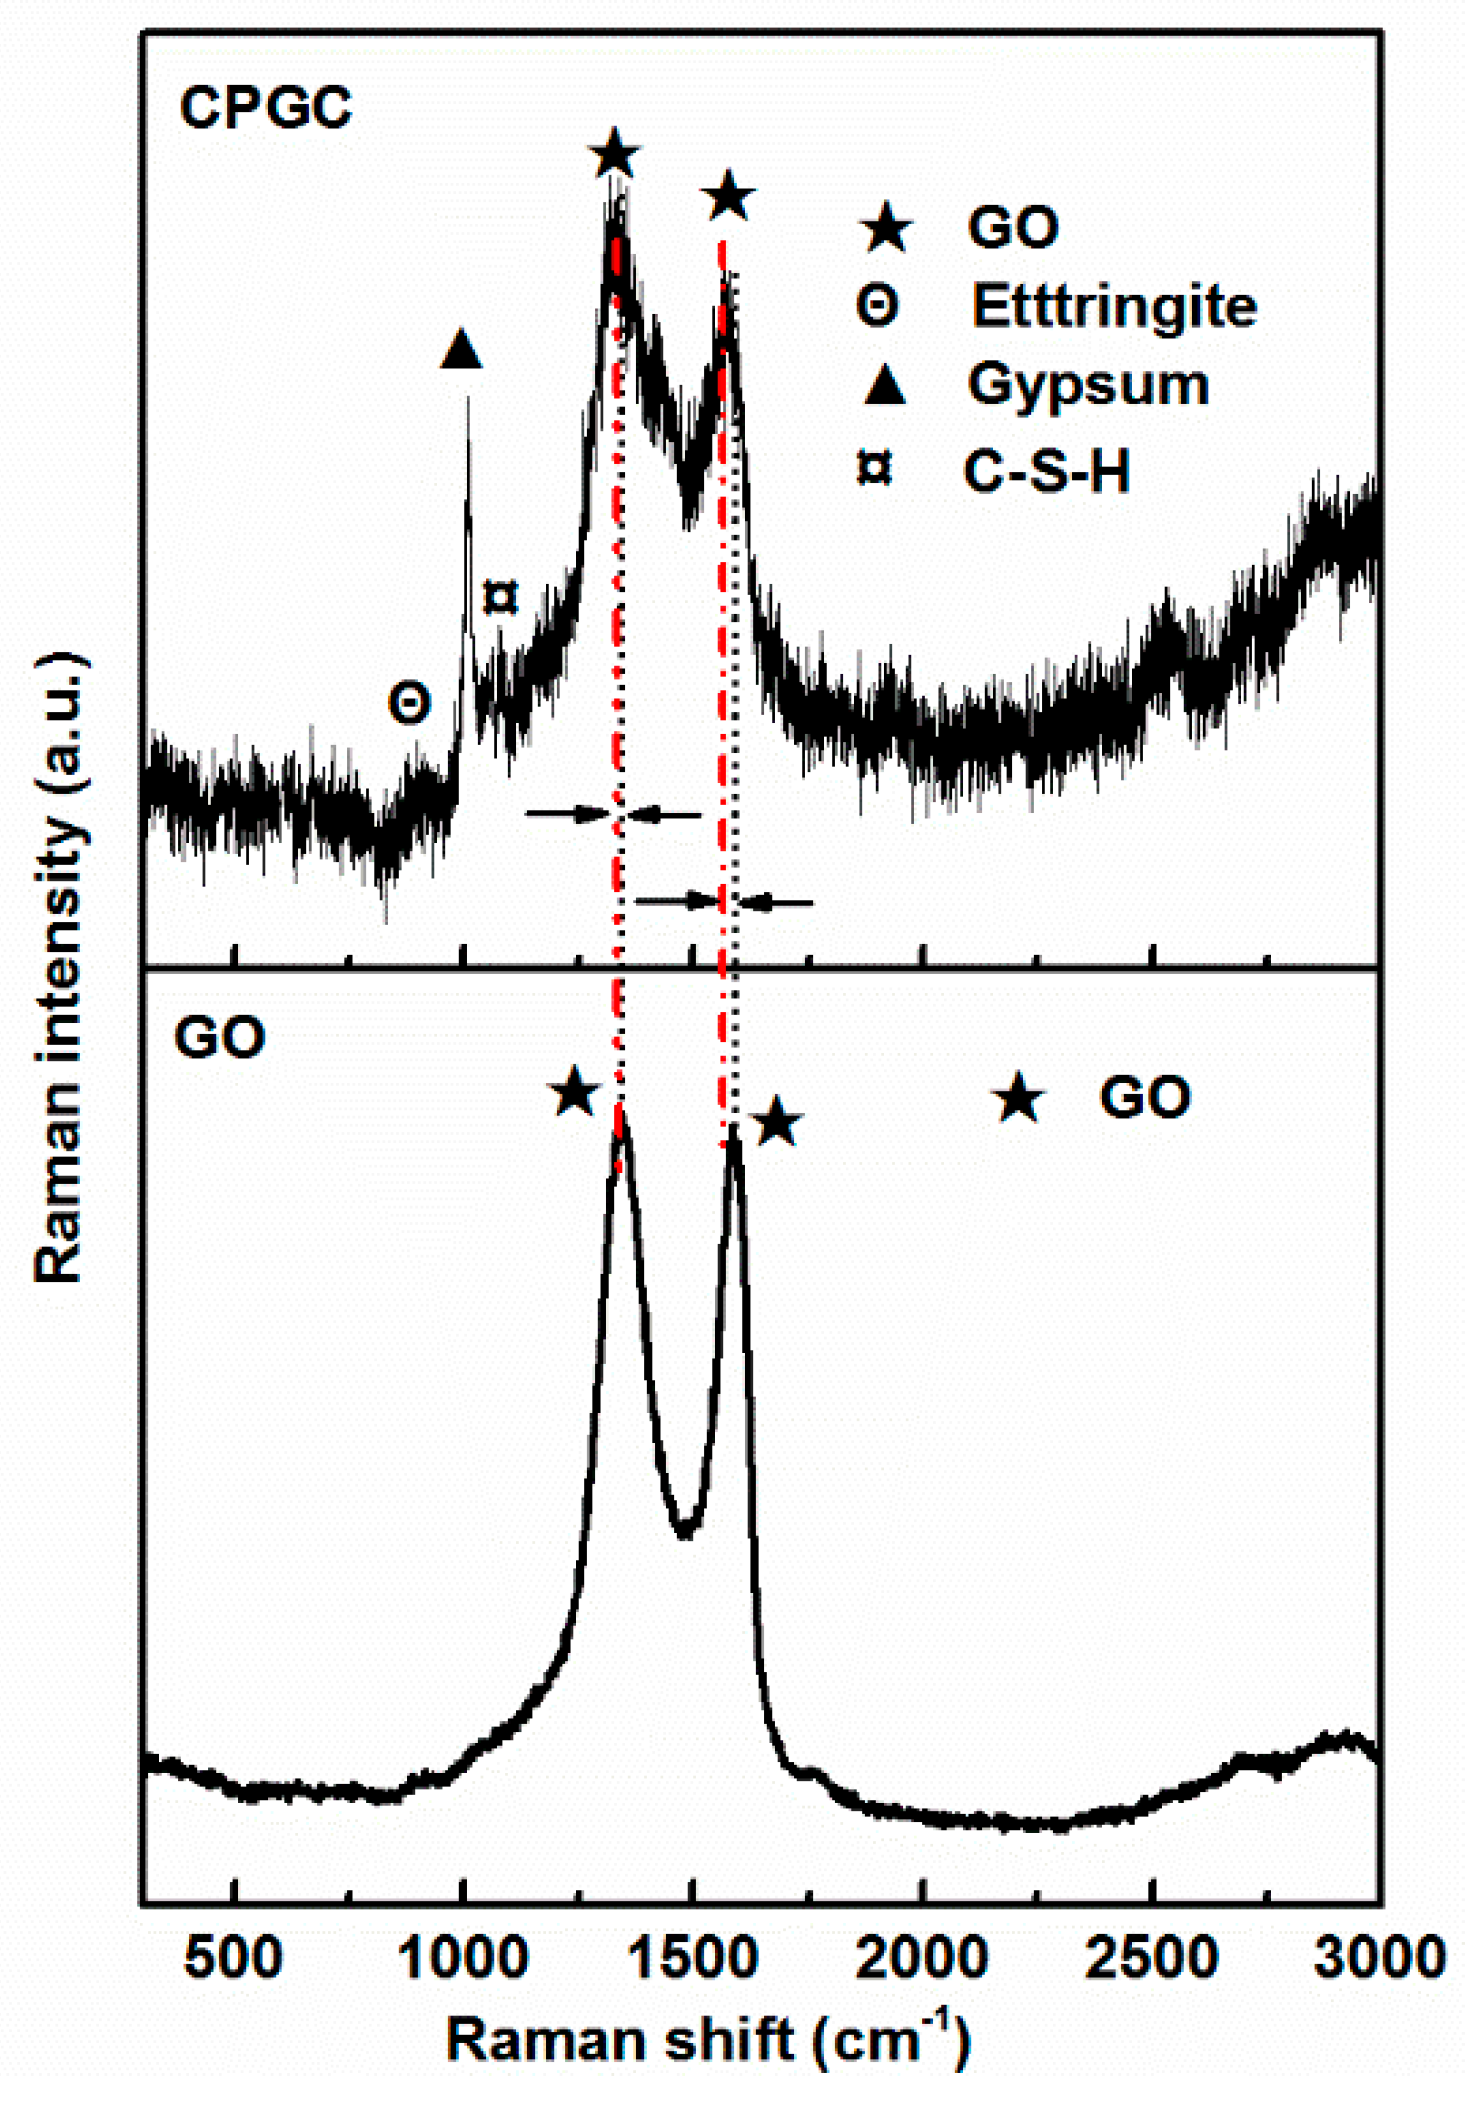
Figure 11.
The adsorption capacity of 0.05 g HPC aged for different times (2 h, 6 h, and 24 h).

Figure 12.
The variation of the batch solution pH by contact time during the cement-induced GO coagulation with a volume of 1000 mL.
Figure 12.
The variation of the batch solution pH by contact time during the cement-induced GO coagulation with a volume of 1000 mL.

Table 1.
Comparisons of the coagulation capacity of graphene oxide (GO) with different coagulants.
| Coagulants | Removal Capacity (mg/g) | References |
|---|---|---|
| Al2O3 | 0.59 | [30] |
| LDH-Cl | 57 | [25] |
| Mg/Al LDH | 79.9 | [21] |
| Ca/Al LDH | 123 | [21] |
| LDO-G1 | 448.3 | [16] |
| Ca/Al/La-MMO | 558.8 | [26] |
| Mg/Al/La-MMO | 565.8 | [26] |
| MgAl-MMO | 984.2 | [20] |
| Cement | 5981.2 | This study |
Table 2.
Kinetic parameters for GO coagulation onto cement.
| Dosage (mg/mL) | qe,exp (mg/g) | Pseudo First-Order | Pseudo Second-Order | ||||
|---|---|---|---|---|---|---|---|
| k1 (min−1) | qe,cal (mg/g) | R2 | k2 (g/mg·g) | qe,cal (mg/g) | R2 | ||
| 0.2 | 3884.4 | 0.10656 | 2965.2 | 0.96367 | 0.0000904 | 4035.903397 | 0.9943 |
| 0.4 | 5981.2 | 0.00589 | 3564.8 | 0.71025 | 0.0000701 | 5631.011104 | 0.9785 |
© 2018 by the authors. Licensee MDPI, Basel, Switzerland. This article is an open access article distributed under the terms and conditions of the Creative Commons Attribution (CC BY) license (http://creativecommons.org/licenses/by/4.0/).
Share and Cite
MDPI and ACS Style
Yuan, X.; Niu, J.; Zeng, J.; Jing, Q. Cement-Induced Coagulation of Aqueous Graphene Oxide with Ultrahigh Capacity and High Rate Behavior. Nanomaterials 2018, 8, 574. https://doi.org/10.3390/nano8080574
AMA Style
Yuan X, Niu J, Zeng J, Jing Q. Cement-Induced Coagulation of Aqueous Graphene Oxide with Ultrahigh Capacity and High Rate Behavior. Nanomaterials. 2018; 8(8):574. https://doi.org/10.3390/nano8080574
Chicago/Turabian StyleYuan, Xiaoya, Jiawei Niu, Junjie Zeng, and Qiuye Jing. 2018. "Cement-Induced Coagulation of Aqueous Graphene Oxide with Ultrahigh Capacity and High Rate Behavior" Nanomaterials 8, no. 8: 574. https://doi.org/10.3390/nano8080574
Note that from the first issue of 2016, this journal uses article numbers instead of page numbers. See further details here.