Plasmonic Sensor Based on Interaction between Silver Nanoparticles and Ni2+ or Co2+ in Water

 , , , , , , , , and
Abstract
:1. Introduction
2. Materials and Methods
2.1. Materials
2.2. Synthesis and Characterization of AgNPs
2.3. Sensing
3. Results and Discussion
4. Conclusions
Supplementary Materials
Author Contributions
Funding
Acknowledgments
Conflicts of Interest
References
- Rai, M.; Ingle, A.P.; Birla, S.; Yadav, A.; Santos, C.A. Strategic role of selected noble metal nanoparticles in medicine. Rev. Microbiol. 2016, 42, 696–719. [Google Scholar] [CrossRef] [PubMed]
- Akhtar, M.S.; Panwar, J.; Yun, Y.-S. Biogenic Synthesis of Metallic Nanoparticles by Plant Extracts. ACS Sustain. Chem. Eng. 2013, 1, 591–602. [Google Scholar] [CrossRef]
- Edmundson, M.C.; Capeness, M. Exploring the potential of metallic nanoparticles within synthetic biology. New Biotechnol. 2014, 31, 572–578. [Google Scholar] [CrossRef] [PubMed]
- Zheng, X.T.; Ananthanarayanan, A.; Luo, K.Q.; Chen, P. Glowing graphene quantum dots and carbon dots: Properties, syntheses, and biological applications. Small 2015, 11, 1620–1636. [Google Scholar] [CrossRef] [PubMed]
- Venditti, I.; Barbero, N.; Russo, M.V.; Di Carlo, A.; Decker, F.; Fratoddi, I.; Barolo, C.; Dini, D. Electrodeposited ZnO with squaraine sentisizers as photoactive anode of DSCs. Mater. Res. Express 2014, 1, 015040. [Google Scholar] [CrossRef]
- Julien, C.M.; Mauger, A. Nanostructured MnO2 as Electrode Materials for Energy Storage. Nanomaterials 2017, 7, 396. [Google Scholar] [CrossRef] [PubMed]
- Barettin, D.; Di Carlo, A.; De Angelis, R.; Casalboni, M.; Prosposito, P. Effect of dielectric Bragg grating nanostructuring on dye sensitized solar cells. Opt. Express 2012, 20, A888–A897. [Google Scholar] [CrossRef] [PubMed]
- Hua, W.; Liu, H.; Wang, J.-J.; Wei, B. Self-Supported Ni(P, O)xMoOx Nanowire Array on Nickel Foam as an Efficient and Durable Electrocatalyst for Alkaline Hydrogen Evolution. Nanomaterials 2017, 7, 433. [Google Scholar] [CrossRef] [PubMed]
- Yadav, A.; De Angelis, R.; Casalboni, M.; De Matteis, F.; Prosposito, P.; Nanni, F.; Cacciotti, I. Spectral properties of self-assembled polystyrene nanospheres photonic crystals doped with luminescent dyes. Opt. Mater. 2013, 35, 1538–1543. [Google Scholar] [CrossRef]
- Ramírez-Herrera, D.E.; Rodríguez-Velázquez, E.; Alatorre-Meda, M.; Paraguay-Delgado, F.; Tirado-Guízar, A.; Taboada, P.; Pina-Luis, G. NIR-Emitting Alloyed CdTeSe QDs and Organic Dye Assemblies: A Nontoxic, Stable, and Efficient FRET System. Nanomaterials 2018, 8, 231. [Google Scholar] [CrossRef] [PubMed]
- Venditti, I. Gold nanoparticles in photonic crystals applications: A review. Materials 2017, 10, 97. [Google Scholar] [CrossRef] [PubMed]
- Tanabe, K. Optical radiation efficiencies of metal nanoparticles for optoelectronic applications. Mater. Lett. 2007, 61, 4573–4575. [Google Scholar] [CrossRef]
- Prosposito, P.; Casalboni, M.; Orsini, E.; Palazzesi, C.; Stella, F. UV-nanoimprinting lithography of Bragg Gratings on hybrid sol-gel based channel waveguides. Solid State Sci. 2010, 12, 1886–1889. [Google Scholar] [CrossRef]
- Yoon, G.Y.; Lee, S.Y.; Lee, S.B.; Park, G.Y.; Choi, J.H. Synthesis of Iron Oxide/Gold Composite Nanoparticles Using Polyethyleneimine as a Polymeric Active Stabilizer for Development of a Dual Imaging Probe. Nanomaterials 2018, 8, 300. [Google Scholar] [CrossRef] [PubMed]
- Orsini, A.; Medaglia, P.G.; Scarpellini, D.; Pizzoferrato, R.; Falconi, C. Towards high-performance, low-cost quartz sensors with high-density, well-separated, vertically aligned ZnO nanowires by low-temperature, seed-less, single-step, double-sided growth. Nanotechnology 2013, 24, 355503. [Google Scholar] [CrossRef] [PubMed]
- Zaniewski, A.M.; Schriver, M.; Lee, J.G.; Crommie, M.F.; Zettl, A. Electronic and optical properties of metal-nanoparticle filled grapheme sandwiches. Appl. Phys. Lett. 2013, 102, 023108. [Google Scholar] [CrossRef]
- Barettin, D.; De Angelis, R.; Prosposito, P.; Auf der Maur, M.; Casalboni, M.; Pecchia, A. Model of a realistic InP surface quantum dot extrapolated from atomic force microscopy results. Nanotechnology 2014, 25, 195201. [Google Scholar] [CrossRef] [PubMed]
- Pedrero, M.; Campuzano, S.; Pingarrón, J.M. Quantum Dots as Components of Electrochemical Sensing Platforms for the Detection of Environmental and Food Pollutants: A Review. J. AOAC Int. 2017, 100, 950–961. [Google Scholar] [CrossRef] [PubMed]
- Bhattacharjee, Y.; Chatterjee, D.; Chakraborty, A. Label-Free Cysteamine-Capped Silver Nanoparticle-Based Colorimetric Assay for Hg(II) Detection in Water with Sub nanomolar Exactitude. Sens. Actuators B Chem. 2018, 255, 210–216. [Google Scholar] [CrossRef]
- Zheng, P.; Wu, N. Fluorescence and Sensing Applications of Graphene Oxide and Graphene Quantum Dots: A Review. Chem. Asian J. 2017, 12, 2343–2353. [Google Scholar] [CrossRef] [PubMed]
- Priyadarshini, E.; Pradhan, N. Gold nanoparticles as efficient sensors in colorimetric detection of toxic metal ions: A review. Sens. Actuators B Chem. 2017, 238, 888–902. [Google Scholar] [CrossRef]
- Ciotta, E.; Paoloni, S.; Richetta, M.; Prosposito, P.; Tagliatesta, P.; Lorecchio, C.; Venditti, I.; Fratoddi, I.; Casciardi, S.; Pizzoferrato, R. Sensitivity to heavy-metal ions of unfolded fullerene quantum dots. Sensors 2017, 17, 2614. [Google Scholar] [CrossRef] [PubMed]
- Mahmoud, M.A.; O’Neil, D.; El-Sayed, M.A. Hollow and Solid Metallic Nanoparticles in Sensing and in Nanocatalysis. Chem. Mater. 2014, 26, 44–58. [Google Scholar] [CrossRef]
- De Angelis, R.; D’Amico, L.; Casalboni, M.; Hatami, F.; Masselink, W.T.; Prosposito, P. Photoluminescence sensitivity to methanol vapours of surface InP quantum dots: Effect of dot size and coverage. Sens. Actuators B Chem. 2013, 189, 113–117. [Google Scholar] [CrossRef]
- Mou, X.; Wang, J.; Meng, X.; Liu, J.; Shi, L.; Sun, L. Multifunctional nanoprobe based on upconversion nanoparticles for luminescent sensing and magnetic resonance imaging. J. Lumin. 2017, 190, 16–22. [Google Scholar] [CrossRef]
- Piloto, C.; Mirri, F.; Bengio, E.; Notarianni, M.; Gupta, B.; Shafiei, M.; Pasquali, M.; Motta, N. Room temperature gas sensing properties of ultrathin carbon nanotube films by surfactant-free dip coating. Sens. Actuators B Chem. 2016, 227, 128–134. [Google Scholar] [CrossRef]
- Moores, A.; Goettmann, F. The plasmon band in noble metal nanoparticles: An introduction to theory and applications. New J. Chem. 2006, 30, 1121–1132. [Google Scholar] [CrossRef]
- Yang, Q.; Xu, Q.; Jiang, H.-L. Metal–organic frameworks meet metal nanoparticles: Synergistic effect for enhanced catalysis. Chem. Soc. Rev. 2017, 46, 4774–4808. [Google Scholar] [CrossRef] [PubMed]
- Jiang, Z.-J.; Liu, C.-Y.; Sun, L.-W. Catalytic Properties of Silver Nanoparticles Supported on Silica Spheres. J. Phys. Chem. B 2005, 109, 1730–1735. [Google Scholar] [CrossRef] [PubMed]
- Bessar, H.; Venditti, I.; Fratoddi, I.; Benassi, L.; Vaschieri, C.; Azzoni, P.; Pellacani, G.; Magnoni, C.; Botti, E.; Casagrande, V.; et al. Functionalized gold nanoparticles for topical delivery of Methotrexate for the possible treatment of psoriasis. Colloids Surf. B Biointerfaces 2016, 141, 141–147. [Google Scholar] [CrossRef] [PubMed]
- Guo, H.; Xing, B.; Hamlet, L.C.; Chica, A.; He, L. Surface-enhanced Raman scattering detection of silver nanoparticles in environmental and biological samples. Sci. Total Environ. 2016, 554–555, 246–252. [Google Scholar] [CrossRef] [PubMed]
- Cha, S.K.; Mun, J.H.; Chang, T.; Kim, S.Y.; Kim, J.Y.; Jin, H.M.; Kim, S.O. Au–Ag Core–Shell Nanoparticle Array by Block Copolymer Lithography for Synergistic Broadband Plasmonic Properties. ACS Nano 2015, 9, 5536–5543. [Google Scholar] [CrossRef] [PubMed]
- Liu, X.; Wang, X.; Zha, L.; Lin, D.; Yang, J.; Zhou, J.; Zhang, L. Temperature- and pH-tunable plasmonic properties and SERS efficiency of the silver nanoparticles within the dual stimuli-responsive microgels. J. Mater. Chem. C 2014, 2, 7326–7335. [Google Scholar] [CrossRef]
- Yin, K.; Liao, F.; Zhu, Y.; Gao, A.; Wang, T.; Shao, M. Enhanced gas-sensing response by gamma ray irradiation: Ag/Ag2SnO3 nanoparticle-based sensor to ethanol, nitromethane and acetic acid. J. Mater. Chem. C 2014, 2, 10082–11008. [Google Scholar] [CrossRef]
- Ratnarathorn, N.; Chailapakul, O.; Henry, C.S.; Dungchai, W. Simple silver nanoparticle colorimetric sensing for copper by paper-based devices. Talanta 2012, 99, 552–557. [Google Scholar] [CrossRef] [PubMed]
- Wang, C.C.; Luconi, M.O.; Masi, A.N.; Fernández, L.P. Derivatized silver nanoparticles as sensor for ultra-tracenitrate determination based on light scattering phenomenon. Talanta 2009, 77, 1238–1243. [Google Scholar] [CrossRef] [PubMed]
- Oliveira, E.; Nunez, C.; Santos, H.M.; Fernandez-Lodeiro, J.; Fernandez-Lodeiro, A.; Capelo, J.L.; Lodeiro, C. Revisiting the use of gold and silver functionalised nanoparticles as colorimetric and fluorometric chemosensors for metal ions. Sens. Actuators B Chem. 2015, 212, 297–328. [Google Scholar] [CrossRef]
- Duruibe, J.O.; Ogwuegbu, M.O.C.; Egwurugwu, J.N. Heavy metal pollution and human biotoxic effects. Int. J. Phys. Sci. 2007, 2, 112–118. [Google Scholar]
- Jaishankar, M.; Tseten, T.; Anbalagan, N.; Mathew, B.B.; Beeregowda, K.N. Toxicity, mechanism and health effects of some heavy metals. Interdiscip. Toxicol. 2014, 7, 60–72. [Google Scholar] [CrossRef] [PubMed] [Green Version]
- Leung, H.M.; Duzgoren-Aydin, N.S.; Au, C.K.; Krupanidhi, S.; Fung, K.Y.; Cheung, K.C.; Tsui, M.T.K. Monitoring and assessment of heavy metal contamination in a constructed wetland in Shaoguan (Guangdong Province, China): Bioaccumulation of Pb, Zn, Cu and Cd in aquatic and terrestrial components. Environ. Sci. Pollut. Res. 2017, 24, 9079–9088. [Google Scholar] [CrossRef] [PubMed]
- World Health Organization. Guidelines for Drinking-Water Quality: Fourth Edition Incorporating the First Addendum; World Health Organization: Geneva, Switzerland, 2017. [Google Scholar]
- Ackerman, A.H.; Creed, P.A.; Parks, A.N.; Fricke, M.W.; Schwegel, C.A.; Creed, J.T.; Heitkemper, D.T.; Vela, N.P. Comparison of a chemical and enzymatic extraction of arsenic from rice and assessment of the arsenic absorption from contaminated water by cooked rice. Environ. Sci. Technol. 2005, 39, 5241–5246. [Google Scholar] [CrossRef] [PubMed]
- Ju, J.; Chen, W. Graphene Quantum Dots as Fluorescence Probes for Sensing Metal Ions: Synthesis and Applications. Curr. Org. Chem. 2015, 19, 1150–1162. [Google Scholar] [CrossRef]
- Prosposito, P.; Mochi, F.; Ciotta, E.; Casalboni, M.; De Matteis, F.; Venditti, I.; Fontana, L.; Testa, G.; Fratoddi, I. Hydrophilic silver nanoparticles with tunable optical properties: Application for the detection of heavy metals in water. Beilstein J. Nanotechnol. 2016, 7, 1654–1661. [Google Scholar] [CrossRef] [PubMed]
- D’Amato, R.; Venditti, I.; Russo, M.V.; Falconieri, M.J. Growth Control and Long-Range Self-Assemblyof Poly(methyl methacrylate) Nanospheres. J. Appl. Polym. Sci. 2006, 102, 4493–4499. [Google Scholar] [CrossRef]
- De Angelis, R.; Venditti, I.; Fratoddi, I.; De Matteis, F.; Prosposito, P.; Cacciotti, I.; D’Amico, L.; Nanni, F.; Yadav, A.; Casalboni, M.; et al. From nanospheres to microribbons: Self-assembled Eosin Y doped PMMA nanoparticles as photonic crystals. J. Colloid Interface Sci. 2014, 414, 24–32. [Google Scholar] [CrossRef] [PubMed]
- Zangrando, M.; Zacchigna, M.; Finazzi, M.; Cocco, D.; Rochow, R.; Parmigiani, F. Polar-ized high-brilliance and high-resolution soft x-ray source at ELETTRA: The performance of beamline BACH. Rev. Sci. Instrum. 2004, 75, 31–36. [Google Scholar] [CrossRef]
- National Institute of Standards and Technology (Gaithersburg). NIST X-ray Photoelectron Spectroscopy Database, Version 3.5. 2003. Available online: http://srdata.nist.gov/xps/ (accessed on 30 June 2018).
- Matienzo, J.; Yin, L.I.; Grim, S.O.; Swartz, W.E., Jr. X-ray Photoelectron Spectroscopy of Nickel Compounds. Inorg. Chem. 1973, 12, 2762–2769. [Google Scholar] [CrossRef]
- Okamoto, Y.; Nakano, H.; Imanaka, T.; Teranishi, S. Ray photoelectron spectroscopic studies of catalysts-supported cobalt catalysts. Bull. Chem. Soc. Jpn. 1975, 48, 1163–1168. [Google Scholar] [CrossRef]
- Li, H.; Cui, Z.; Han, C. Glutathione-stabilized silver nanoparticles as colorimetric sensor for Ni2+ ion. Sens. Actuators B Chem. 2009, 143, 87–92. [Google Scholar] [CrossRef]
- Zhang, Z.; Ji, Y.; Li, J.; Zhong, Z.; Su, F. Synergistic effect in bimetallic copper–silver (CuxAg) nanoparticles enhances silicon conversion in Rochow reaction. RSC Adv. 2015, 5, 54364–54371. [Google Scholar] [CrossRef]
- Navaladian, S.; Viswanathan, B.; Varadarajan, T.K.; Viswanath, R.P. Fabrication of Worm-Like Nanorods and Ultrafine Nanospheres of Silver via Solid-State Photochemical Decomposition. Nanoscale Res. Lett. 2009, 4, 471–479. [Google Scholar] [CrossRef] [PubMed]
- Bootharaju, M.S.; Pradeep, T. Uptake of Toxic Metal Ions from Water by Naked and Monolayer Protected Silver Nanoparticles: An X-ray Photoelectron Spectroscopic Investigation. J. Phys. Chem. C 2010, 114, 8328–8336. [Google Scholar] [CrossRef] [Green Version]
- Mackova, A.; Švorčik, V.; Sajdl, P.; Strýhal, Z.; Pavlík, J.; Malinský, P.; Šlouf, M. RBS, XPS and TEM study of metal and polymer interface modified by plasma treatment. Vacuum 2008, 82, 307–310. [Google Scholar] [CrossRef]
- Porcaro, F.; Battocchio, C.; Antoccia, A.; Fratoddi, I.; Venditti, I.; Fracassi, A.; Luisetto, I.; Russo, M.V.; Polzonetti, G. Synthesis of functionalized gold nanoparticles capped with 3-mercapto-1-propansulfonate and 1-thioglucose mixed thiols and "in vitro" bioresponse. Colloids Surf. B Biointerfaces 2016, 142, 408–416. [Google Scholar] [CrossRef] [PubMed]
- Yu, X.R.; Liu, F.; Wang, Z.Y.; Chen, Y. Auger parameters for sulfur-containing compounds using a mixed aluminum-silver excitation source. J. Electron Spectrosc. Relat. Phenom. 1990, 50, 159–166. [Google Scholar] [CrossRef]
- Kaushik, V.K. XPS core level spectra and Auger parameters for some silver compounds. J. Electron Spectrosc. Relat. Phenom. 1991, 56, 273–277. [Google Scholar] [CrossRef]
- Venditti, I.; Testa, G.; Sciubba, F.; Carlini, L.; Porcaro, F.; Meneghini, C.; Mobilio, S.; Battocchio, C.; Fratoddi, I. Hydrophilic Metal Nanoparticles Functionalized by 2-Diethylaminoethanethiol: A Close Look at the Metal-Ligand Interaction and Interface Chemical Structure. J. Phys. Chem. C 2017, 121, 8002–8013. [Google Scholar] [CrossRef]
- Carlini, L.; Fasolato, C.; Postorino, P.; Fratoddi, I.; Venditti, I.; Testa, G.; Battocchio, C. Comparison between silver and gold nanoparticles stabilized with negatively charged hydrophilic thiols: SR-XPS and SERS as probes for structural differences and similarities. Colloids Surf. A 2017, 532, 183–188. [Google Scholar] [CrossRef]
- Castle, J.E.; Briggs, D.; Seah, M.P. (Eds.) Surface and Interface Analyis; John Wiley and Sons Ltd.: Chichester, UK, 1983; p. 533. [Google Scholar]
- Shang, Y.; Wu, F.; Qi, L. Highly selective colorimetric assay for nickel ion using N-acetyl-l-cysteine-functionalized silver nanoparticles. J. Nanopart. Res. 2012, 14, 1169. [Google Scholar] [CrossRef]
- Zhang, F.; Zeng, L.; Zhang, Y.; Wang, H.; Wu, A. A colorimetric assay method for Co2+ based on thioglycolic acid functionalized hexadecyl trimethyl ammonium bromide modified Au nanoparticles (NPs). Nanoscale 2011, 3, 2150–2154. [Google Scholar] [CrossRef] [PubMed]
- Mehta, V.N.; Mungara, A.K.; Kailasa, S.K. Dopamine dithiocarbamate functionalized silver nanoparticles as colorimetric sensors for the detection of cobalt ion. Anal. Methods 2013, 5, 1818–1822. [Google Scholar] [CrossRef]
- Feng, J.; Jin, W.; Huang, P.; Wu, F. Highly selective colorimetric detection of Ni2+ using silver nanoparticles cofunctionalized with adenosine monophosphate and sodium dodecyl sulfonate. J. Nanopart. Res. 2017, 19, 306. [Google Scholar] [CrossRef]


| - | <2RH> (nm) | ζ Potential (mV) |
|---|---|---|
| AgNPs-3MPS alone | 8 ± 3 | −44 ± 5 |
| AgNPs-3MPS + Ni2+ (0.5 ppm) | 10 ± 1 | −40 ± 6 |
| AgNPs-3MPS + Ni2+ (1.0 ppm) | 43 ± 4 | −27 ± 10 |
| AgNPs-3MPS + Ni2+ (2.0 ppm) | 1110 ± 100 | −13 ± 5 |
| AgNPs-3MPS + Co2+ (0.5 ppm) | 55 ± 5 | −40 ± 14 |
| AgNPs-3MPS + Co2+ (1.0 ppm) | 76 ± 9 | −22 ± 15 |
| AgNPs-3MPS + Co2+ (2.0 ppm) | 1436 ±108 | - |
| Sample | Signal | BE (eV) | FWHM (eV) | * I Ratio | Assignments |
|---|---|---|---|---|---|
| AgNPs-3MPS | Ag3d5/2 | 368.2 | 1.1 | 85% | Ag(0) |
| Ag3d5/2 | 369.1 | “ | 15% | Ag(δ+) | |
| AgNPs-3MPS + Ni2+ (1.0 ppm) | Ag3d5/2 | 368.1 | 1.2 | 78% | Ag(0) |
| Ag3d5/2 | 369.1 | “ | 22% | Ag(δ+) | |
| AgNPs-3MPS + Co2+ (1.0 ppm) | Ag3d5/2 | 368.2 | 1.3 | 80% | Ag(0) |
| Ag3d5/2 | 369.3 | “ | 20% | Ag(δ+) |
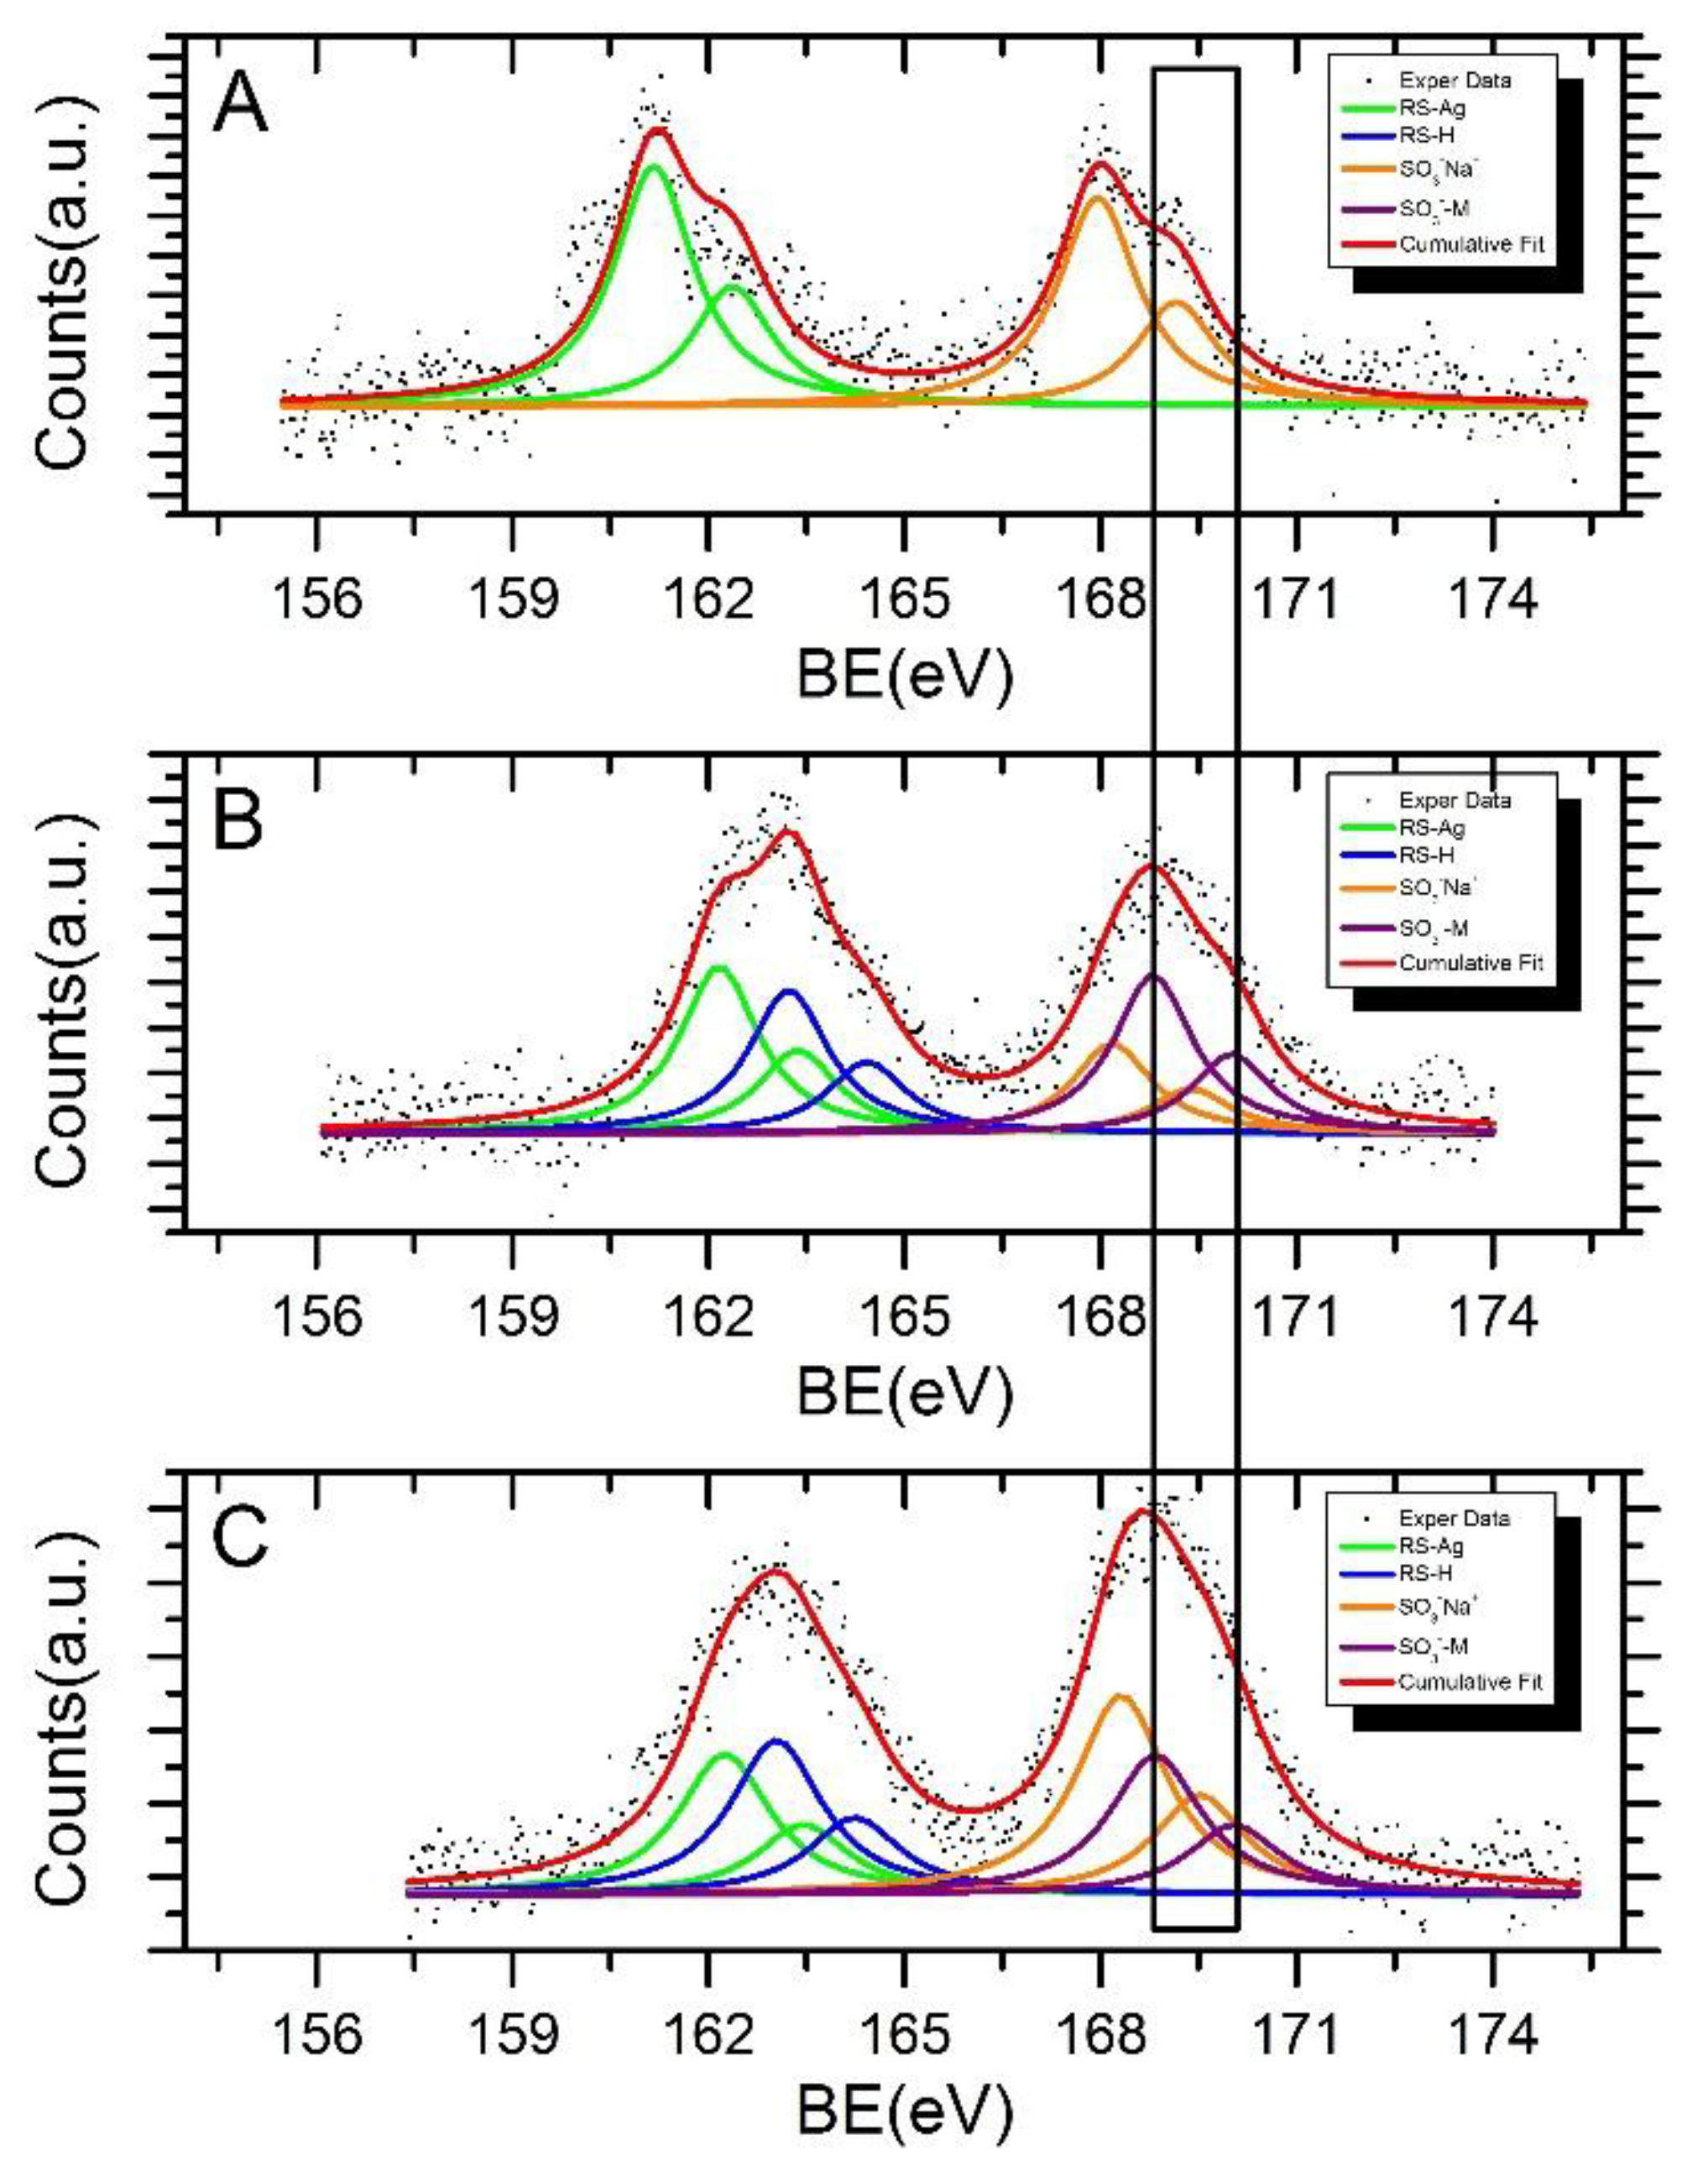
| Sample | Signal | BE (eV) | FWHM (eV) | * I Ratio | ** Assignments |
|---|---|---|---|---|---|
| AgNPs-3MPS | S2p3/2 | 161.2 | 1.5 | 54% | RS-Ag |
| S2p3/2 | 168.0 | “ | 46% | SO3−Na+ | |
| AgNPs-3MPS + Ni2+ (1.0 ppm) | S2p3/2 | 162.2 | 1.5 | 30% | RS-Ag |
| S2p3/2 | 163.2 | “ | 26% | RS-H | |
| S2p3/2 | 168.2 | “ | 16% | SO3−Na+ | |
| S2p3/2 | 168.8 | “ | 28% | SO3−-M | |
| AgNPs-3MPS + Co2+ (1.0 ppm) | S2p3/2 | 162.3 | 1.7 | 22% | RS-Ag |
| S2p3/2 | 163.0 | “ | 24% | RS-H | |
| S2p3/2 | 168.3 | “ | 32% | SO3−Na+ | |
| S2p3/2 | 168.8 | “ | 22% | SO3−-M |
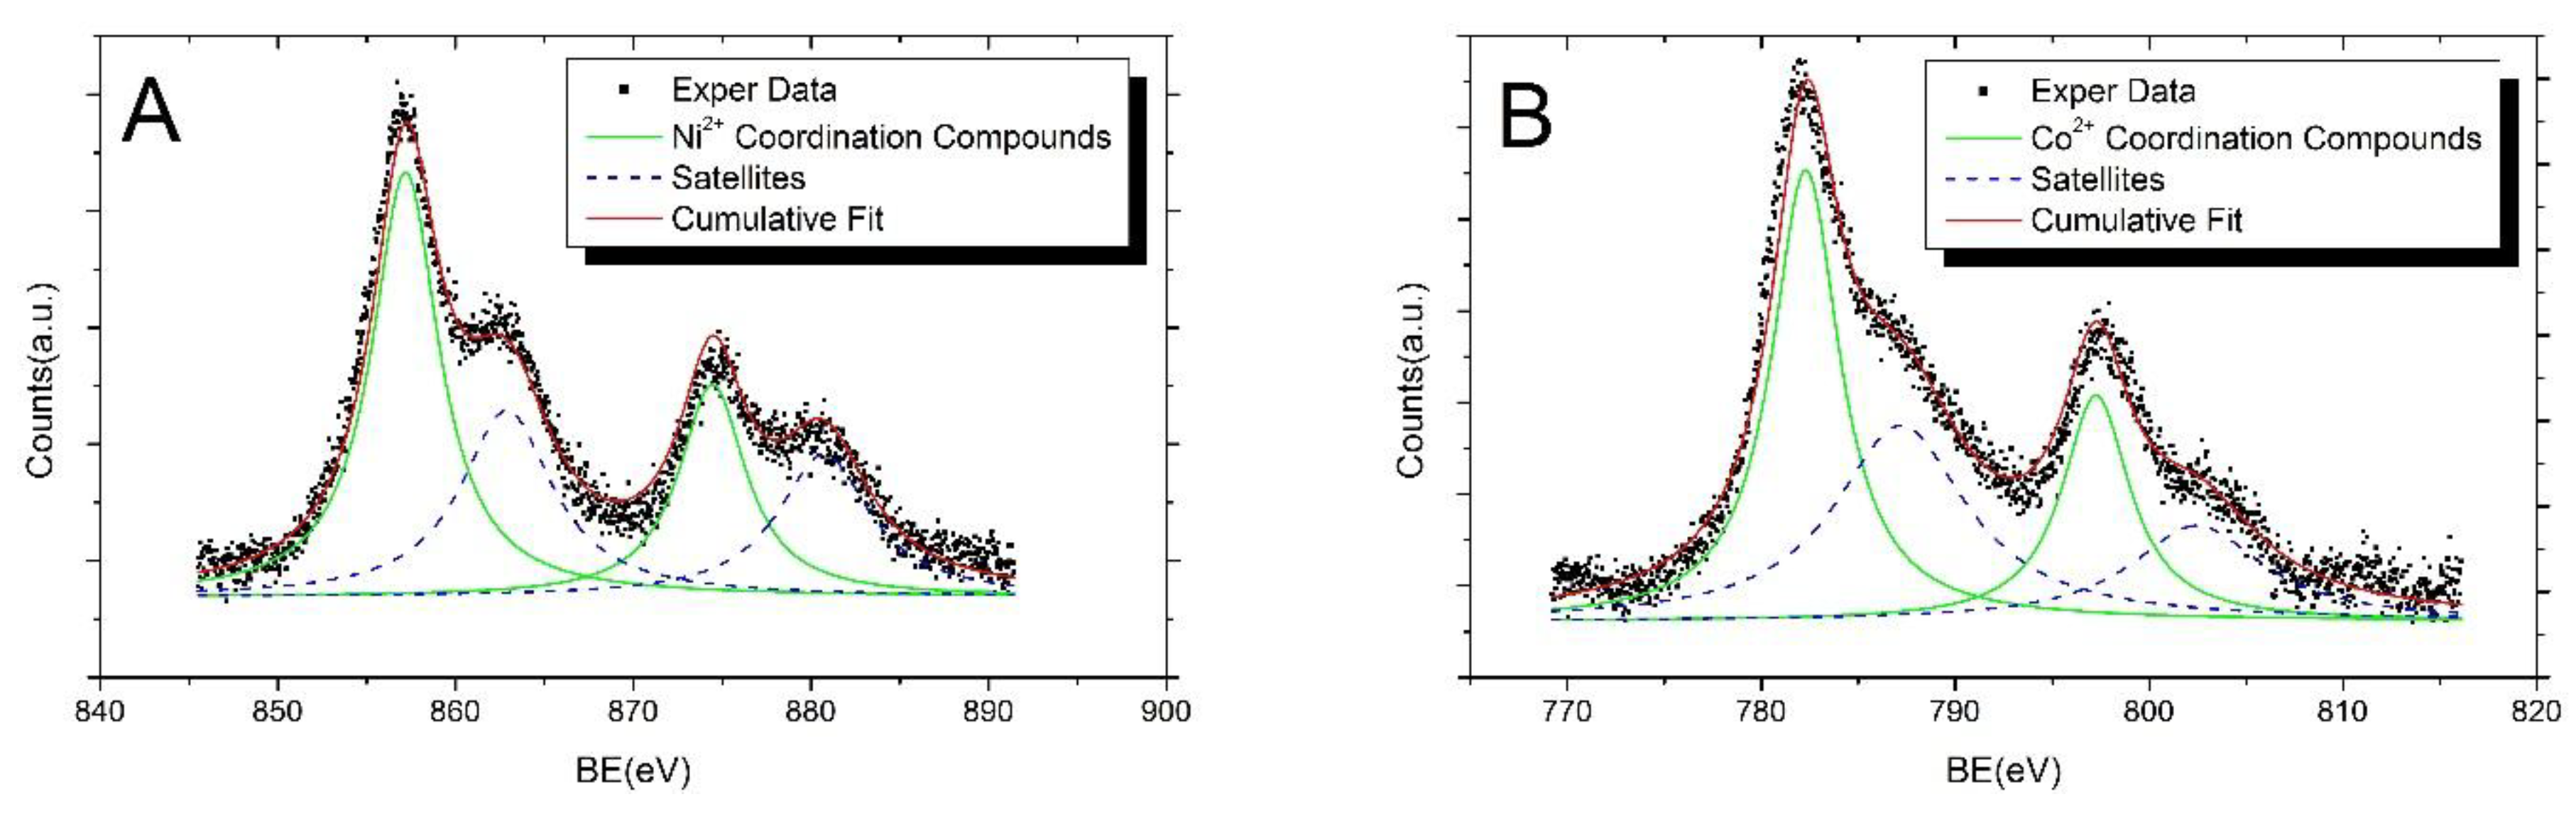
| Sample | BE (eV) | FWHM (eV) | Assignments |
|---|---|---|---|
| AgNPs-3MPS + Ni2+ (1.0 ppm) | 856.2 | 4.3 | Ni2+ Coordination Compounds |
| 861.9 | 6.3 | Satellite Structure | |
| AgNPs-3MPS + Co2+ (1.0 ppm) | 782.3 | 4.6 | Co2+ Coordination Compounds |
| 787.2 | 8.3 | Satellite Structure |
© 2018 by the authors. Licensee MDPI, Basel, Switzerland. This article is an open access article distributed under the terms and conditions of the Creative Commons Attribution (CC BY) license (http://creativecommons.org/licenses/by/4.0/).
Share and Cite
Mochi, F.; Burratti, L.; Fratoddi, I.; Venditti, I.; Battocchio, C.; Carlini, L.; Iucci, G.; Casalboni, M.; De Matteis, F.; Casciardi, S.; et al. Plasmonic Sensor Based on Interaction between Silver Nanoparticles and Ni2+ or Co2+ in Water. Nanomaterials 2018, 8, 488. https://doi.org/10.3390/nano8070488
Mochi F, Burratti L, Fratoddi I, Venditti I, Battocchio C, Carlini L, Iucci G, Casalboni M, De Matteis F, Casciardi S, et al. Plasmonic Sensor Based on Interaction between Silver Nanoparticles and Ni2+ or Co2+ in Water. Nanomaterials. 2018; 8(7):488. https://doi.org/10.3390/nano8070488
Chicago/Turabian StyleMochi, Federico, Luca Burratti, Ilaria Fratoddi, Iole Venditti, Chiara Battocchio, Laura Carlini, Giovanna Iucci, Mauro Casalboni, Fabio De Matteis, Stefano Casciardi, and et al. 2018. "Plasmonic Sensor Based on Interaction between Silver Nanoparticles and Ni2+ or Co2+ in Water" Nanomaterials 8, no. 7: 488. https://doi.org/10.3390/nano8070488