3.1. Characterization
In
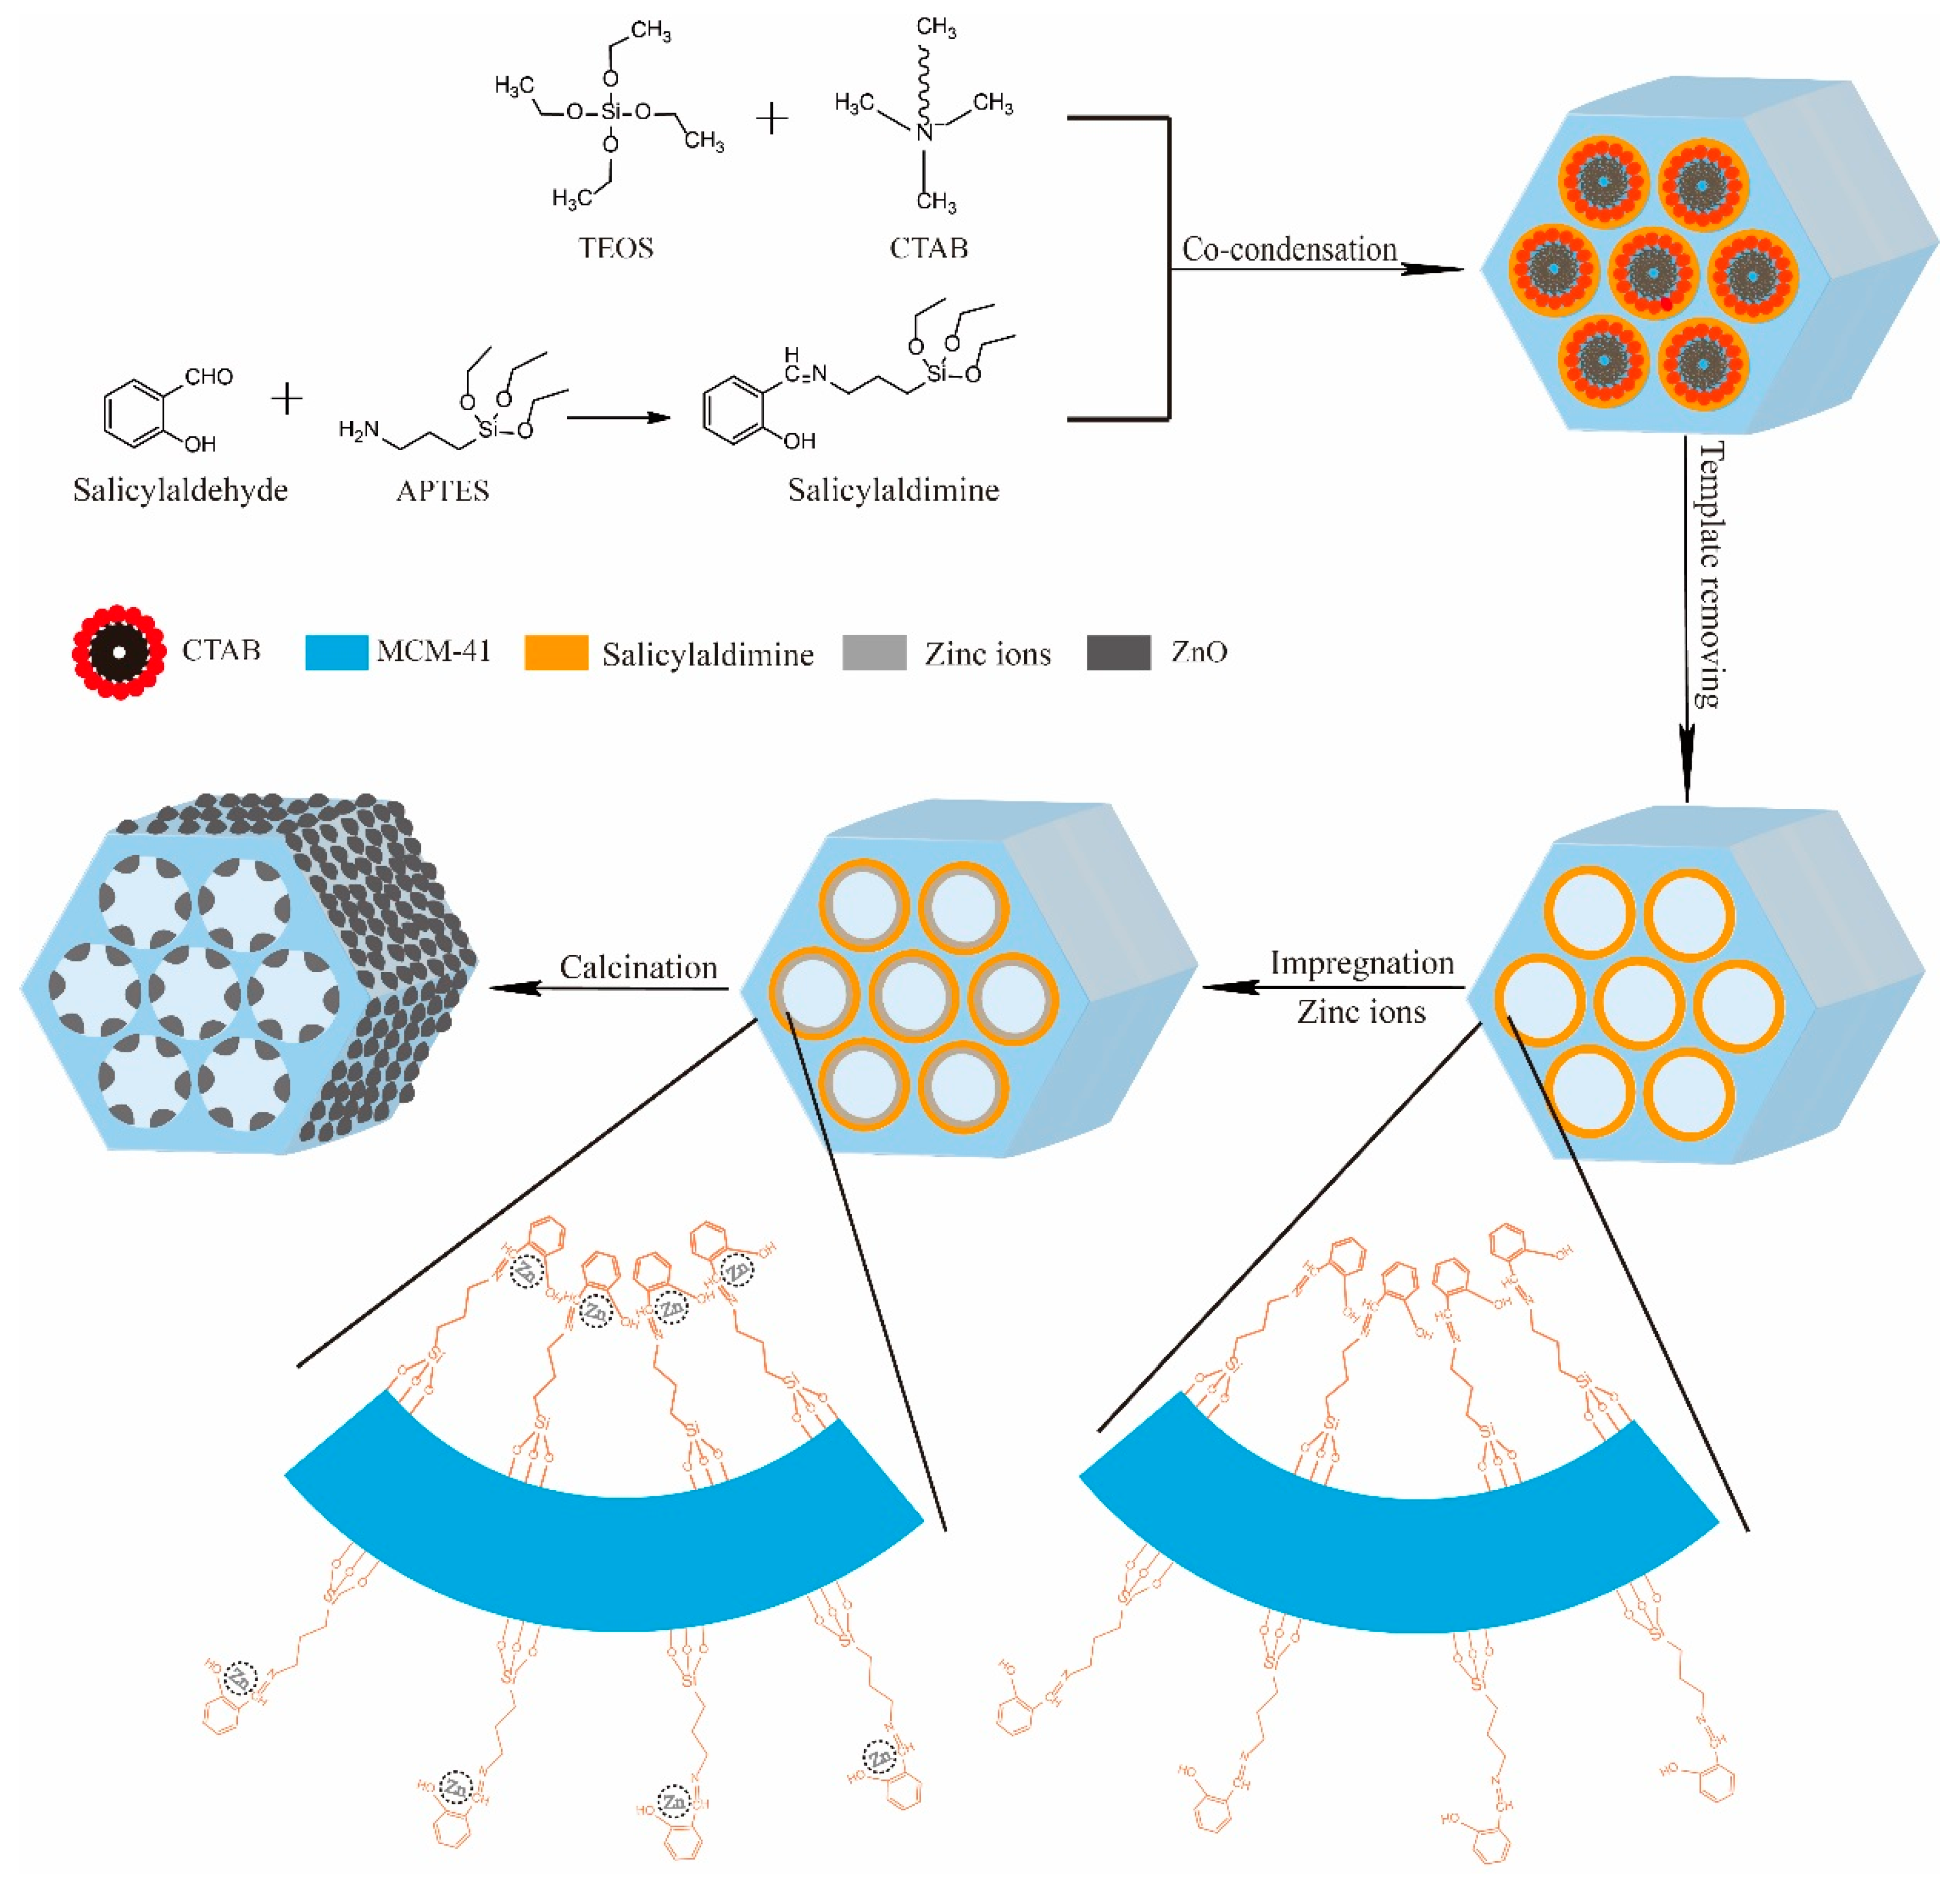
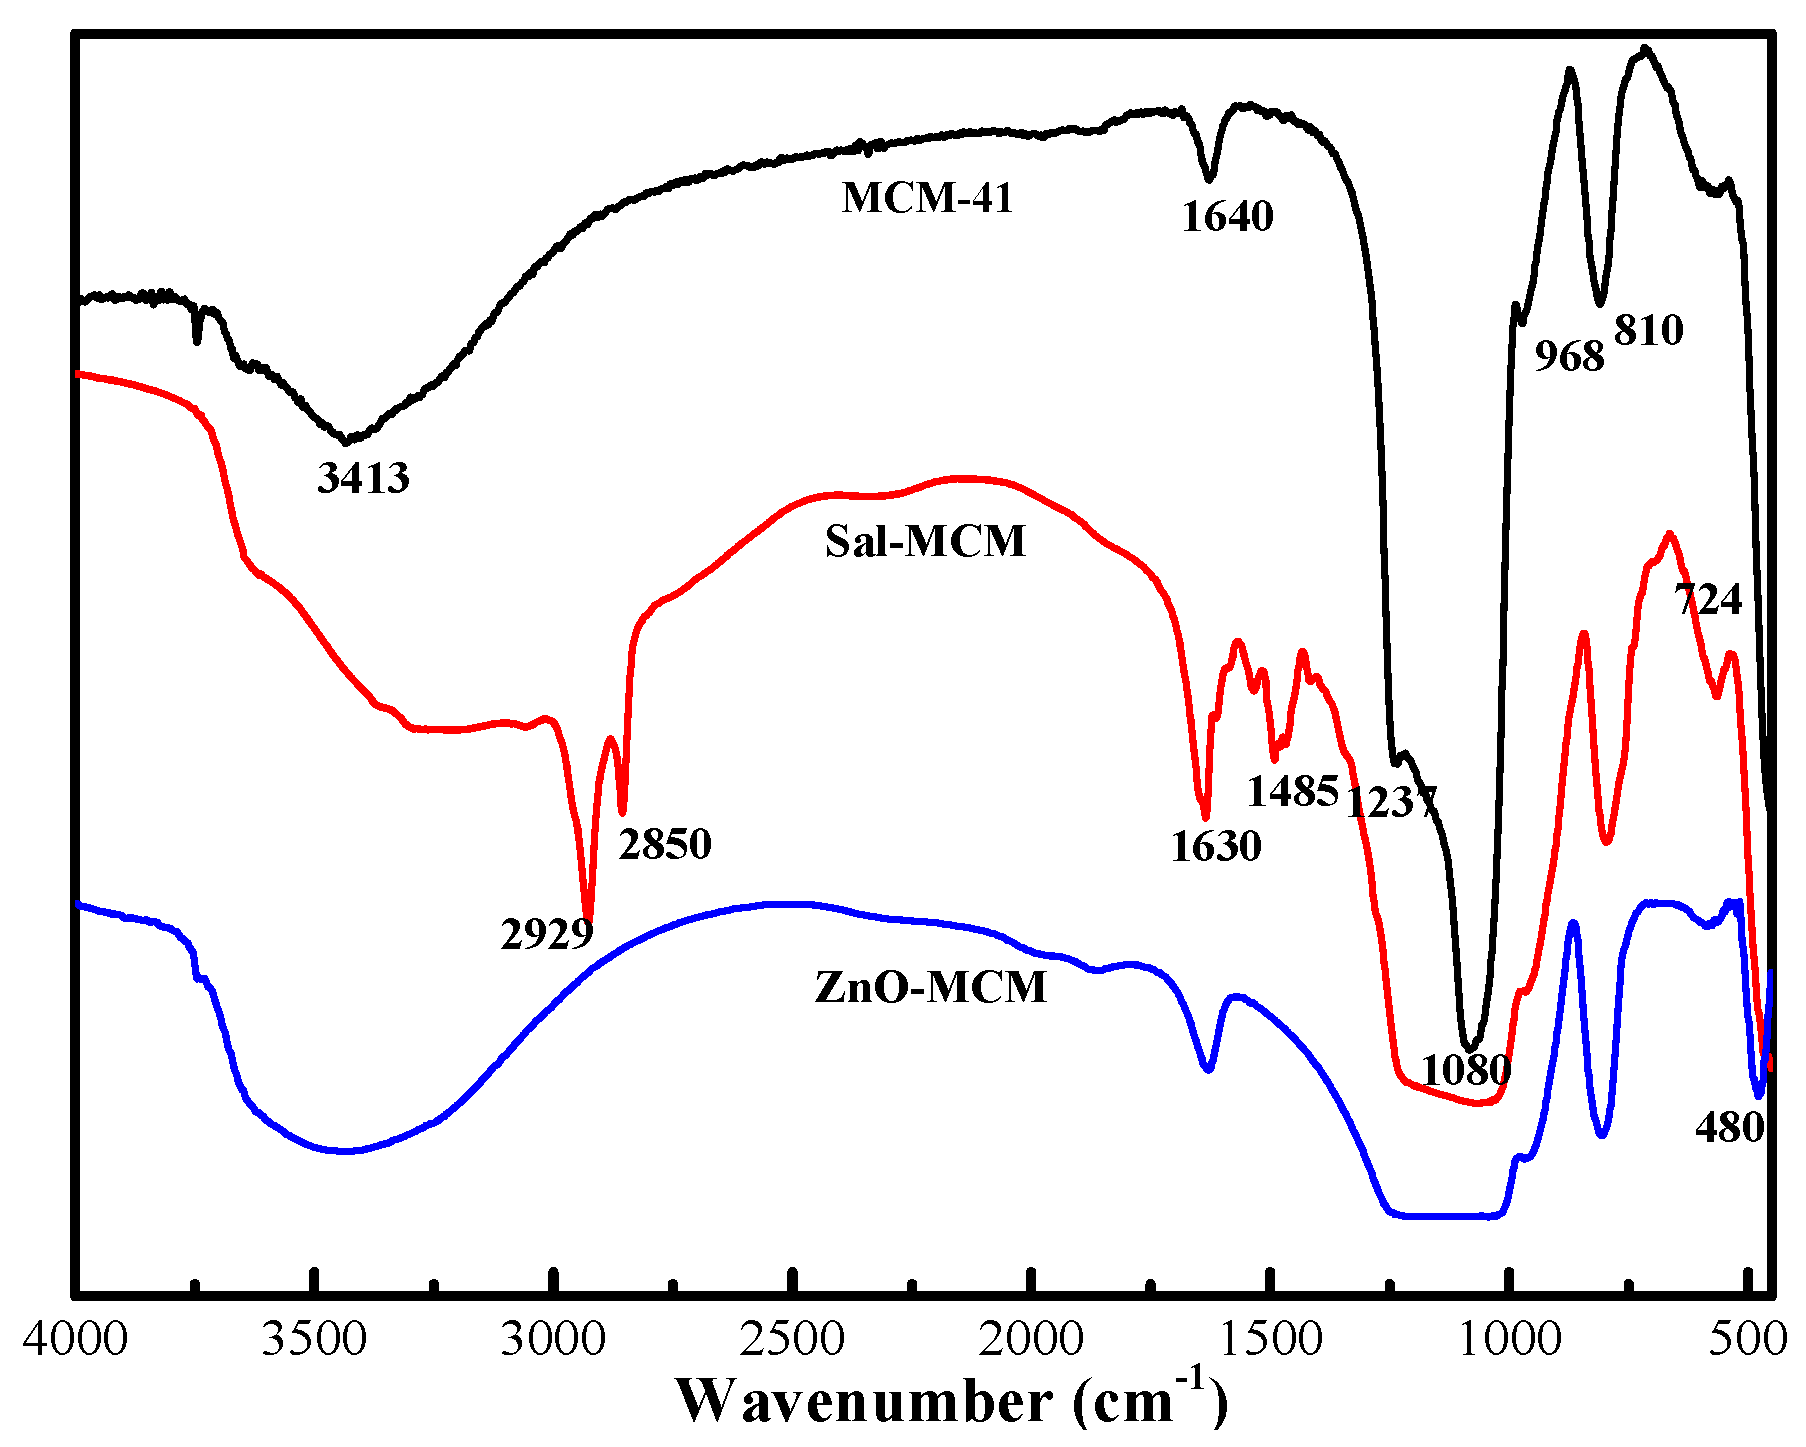
Figure 1, Fourier-transform infrared spectroscopy (FTIR) was adopted to compare the different compositions of MCM-41, Sal-MCM, and ZnO-MCM. For MCM-41, the bands located at 3413 cm
−1 and 968 cm
−1 were the stretching and bending vibrations of Si-OH, respectively [
38]. The two bands that appeared at 1080 cm
−1 and 810 cm
−1 belonged to the characteristic peaks of Si-O-Si on the SiO
2 framework. In comparison with MCM-41, two new bands appearing at 2929 cm
−1 and 2850 cm
−1 of Sal-MCM were attributed to the symmetric and non-symmetric C-H stretching vibration bands from the aminopropyl group. The vibration band of the benzene ring and the stretching band of C=N in salicylaldimine were located at 780 cm
−1 and 1630 cm
−1, respectively. It proved that the mesoporous silica was well modified by salicylaldimine. Compared with MCM-41, a red shift at 480 cm
−1 of ZnO-MCM was observed, which indicated that ZnO was well incorporated in the channels of MCM-41 [
39].
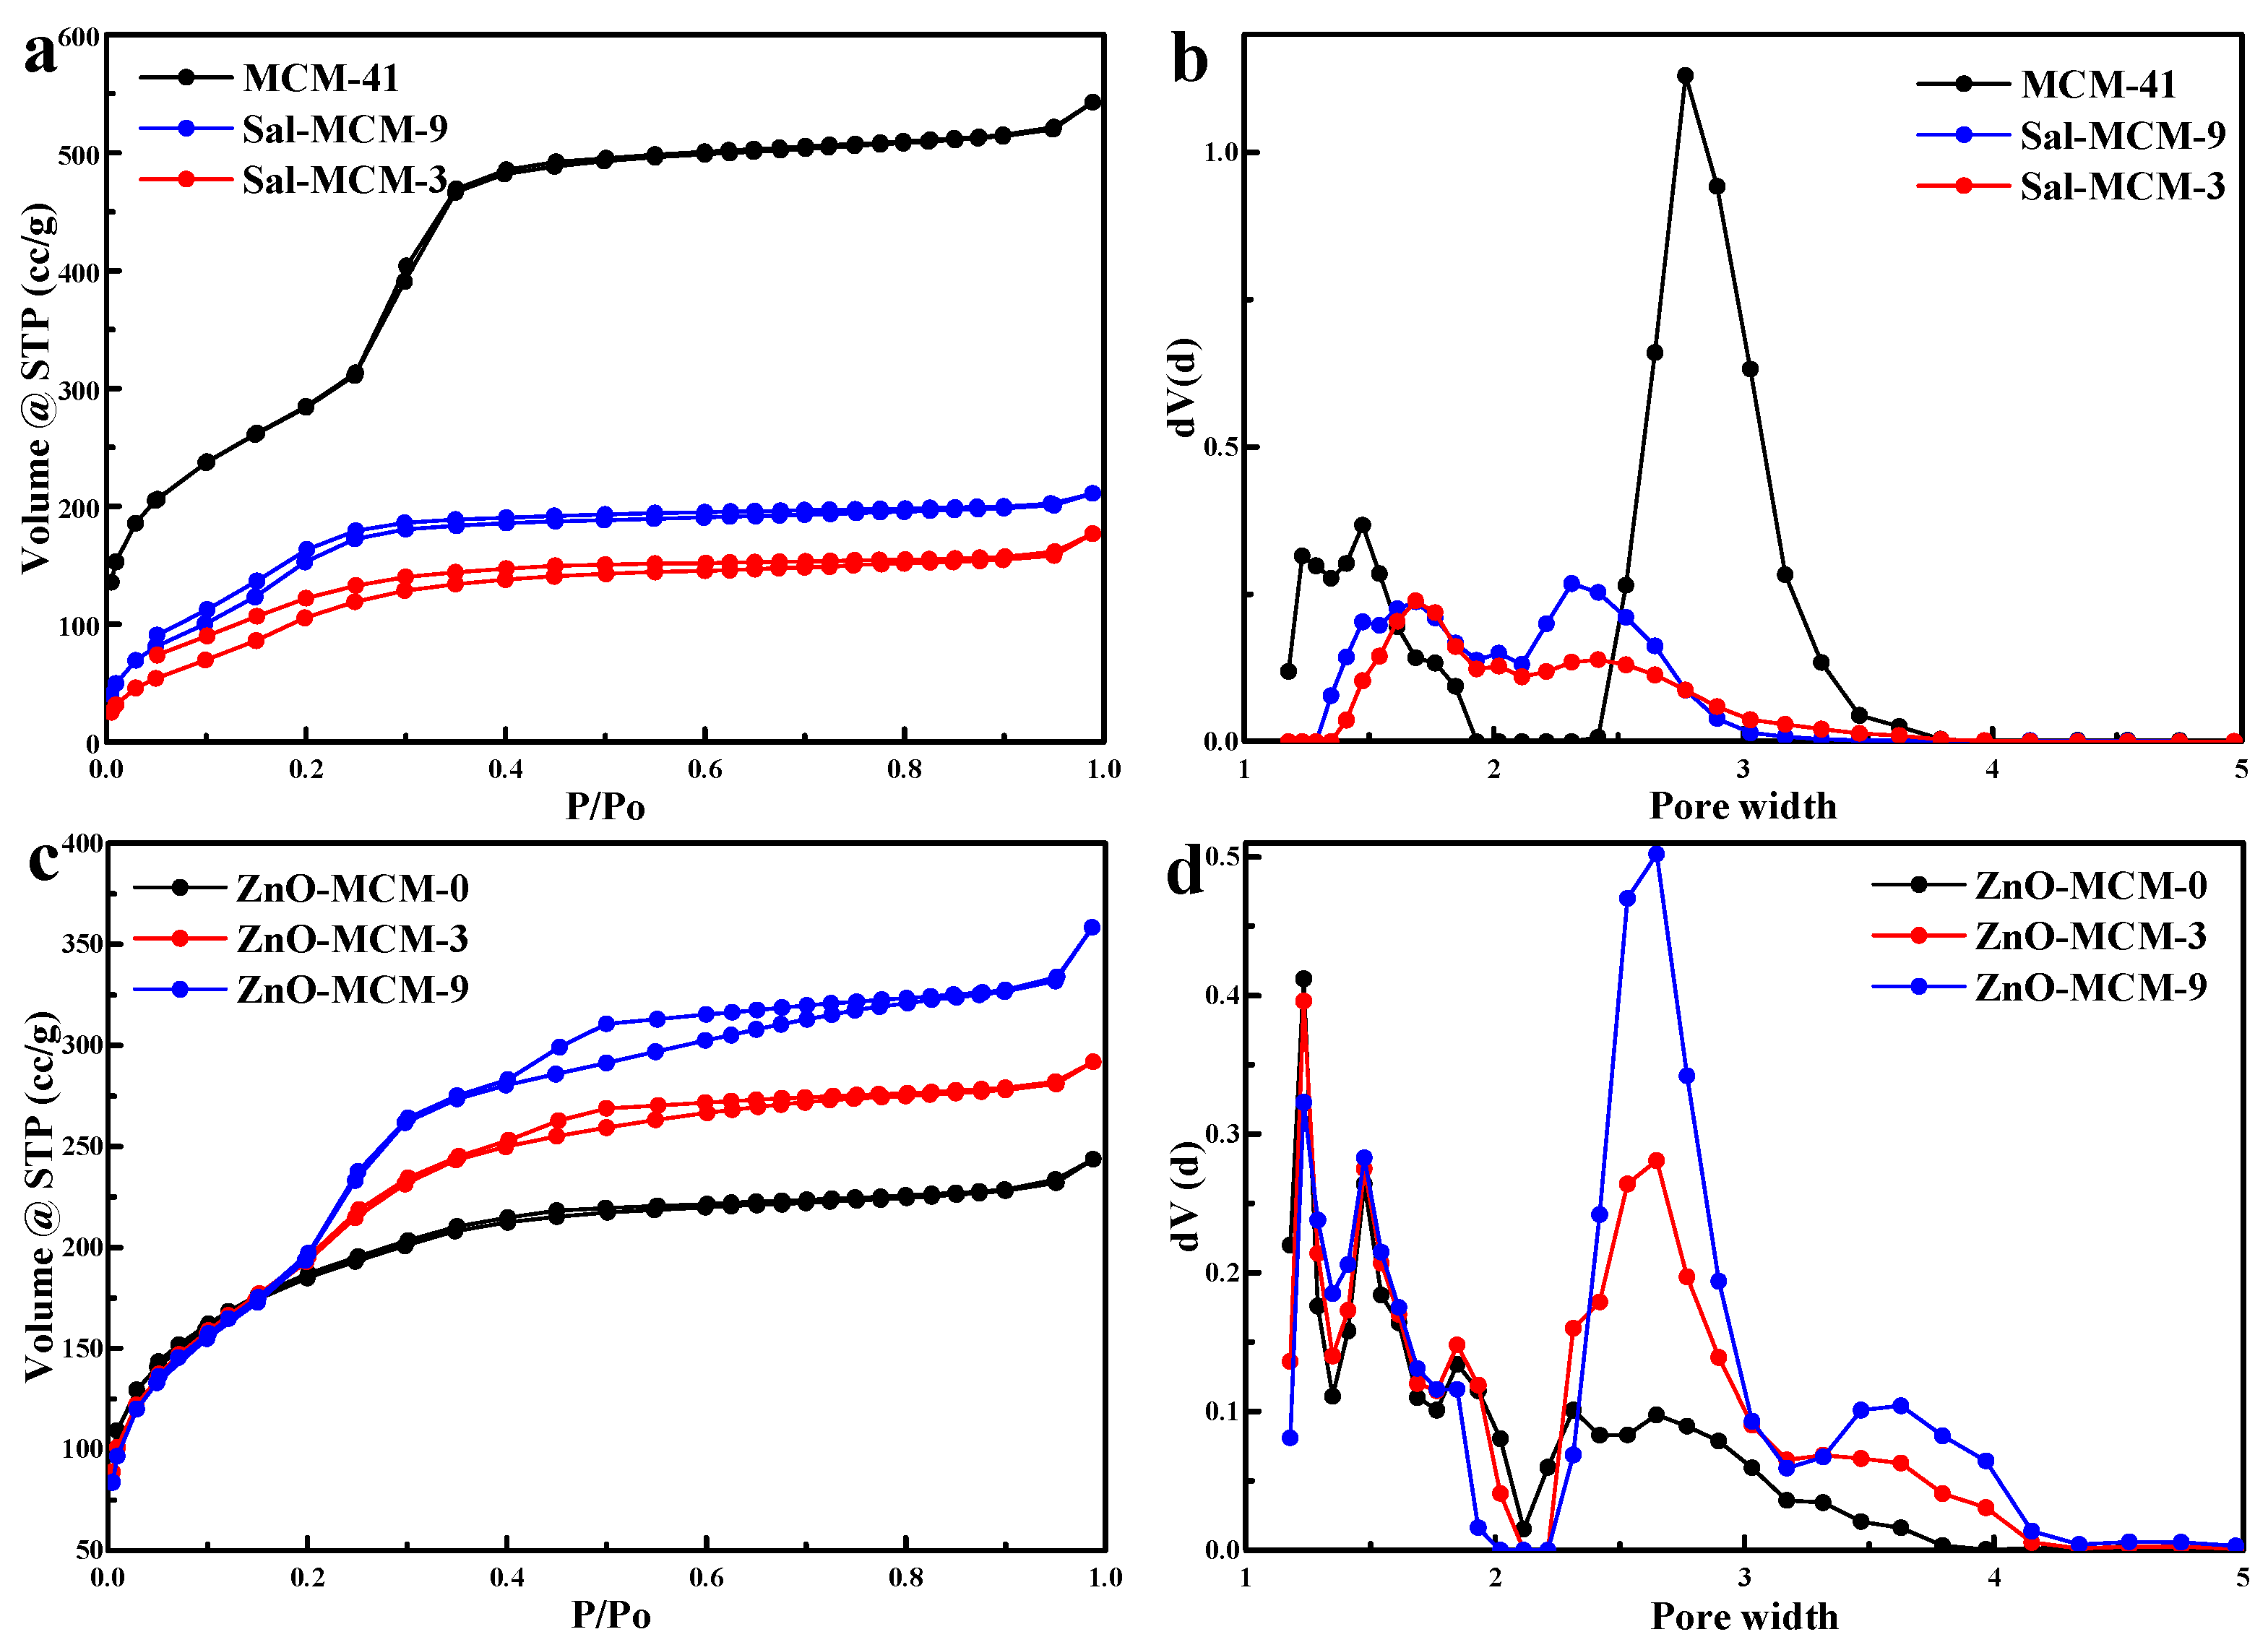
As shown in
Figure 2a, the N
2 adsorption/desorption isotherms of MCM-41, Sal-MCM-9, and Sal-MCM-3 belonged to the Langmuir IV type adsorption. Hysteresis loops in these isotherms were not obvious, which meant that the samples possessed a small pore size [
40], while the pore size distribution analyzed by the NLDFT method also confirmed the occurrence of micropores, as shown in
Figure 2b. The adsorption and desorption branches of Sal-MCM could not be easily duplicated within
p/
po = 0.0 to
p/
po = 0.2 due to a certain extent of chemical adsorption by salicylaldimine during the testing process [
41]. In addition, as shown in
Table 1, the modification of salicylaldimine would significantly decrease the BET surface, pore diameter, and pore volume due to the blocking effect of salicylaldimine. Moreover, the BET surface of Sal-MCM-3 and Sal-MCM-9 were 453.385 m
2/g and 634.437 m
2/g, respectively, which meant that the salicylaldimine modification on Sal-MCM-3 was more than that of Sal-MCM-9. The modification of salicylaldimine not only decreased the pore size of the mesoporous silica, but also broadened the distribution.
As shown in
Figure 2c, after the load of ZnO, the N
2 adsorption/desorption isotherms of ZnO-MCM-0, ZnO-MCM-3 and ZnO-MCM-9 were still maintained as Langmuir IV types. Type H4 hysteresis loops were observed in the isotherms of ZnO-MCM-3 and ZnO-MCM-9 at
p/
po = 0.4, while the isotherm of ZnO-MCM-0 did not show any type of hysteresis loops. The appearance of the H4 hysteresis loop implied the instability of the adsorbed N
2 due to the presence of ZnO in the pores of the mesoporous silica [
40]. All the samples in
Figure 2d showed three kinds of microporous distributions. Particularly, two mesopore systems, one with a relatively narrower and smaller pore size and another with a larger and broader pore size, were observed for ZnO-MCM-3 and ZnO-MCM-9. In contrast, ZnO-MCM-0 only exhibited a wider and smaller mesoporous distribution. It was supported that the introduction of ZnO would make the mesoporous silica form a hierarchical characteristic structure. As shown in
Table 1, due to the blocking effect of ZnO, the BET surface, pore diameter, and pore volume decreased. Furthermore, when compared to MCM-41, the BET surface of ZnO-MCM-0, ZnO-MCM-3, and ZnO-MCM-9 decreased by about 561.72 m
2/g, 447.834 m
2/g, and 338.410 m
2/g, respectively. It can be seen that the more salicylaldimine modifications the MCM-41 underwent, the more zinc ions would be adsorbed so that more nano ZnO would be supported on MCM-41. Additionally, it was obvious that both the changes of the BET surface of ZnO-MCM-3 and ZnO-MCM-9 were less than that of ZnO-MCM-0. This phenomenon proved that using the chemical groups modified on mesoporous silica to adsorb zinc ions would cause less damage to the surface areas of the vehicle than that of the simple physical adsorption of pure mesoporous silica before oxidizing zinc ions to ZnO.
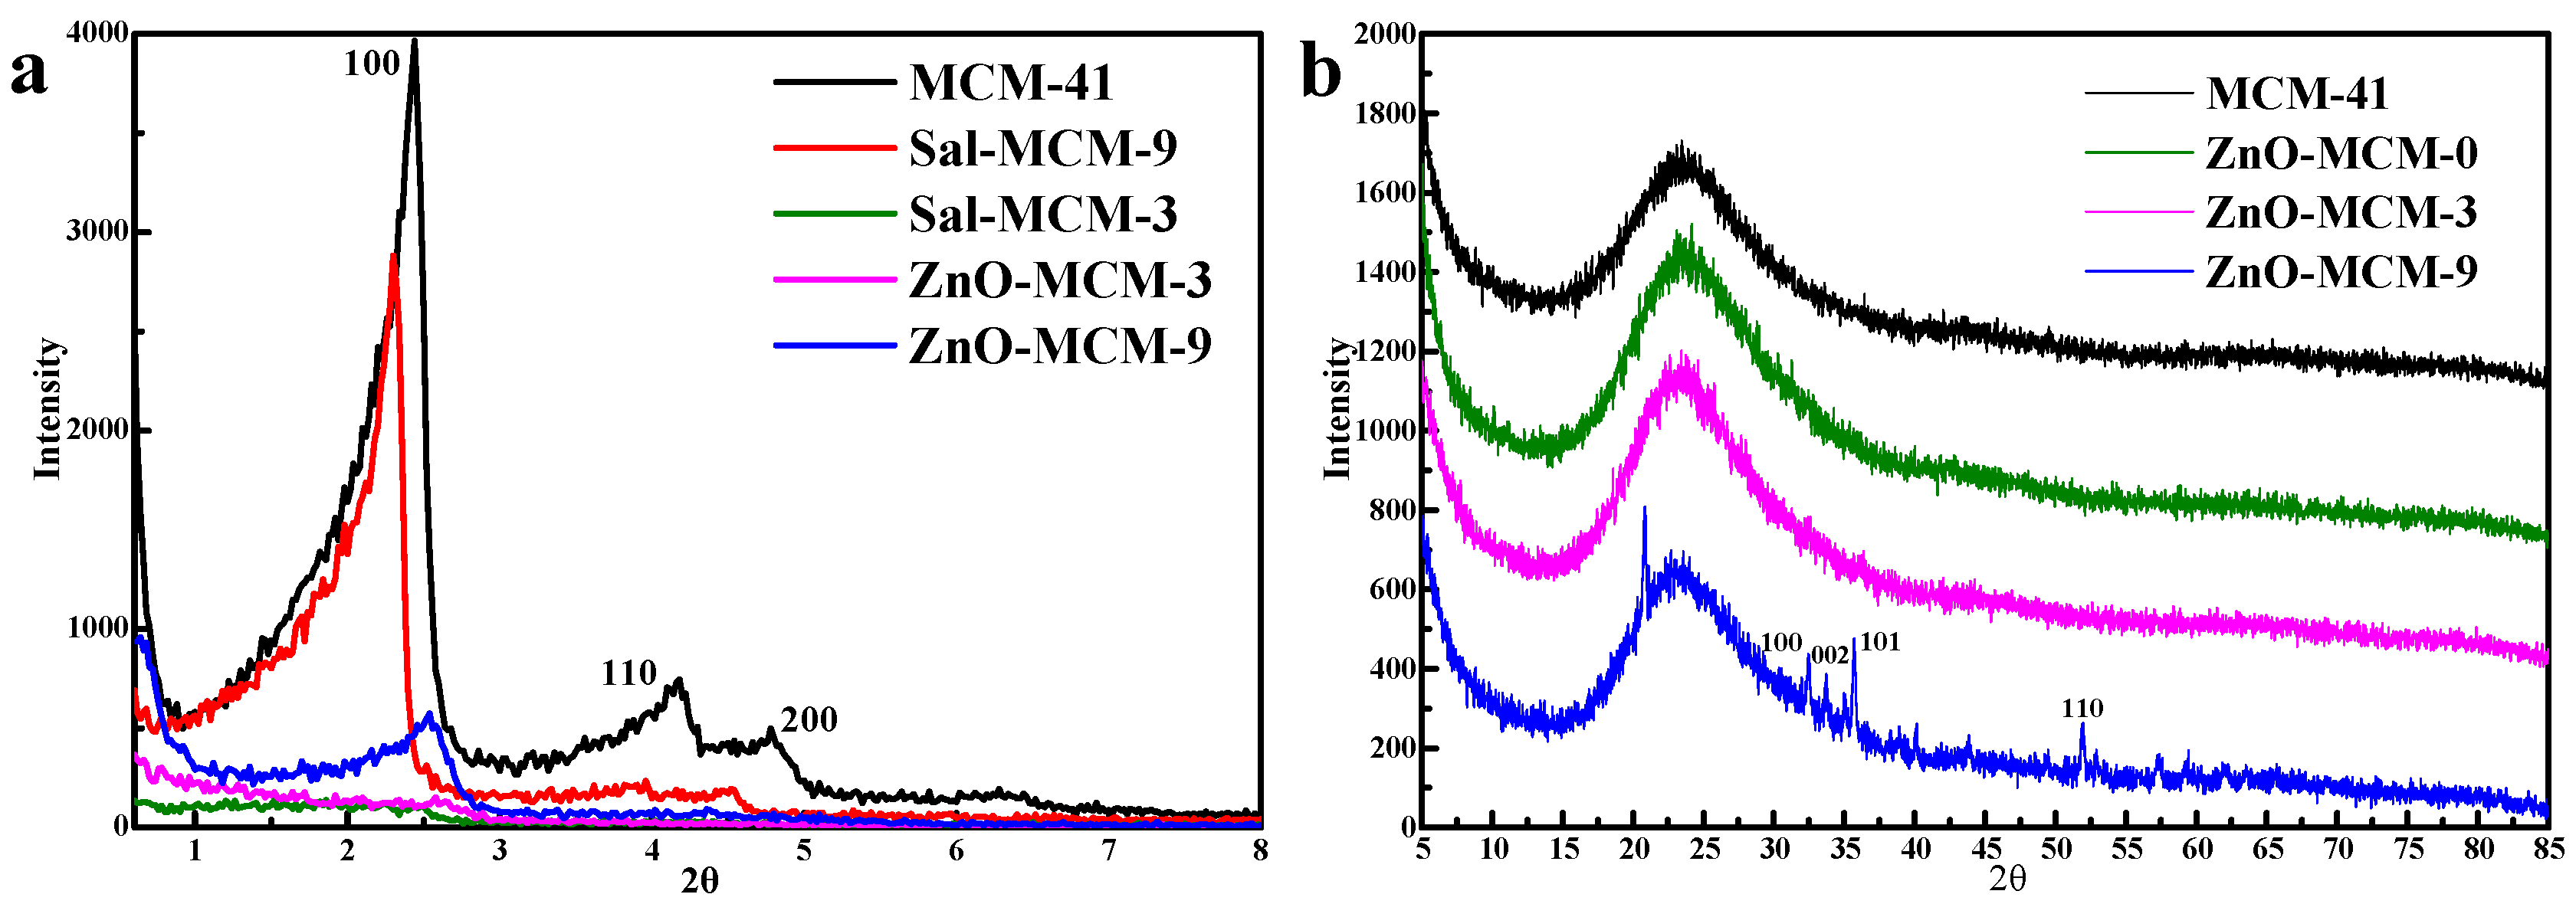
Figure 3 shows the low angle X-ray diffraction (LXRD) patterns of MCM-41, Sal-MCM-3, Sal-MCM-9, ZnO-MCM-3, and ZnO-MCM-9. Three characteristic peaks are shown in MCM-41, which could be ascribed to the (100), (110), and (200) crystal faces, indicating that the particles had a regular hexagonal pore structure [
42]. The modification of salicylaldimine made the intensity of the low-angle XRD peaks decrease, especially in the (110) and (200) crystal face. Furthermore, when the amount of salicylaldimine increased, all of the crystal faces disappeared. All these phenomena identified that salicylaldimine was introduced to the system and decreased its degree of orderliness [
43]. After the load of ZnO, peaks of the (100) crystal face of both ZnO-MCM-3 and ZnO-MCM-9 shifted to a higher 2θ, which meant the occurrence of ZnO in the channels. In comparison to Sal-MCM-9, the intensity of the (100) crystal face peak of ZnO-MCM-9 decreased, and the peaks of the (110) and (200) crystal faces faded away. However, the pattern of ZnO-MCM-3 still maintained the same shape as that of Sal-MCM-3. This result proved that the degree of orderliness of salicylaldimine-modified MCM-41 is crucial for ZnO formation inside the channels, and it further affects the orderliness of ZnO-MCM.
Figure 3 also shows the wide-angle X-ray diffraction patterns (WXRD) of MCM-41, ZnO-MCM-0, ZnO-MCM-3, and ZnO-MCM-9. Compared with MCM-41, no characteristic peaks of ZnO were observed in these wide-angle patterns of ZnO-MCM-0 and ZnO-MCM-3. Only diffuse peaks of the non-crystalline silica appeared, meaning that ZnO was finely loaded on the mesoporous silica and the cluster size of ZnO was too small to be detected by X-ray [
44]. However, it also confirmed that ZnO was not present in the crystalline form [
45], and the growth of ZnO was limited by the mesostructure of the vehicle. For ZnO-MCM-9, although the LXRD showed that the material was not in a good degree of orderliness, a series of peaks were still observed at the (100), (002), (101), and (110) crystal faces, which could be indexed to the wurtzite structure of ZnO [
46]. Combined with the blocking effect confirmed by the N
2 adsorption/desorption, it meant that the bad degree of orderliness of ZnO-MCM-9 was caused by ZnO. From the above information from the XRD patterns, it was supported that a good degree of orderliness of the vehicle as well as an appropriate amount of ZnO could help ZnO form a wurtzite structure on mesoporous silica.
As listed in
Table 2, the zeta potential of Sal-MCM-3 shifted from −35.38 to 40.08 mV, owing to the positive ions from the nitric of salicylaldimine [
47]. The result proved that the surface of MCM-41 was modified with salicylaldimine.
Table 2 also shows that the zeta potential of ZnO-MCM-3 shifted from −35.38 to −23.08 mV. It proved that positively charged ZnO nanoparticles could partly neutralize the negative electric charges on the MCM-41 surface. However, Hassan [
48] found that after the ZnO was supported on MCM-41, the material showed a positive zeta potential, which was about 9.3 mV. According to the detection mechanism of zeta potential, usually the electric potential detected by the machine was from the electrostatic field of the surface of the nanoparticles [
49]. This confirmed that most of the ZnO nanoparticles were loaded in the channels of MCM-41 and only a small part of ZnO was loaded on the outside surface, which could also be proved from the change of pore diameter shown in
Table 1.
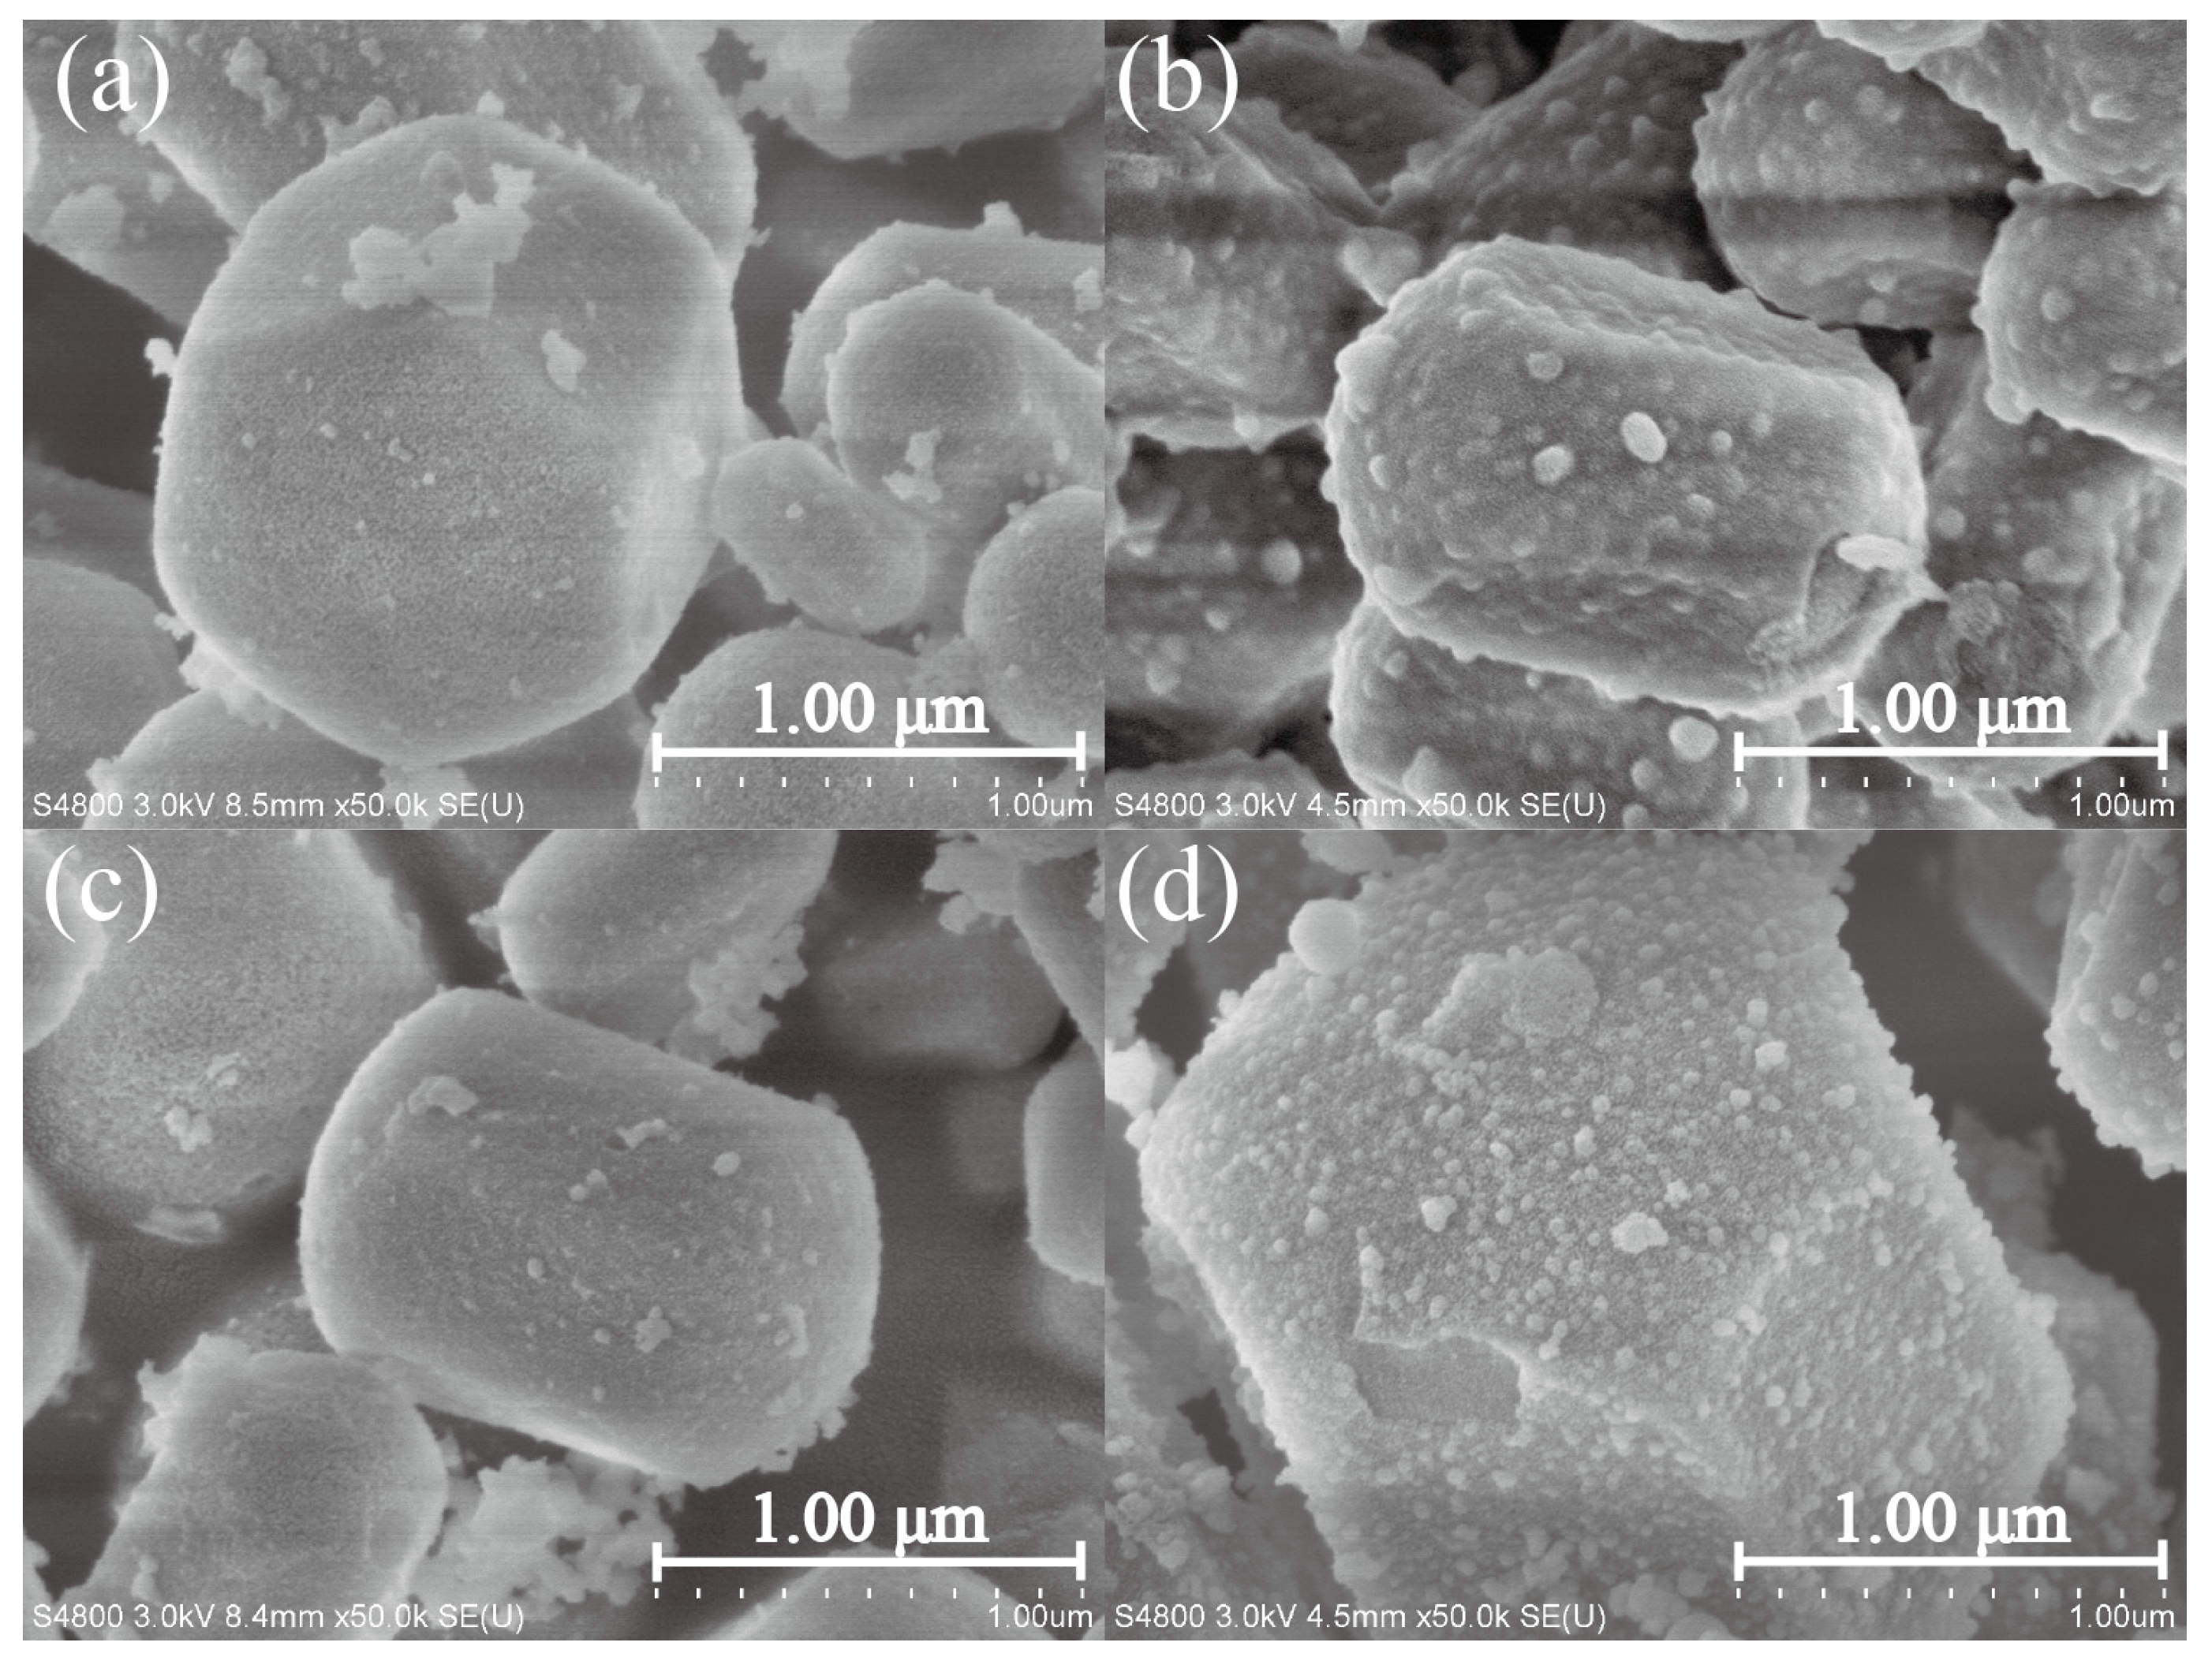
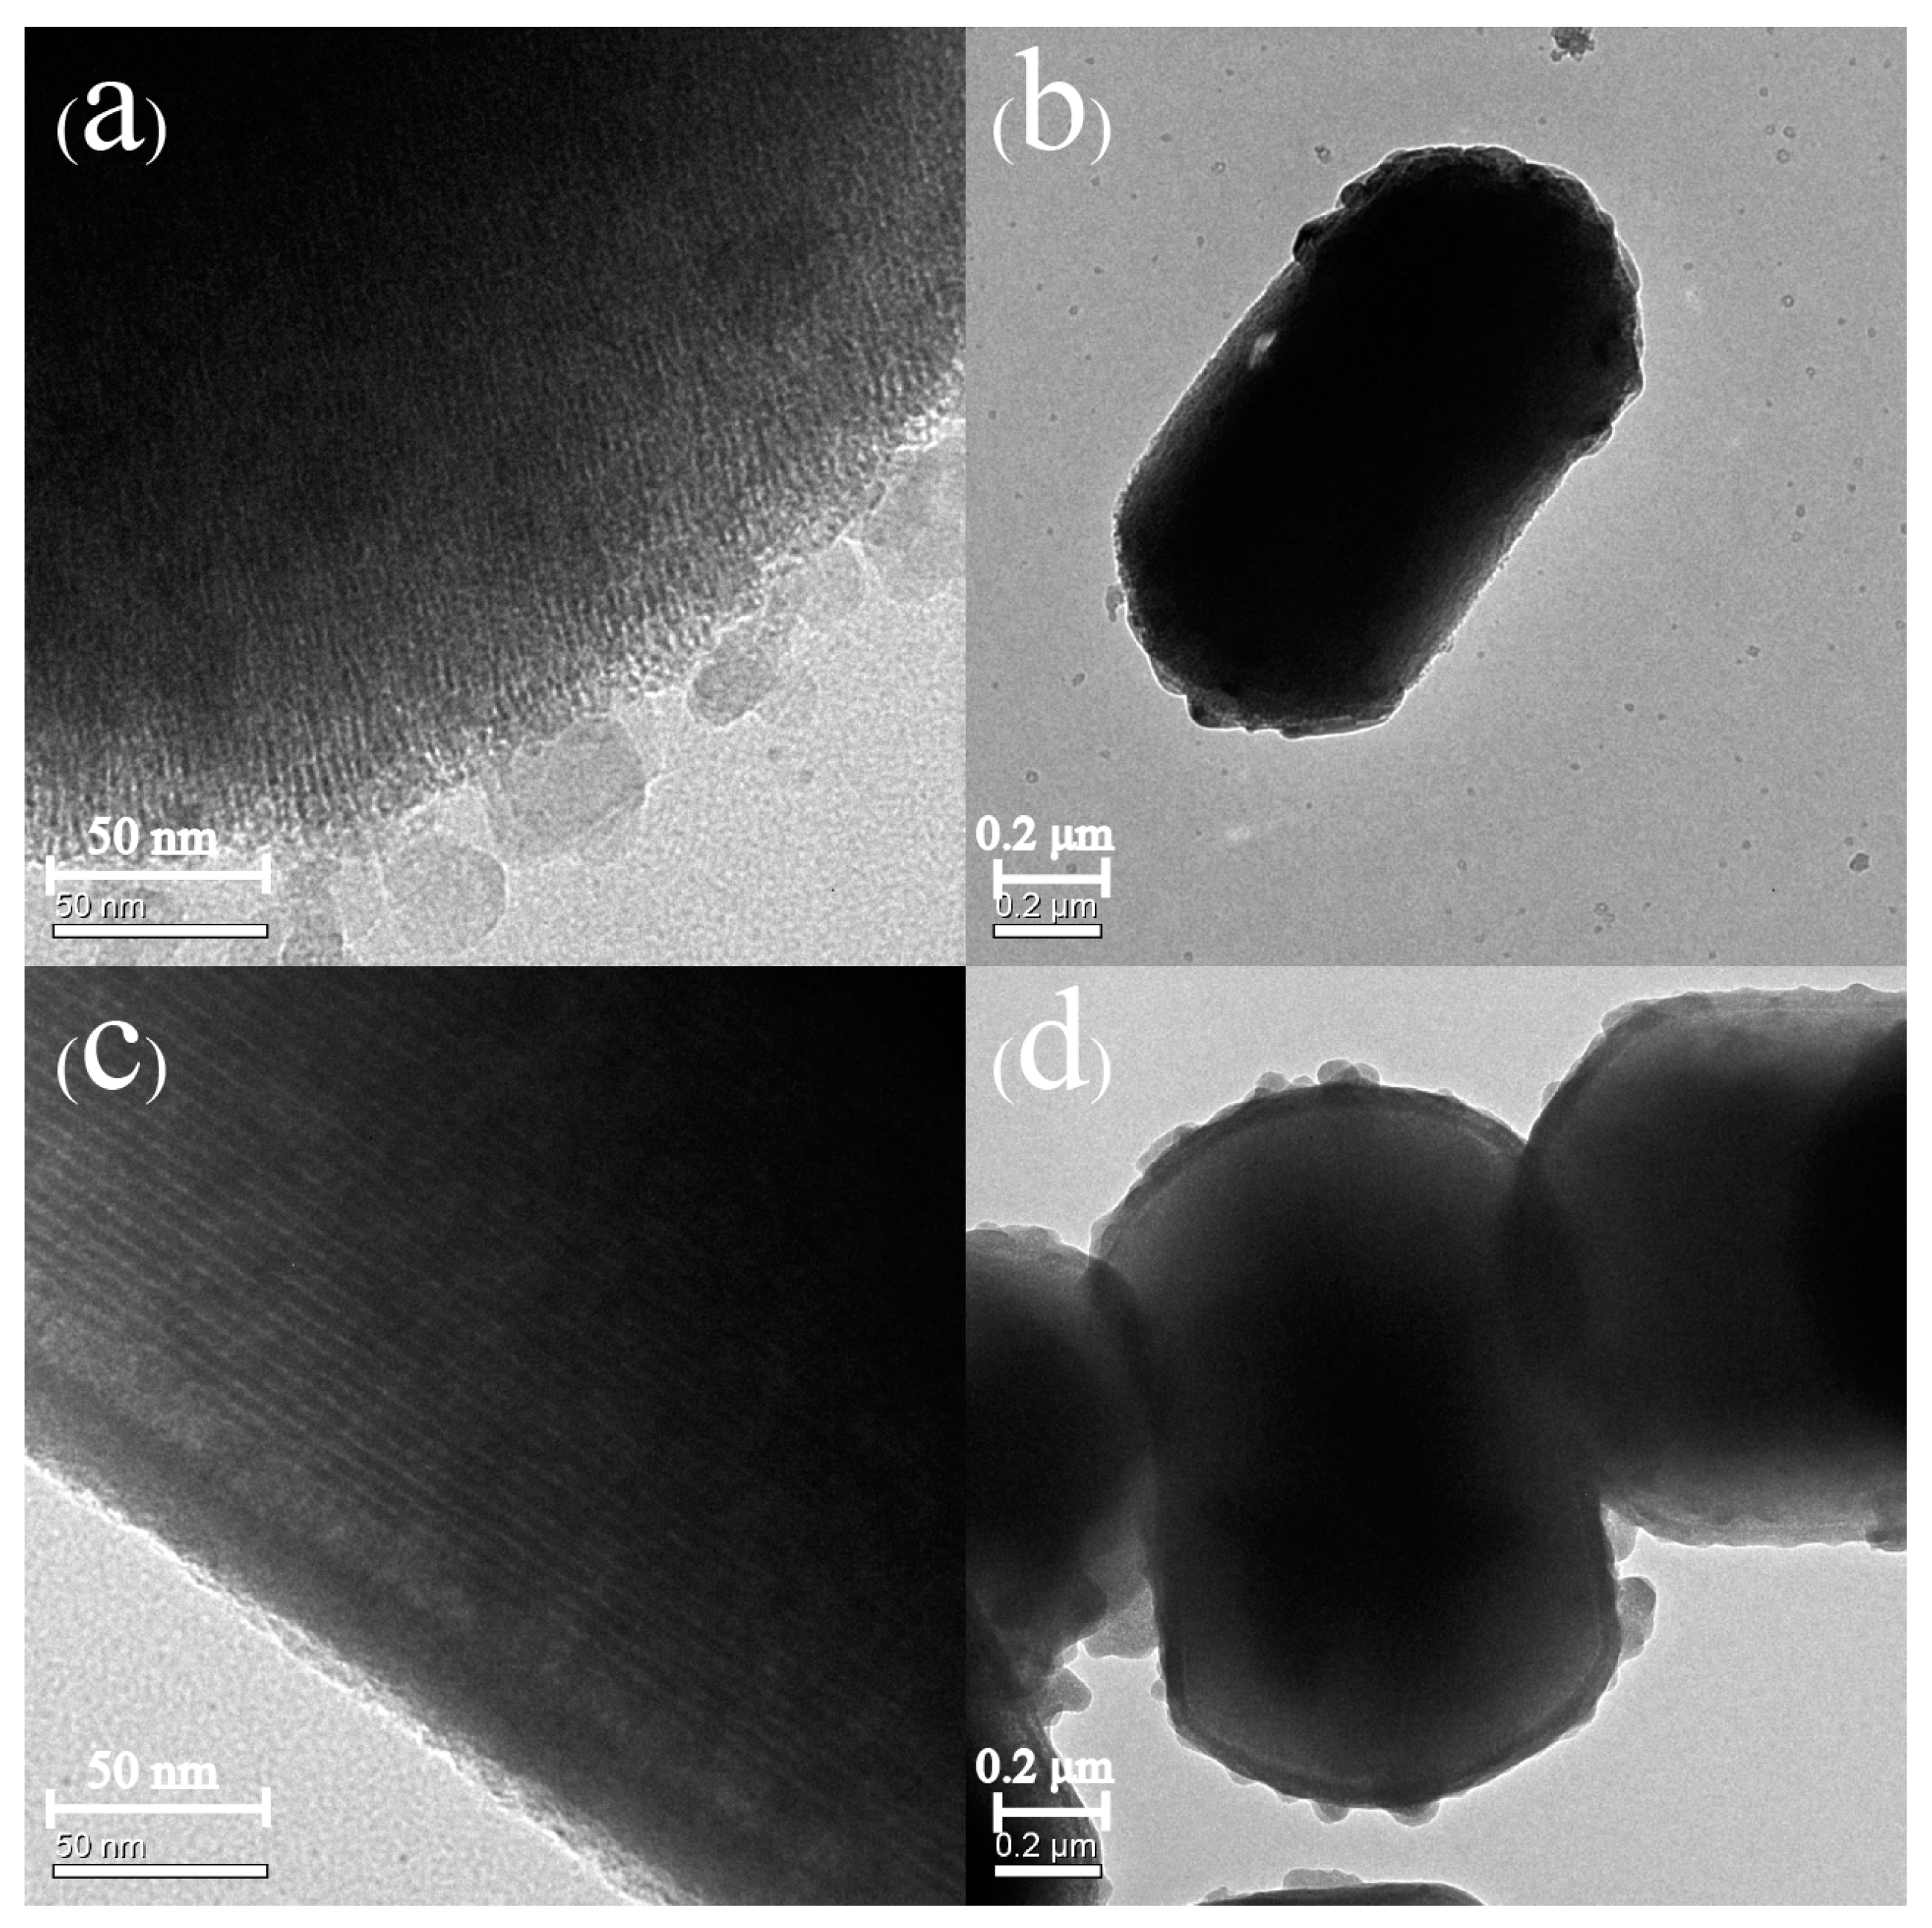
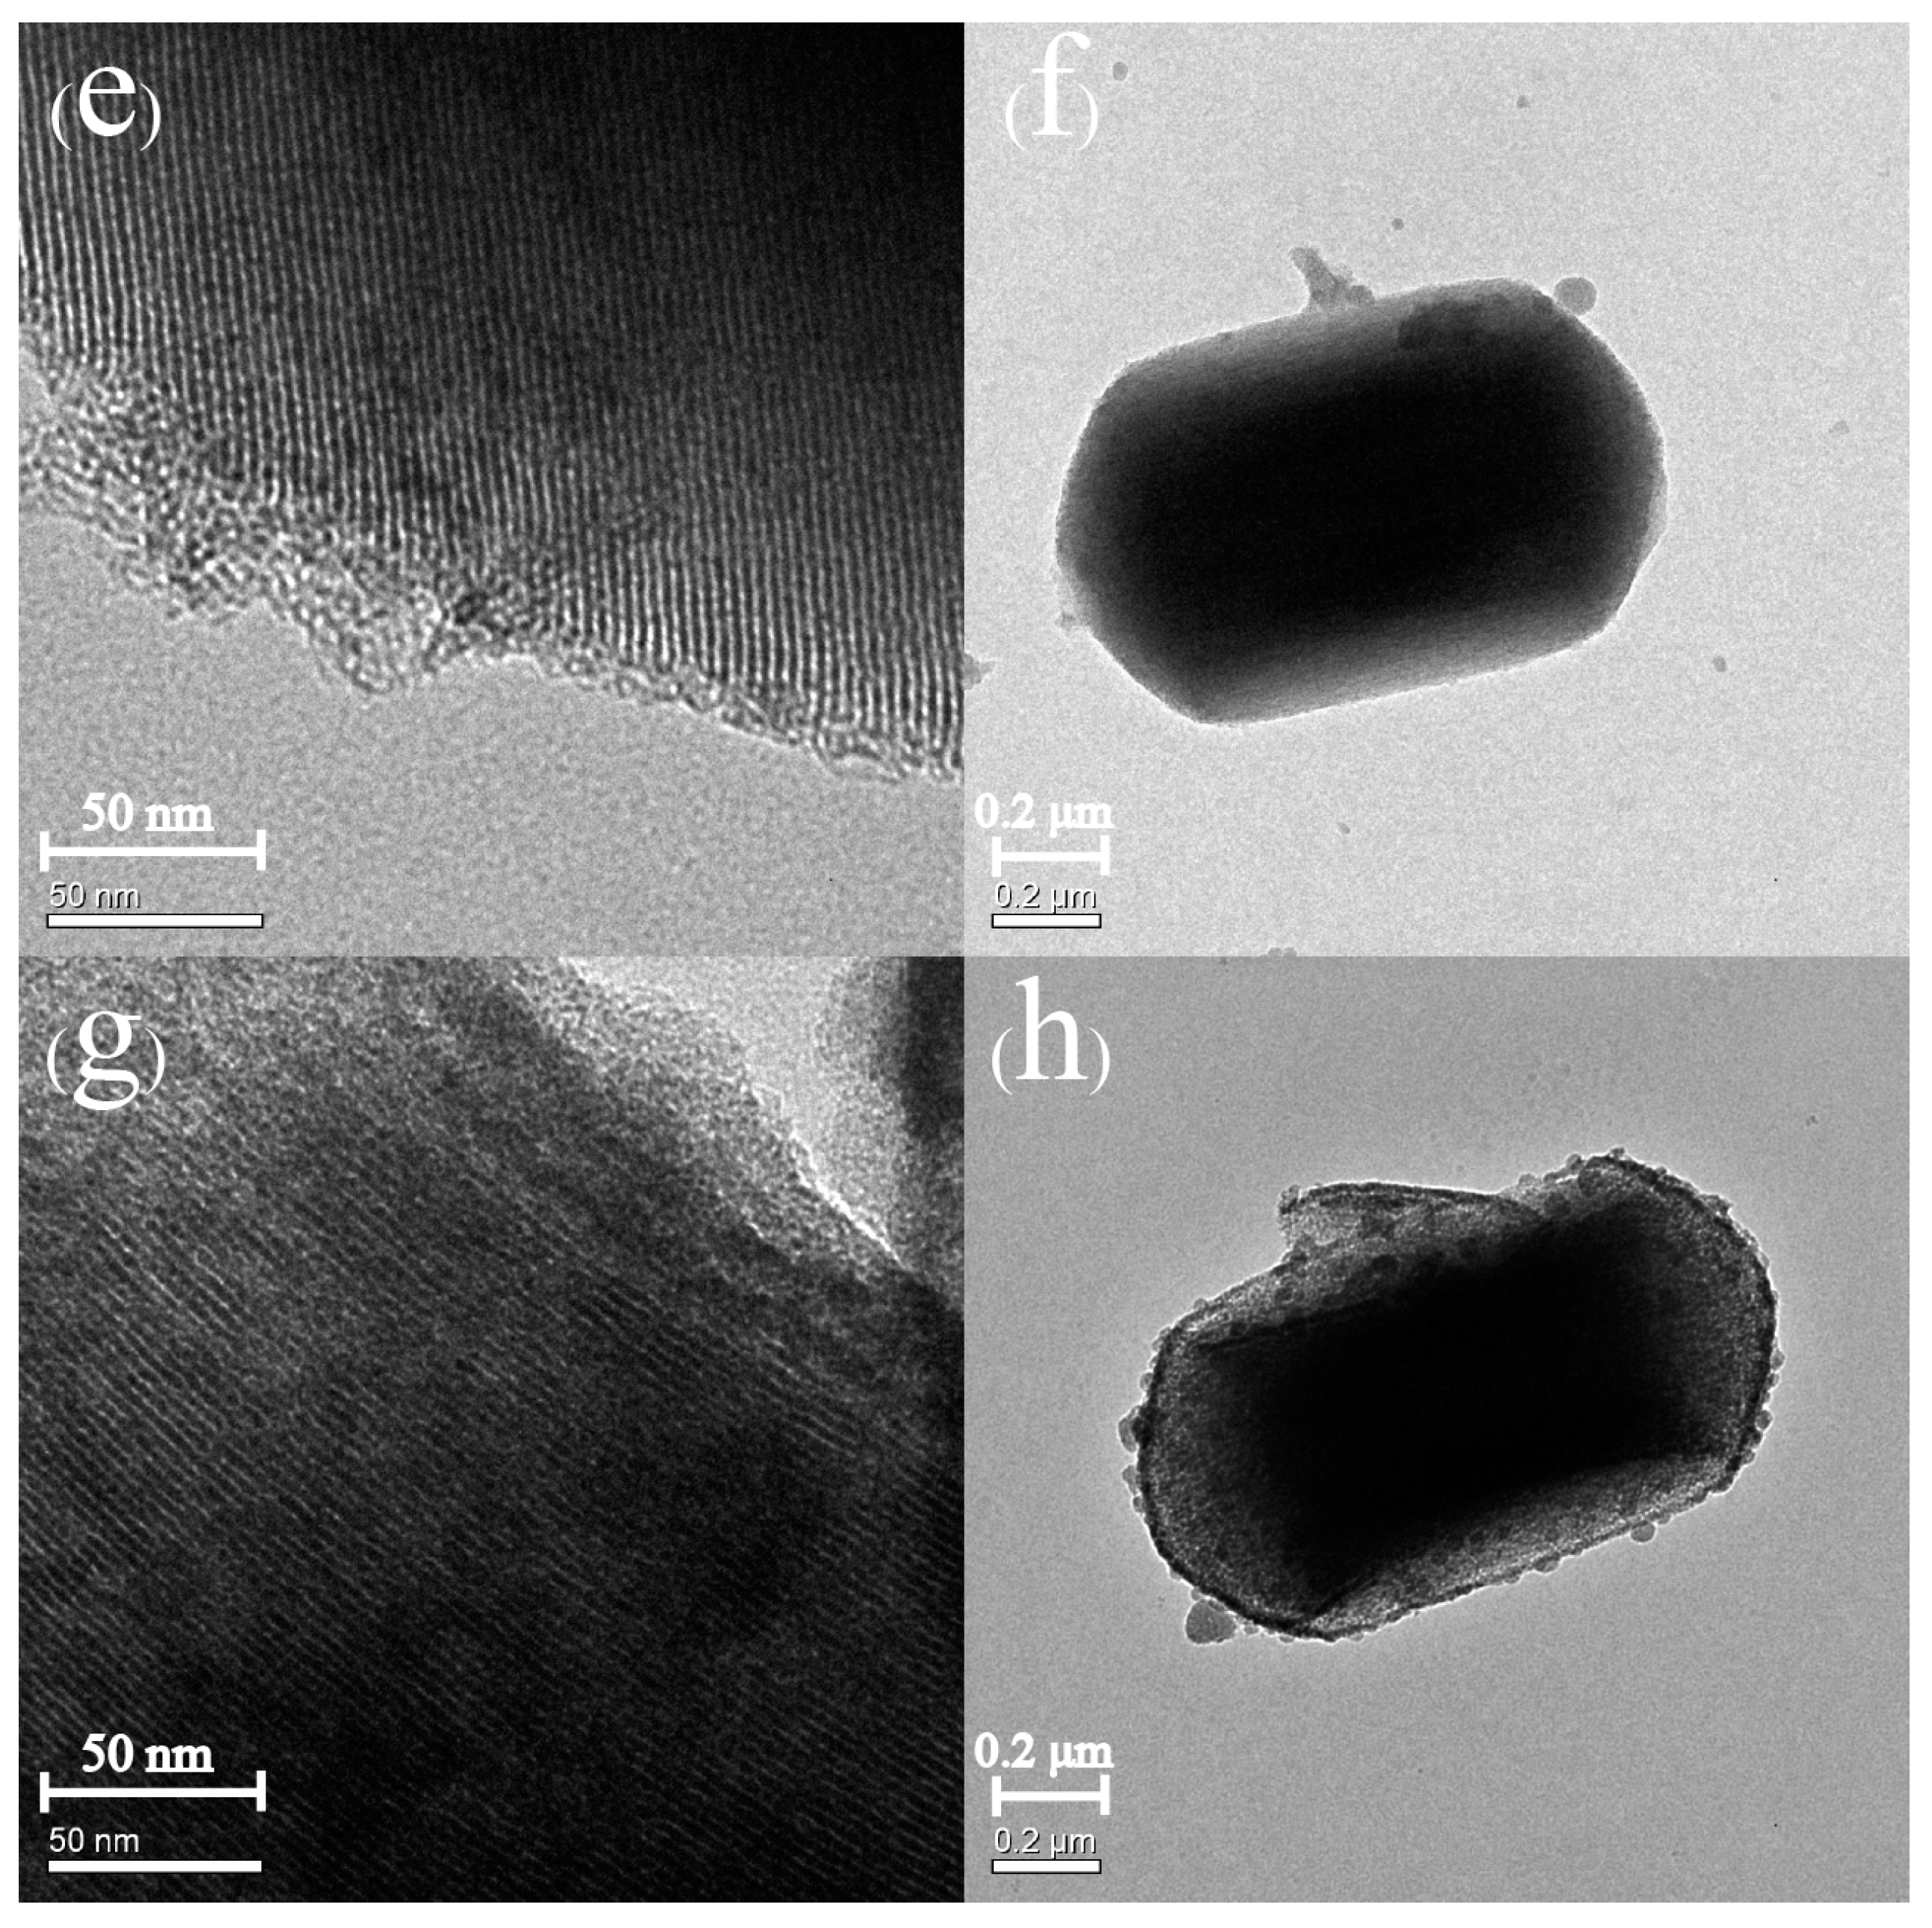
Figure 4 and
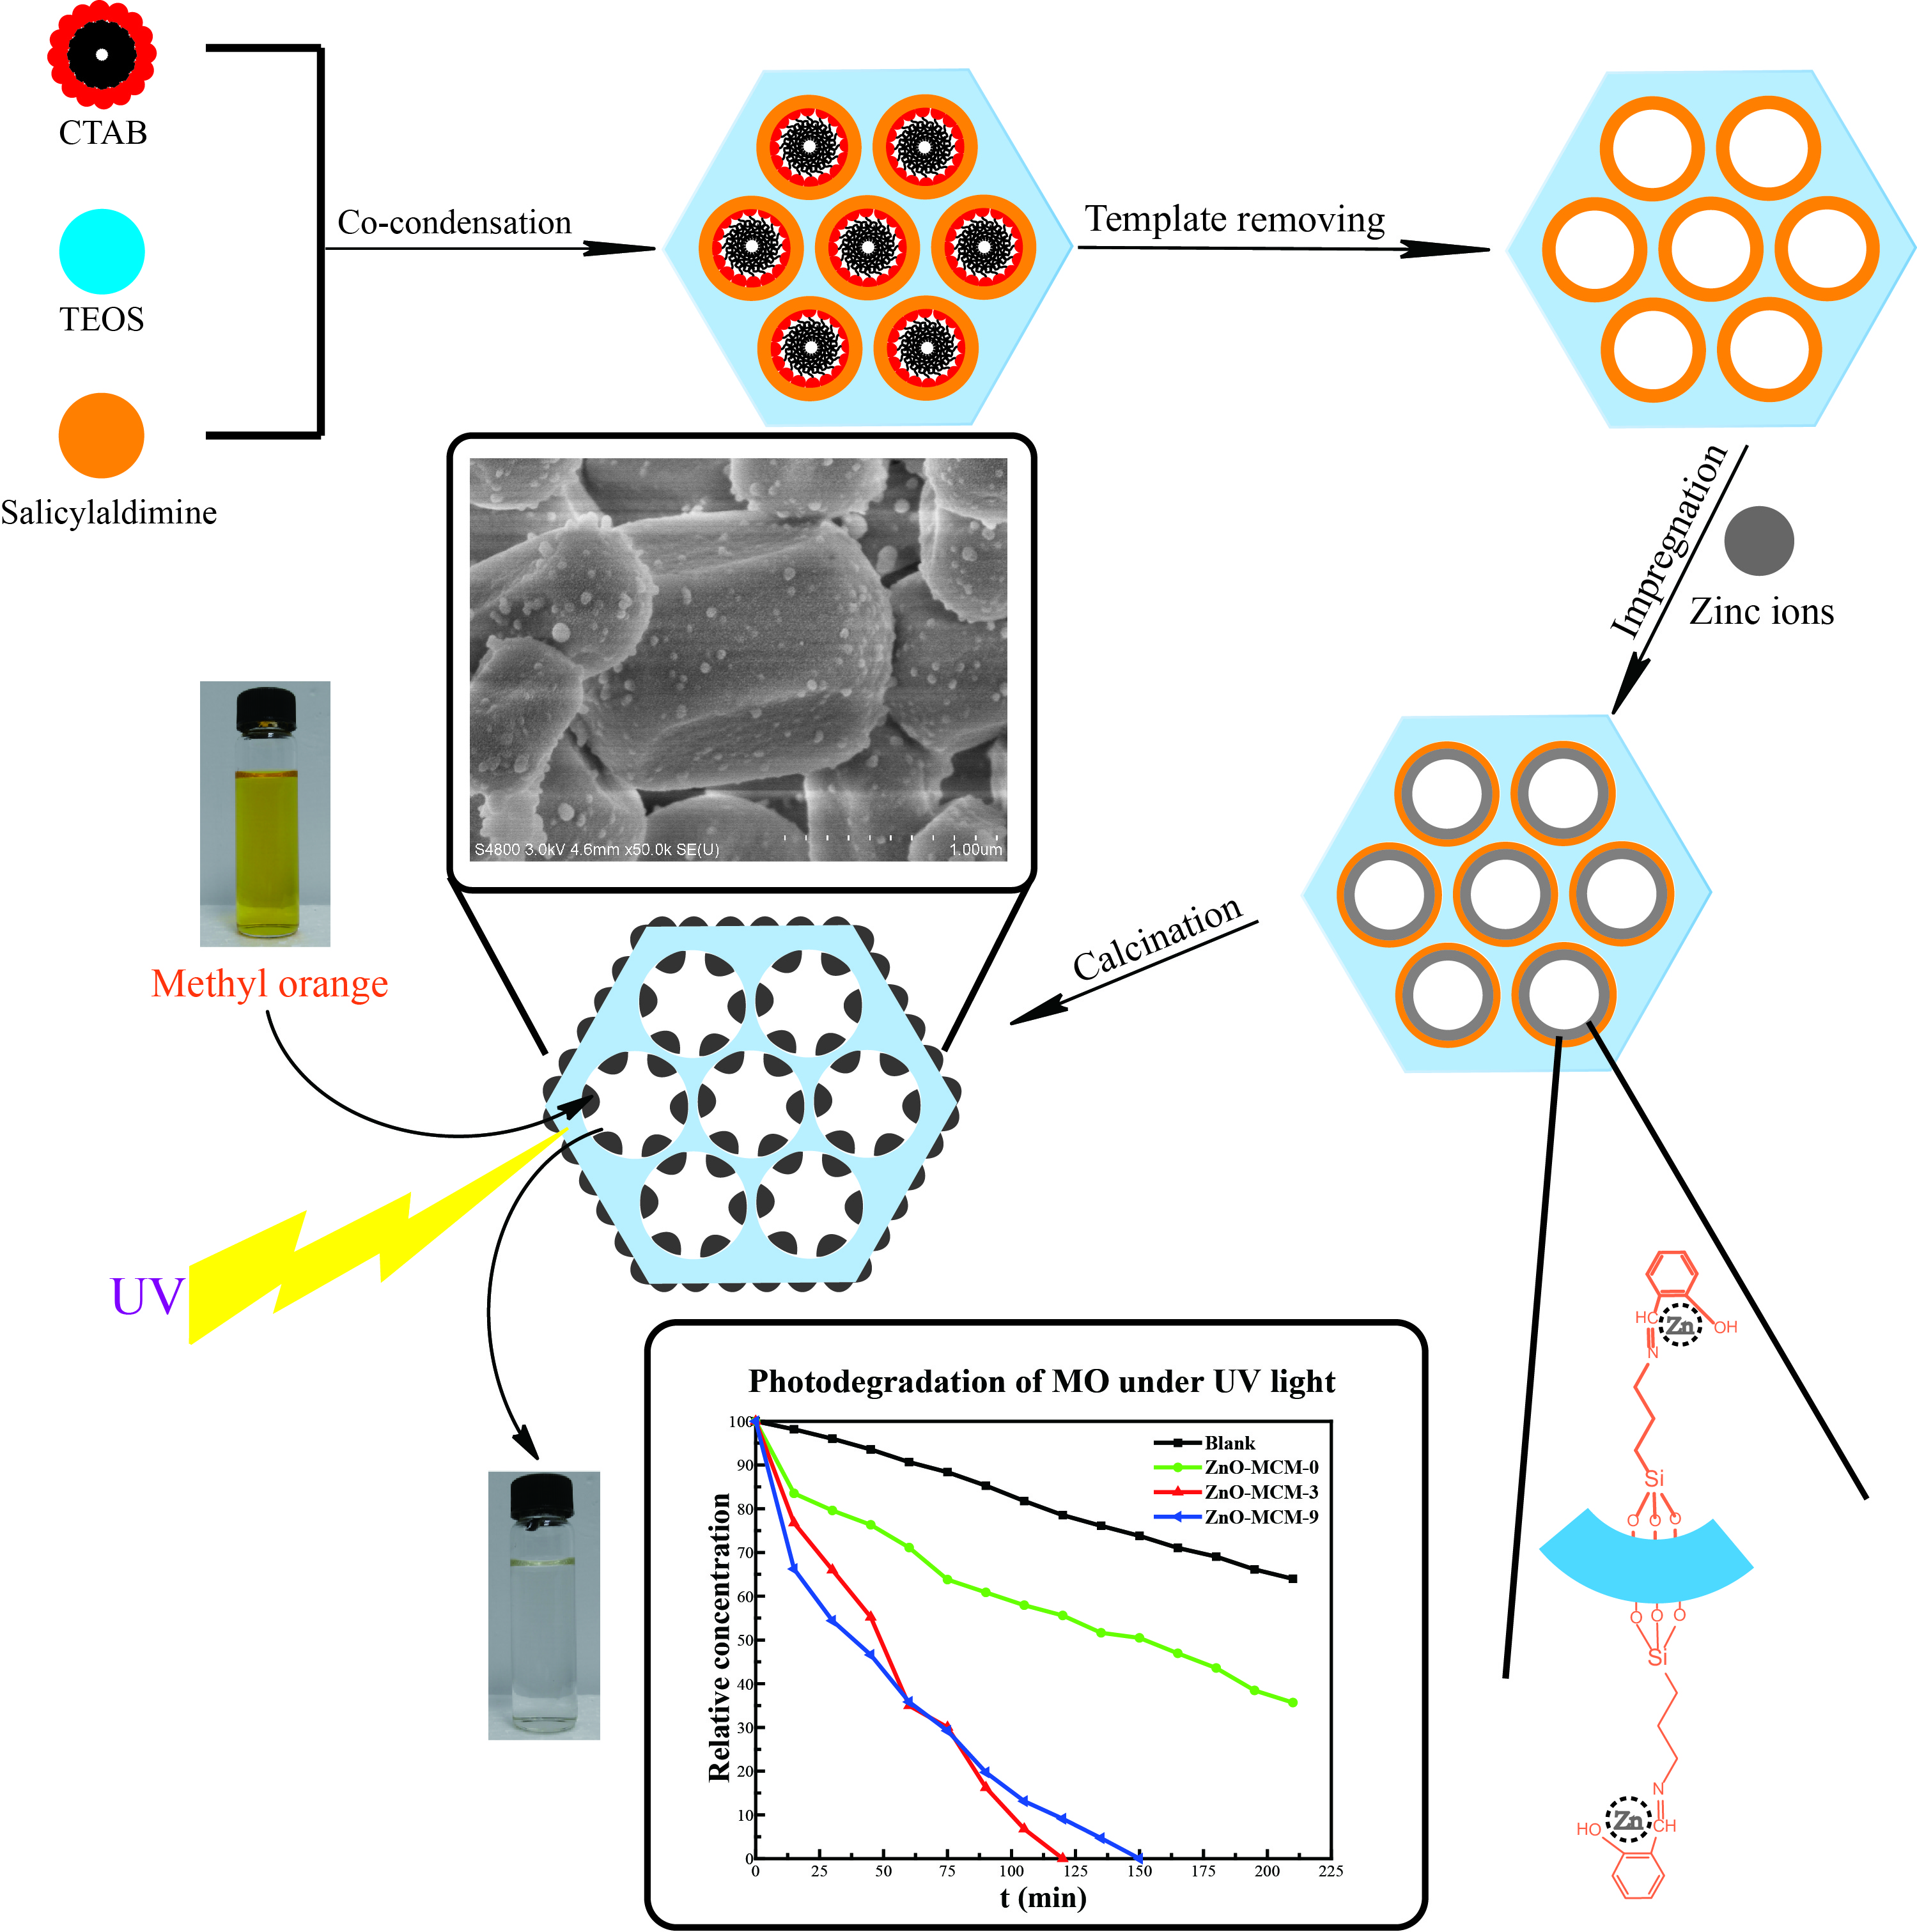
Figure 5 depict the SEM and TEM images of MCM-41, Sal-MCM, ZnO-MCM-0, and ZnO-MCM-9. As shown, the regular hexagonal pore structure was well-maintained without agglomeration after the modification of salicylaldimine or the load of ZnO. Both Sal-MCM and ZnO-MCM showed a rough shell structure on the external surface with many circular particles due to the introduction of salicylaldimine and ZnO. The surface of ZnO-MCM-9 (
Figure 4d) was rougher than that of ZnO-MCM-0 (
Figure 4c), indicating that salicylaldimine could help the vehicles adsorb more zinc ions and, thus, more ZnO would form. Comparing the wurtzite form of nano ZnO showed by WXRD to the spherical form nanoparticles on the surface of ZnO-MCM-9, it was obvious that the wurtzite shaped ZnO were formed in the channels instead of the outside surface of MCM-41. This proved that the shape of ZnO nanoparticles could be controlled by the changeable channels of mesoporous silica, while those ZnO nanoparticles grown on the outside surface could not form in the same shape due to the lack of restrictions. Materials in
Figure 5 all presented in the parallel lattice fringes structure [
50] and corresponded to (100) crystal face, which showed the highest peak in Low-XRD.
As seen in
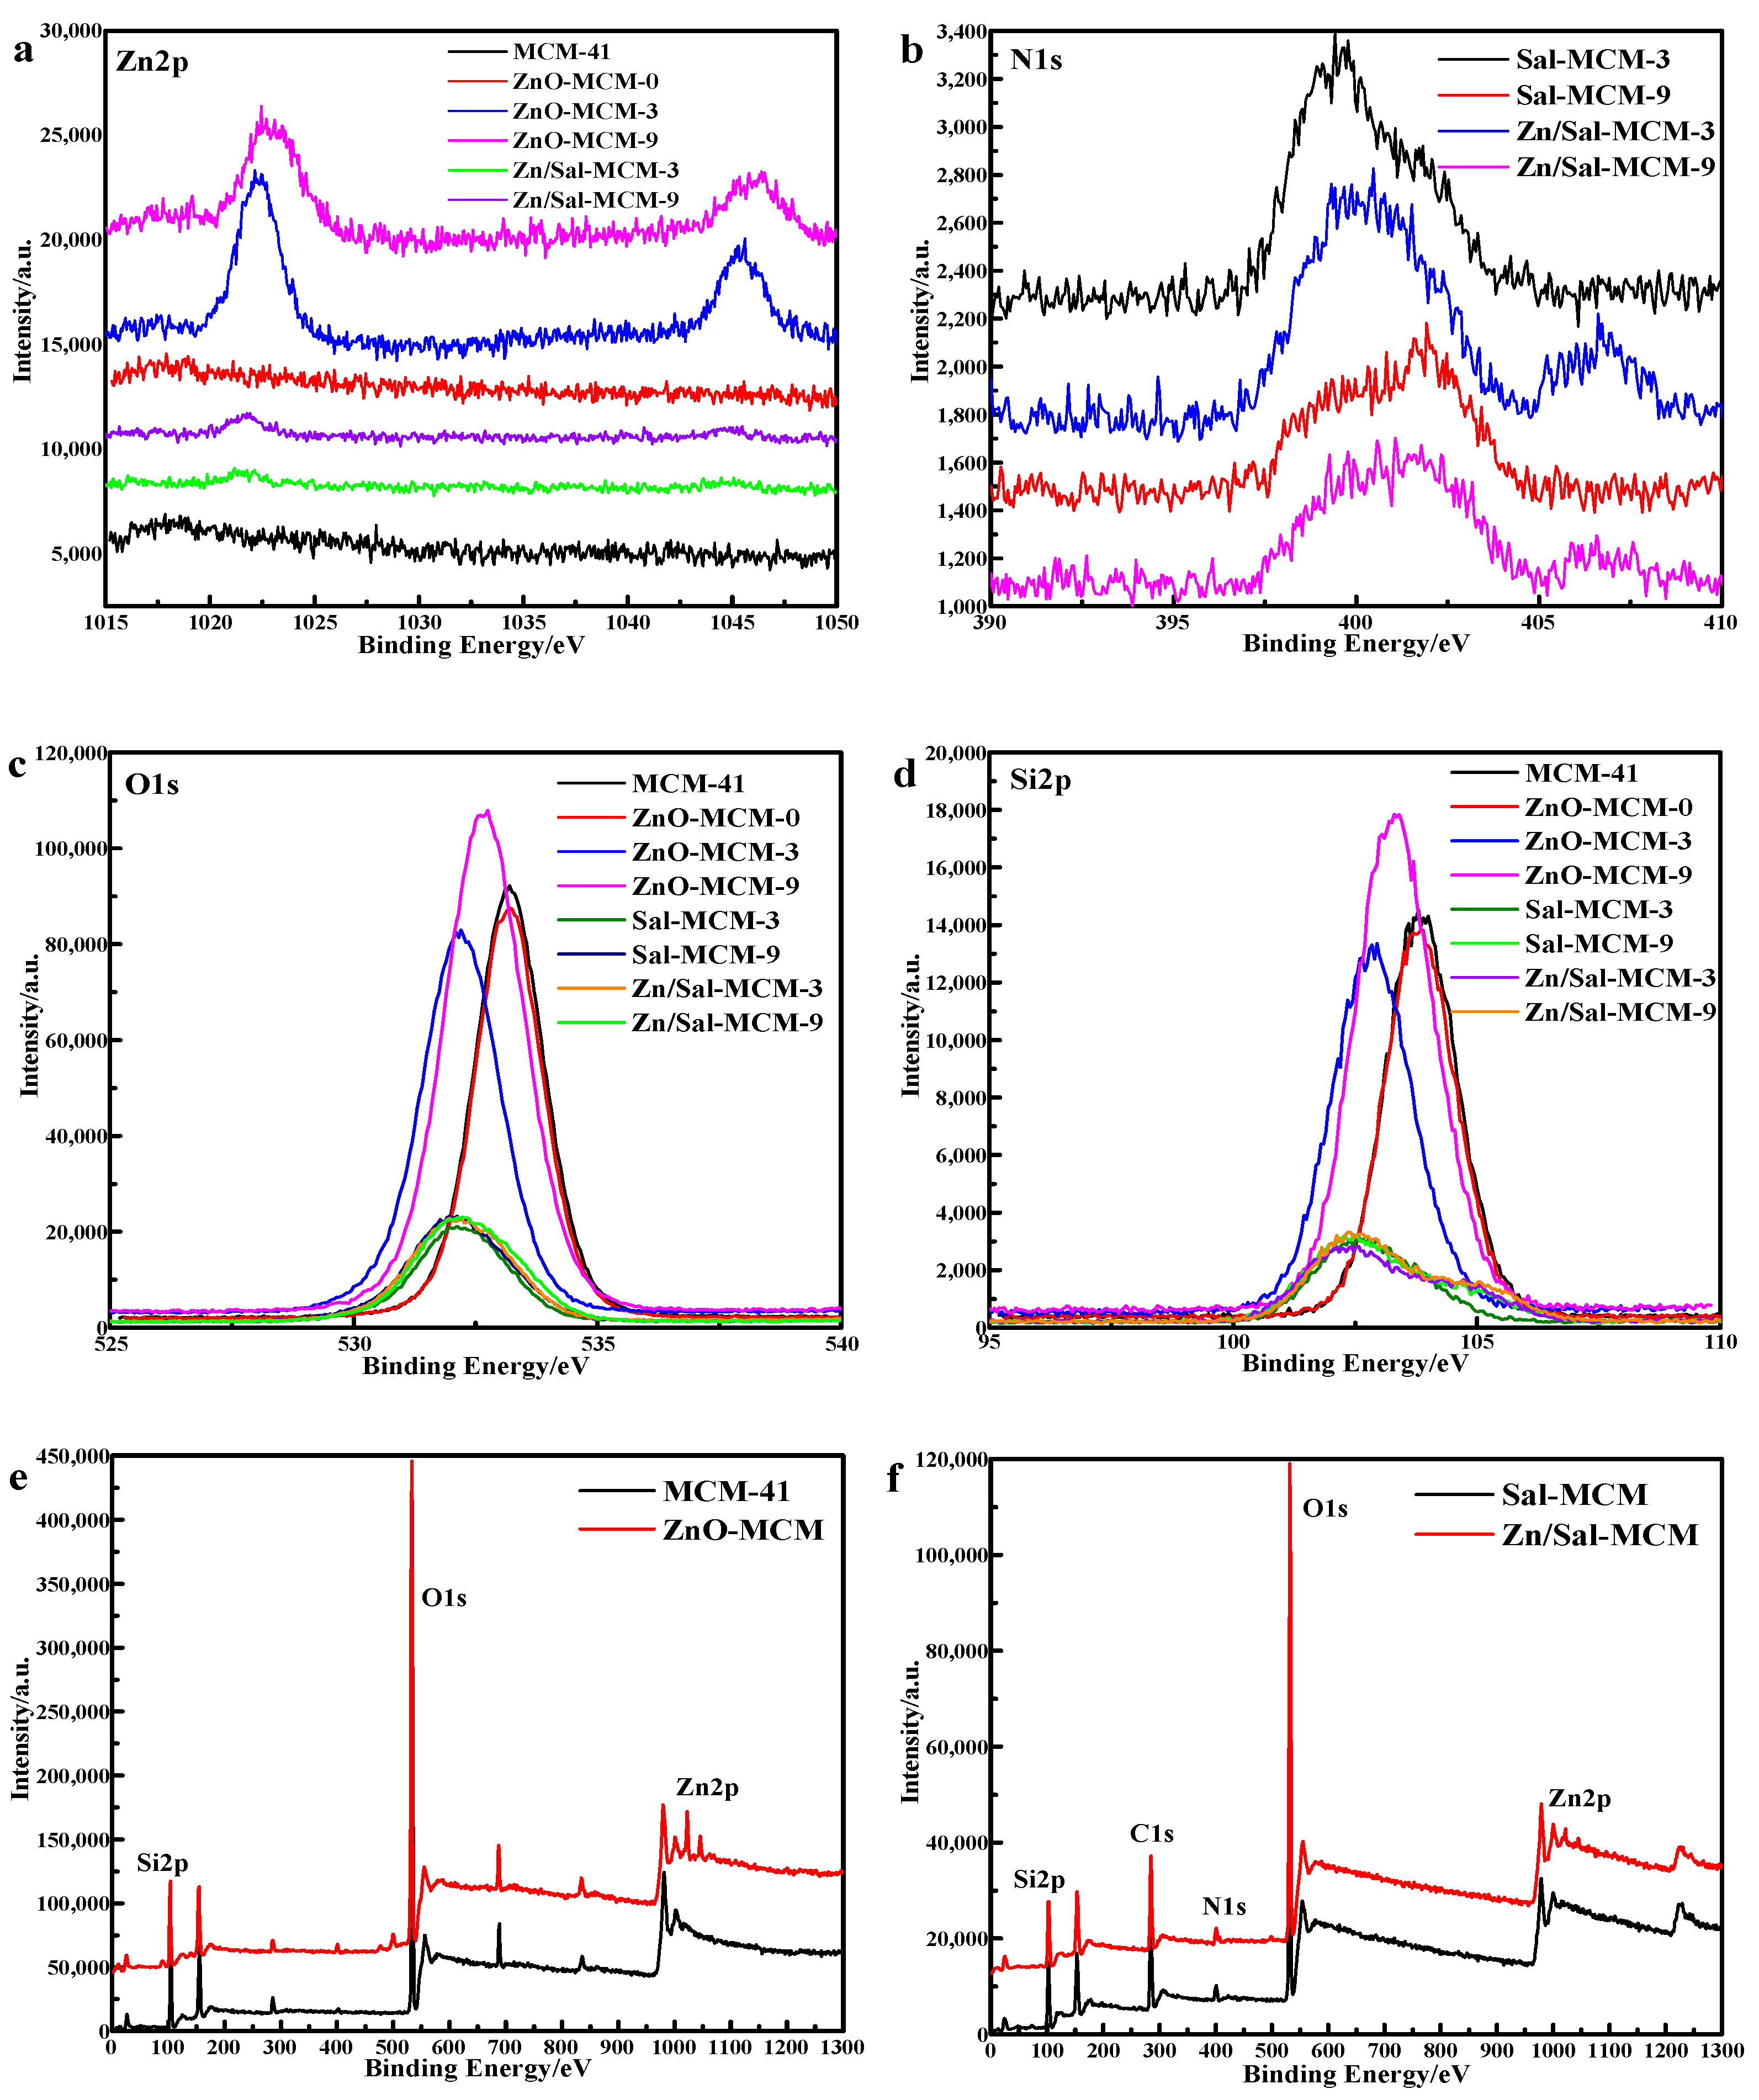
Figure 6, the XPS analysis was carried out to investigate the nanoparticle composition. In
Figure 6a, it was observed that the binding energy regions positioned at 1022 eV and 1045 eV were assigned to Zn 2p
3/2 and Zn 2p
1/2, respectively [
51], from the spectrum lines of both of the ZnO-MCM-3 and ZnO-MCM-9. Zn/Sal-MCM-3 and Zn/Sal-MCM-9 showed two peaks of Zn 2p at 1021 eV and 1044 eV, respectively, which means that the zinc ions were coordinated with salicylaldimine. After the formation of ZnO, the peak at 1044 eV of Zn 2p
1/2 was more obvious. Meanwhile, the peak at 1021 eV shifted positively to 1022 eV, due to the coordination bonds between zinc ions and salicylaldimine being replaced by the ionic bonds between the zinc atoms and oxygen atoms. On the one hand, the spectrum of ZnO-MCM-0 showed no special difference from that of MCM-41, while the spectrum lines of ZnO-MCM-3 and ZnO-MCM-9 were distinctly different from those of Sal-MCM-3 and Sal-MCM-9. On the other hand, for ZnO-MCM-0, its atomic concentration was 0.39, while ZnO-MCM-3 and ZnO-MCM-9 showed the atomic concentrations of 2.03 and 1.27, respectively (
Table 3). These results confirmed that the more ZnO was loaded on MCM-41, the more obvious the peaks would be. It could be concluded that the modification of salicylaldimine does help to catch more zinc ions due to its strong coordination function. From
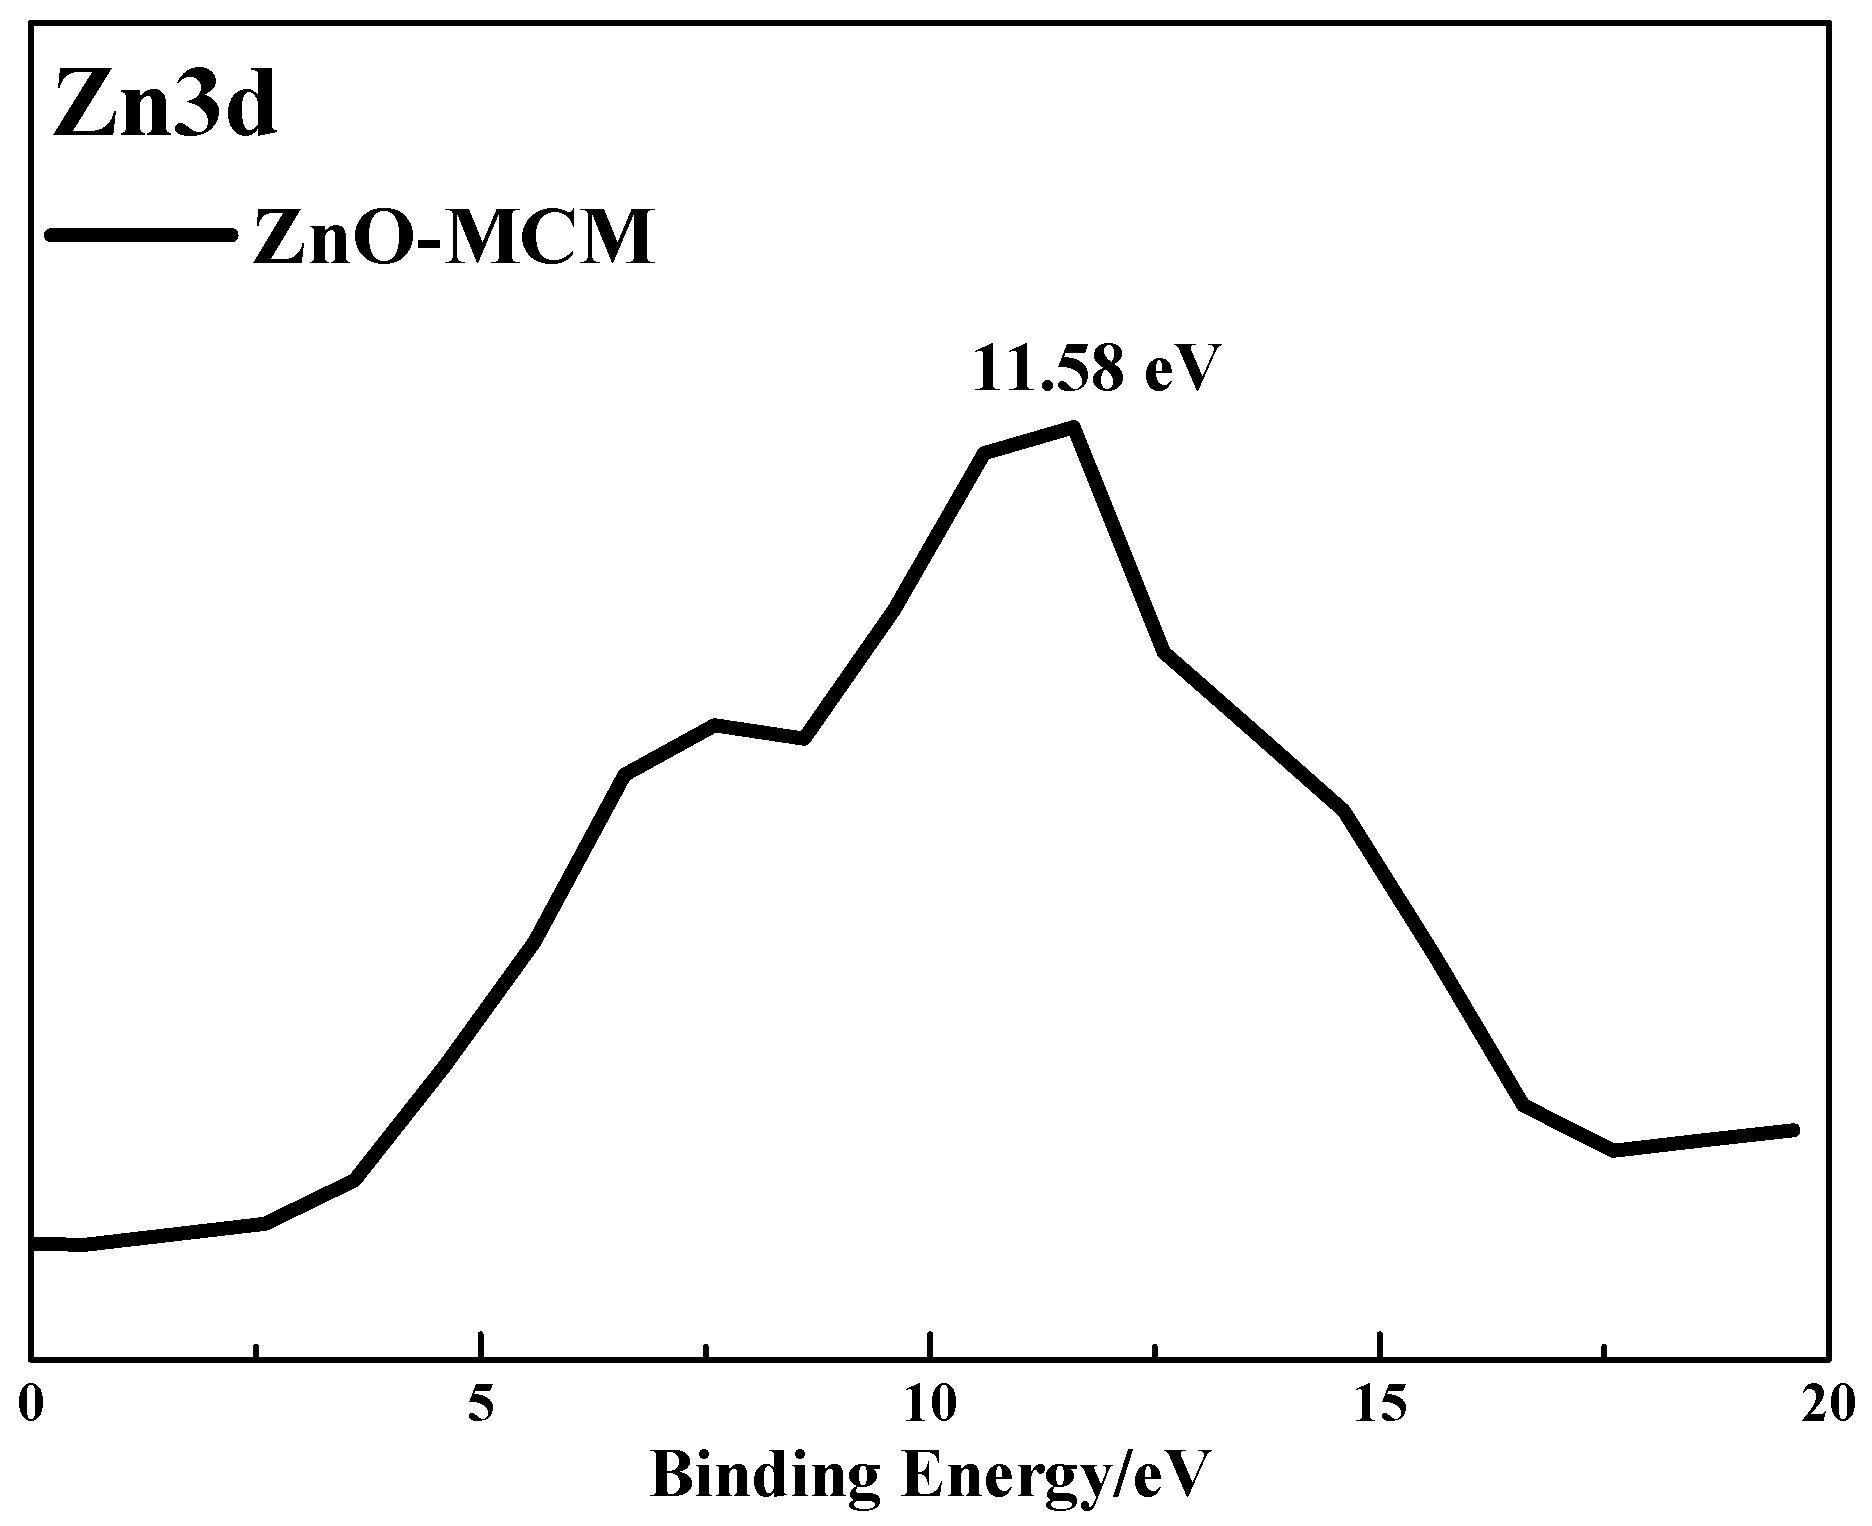
Figure 7, we also found that the binding energy of the Zn 3d electron in ZnO-MCM is 11.58 eV, 1.93 eV higher than that of pure ZnO, which indicates the formation of Si-O-Zn bond. This proved that, after the calcination, the interaction between ZnO and the silica matrix is the Si-O-Zn bond [
39].
Figure 6b exhibits the binding energy spectrum line of N 1s. A positive shift of Zn/Sal-MCM-3 was observed, which showed that the peak value of 399.44 eV moved to 400.14 eV. It was proposed that the electron transfer from nitrogen to zinc ions should be responsible for this result [
52]. It proved that the coordination between the salicylaldimine and zinc ions was successfully formed.
In
Figure 6c, all the binding energy peaks of O 1s were symmetrical, which was different from previous reports [
50] that indicated that only one chemical state for the oxygen species existed. For MCM-41, a peak centered at 533.19 eV was definitely from the result of the oxygen atoms of MCM-41. Those energy peaks of O 1s, excluding that of ZnO-MCM-0, took a negative shift in varying degrees after the modification of salicylaldimine or ZnO. This means that the modification of chemical groups or metal oxides would disturb the electron distribution of the surface of the vehicles. After the ZnO formed on the MCM-41, the electron intensity of O 1s also increased, when compared to those of Sal-MCM-3 and Sal-MCM-9. It could be suggested that the zinc ions were transformed into ZnO because during this process, oxygen atoms would combine with zinc atoms, resulting in the increase of intensity of O 1s. In
Figure 6d, the same change trend was also observed from the binding energy spectrum of Si 2p, which could also be attributed to the similar reason. The overall XPS spectrum of MCM-41, ZnO-MCM, Sal-MCM, and Zn/Sal-MCM are shown in
Figure 6e,f. All of the spectrum results confirmed that ZnO was successfully loaded onto MCM-41.
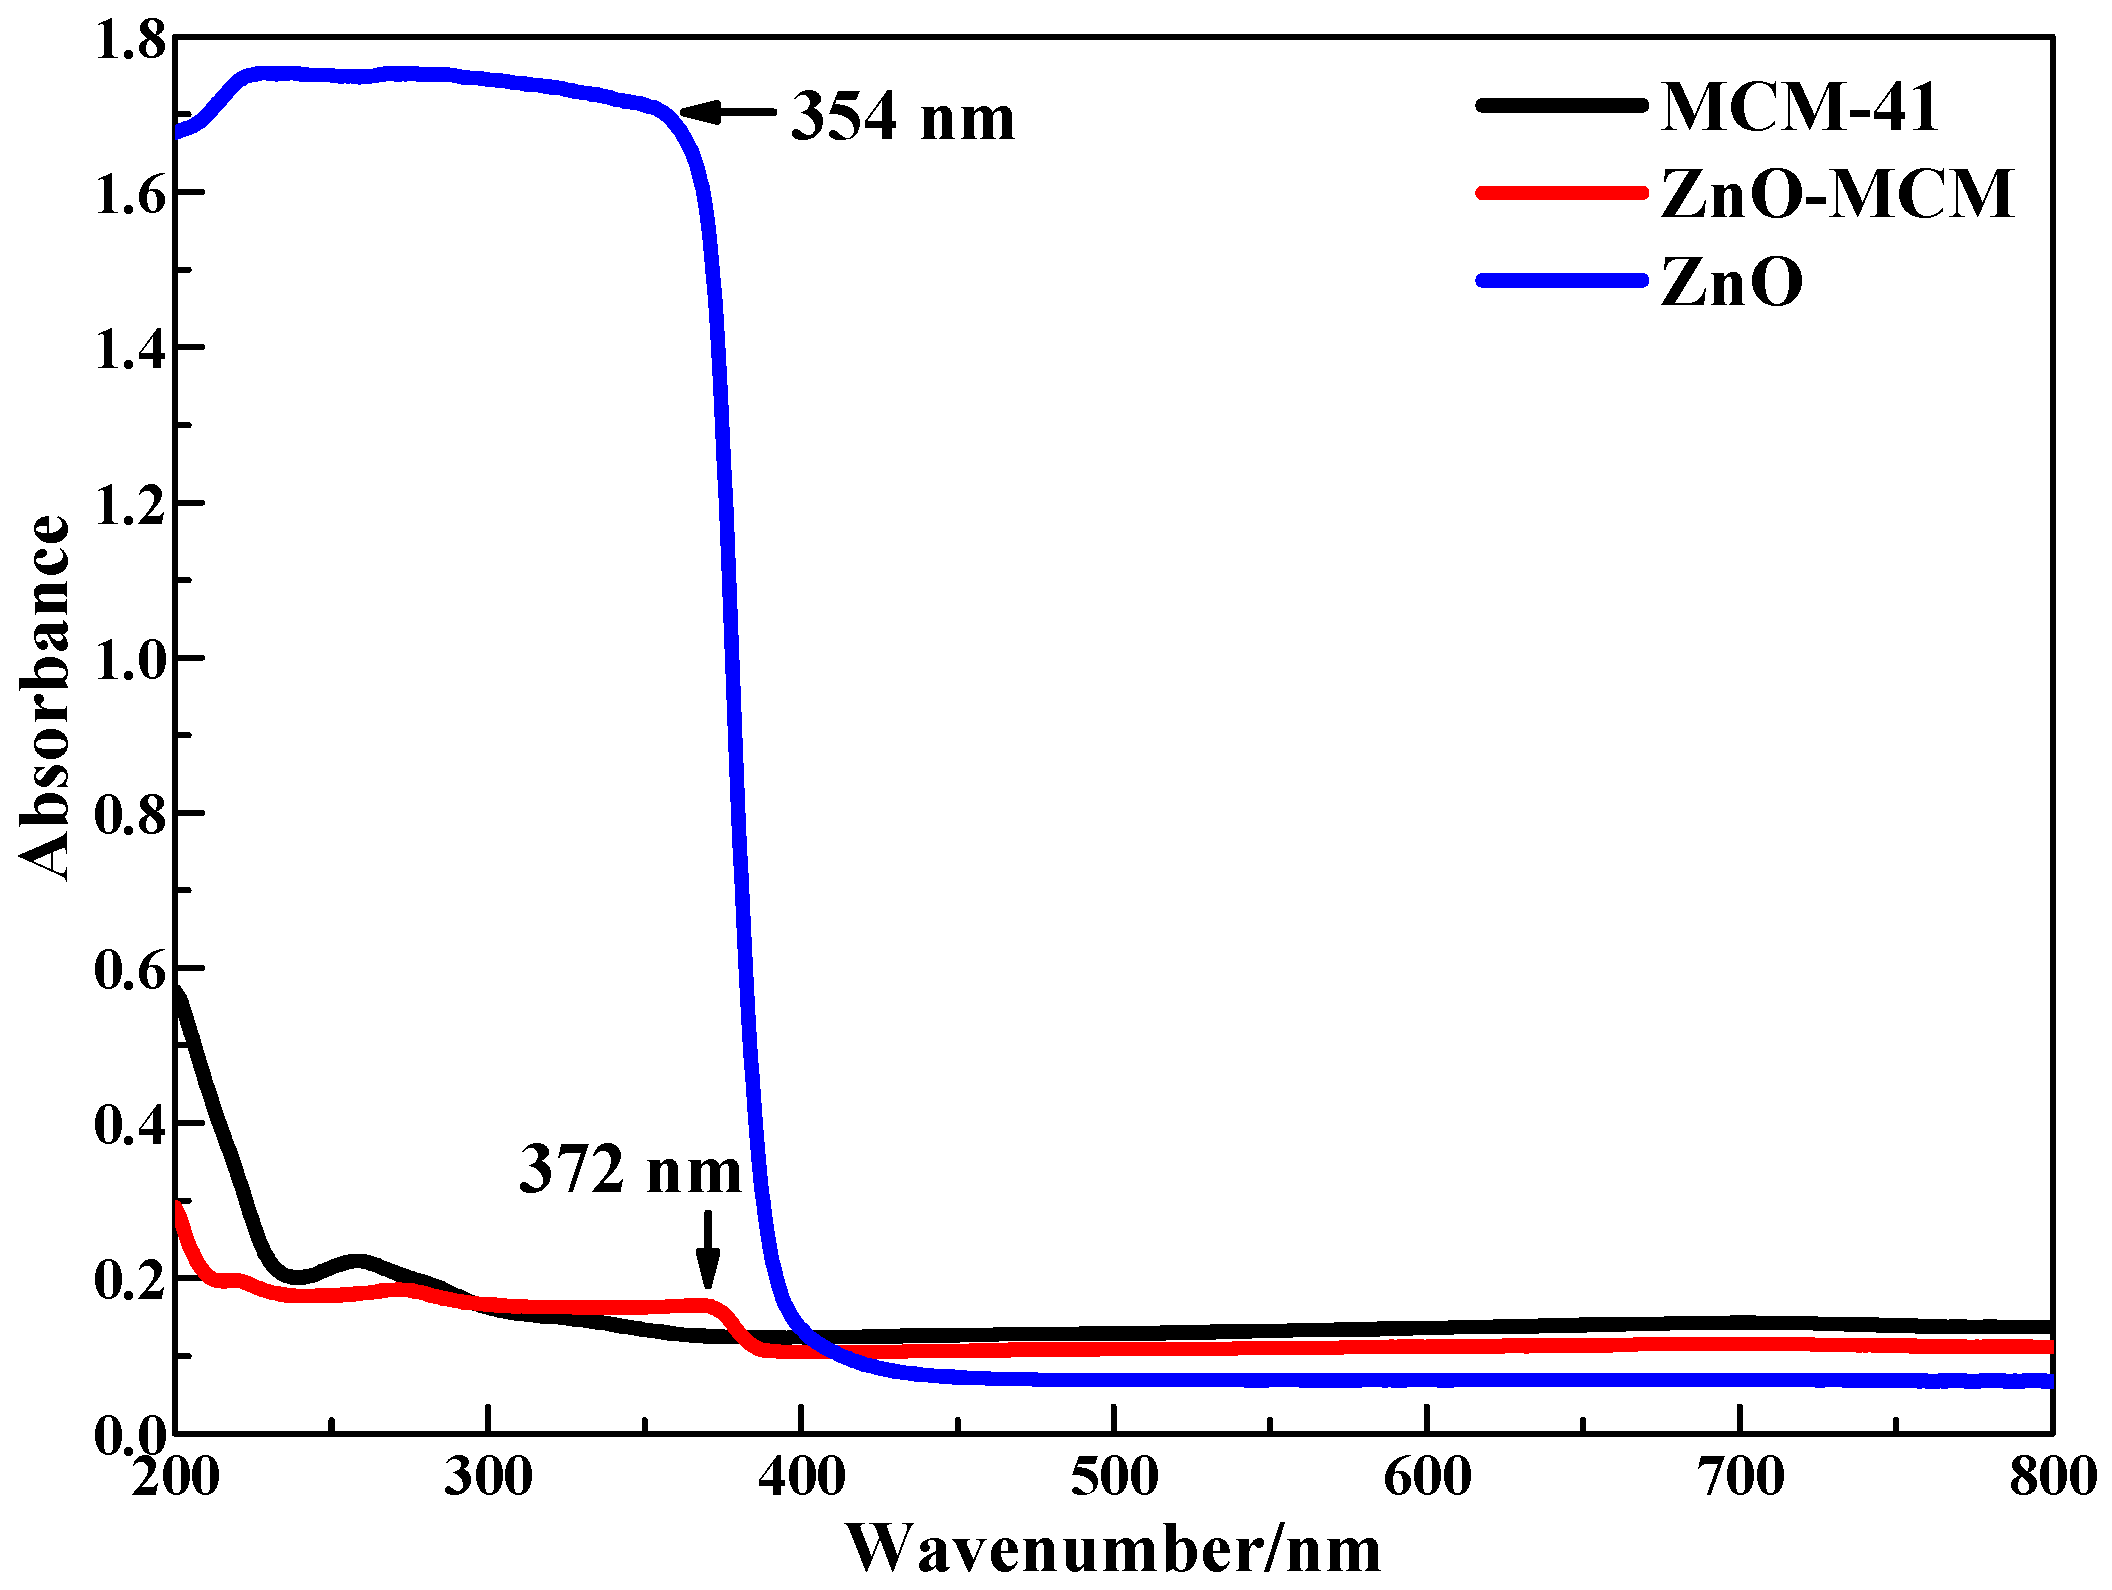
The UV-vis DRS of the nano-zinc oxide, mesoporous silica, and ZnO-MCM samples are shown in
Figure 8. The adsorption band edge at 372 nm for ZnO-MCM suggests the presence of ZnO particles [
6]. Compared with ZnO, a red shift of the adsorption band edge was observed, which can be ascribed to the well-known quantum size effect [
53]. The wide absorption band from 250 to 372 nm observed in the ZnO-MCM sample might be due to the formation of one-dimensional array inside the mesoporous silica, which is expected for these types of crystal growth [
39]. Based on the maximum absorption wavelength, the band gap of ZnO nanoparticles supported on mesoporous silica was calculated to be 3.33 eV according to the relation
Ebg = 1240/λ
max, while the band gap of pure nano-zinc oxide was 3.50 eV [
54]. This means that the photocatalytic performance of ZnO was improved by being supported on mesoporous silica.
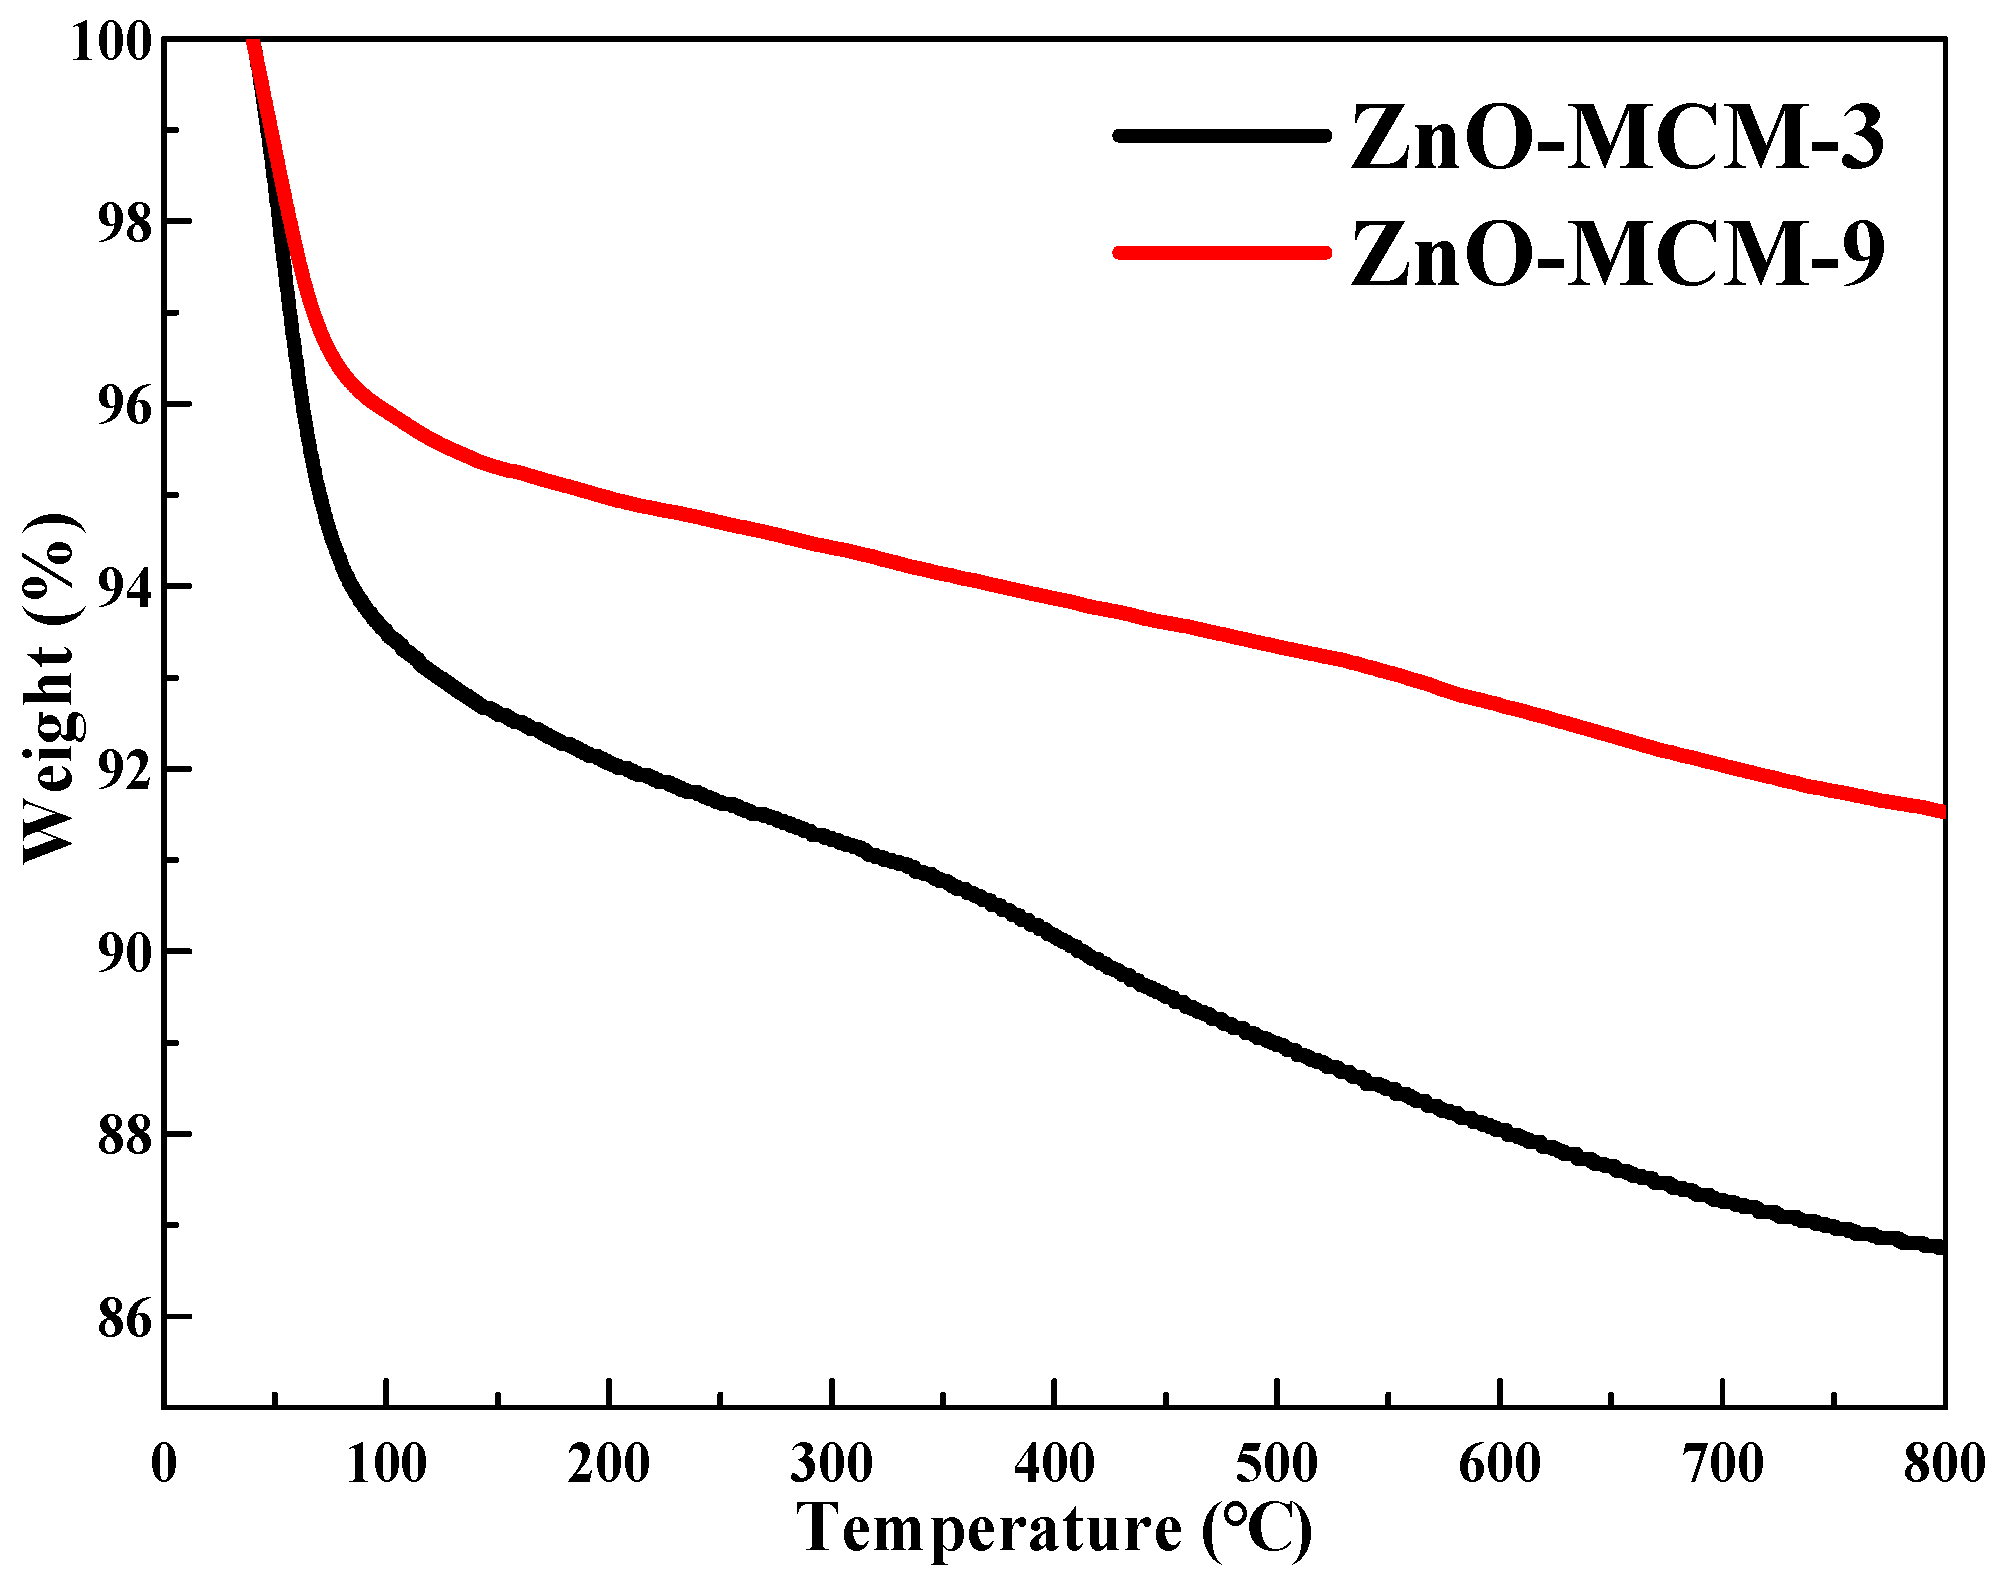
As shown in
Figure 9, ZnO-MCM-3 and ZnO-MCM-9 were subjected to TGA to obtain the thermal stability information. For both ZnO-MCM-3 and ZnO-MCM-9, the loss in mass from 40 °C to 100 °C was due to the elimination of the crystallization water and residual physically adsorbed water on the surface of the channels [
55]. The final residues of ZnO-MCM-3 and ZnO-MCM-9 were 86% and 91%, respectively, which showed that there were more nano zinc oxides supported on ZnO-MCM-3 than that of ZnO-MCM-9. It also proved that the more salicylaldimine was grafted on MCM-41, the more zinc ions would be coordinated and thus, more nano zinc oxides would form. According to the previous literature [
56], the ZnO transformed into Zn
2SiO
4 began from 650 to 800 °C due to the reaction between ZnO and SiO
2. However, in this work, the TG curves did not show an obvious sudden heat loss step at this temperature range and only a slow loss of weight during 100 to 800 °C was observed. It is supposed that the transformation of this material began at 100 °C and only a fraction of ZnO transform. Further research on this phenomenon will be undertaken in our future work.


