
Gd-Si Oxide Nanoparticles as Contrast Agents in Magnetic Resonance Imaging


 ,
,
Abstract
:1. Introduction
2. Results and Discussion
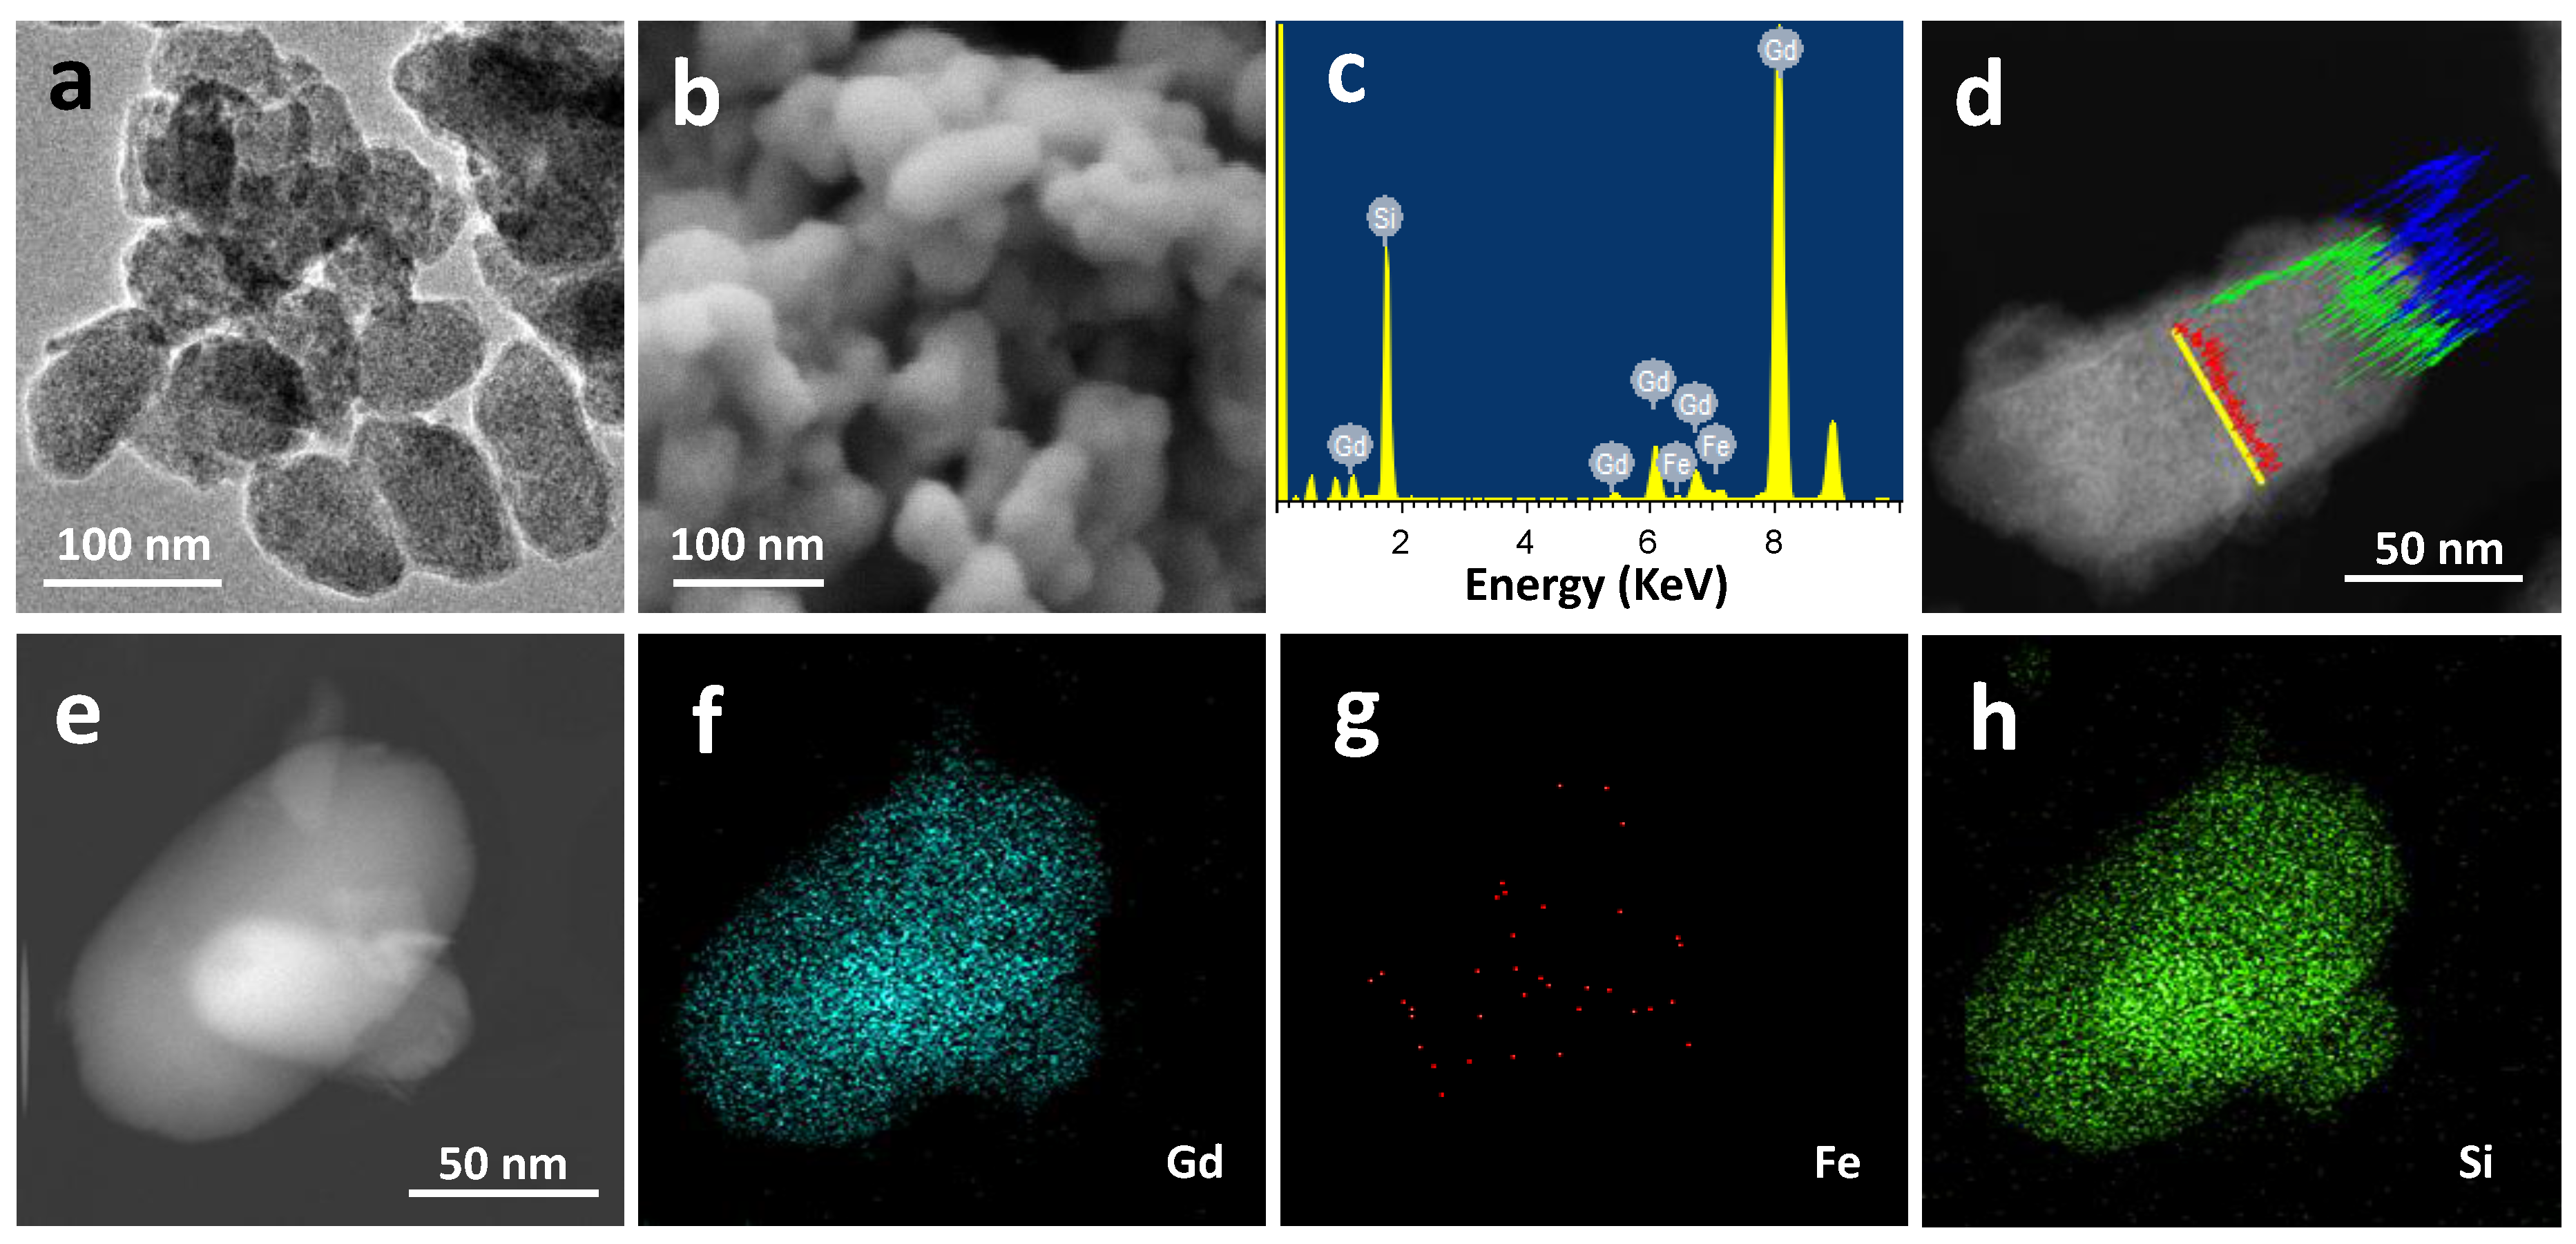
2.1. Materials Preparation and Characterization
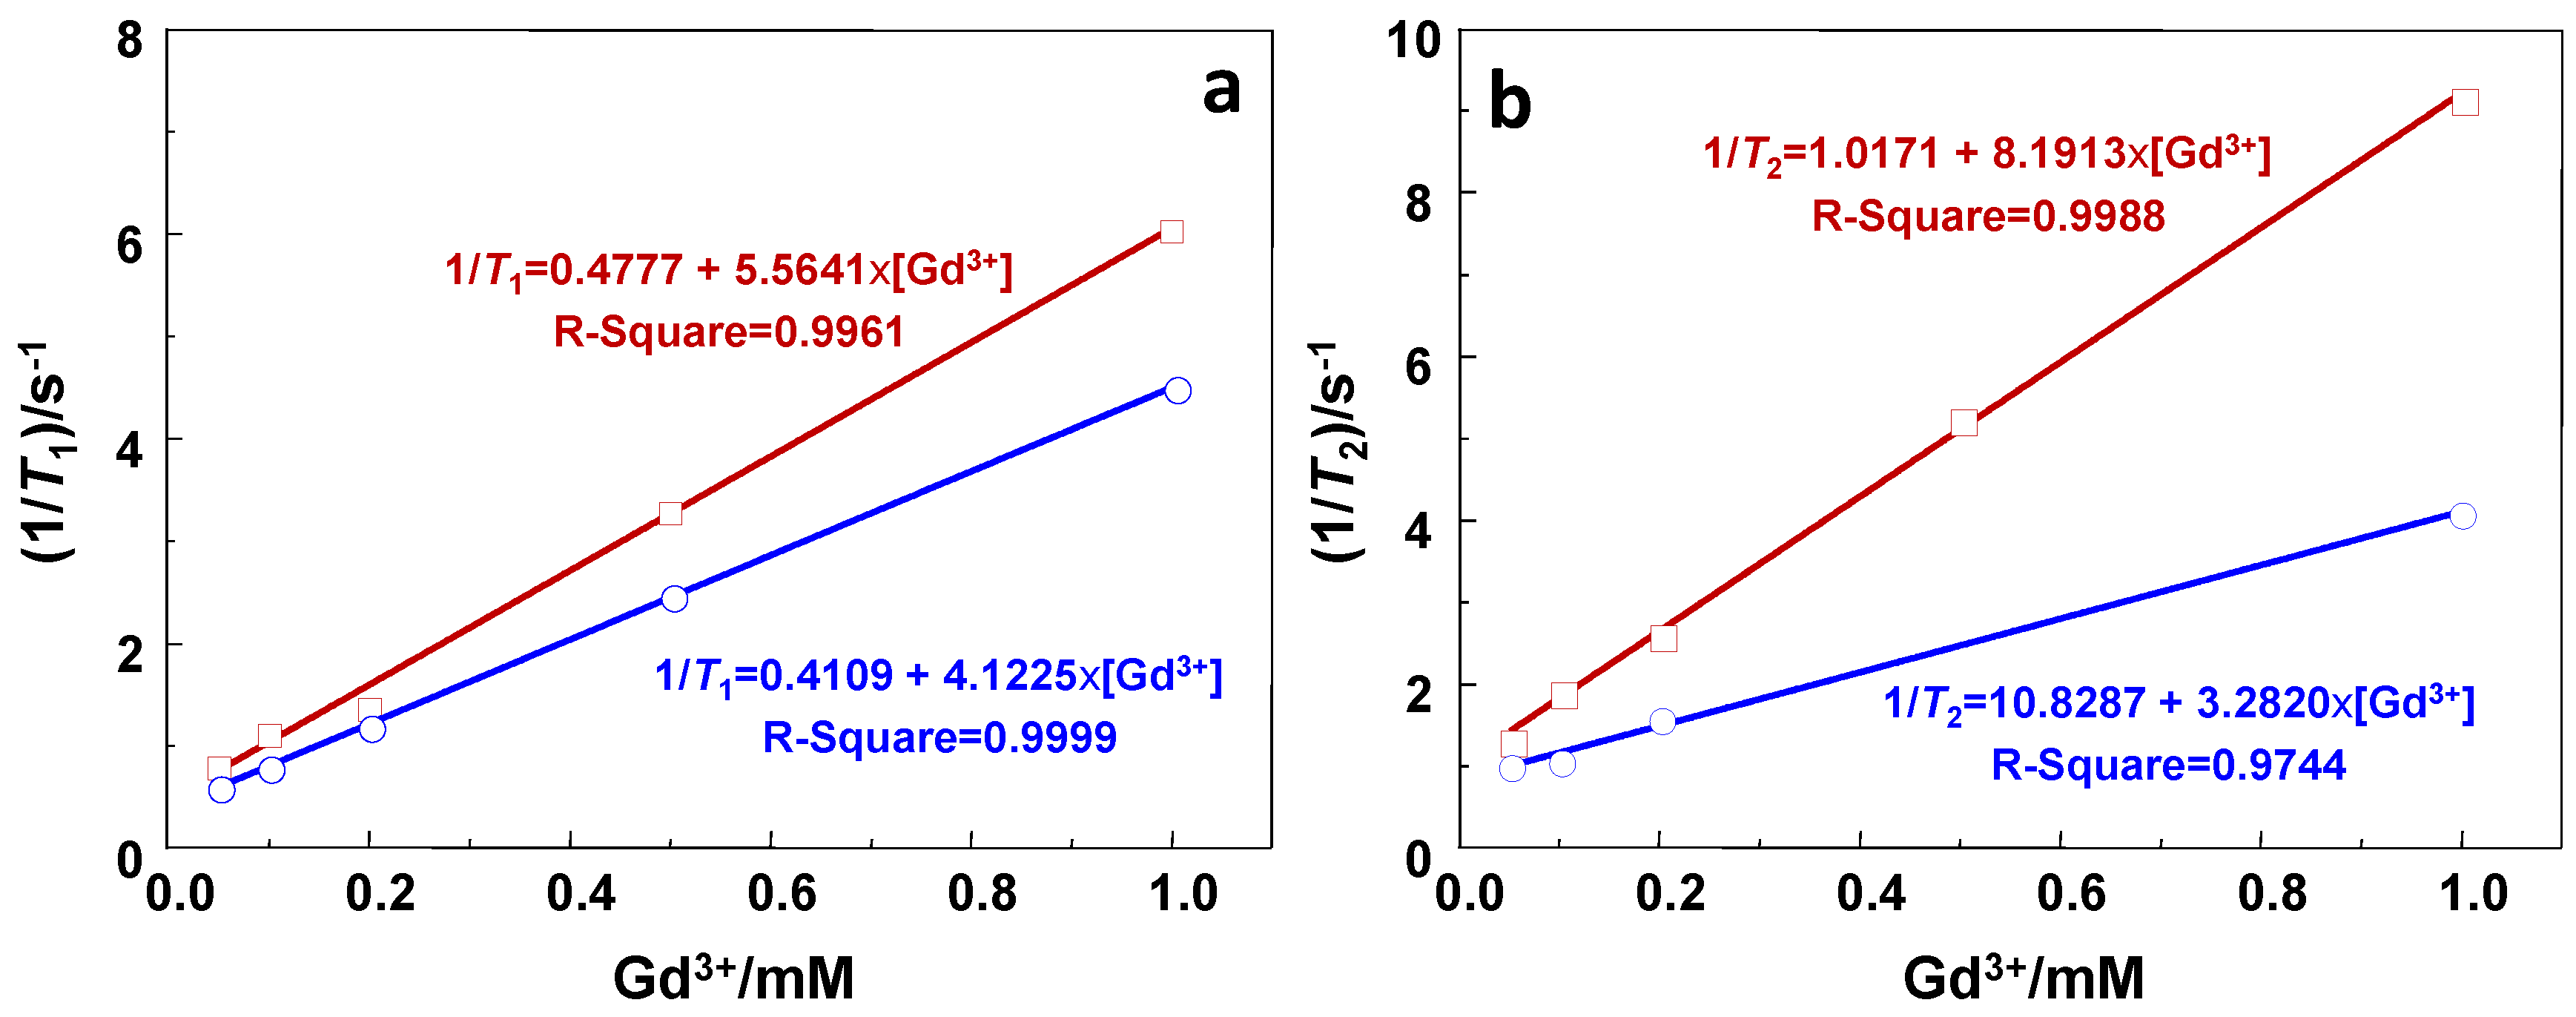
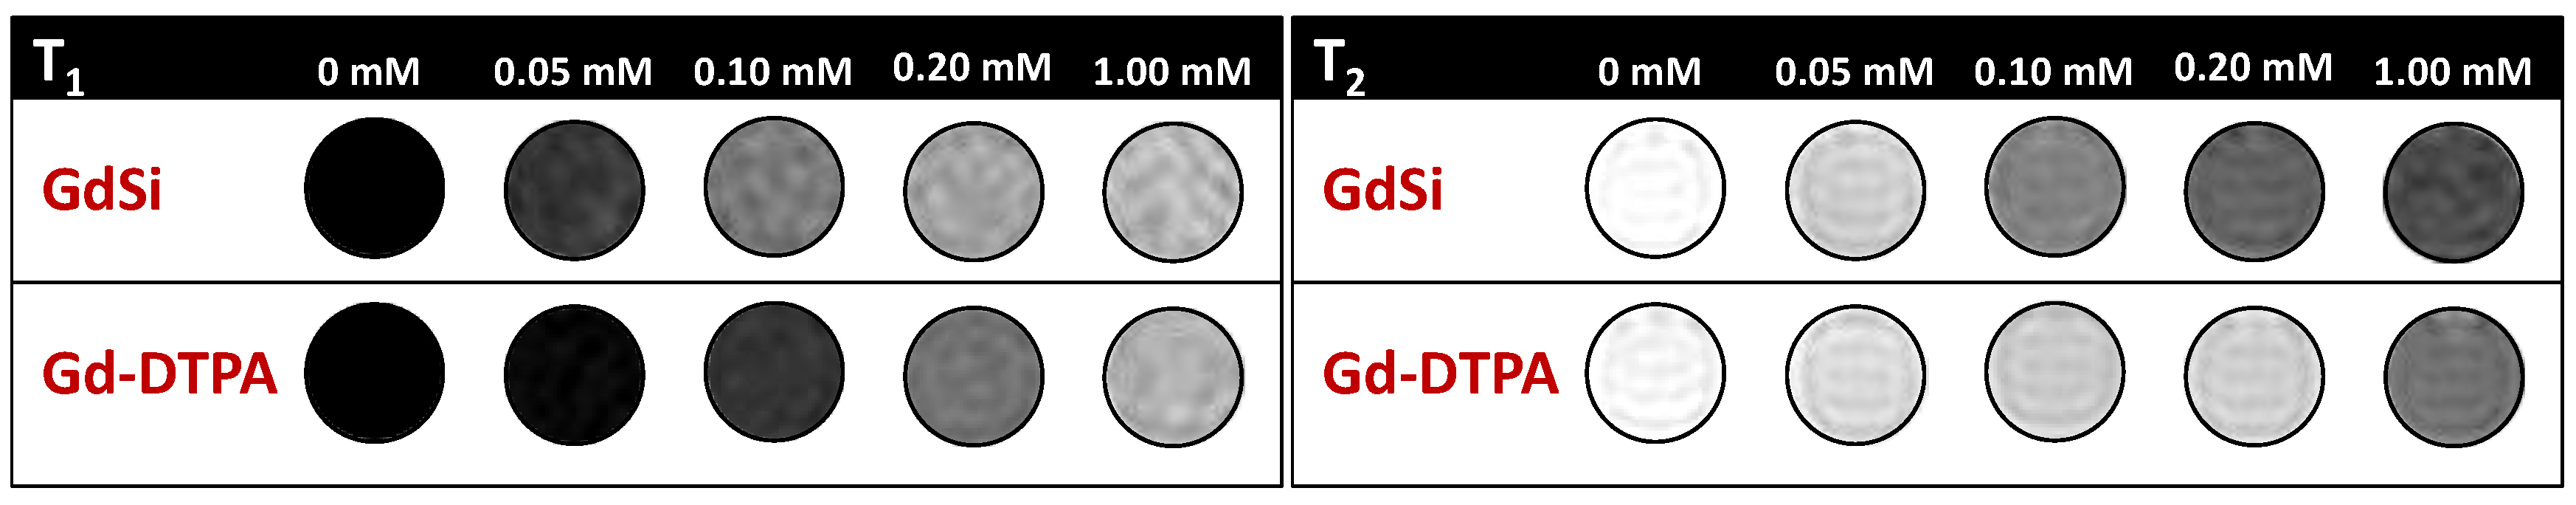
2.2. Relaxivity Measurements and In Vitro MRI
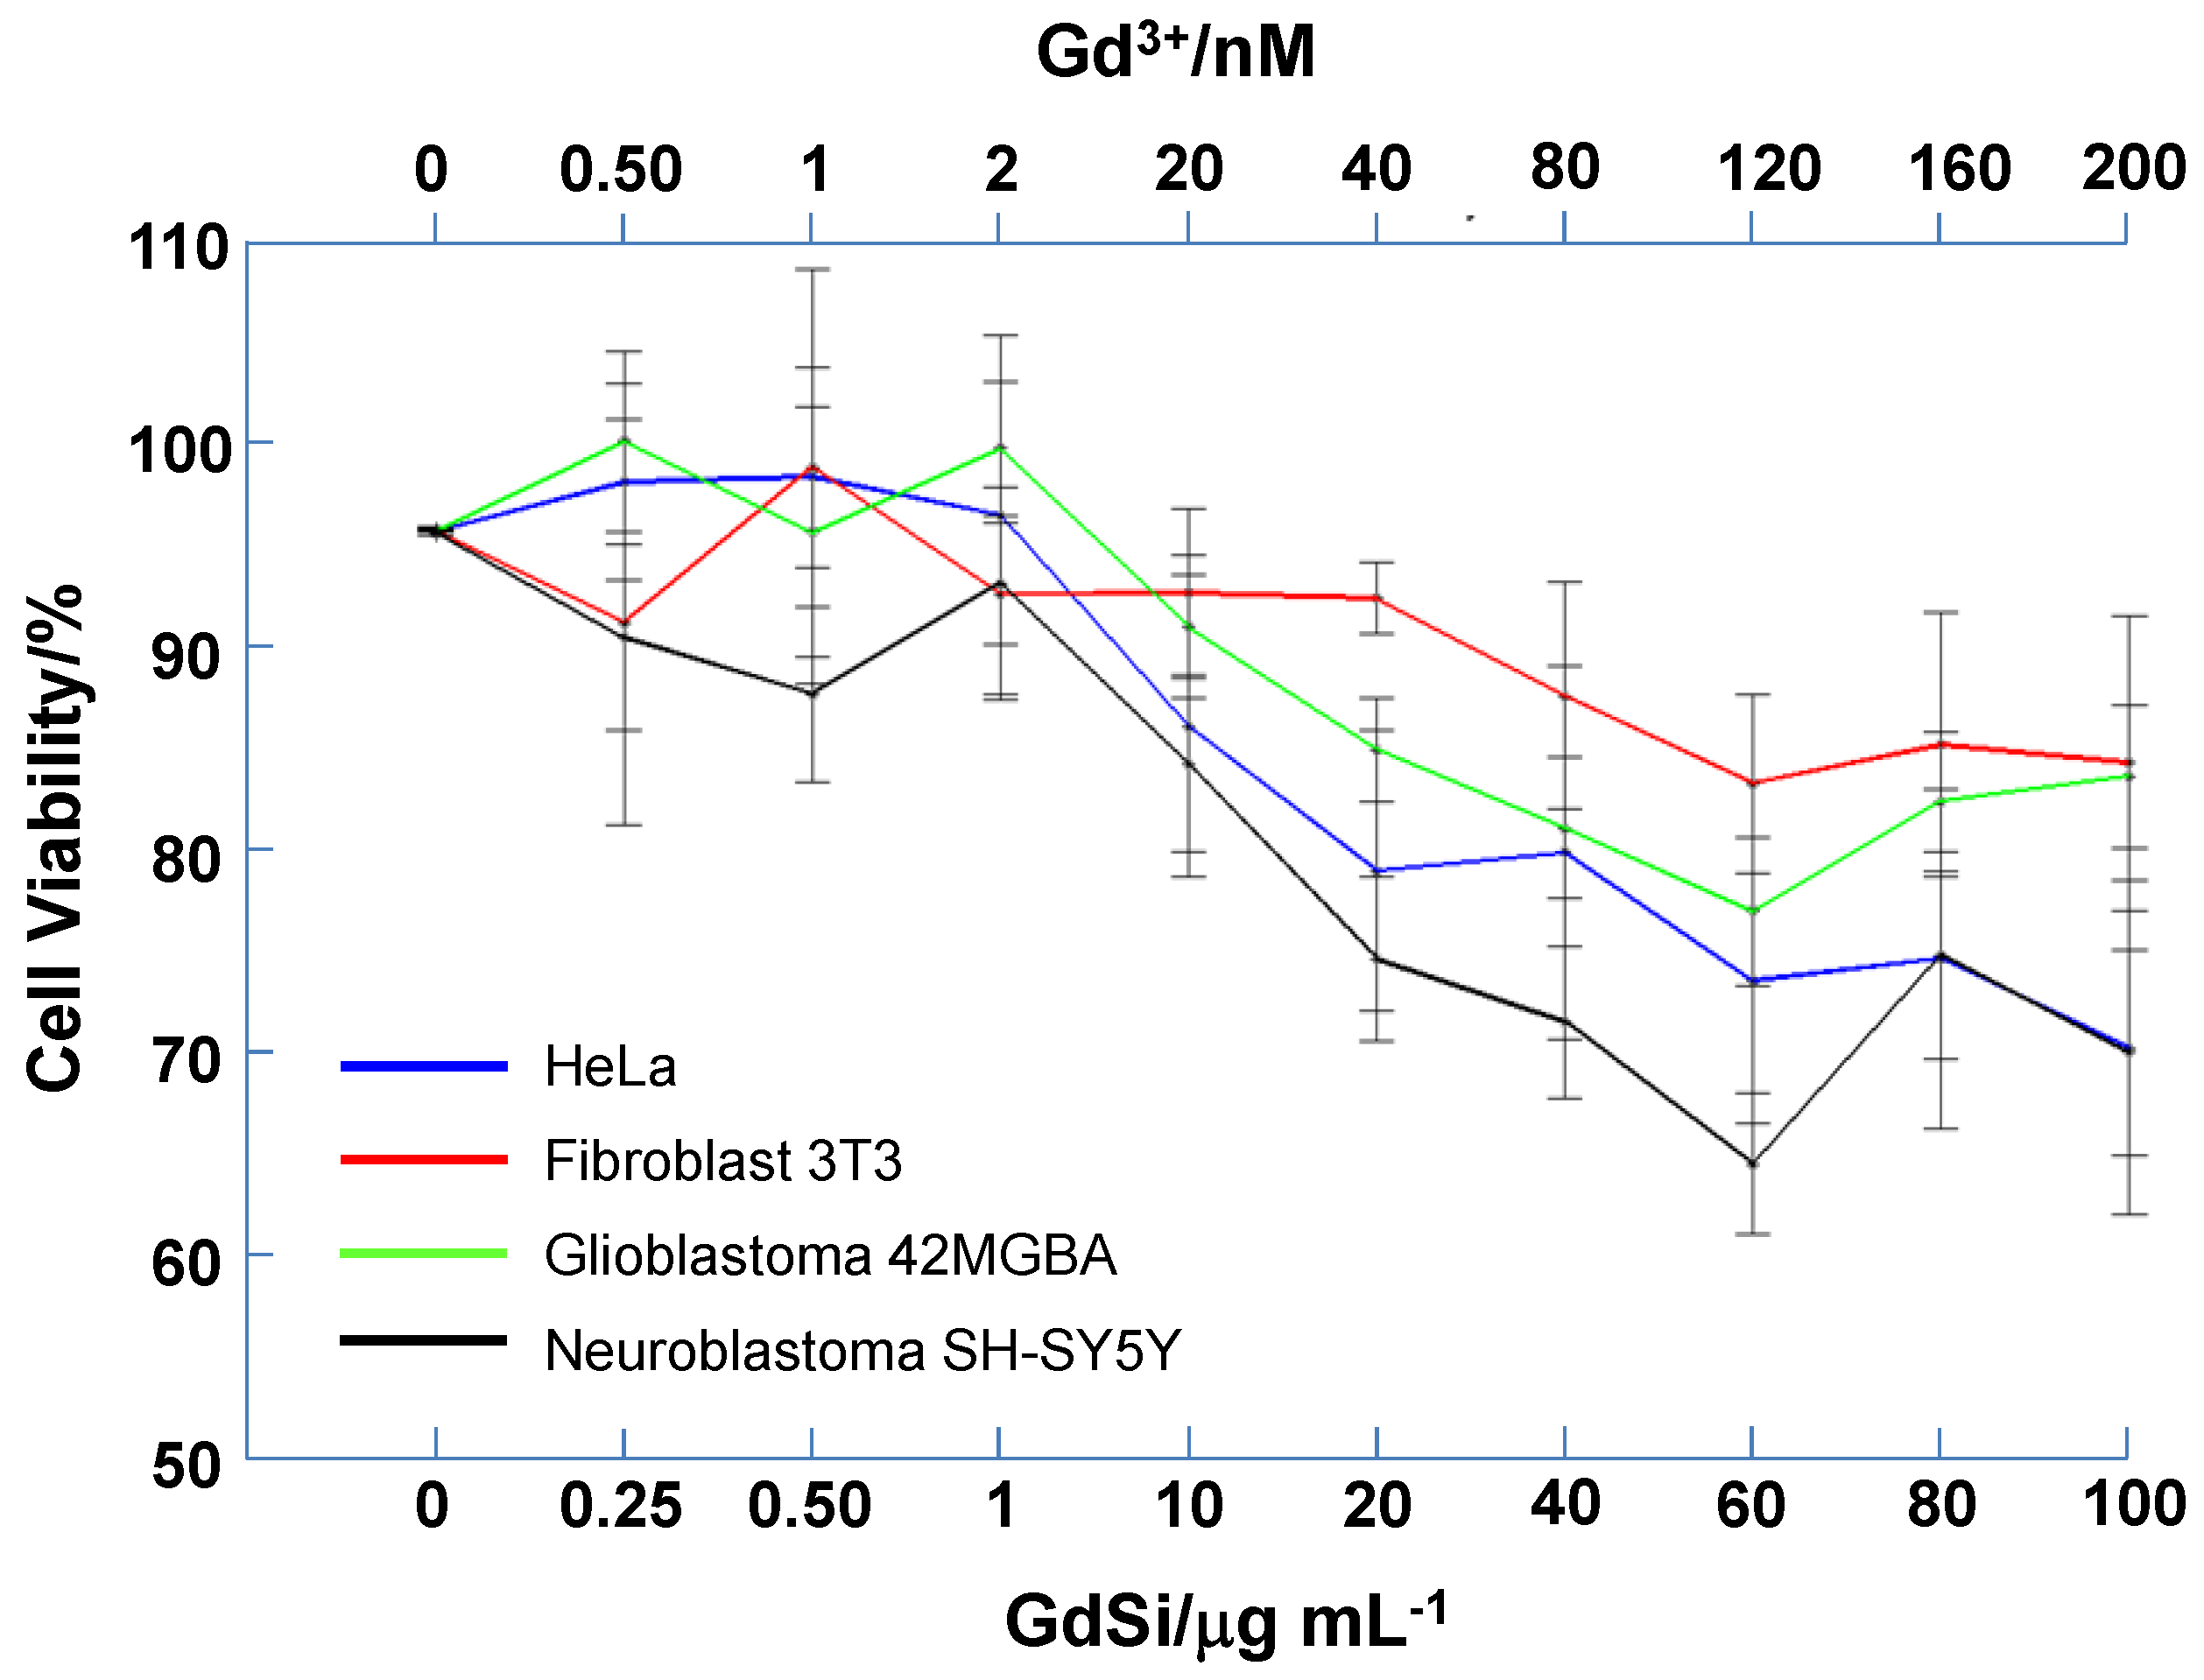
2.3. Cytotoxicity Test
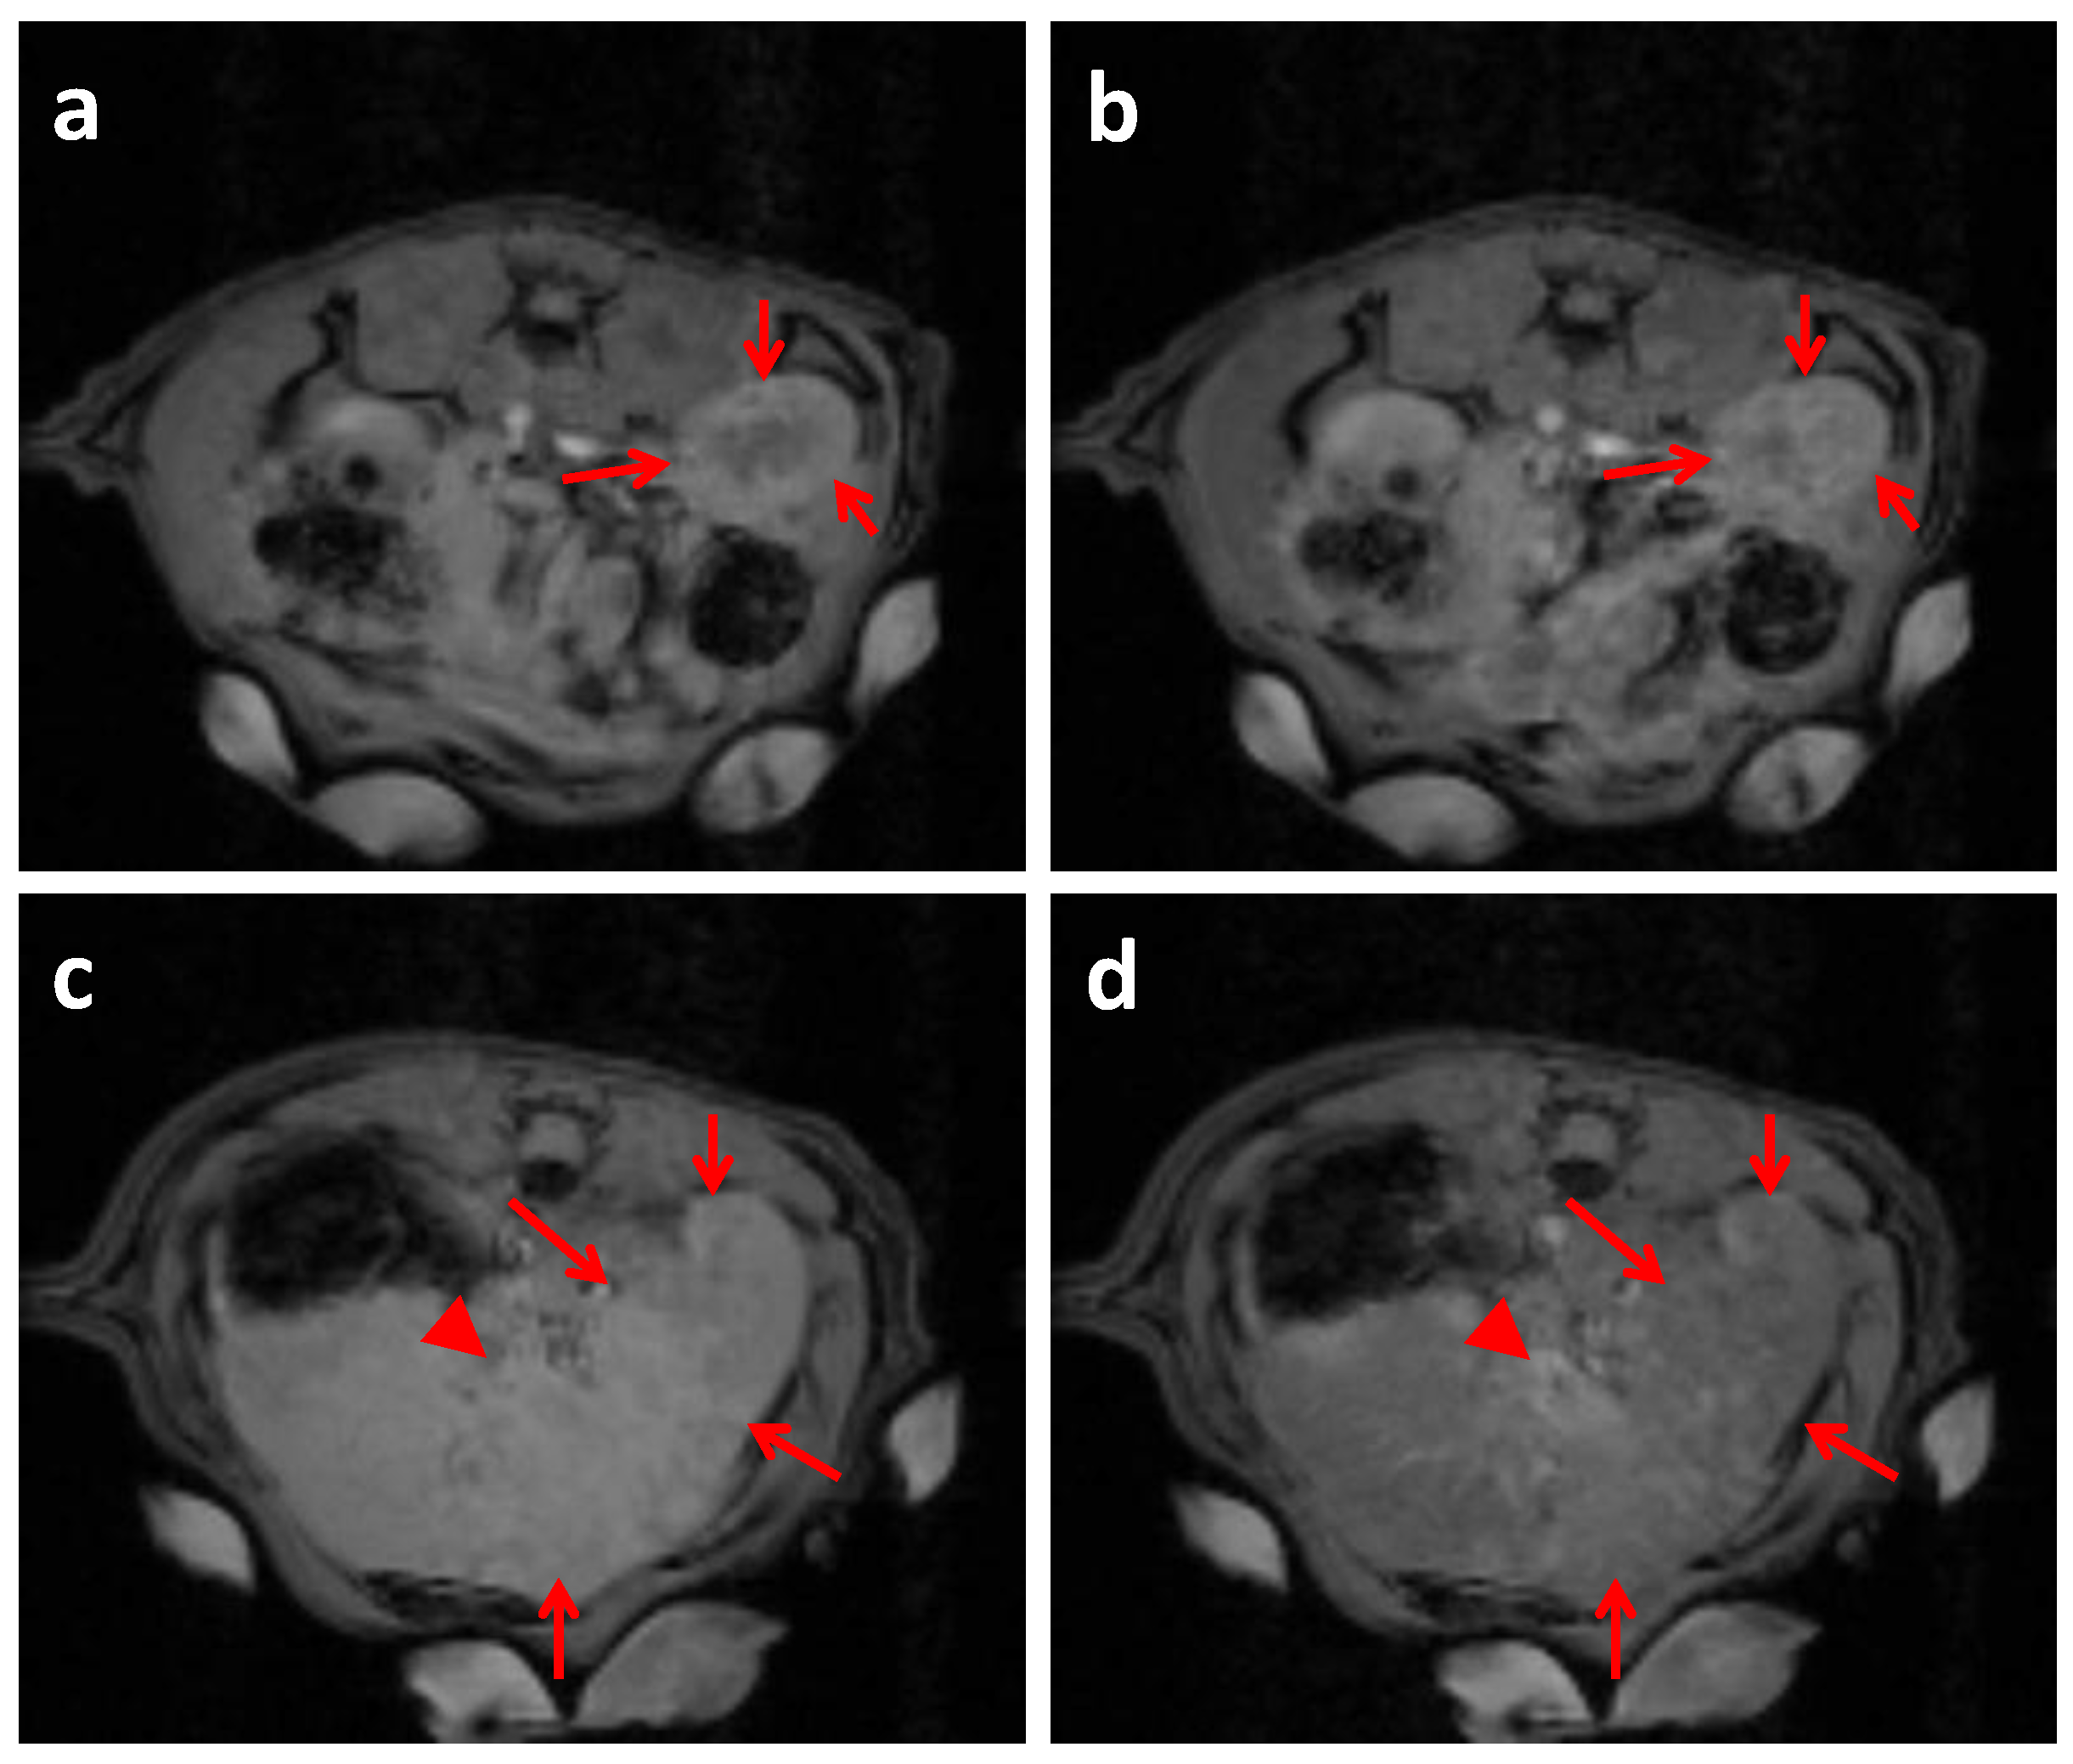
2.4. In Vivo MRI Studies Imaging
3. Experimental Section
3.1. Materials
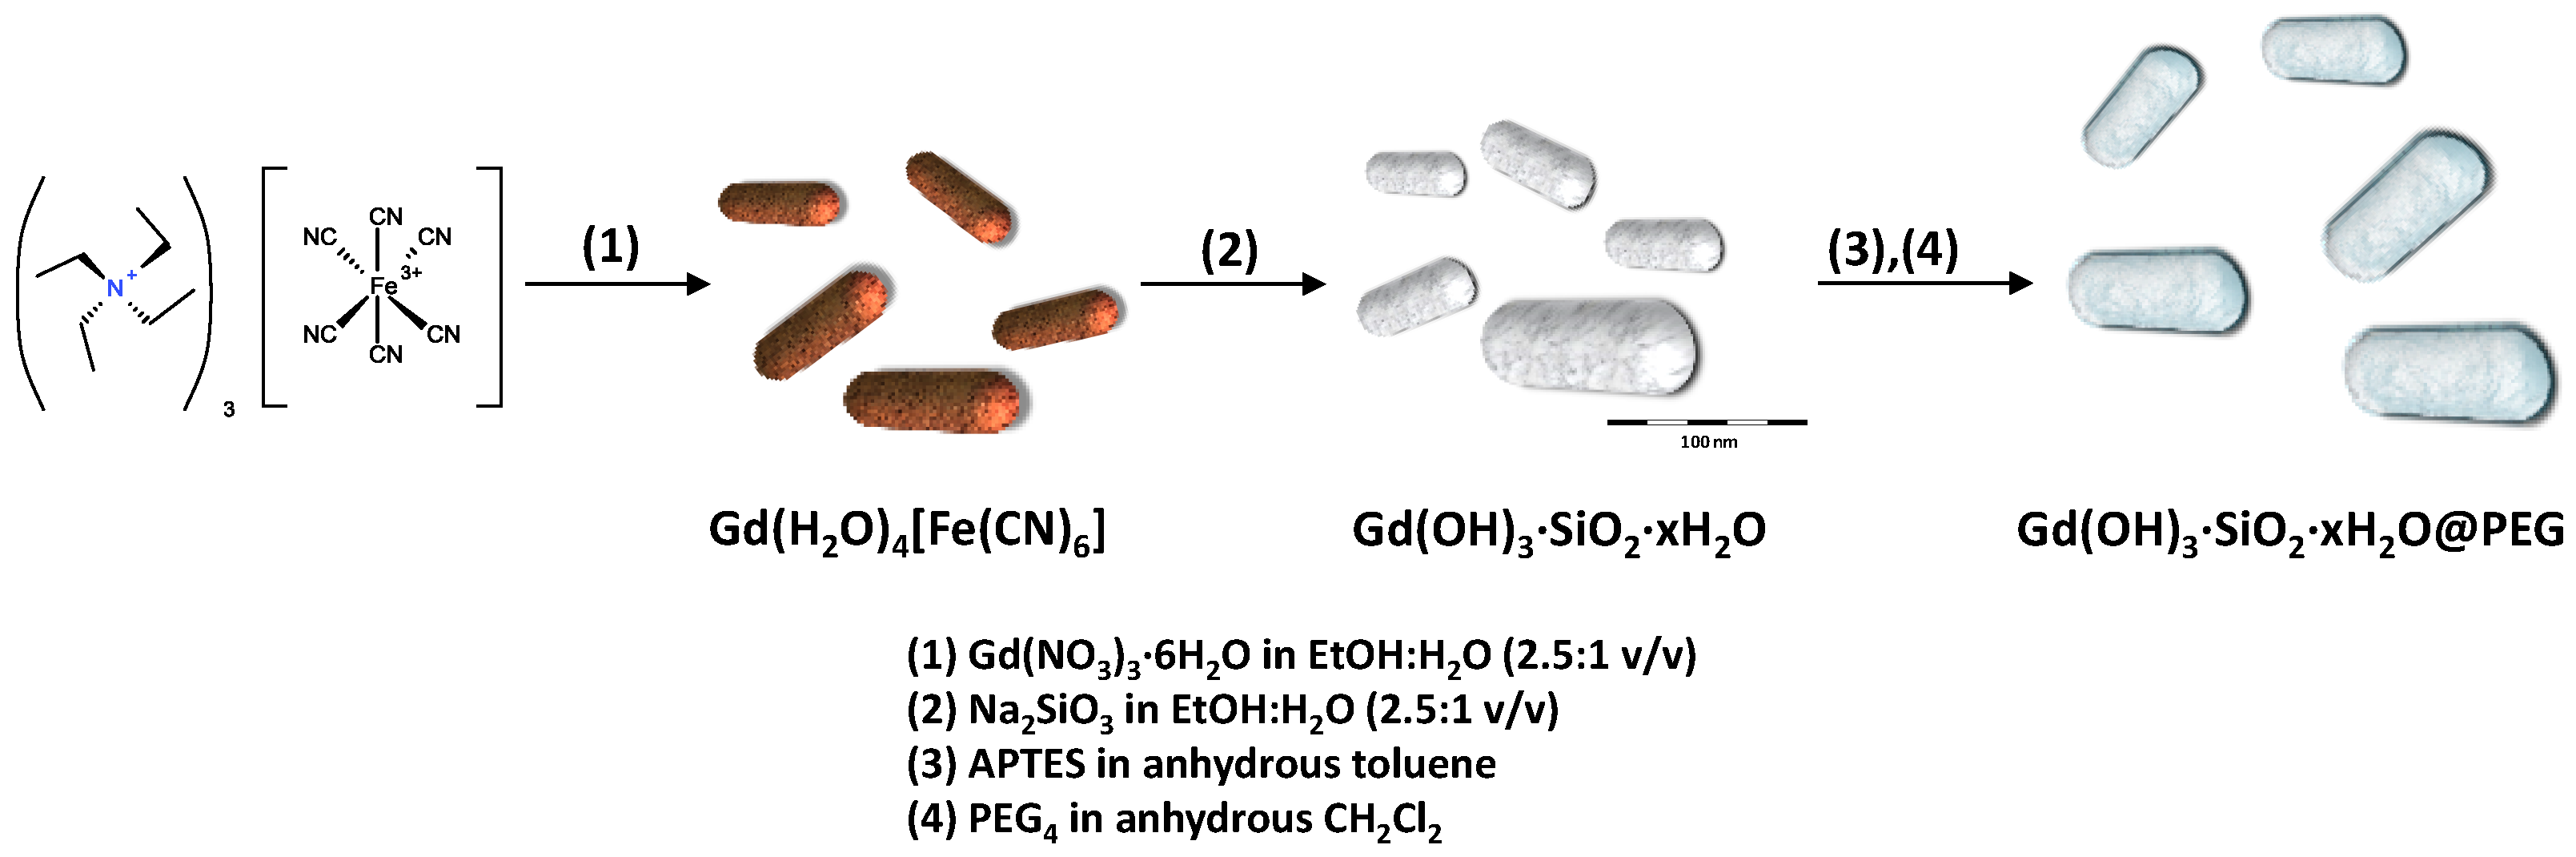
3.2. Synthesis of Gd(H2O)4[Fe(CN)6]
3.3. Synthesis of GdSi Oxide/hydroxide Nanocomposite
3.4. Materials Characterization
3.5. Stability Assays
3.6. Cell Biocompatibility
3.7. 1H NMR Relaxometry Study and In Vitro MRI.
3.8. In Vivo MRI Studies Imaging
4. Conclusions
Acknowledgments
Author Contributions
Conflicts of Interest
References
- Bolan, P.J.; Nelson, M.T.; Yee, D.; Garwood, M. Imaging in breast cancer: Magnetic resonance spectroscopy. Breast Cancer Res. 2005, 7, 149–152. [Google Scholar] [CrossRef] [PubMed] [Green Version]
- Mitchell, R.E.; Katz, M.H.; McKiernan, J.M.; Benson, M.C. The evaluation and staging of clinically localized prostate cancer. Nat. Rev. Urol. 2005, 2, 356–357. [Google Scholar] [CrossRef] [PubMed]
- Zakaria, R.; Das, K.; Bhojak, M.; Radon, M.; Walker, C.; Jenkinson, M.D. The role of magnetic resonance imaging in the management of brain metastases: diagnosis to prognosis. Cancer Imaging 2014, 14. [Google Scholar] [CrossRef]
- Cheng, W.; Ping, Y.; Zhang, Y.; Chuang, K.H.; Liu, Y. Magnetic resonance imaging (MRI) contrast agents for tumor diagnosis. J. Healthc. Eng. 2013, 4, 23–45. [Google Scholar] [CrossRef] [PubMed]
- Hu, F.; Joshi, H.M.; Dravid, V.P.; Meade, T.J. High-performance nanostructured MR contrast probes. Nanoscale 2010, 2, 1884–1891. [Google Scholar] [CrossRef] [PubMed]
- Davis, M.E.; Chen, Z.G.; Shin, D.M. Nanoparticle therapeutics: an emerging treatment modality for cancer. Nat. Rev. Drug Discovery 2008, 7, 771–782. [Google Scholar] [CrossRef] [PubMed]
- Lee, N.; Hyeon, T. Designed synthesis of uniformly sized iron oxide nanoparticles for efficient magnetic resonance imaging contrast agents. Chem. Soc. Rev. 2012, 41, 2575–2589. [Google Scholar] [CrossRef] [PubMed]
- Hasebroock, Kendra M.; Serkova, Natalie J. Toxicity of MRI and CT contrast agents. Expert Opin. Drug Metab. Toxicol. 2009, 5. [Google Scholar] [CrossRef] [PubMed]
- Corot, C.; Robert, P.; Ballet, S.; Gonzalez, W.; Idee, J.-M.; Raynal, I.; Port, M. T1-weighted MR contrast agents for cancer research. In Molecular Imaging Probes for Cancer Research; Chen, X., Ed.; World Scientific Publishing Co. Pte. Ltd.: Singapore, 2012; pp. 611–658. [Google Scholar]
- Sun, C.; Lee, J.S.; Zhang, M. Magnetic nanoparticles in MR imaging and drug delivery. Adv. Drug Deliv. Rev. 2008, 60, 1252–1265. [Google Scholar] [CrossRef] [PubMed]
- Trewyn, B.G.; Whitman, C.M.; Lin, V.S.-Y. Morphological control of room-temperature ionic liquid templated mesoporous silica nanoparticles for controlled release of antibacterial agents. Nano Lett. 2004, 4, 2139–2143. [Google Scholar] [CrossRef]
- Gao, F.; Botella, P.; Corma, A.; Blesa, J.; Dong, L. Monodispersed mesoporous silica nanoparticles with very large pores for enhanced adsorption and release of DNA. J. Phys. Chem. B 2009, 113, 1796–1804. [Google Scholar] [CrossRef] [PubMed]
- Vivero-Escoto, J.L.; Slowing, I.I.; Trewyn, B.G.; Lin, V.S.-Y. Mesoporous silica nanoparticles for intracellular controlled drug delivery. Small 2010, 6, 1952–1967. [Google Scholar] [CrossRef] [PubMed]
- Tarn, D.; Ashley, C.E.; Xue, M.; Carnes, E.C.; Zink, J.I.; Brinker, J. Mesoporous silica nanoparticle nanocarriers: biofunctionality and biocompatibility. Acc. Chem. Res. 2013, 46, 792–801. [Google Scholar] [CrossRef] [PubMed]
- Karimdjy, M.M.; Tallec, G.; Fries, P.H.; Imbert, D.; Mazzanti, M. Confinement of a tris-aqua Gd(III) complex in silica nanoparticles leads to high stability and high relaxivity and supresses anion binding. 2015, 51, 6836–6838. [Google Scholar] [CrossRef] [PubMed]
- Huang, X.; Zhang, F.; Lee, S.; Swierczewska, M.; Kiesewetter, D.O.; Lang, L.; Zhang, G.; Zhu, L.; Gao, H.; Choi, H.S.; et al. Long-term multimodal imaging of tumor draining sentinel lymph nodes using mesoporous silica-based nanoprobes. Biomaterials 2012, 33, 4370–4378. [Google Scholar] [CrossRef] [PubMed]
- Davis, J.J.; Huang, W.-Y.; Davies, G.-L. Location-tuned relaxivity in Gd-doped mesoporous silica nanoparticles. J. Mater. Chem. 2012, 22, 22848–22850. [Google Scholar] [CrossRef] [PubMed]
- Vivero-Escoto, J.L.; Taylor-Pashow, K.M.L.; Huxford, R.C.; Rocca, J.D.; Okoruwa, C.; An, H.; Lin, W.; Lin, W. Multifunctional mesoporous silica nanospheres with cleavable Gd(III) chelates as MRI contrast agents: synthesis, characterization, target-specificity, and renal clearance. Small 2011, 7, 3519–3528. [Google Scholar] [CrossRef] [PubMed]
- Pinho, S.L.; Faneca, H.G.; Geraldes, C.F.; Delville, M.H.; Carlos, L.D.; Rocha, J. Lanthanide-DTPA grafted silica nanoparticles as bimodal-imaging contrast agents. Biomaterials 2012, 33, 925–935. [Google Scholar] [PubMed]
- Kim, J.S.; Rieter, W.J.; Taylor, K.M.L.; An, H.; Lin, W.; Lin, W. Self-assembled hybrid nanoparticles for cancer-specific multimodal imaging. J. Am. Chem. Soc. 2007, 129, 8962–8963. [Google Scholar] [CrossRef] [PubMed]
- Rieter, W.J.; Kim, J.S.; Taylor, K.M.L.; An, H.; Lin, W.; Tarrant, T.; Lin, W. Hybrid silica nanoparticles for multimodal imaging. Angew. Chem. Int. Ed. 2007, 46, 3680–3682. [Google Scholar] [CrossRef] [PubMed]
- Voisin, P.; Ribot, E.J.; Miraux, S.; Bouzier-Sore, A.-K.; Lahitte, J.-F.; Bouchaud, V.; Mornet, S.; Thiaudière, E.; Franconi, J.-M.; Raison, L.; et al. Use of lanthanide-grafted inorganic nanoparticles as effective contrast agents for cellular uptake imaging. Bioconjug. Chem. 2007, 18, 1053–1063. [Google Scholar] [CrossRef] [PubMed]
- Taylor, K.M.L.; Kim, J.S.; Rieter, W.J.; An, H.; Lin, W.; Lin, W. Mesoporous silica nanospheres as highly efficient MRI contrast agents. J. Am. Chem. Soc. 2008, 130, 2154–2155. [Google Scholar] [CrossRef] [PubMed]
- Guillet-Nicolas, R.; Bridot, J.L.; Seo, Y.; Fortin, M.-A.; Kleitz, F. Enhanced relaxometric properties of MRI “positive” contrast agents confined in three-dimensional cubic mesoporous silica nanoparticles. Adv. Funct. Mater. 2011, 21, 4653–4662. [Google Scholar] [CrossRef]
- Karaman, D.Ş.; Desai, D.; Zhang, J.; Tadayon, S.; Unal, G.; Teuho, J.; Sarfraz, J.; Smått, J.-H.; Gu, H.; Näreojaf, T.; et al. Modulation of the structural properties of mesoporous silica nanoparticles to enhance the T1-weighted MR imaging capability. J. Mater. Chem. B 2016, 4, 1720–1732. [Google Scholar] [CrossRef]
- Chana, M.-H.; Lin, H.-M. Preparation and identification of multifunctional mesoporous silica nanoparticles for in vitro and in vivo dual-mode imaging, theranostics, and targeted tracking. Biomaterials 2015, 46, 149–158. [Google Scholar] [CrossRef] [PubMed]
- Zhang, D.; Gao, A.; Xu, Y.; Yin, X.-B.; Hea, X.-W.; Zhangab, Y.-K. Gd-Al co-doped mesoporous silica nanoparticles loaded with Ru(bpy)32+ as a dual-modality probe for fluorescence and magnetic resonance imaging. Analyst 2014, 139, 4613–4619. [Google Scholar] [CrossRef] [PubMed]
- Sharma, P.; Brown, S.C.; Bengtsson, N.; Zhang, Q.; Walter, G.A.; Grobmyer, S.R.; Santra, S.; Jiang, H.; Scott, E.W.; Moudgil, B.M. Gold-speckled multimodal nanoparticles for noninvasive bioimaging. Chem. Mater. 2008, 20, 6087–6094. [Google Scholar] [CrossRef] [PubMed]
- Lin, Y.-S.; Hung, Y.; Su, J.-K.; Lee, R.; Chang, C.; Lin, M.-L.; Mou, C.-Y. Gadolinium(III)-incorporated nanosized mesoporous silica as potential magnetic resonance imaging contrast agents. J. Phys. Chem. B 2004, 108, 15608–15611. [Google Scholar] [CrossRef]
- Cao, M.; Wang, P.; Kou, Y.; Wang, J.; Liu, J.; Li, Y.; Li, J.; Wang, L.; Chen, C. Gadolinium(III)-chelated silica nanospheres integrating chemotherapy and photothermal therapy for cancer treatment and magnetic resonance imaging. ACS Appl. Mater. Interfaces 2015, 7, 25014–25023. [Google Scholar] [CrossRef] [PubMed]
- Hu, X.; Wang, M.; Miao, F.; Ma, J.; Shena, H.; Jia, N. Regulation of multifunctional mesoporous core–shell nanoparticles with luminescence and magnetic properties for biomedical applications. J. Mater. Chem. B 2014, 2, 2265–2275. [Google Scholar] [CrossRef]
- Huang, S.; Cheng, Z.; Ma, P.; Kang, X.; Daia, Y.; Lin, J. Luminescent GdVO4:Eu3+ functionalized mesoporous silica nanoparticles for magnetic resonance imaging and drug delivery. Dalton Trans. 2013, 42, 6523–6530. [Google Scholar] [CrossRef] [PubMed]
- Shao, Y.; Tian, X.; Hu, W.; Zhang, Y.; Liu, H.; He, H.; Shen, Y.; Xie, F.; Li, L. The properties of Gd2O3-assembled silica nanocomposite targeted nanoprobes and their application in MRI. Biomaterials 2012, 33, 6438–6446. [Google Scholar] [CrossRef] [PubMed]
- Cho, H.K.; Cho, H.-J.; Lone, S.; Kim, D.-D.; Yeum, J.H.; Cheong, I.W. Preparation and characterization of MRI-active gadolinium nanocomposite particles for neutron capture therapy. J. Mater. Chem. 2011, 21, 15486–15493. [Google Scholar]
- Hu, K.-W.; Jhang, F.-Y.; Su, C.-H.; Yeh, C.-S. Fabrication of Gd2O(CO3)2·H2O/silica/gold hybrid particles as a bifunctional agent for MR imaging and photothermal destruction of cancer cells. J. Mater. Chem. 2009, 19, 2147–2153. [Google Scholar] [CrossRef]
- Xing, H.; Bu, W.; Zhang, S.; Zheng, X.; Lic, M.; Chen, F.; Hea, Q.; Zhou, L.; Peng, W.; Hua, Y.; et al. Multifunctional nanoprobes for upconversion fluorescence, MR and CT trimodal imaging. Biomaterials 2012, 33, 1079–1089. [Google Scholar] [CrossRef] [PubMed]
- Yeh, C.-S.; Su, C.-H.; Ho, W.-Y.; Huang, C.-C.; Chang, J.-C.; Chien, Y.-H.; Hung, S.-T.; Liau, M.-C.; Ho, H.-Y. Tumor targeting and MR imaging with lipophilic cyanine-mediated near-infrared responsive porous Gd silicate nanoparticles. Biomaterials 2013, 34, 5677–5688. [Google Scholar] [CrossRef] [PubMed]
- Cabrera-García, A.; Vidal-Moya, A.; Bernabeu, A.; Sánchez-González, J.; Fernández, E.; Botella, P. Gd–Si oxide mesoporous nanoparticles with pre-formed morphology prepared from a Prussian blue analogue template. Dalton Trans. 2015, 44, 14034–14041. [Google Scholar] [CrossRef] [PubMed]
- Perrier, M.; Kenouche, S.; Long, J.; Thangavel, K.; Larionova, J.; Goze-Bac, C.; Lascialfari, A.; Mariani, M.; Baril, N.; Guérin, C.; et al. Investigation on NMR relaxivity of nano-sized cyano-bridged coordination polymers. Inorg. Chem. 2013, 52, 13402–13414. [Google Scholar] [CrossRef] [PubMed]
- Zhang, L.; Wu, H.B.; Lou, X.W. Metal–organic-frameworks-derived general formation of hollow structures with high complexity. J. Am. Chem. Soc. 2013, 135, 10664–10672. [Google Scholar] [CrossRef] [PubMed]
- Zhang, L.; Wu, H.B.; Madhavi, S.; Hng, H.H.; Lou, X.W. Formation of Fe2O3 Microboxes with hierarchical shell structures from metal–organic frameworks and their lithium storage properties. J. Am. Chem. Soc. 2012, 134, 17388–17391. [Google Scholar] [CrossRef] [PubMed]
- Engström, M.; Klasson, A.; Pedersen, H.; Vahlberg, C.; Per-Olov, K.; Uvdal, K. High proton relaxivity for gadolinium oxide nanoparticles. Magn. Reson. Mater. Phy. 2006, 19, 180–186. [Google Scholar] [CrossRef] [PubMed]
- Osseni, S.A.; Lechevallier, S.; Verelst, M.; Perriat, P.; Dexpert-Ghys, J.; Neumeyer, D.; Garcia, R.; Mayer, F.; Djanashvili, K.; Peters, J.A.; et al. Gadolinium oxysulfide nanoparticles as multimodal imaging agents for T2-weighted MR, X-ray tomography and photoluminescence. Nanoscale 2014, 6, 555–564. [Google Scholar] [CrossRef] [PubMed]
- Mahmoudi, M.; Lynch, I.; Ejtehadi, M.R.; Monopoli, M.P.; Bombelli, F.B.; Laurent, S. Protein—Nanoparticle interactions: opportunities and challenges. Chem. Rev. 2011, 111, 5610–5637. [Google Scholar] [CrossRef] [PubMed]
- Clemments, A.M.; Muniesa, C.; Landry, C.C.; Botella, P. Effect of surface properties in protein corona development on mesoporous silica nanoparticles. RSC Adv. 2014, 4, 29134–29138. [Google Scholar] [CrossRef]
- Lu, J.; Liong, M.; Li, Z.; Zink, J.I.; Tamanoi, F. Biocompatibility, biodistribution, and drug-delivery efficiency of mesoporous silica nanoparticles for cancer therapy in animals. Small 2010, 6, 1794–1805. [Google Scholar] [CrossRef] [PubMed]
- Botella, P.; Abasolo, I.; Fernández, Y.; Muniesa, C.; Miranda, S.; Quesada, M.; Ruiz, J.; Schwartz, S., Jr.; Corma, A. Surface-modified silica nanoparticles for tumor-targeted delivery of camptothecin and its biological evaluation. J. Control. Release 2011, 10, 246–257. [Google Scholar] [CrossRef] [PubMed]
- Na, H.B.; Lee, J.H.; An, K.; Park, Y.I.; Park, M.; Lee, I.S.; Nam, D.-H.; Kim, S.T.; Kim, S.-H.; Kim, S.-W.; et al. Development of a T1 contrast agent for magnetic resonance imaging using MgO nanoparticles. Angew. Chem. Int. Ed. 2007, 46, 5397–5401. [Google Scholar] [CrossRef] [PubMed]
- Kim, T.; Cho, E.-J.; Chae, Y.; Kim, M.; Oh, A.; Jin, J.; Lee, E.-S.; Baik, H.; Haam, S.; Suh, J.-S.; et al. Urchin-shaped manganese oxide nanoparticles as pH-responsive activatable T1 contrast agents for magnetic resonance imaging. Angew. Chem. Int. Ed. 2011, 50, 10589–10593. [Google Scholar] [CrossRef] [PubMed]
- Lim, E.-K.; Kim, T.; Paik, S.; Haam, S.; Huh, Y.-M.; Lee, K. Nanomaterials for theranostics: Recent advances and future challenges. Chem. Rev. 2015, 115, 327–394. [Google Scholar] [CrossRef] [PubMed]
- Maschrak, P.K. Convenient synthesis of tris(tetraethylammonium) hexacyanoferrate(III) and its use as an oxidant with tunable redox potential. Inorg. Chem. 1986, 25, 245–247. [Google Scholar] [CrossRef]
- Blüml, S.; Schad, L.R.; Stepanow, B.; Lorenz, W.J. Spin-lattice relaxation time measurement by means of a TurboFLASH technique. Magn. Reson. Med. 1993, 30, 289–295. [Google Scholar] [CrossRef] [PubMed]
- Hennig, J.; Friedburg, H. Clinical applications and methodological developments of the RARE technique. Magn. Reson. Imaging 1988, 6, 391–395. [Google Scholar] [CrossRef]
- Hennig, J.; Nauerth, A.; Friedburg, H. RARE imaging: a fast imaging method for clinical MR. Magn. Reson. Med. 1986, 3, 823–833. [Google Scholar] [CrossRef] [PubMed]


| Sample | Molecular Formula | Atomic Composition (%) a | Size (nm) | Area BET (m2·g−1) b | |||
|---|---|---|---|---|---|---|---|
| Gd | Fe | Si | TEM c | DLS d | |||
| GdFe | Gd(H2O)4[Fe(CN)6] | 52.8 | 47.2 | -- | 94.2 ± 35.5 | nd e | nd e |
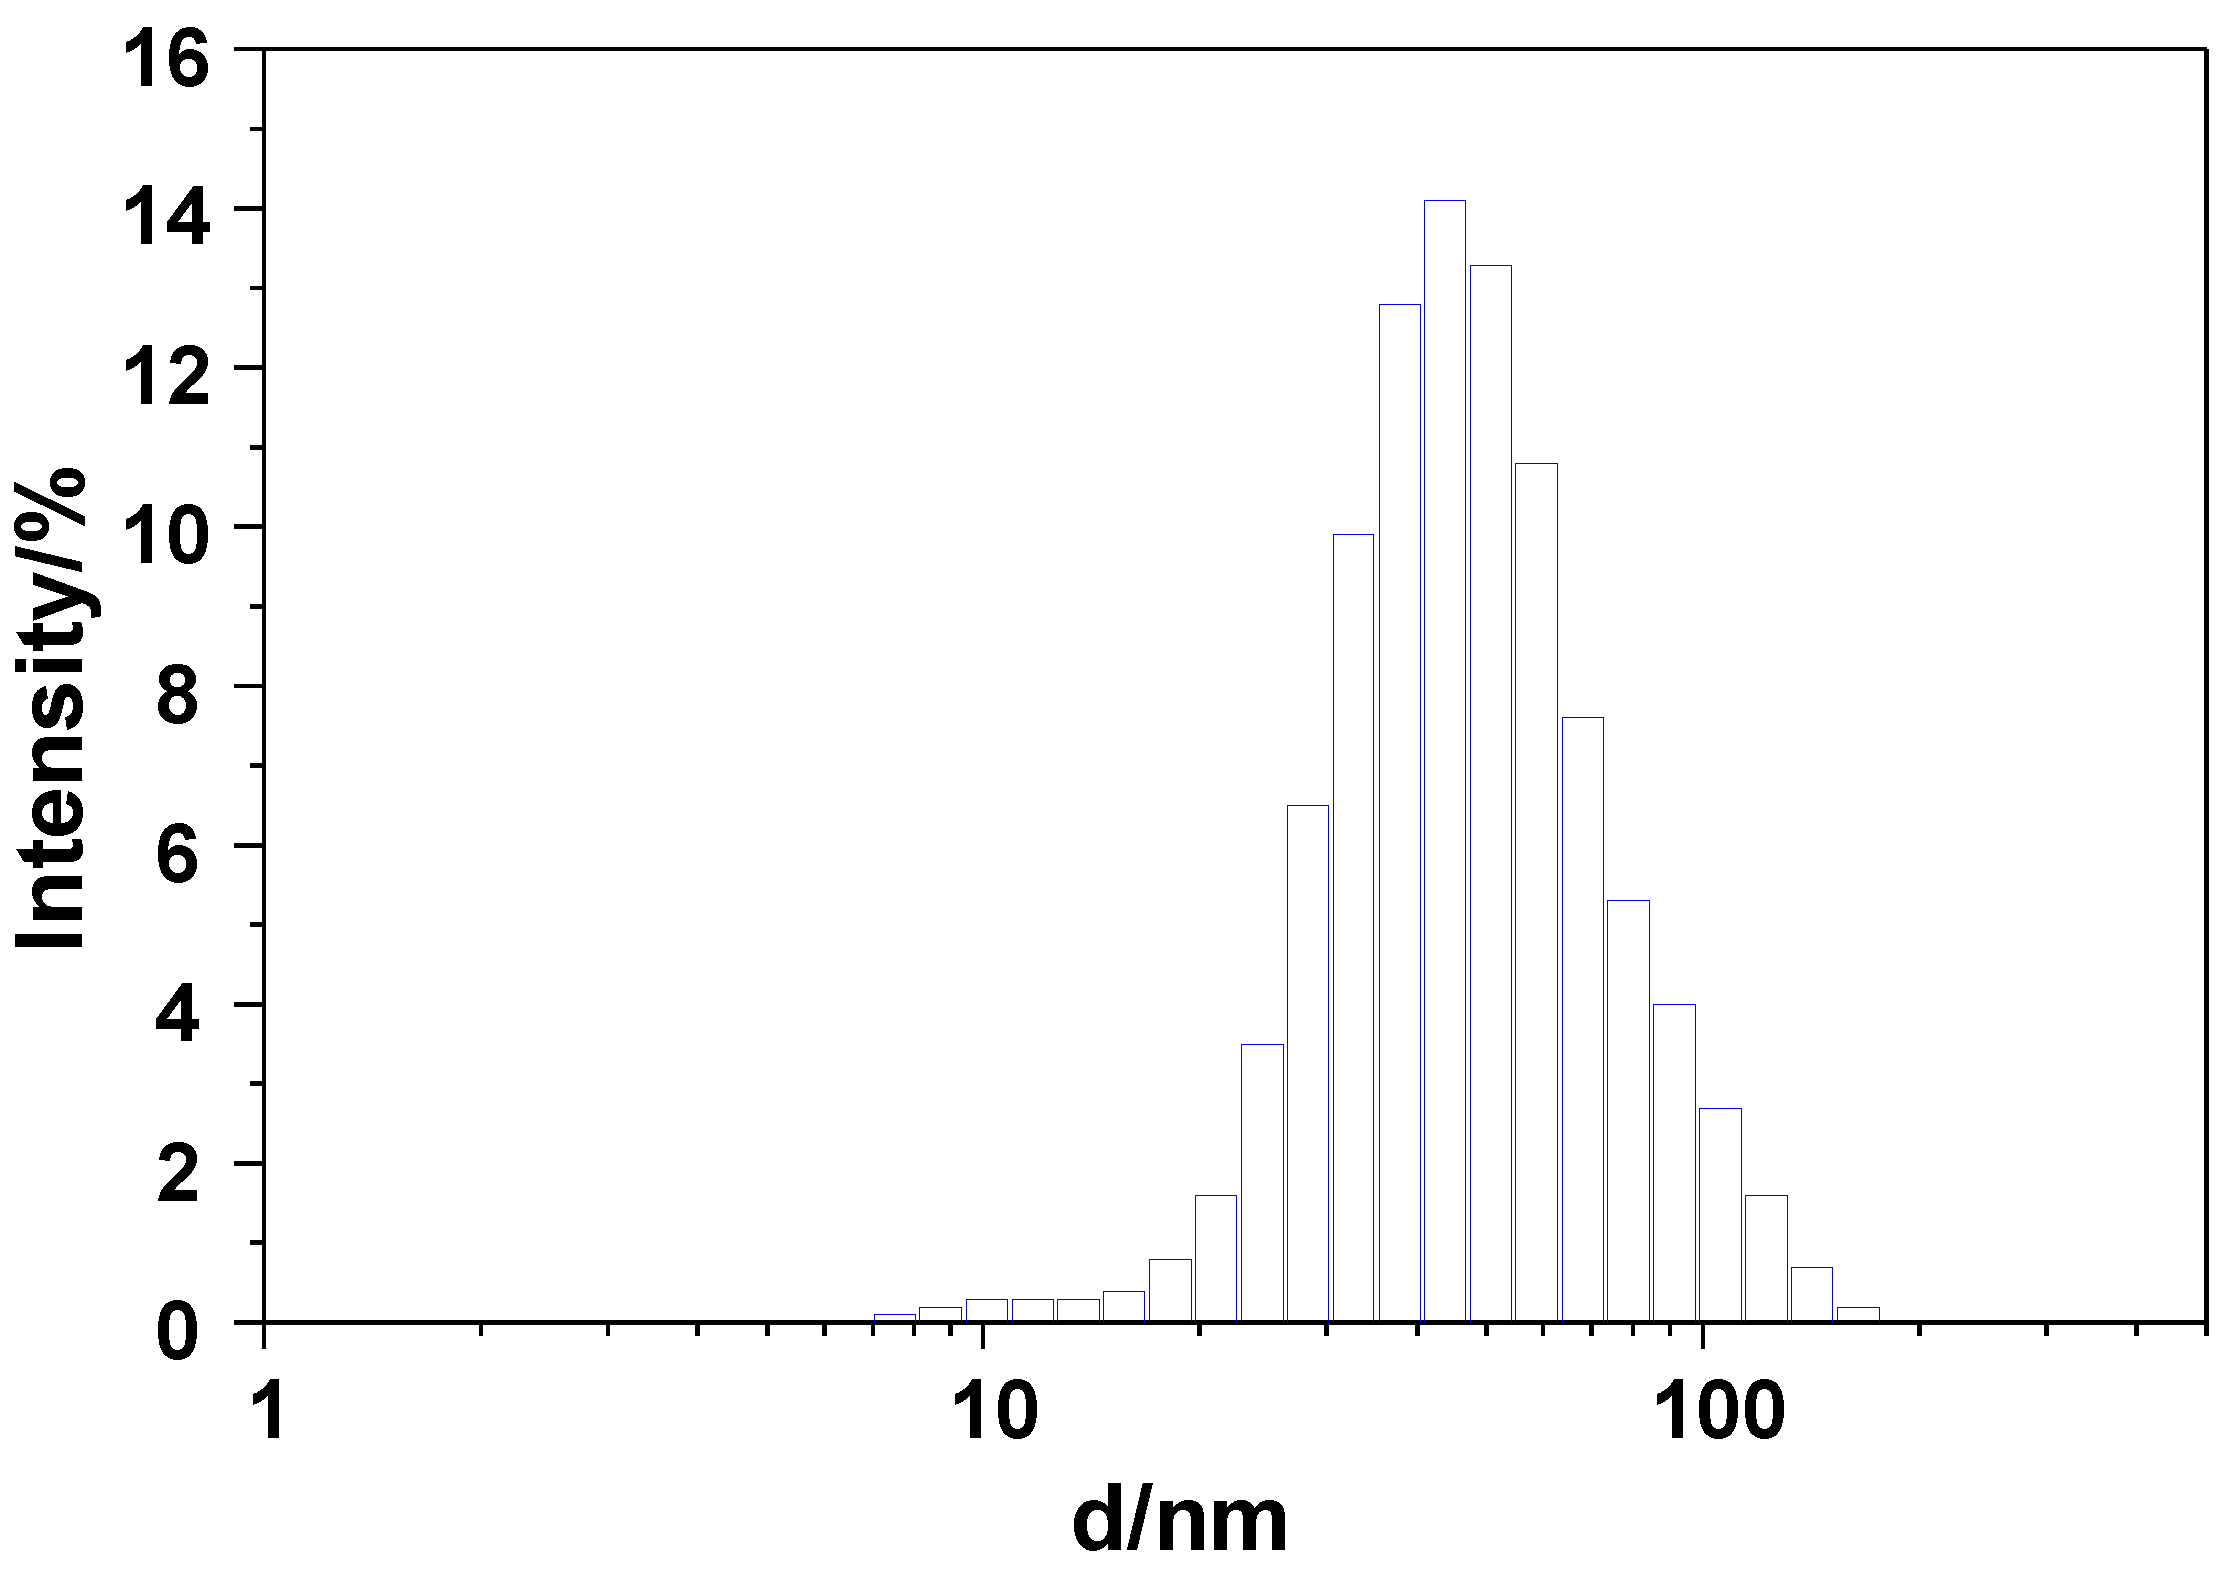
| GdSi | Gd(OH)3·3SiO2·xH2O | 18.6 | 1.3 | 80.1 | 75.2 ± 24.0 | 84 ± 44 | 19.0 |
| Sample | r1/s−1·mM−1 | r2/s−1·mM−1 | r2/r1 |
|---|---|---|---|
| GdSi | 5.6 | 8.2 | 1.4 |
| Gd-DTPA | 4.1 | 3.3 | 0.8 |
© 2016 by the authors; licensee MDPI, Basel, Switzerland. This article is an open access article distributed under the terms and conditions of the Creative Commons Attribution (CC-BY) license (http://creativecommons.org/licenses/by/4.0/).
Share and Cite
Cabrera-García, A.; Vidal-Moya, A.; Bernabeu, Á.; Pacheco-Torres, J.; Checa-Chavarria, E.; Fernández, E.; Botella, P. Gd-Si Oxide Nanoparticles as Contrast Agents in Magnetic Resonance Imaging. Nanomaterials 2016, 6, 109. https://doi.org/10.3390/nano6060109
Cabrera-García A, Vidal-Moya A, Bernabeu Á, Pacheco-Torres J, Checa-Chavarria E, Fernández E, Botella P. Gd-Si Oxide Nanoparticles as Contrast Agents in Magnetic Resonance Imaging. Nanomaterials. 2016; 6(6):109. https://doi.org/10.3390/nano6060109
Chicago/Turabian StyleCabrera-García, Alejandro, Alejandro Vidal-Moya, Ángela Bernabeu, Jesús Pacheco-Torres, Elisa Checa-Chavarria, Eduardo Fernández, and Pablo Botella. 2016. "Gd-Si Oxide Nanoparticles as Contrast Agents in Magnetic Resonance Imaging" Nanomaterials 6, no. 6: 109. https://doi.org/10.3390/nano6060109