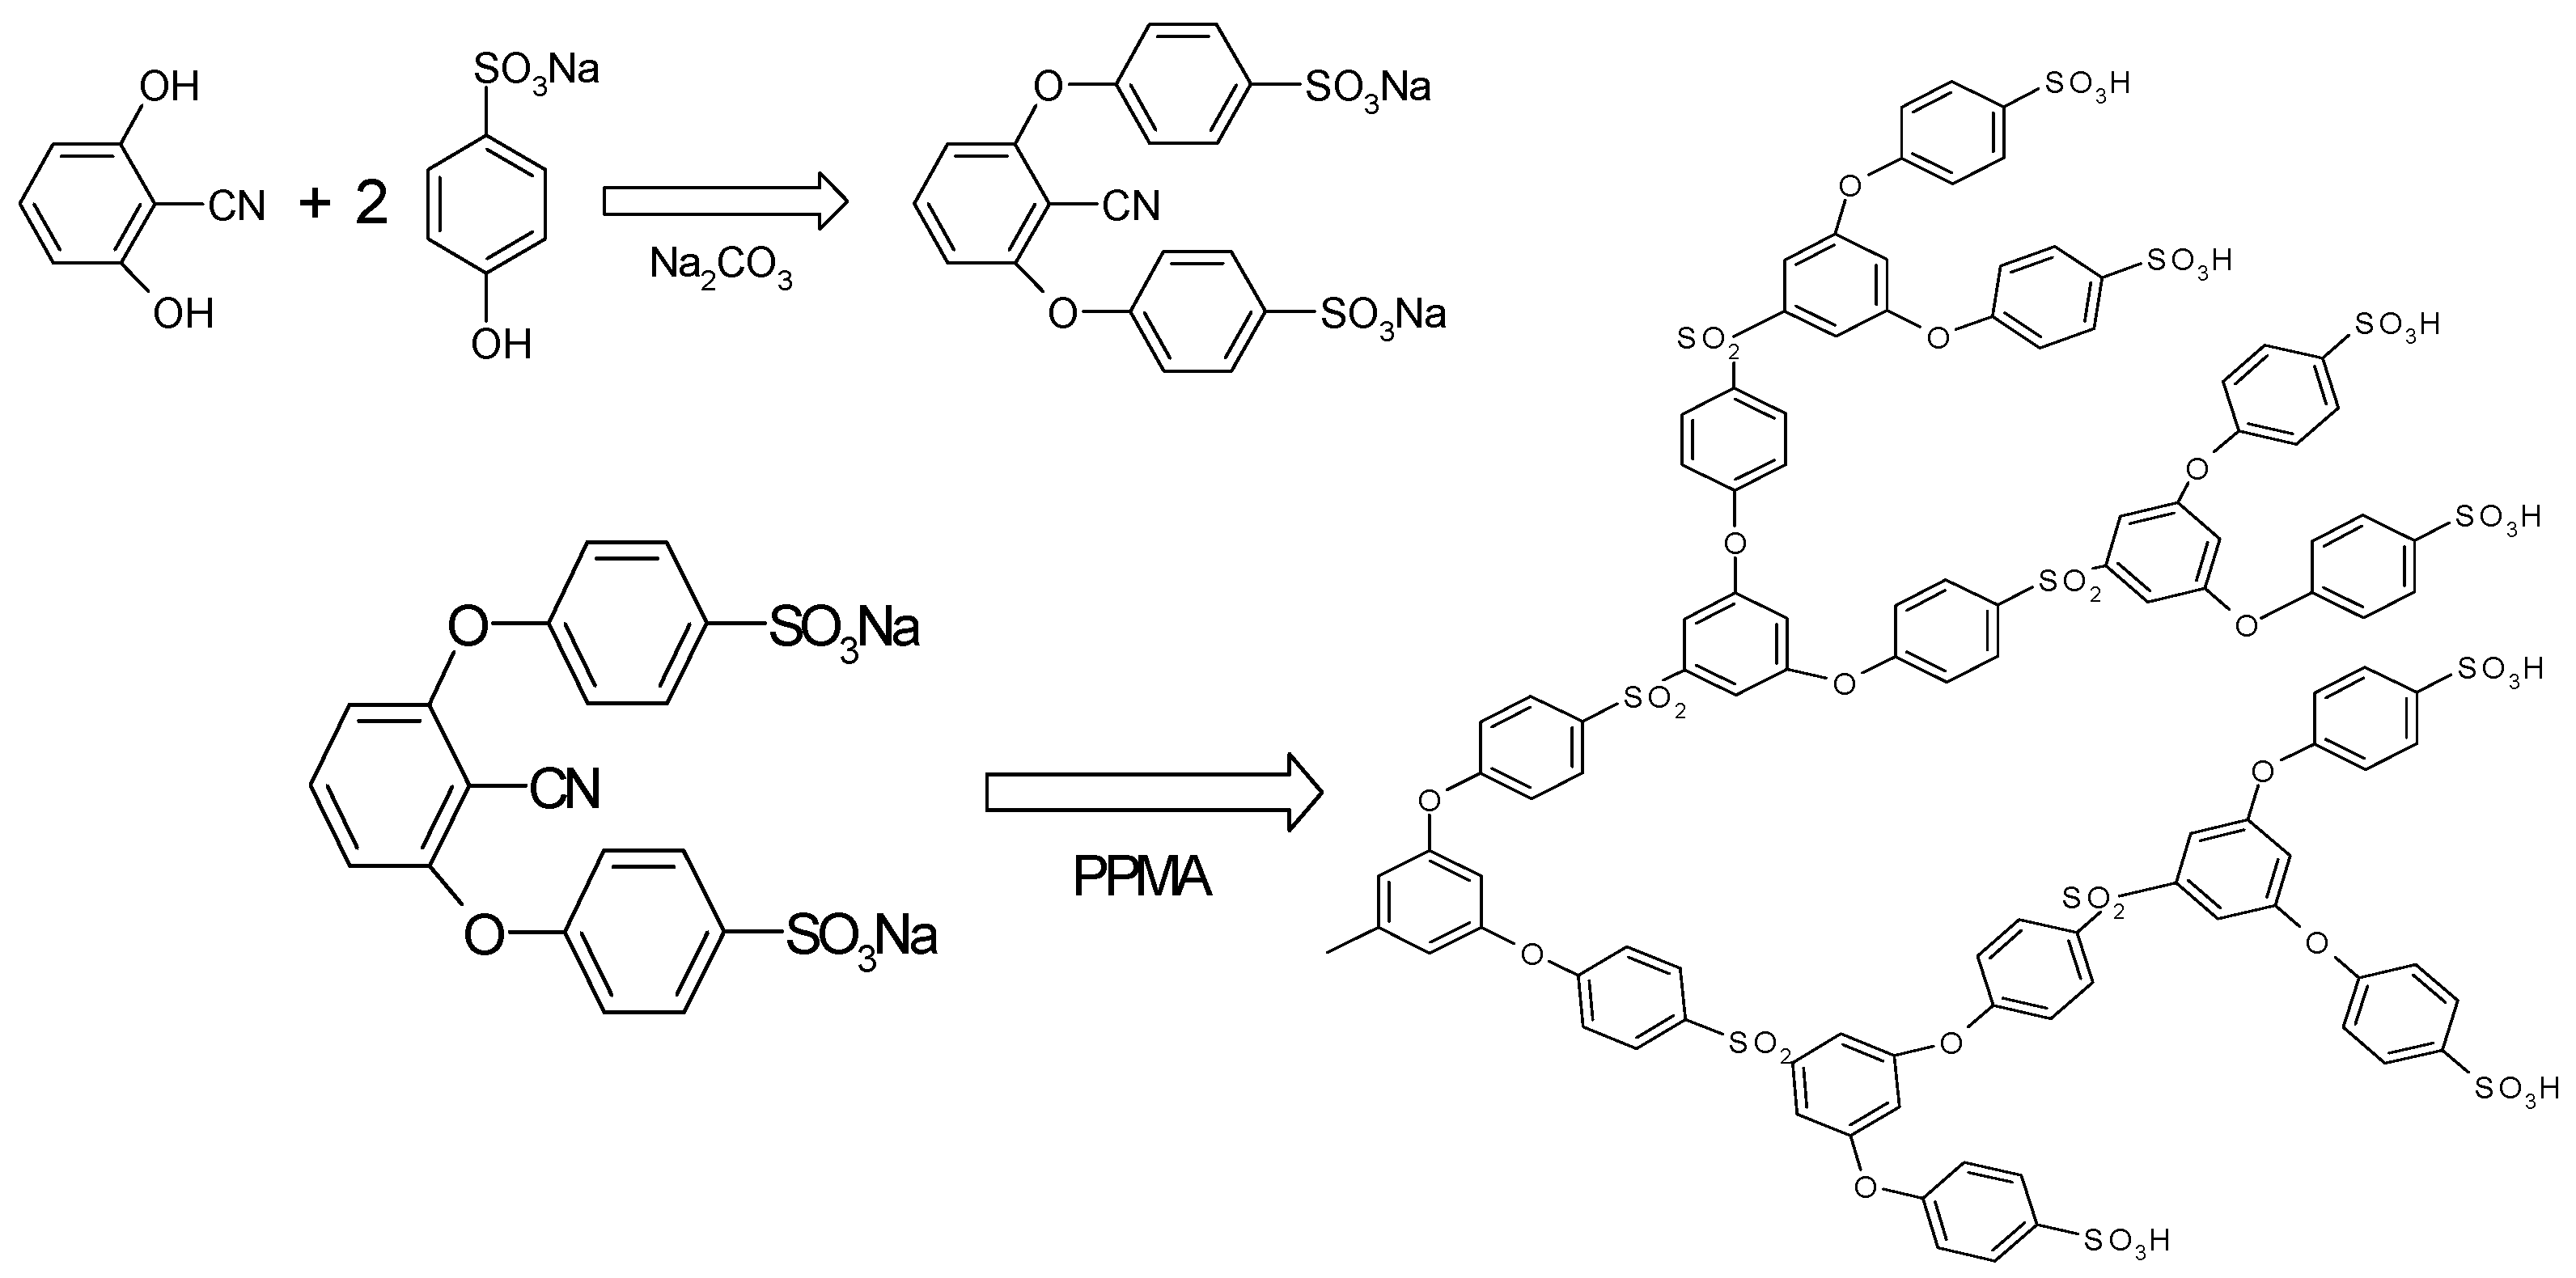
3.1. Synthesis of HPSU
Sulfonic acid-terminated, hyperbranched polysulfone (HPSU) was synthesized based on the procedure in
Scheme 1 described by Takeuchi
et al. [
18,
19]. However, the authors did not report any detail of the effect of various synthetic parameters, and, in our study, we examined the effect of time and temperature and found that the reaction temperature has significant influence in determining the yield and nature of product obtained.
Scheme 1.
Synthesis of the sulfonic acid terminated, hyperbranched polysulfone.
Scheme 1.
Synthesis of the sulfonic acid terminated, hyperbranched polysulfone.
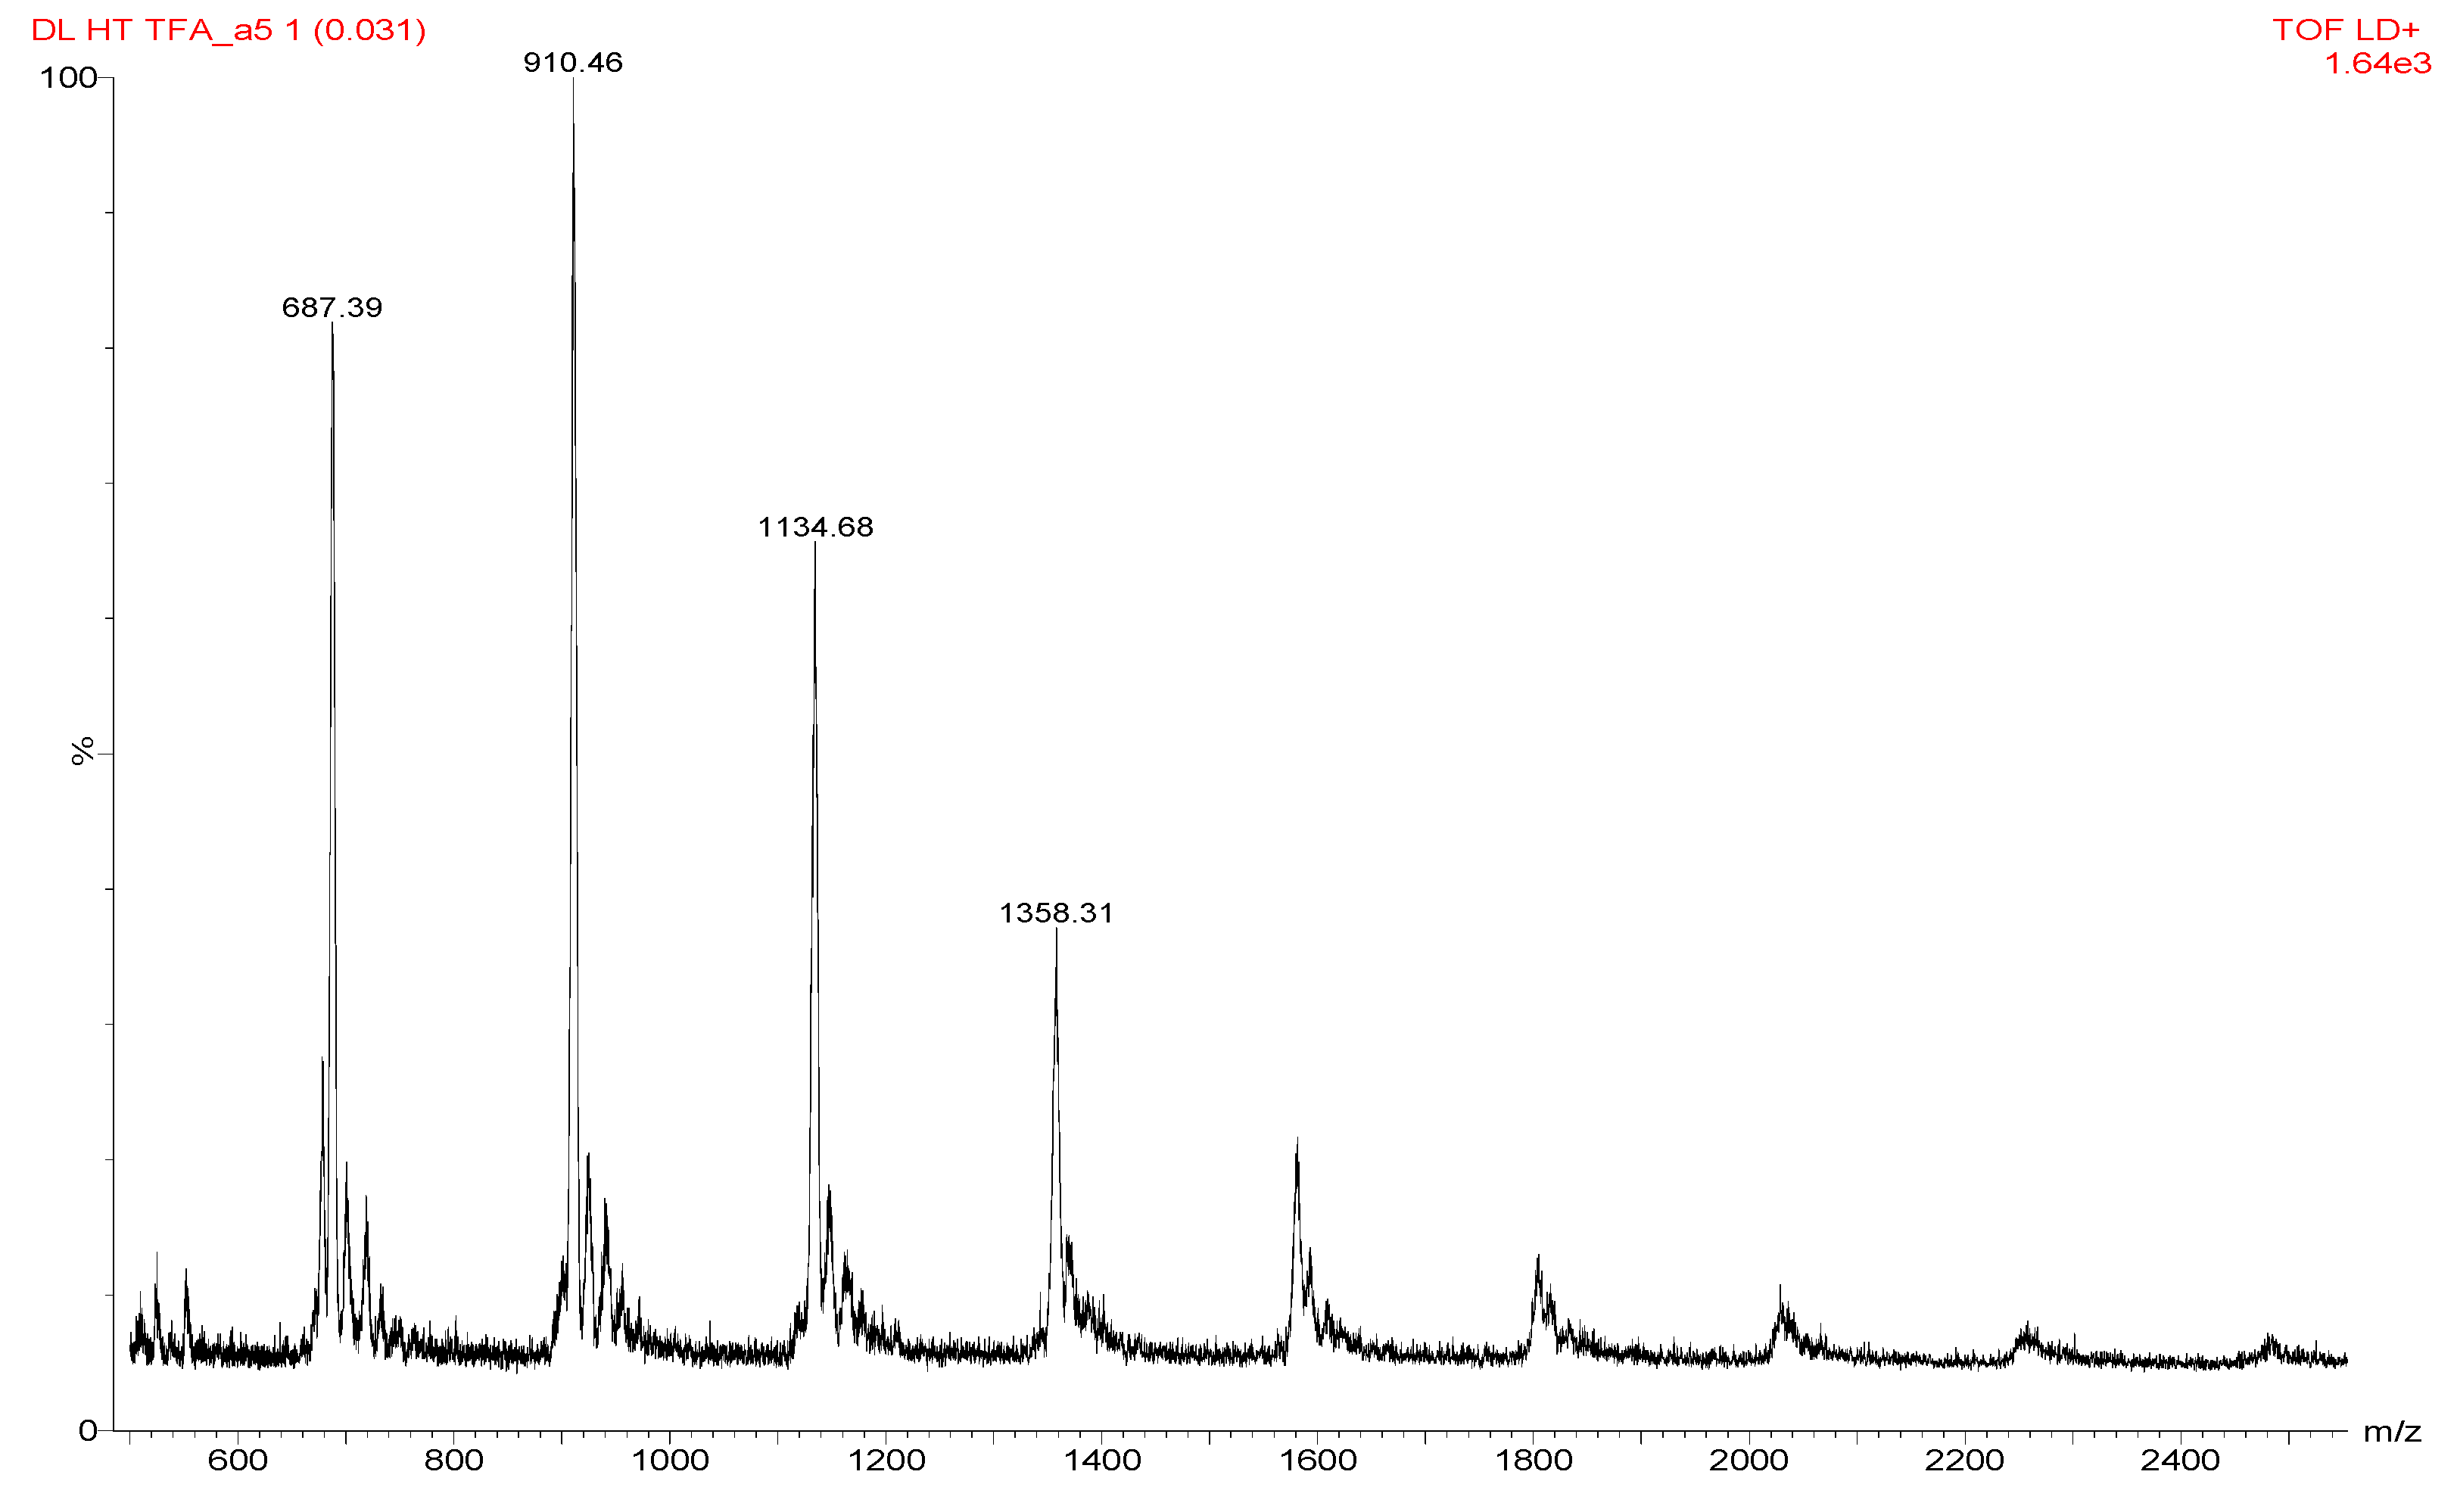
Figure 1 shows the MALDI spectrum on synthesized and dialysed samples of HPSU, which shows molecular weight values. In general, the characterization of branched polymers is challenging, as reported by earlier authors [
20], because (even in the hypothetical case of a size exclusion chromatography system without band broadening) a sample of branched polymers with the same
Vh, hydrodynamic volume, in general, contains chains with a range of molecular weights. This effect is called variously “imperfect resolution”, “structural polydispersity”, or “local polydispersity”. Matrix assisted laser desorption ionization spectroscopy, MALDI was performed using dialyzed (dialysis bag cut off molecular weight 12,000) samples, however, the molecular weight obtained was very low, around <2000, showing only the lower molecular weight oligomers. The MALDI spectrum shows a repeating unit of a mass around 224–226, which is a bit higher (or lower) than expected from theoretical fragment (217 or 233 based on cleavage on the ether and assuming loss of CN group). The molecular weights of the synthesized samples have a broad distribution from 1000 to 12,000.
Figure 1.
MALDI spectrum of the synthesized HPSU.
Figure 1.
MALDI spectrum of the synthesized HPSU.
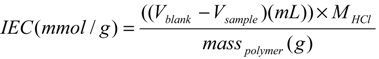
The HPSU was synthesized with high yields when the reaction was carried out at 150 °C and above, however with increasing temperature there is a decrease in the IEC and water solubility of the HPSU. As can be seen in
Table 1, the IEC of the product decreases when the reaction temperature or time is increased. This is likely due to an annealing effect, with higher temperatures resulting in more aggregation and crosslinking between the polymer chains, resulting in smaller number of sulfonic acid end groups (lower IEC) and lower solubility. Despite the lower water solubility, samples synthesized at higher temperature were still soluble in DMSO/H
2O mixture.
Table 1.
Effect of reaction temperature and time on the ion exchange capacity (IEC) of the hyperbranched polysulfone (HPSU).
Table 1.
Effect of reaction temperature and time on the ion exchange capacity (IEC) of the hyperbranched polysulfone (HPSU).
| Temperature (°C) | Time (days) | IEC (meq/g) |
|---|
| 130 | 3 | 5.0 |
| 140 | 1 | 5.2 |
| 140 | 2 | 4.9 |
| 150 | 1 | 4.2 |
| 150 | 2 | 3.9 |
The use of higher temperature also increased the yield, with the yield increasing significantly from 20% (at 130 °C) to 80%–90% (at 150 °C) as purification was done through dialysis, and thus the increased annealing and crosslinking would result in larger aggregates, which are retained within the dialysis tube. In this study, it has been determined that a synthesis parameter of 150 °C and 24 h provides the optimum product in terms of yield, solubility, and IEC. As such, this condition has been used to synthesize the HPSU used in the composite membrane.
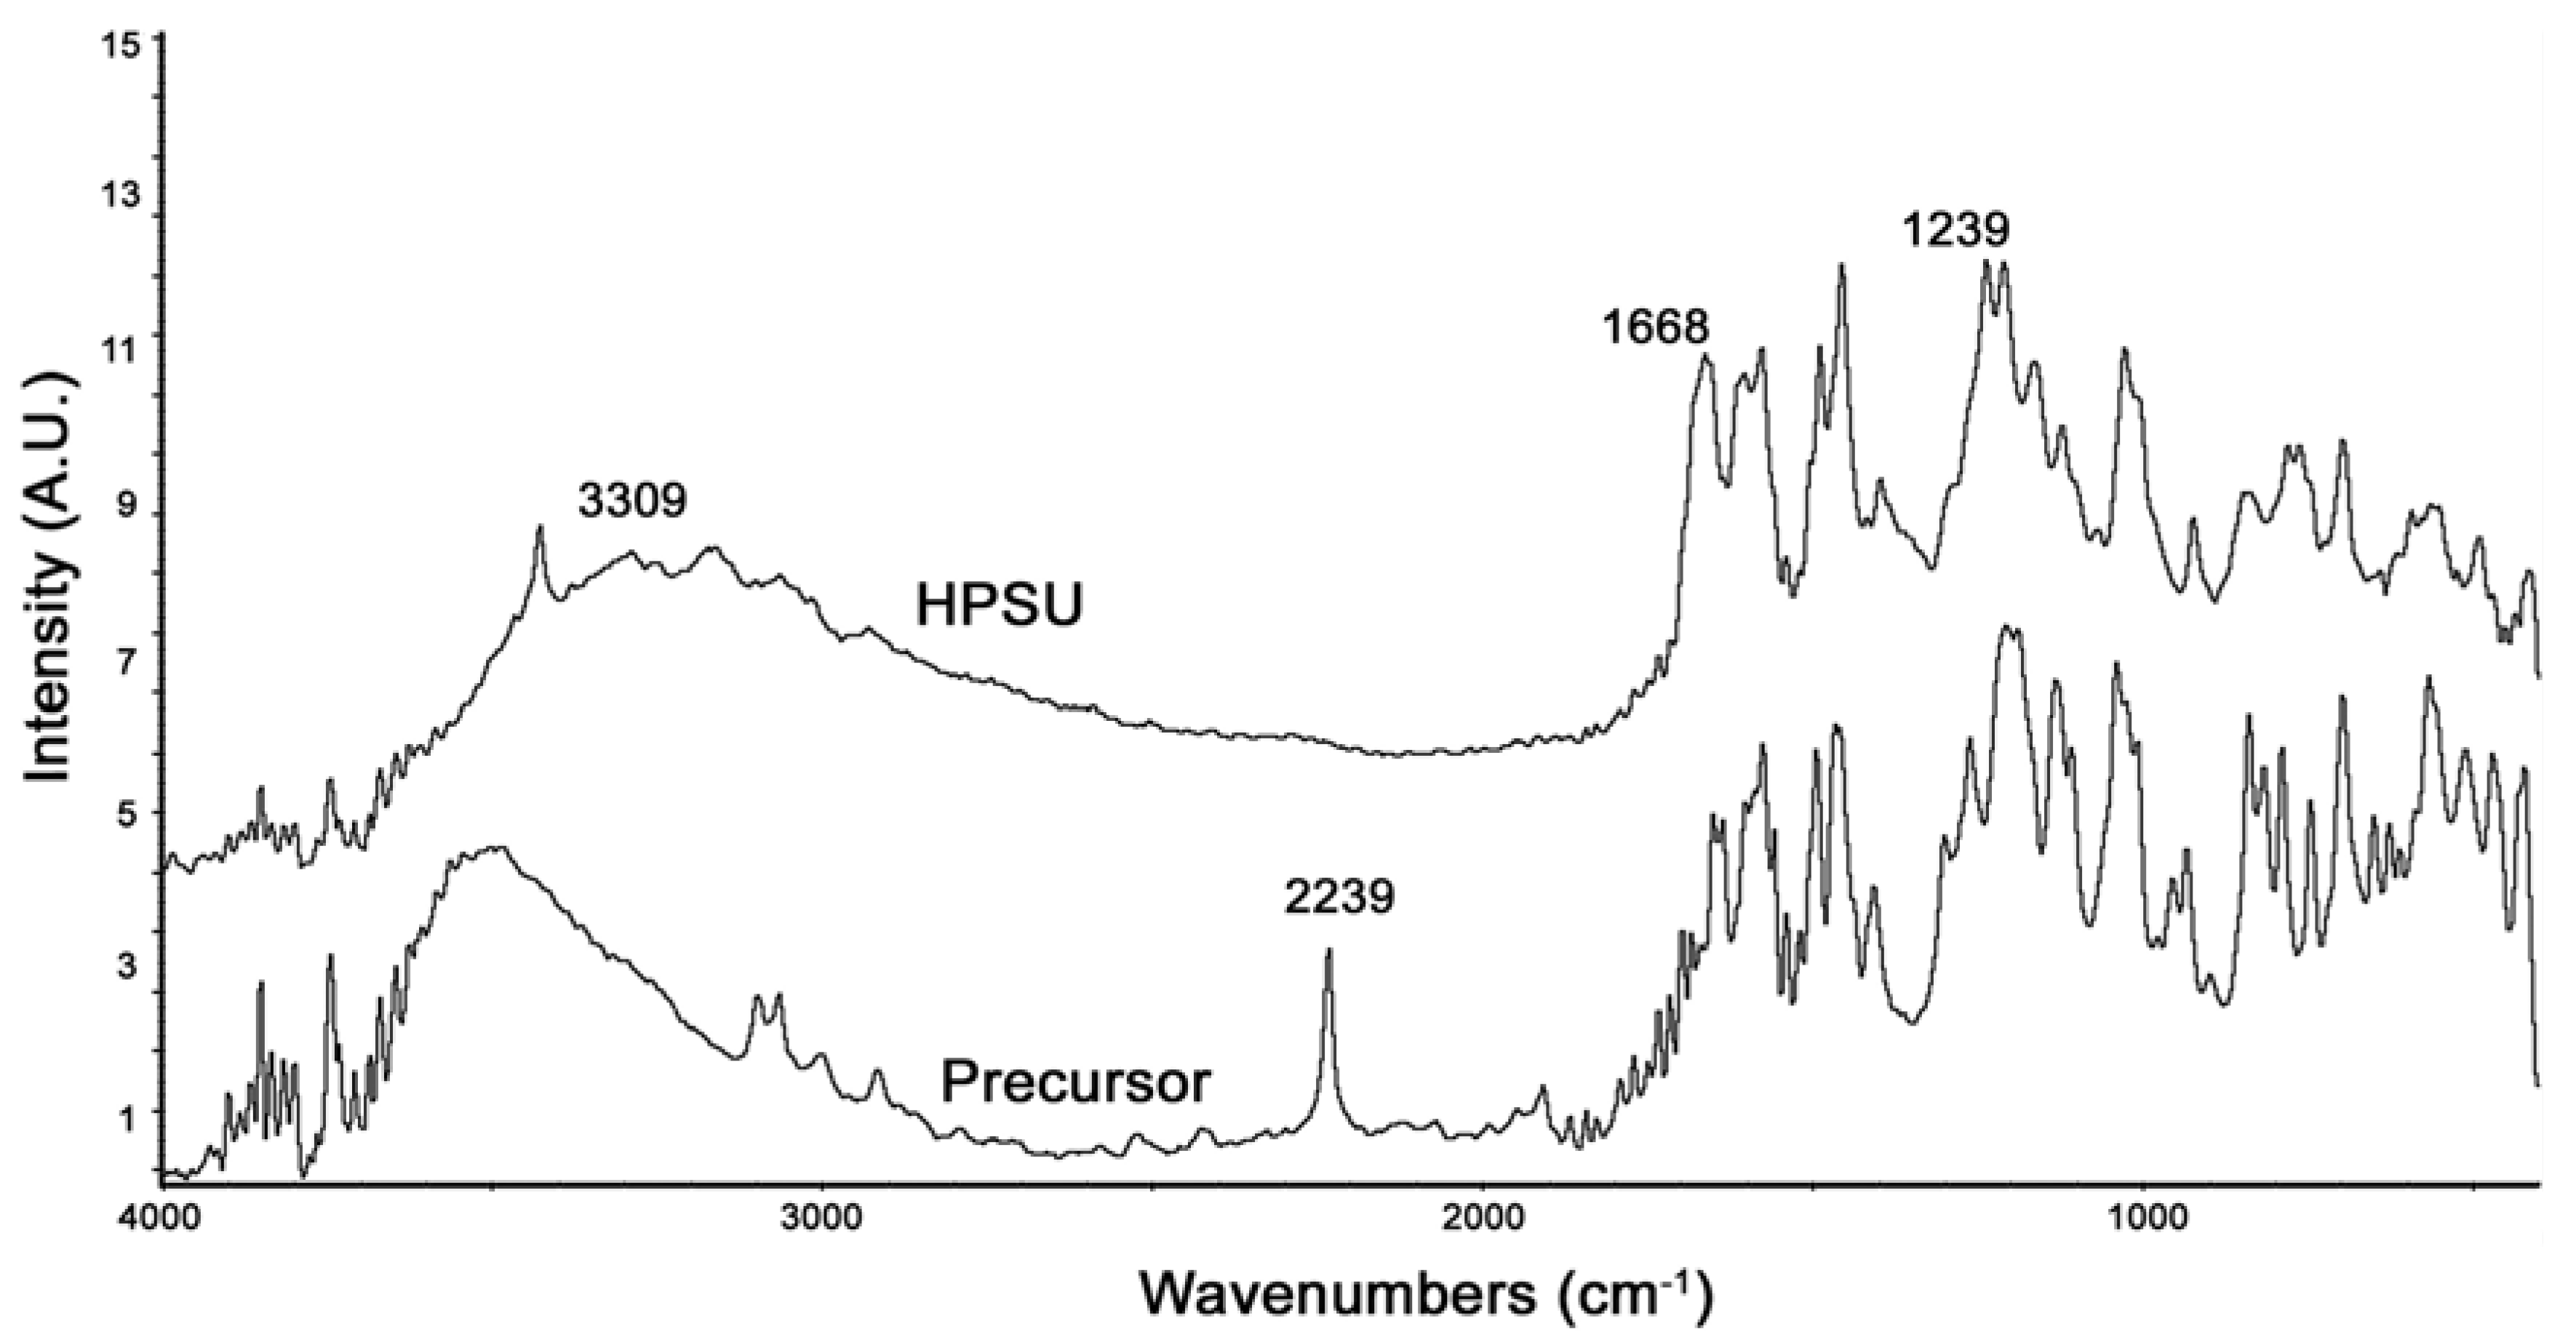
FTIR of the synthesized HPSU is shown in
Figure 2. It shows that the large, broad peak at 3300–3500 cm
−1 due to OH groups has been shifted in the HPSU compared to the precursor, and there are also shifts in the peaks at 1668 and 1239 cm
−1 due to the sulfone linkages. The lack of a peak at 2239 cm
−1 indicates that the nitrile group present in the precursor has been lost during polymerization.
Figure 2.
PA-FTIR spectra of the HPSU and its precursor compounds.
Figure 2.
PA-FTIR spectra of the HPSU and its precursor compounds.
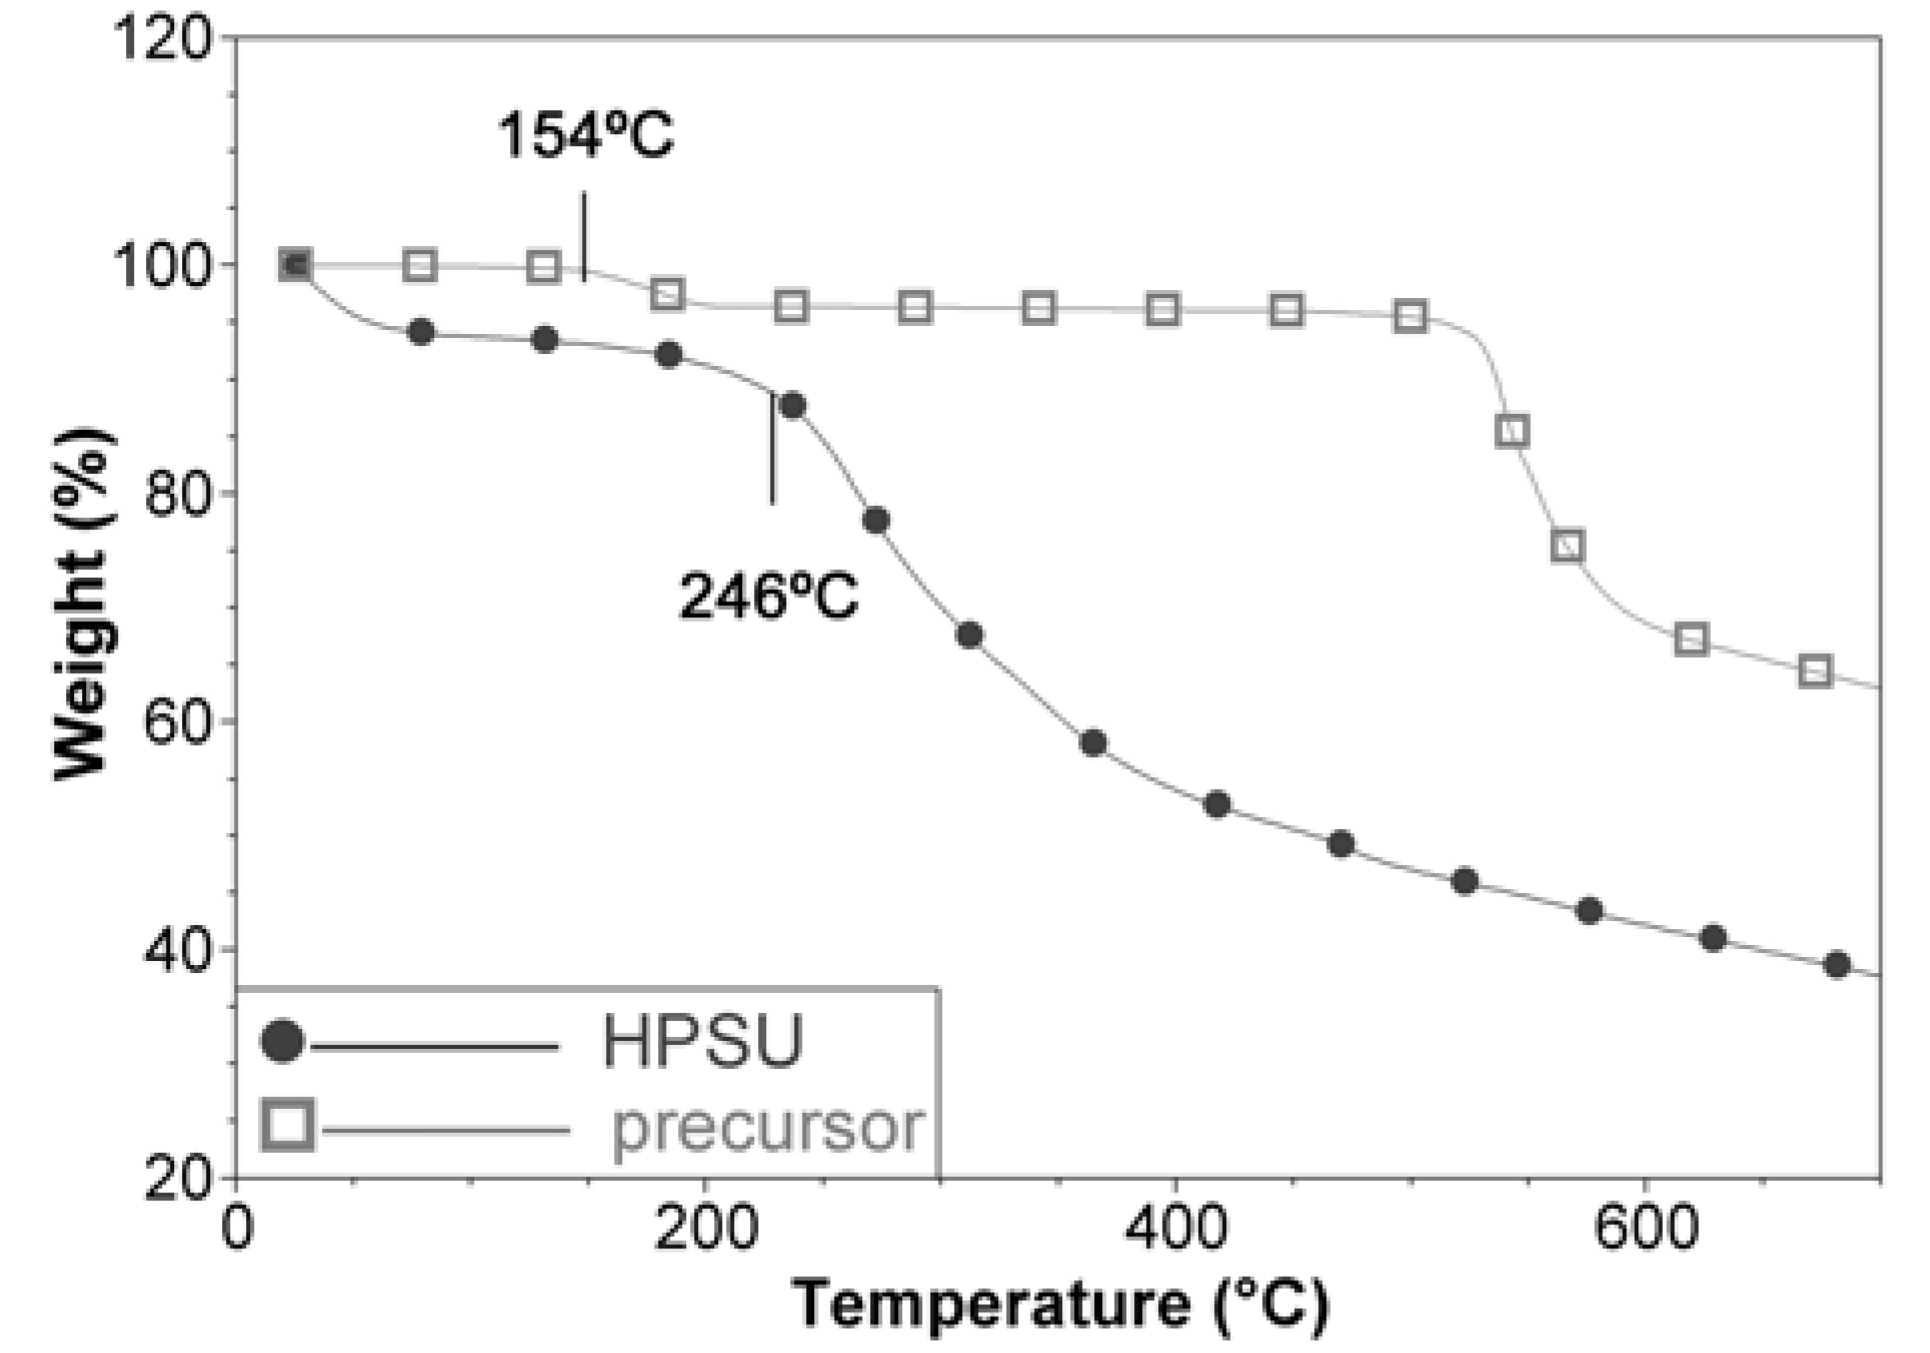
This is consistent with the TGA analysis in
Figure 3, which shows a mass loss at 154 °C, assigned to the nitrile group for the precursor, but this mass loss is absent in the HPSU. The HPSU shows that it is thermally stable until 246 °C, where desulfonation occurs (This is not observed in the precursor as it is in sodium salt form), but there were no well-defined mass loss for main chain degradation, with the curve sloping downwards as temperature increased. This indicates that the HPSU is not of a well-defined structure, and most likely is a mixture of hyperbranched polymers of varying branch length. This non-uniformity is unlikely to affect the performance of the blend membrane, as the HPSU’s purpose is to provide proton conductivity (which would rely on sulfonic acid groups) and the mechanical and structural integrity of the membrane would be provided by the PVDF-co-HFP matrix.
Figure 3.
TGA comparison of HPSU and its precursor compound.
Figure 3.
TGA comparison of HPSU and its precursor compound.
3.2. Sulfonation of PVDF-co-HFP
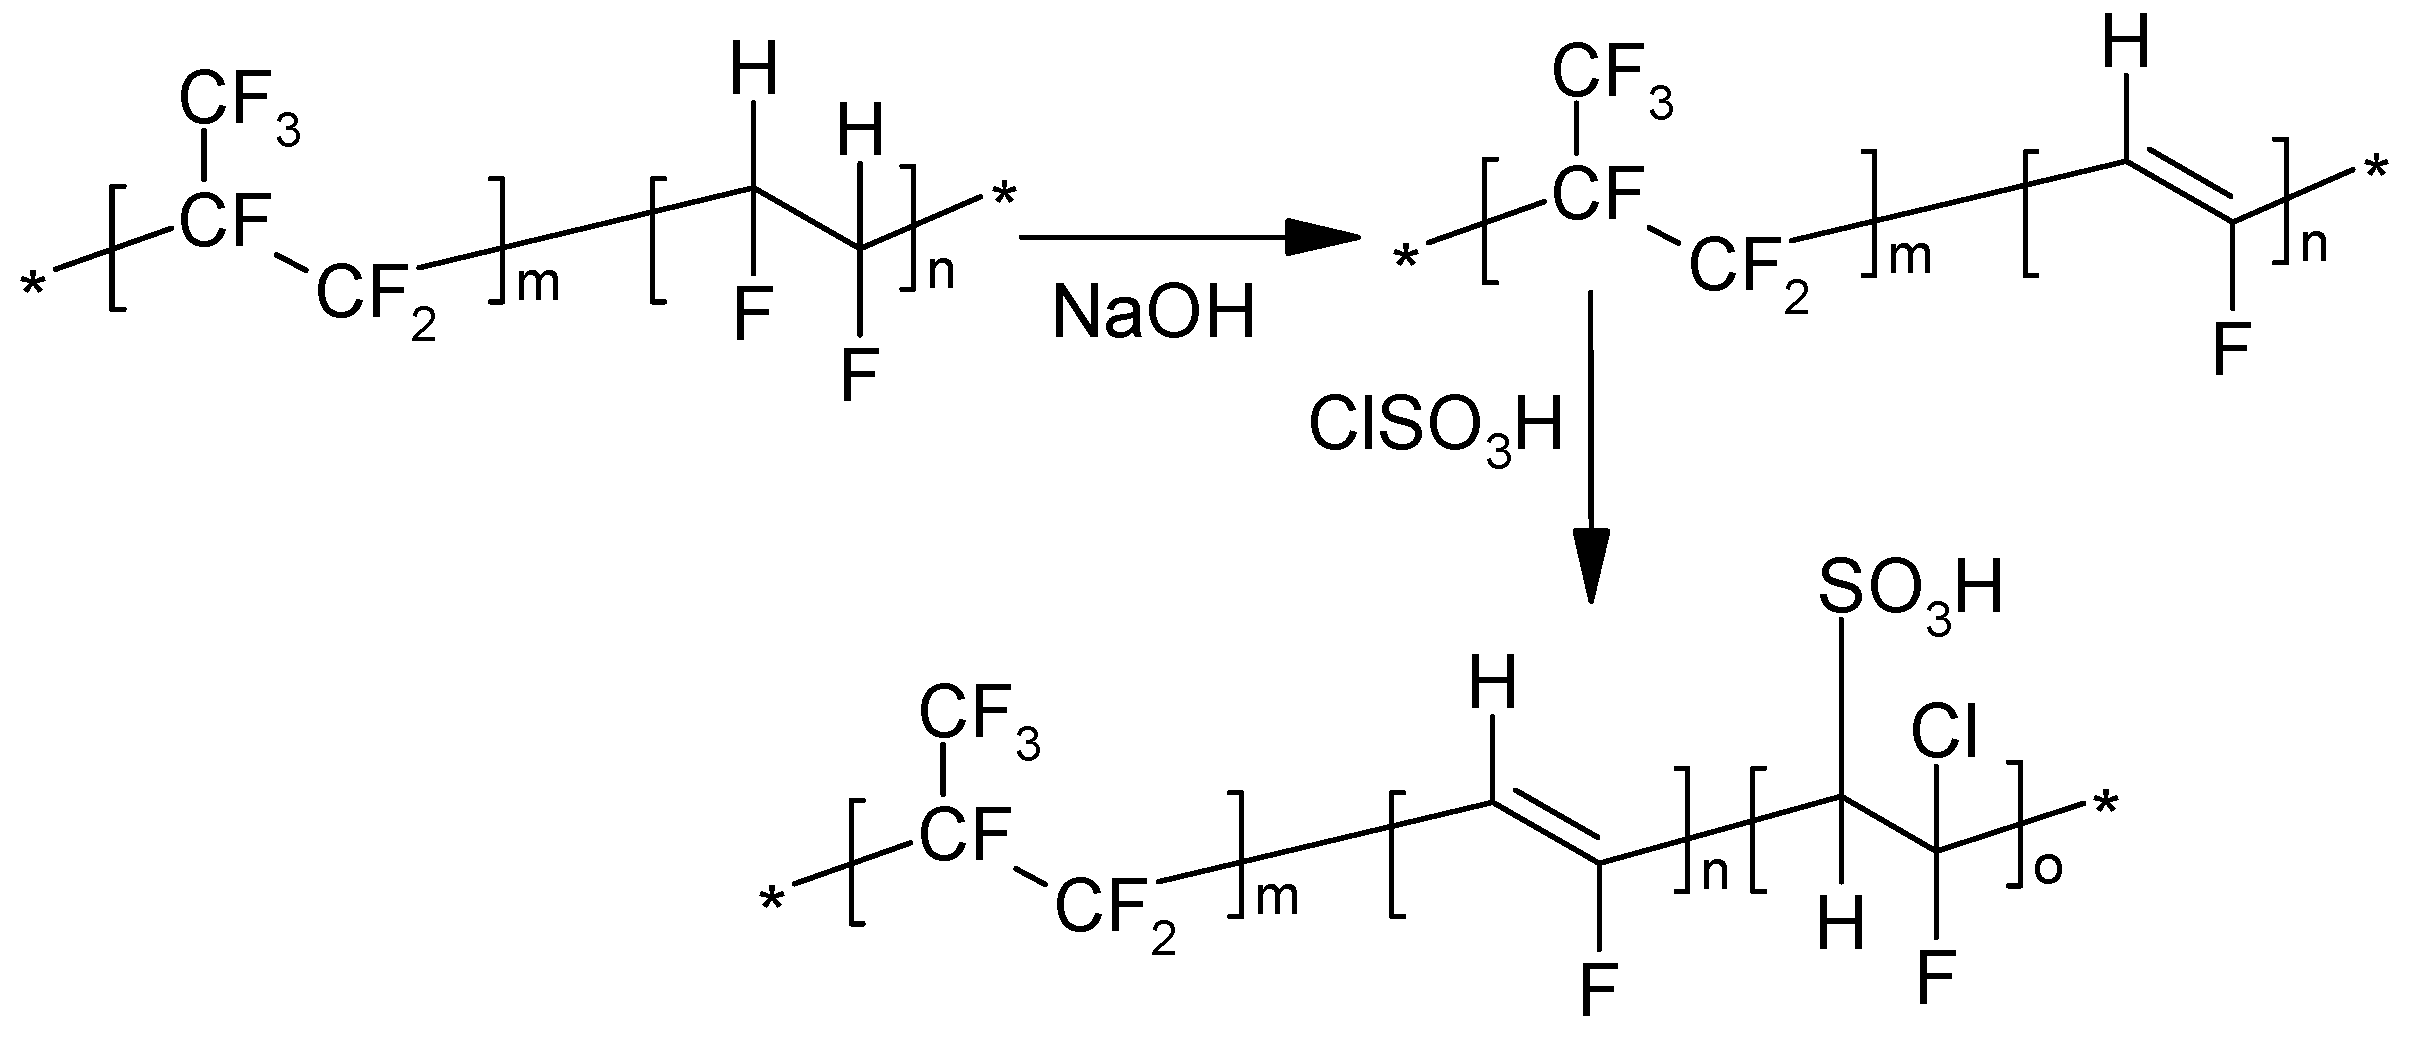
PVDF-co-HFP was modified by sulfonation in order to introduce some hydrophilicity onto the material and improve its compatibility with the sulfonic acid-terminated HPSU. As shown in
Scheme 2, the sulfonation was achieved through dehydrofluorination of the vinylidene fluoride moieties followed by the addition of chlorosulfonic acid to the double bonds. The dehydrofluorination was done in DMAc using dilute solutions in order to prevent formation of black, insoluble product as was observed by Bottino
et al. [
27] This precipitation is likely due to highly conjugated, crosslinked product, which traps the alkali solvent (normally an alcohol) in which the PVDF-co-HFP is insoluble. It was also found that the use of isopropyl alcohol instead of methanol and vigorous stirring, combined with slow addition of the reactant was necessary to prevent precipitation of the product.
Scheme 2.
Sulfonation of PVDF-co-HFP.
Scheme 2.
Sulfonation of PVDF-co-HFP.
Previous studies on the sulfonation of PVDF-co-HFP [
27,
28] used concentrated acids as they were performed on polymer solids, however, such procedure is likely to give rise to non-uniformity within the material, and, thus, in this study the sulfonation was done in solution. Chlorosulfonic acid was chosen due to its high reactivity, and the sulfonation was done in dilute solutions of the dehydrofluorinated PVDF-co-HFP in 1-methyl-pyrrolidinone (NMP) with vigorous stirring in order to prevent precipitation of the sulfonated product. High temperature was not used in order to prevent crosslinking and gelling of the dehydrofluorinated PVDF-co-HFP.
The sulfonated PVDF-co-HFP (S-PVDF) is soluble in DMAc and NMP and shows a small water uptake and IEC, but due to the low value of the IEC (<0.1 meq/g) it could not be accurately measured. It appears that due to the mild reaction conditions and low temperature used, only a small amount of sulfonation was achieved. This means that the majority of the double bonds remain unsulfonated (and unreacted as the S-PVDF remains highly soluble in DMAc), which in this case is desirable as they would be available for crosslinking during the casting of the composite membrane, which would help to immobilize the HPSU within the S-PVDF matrix.
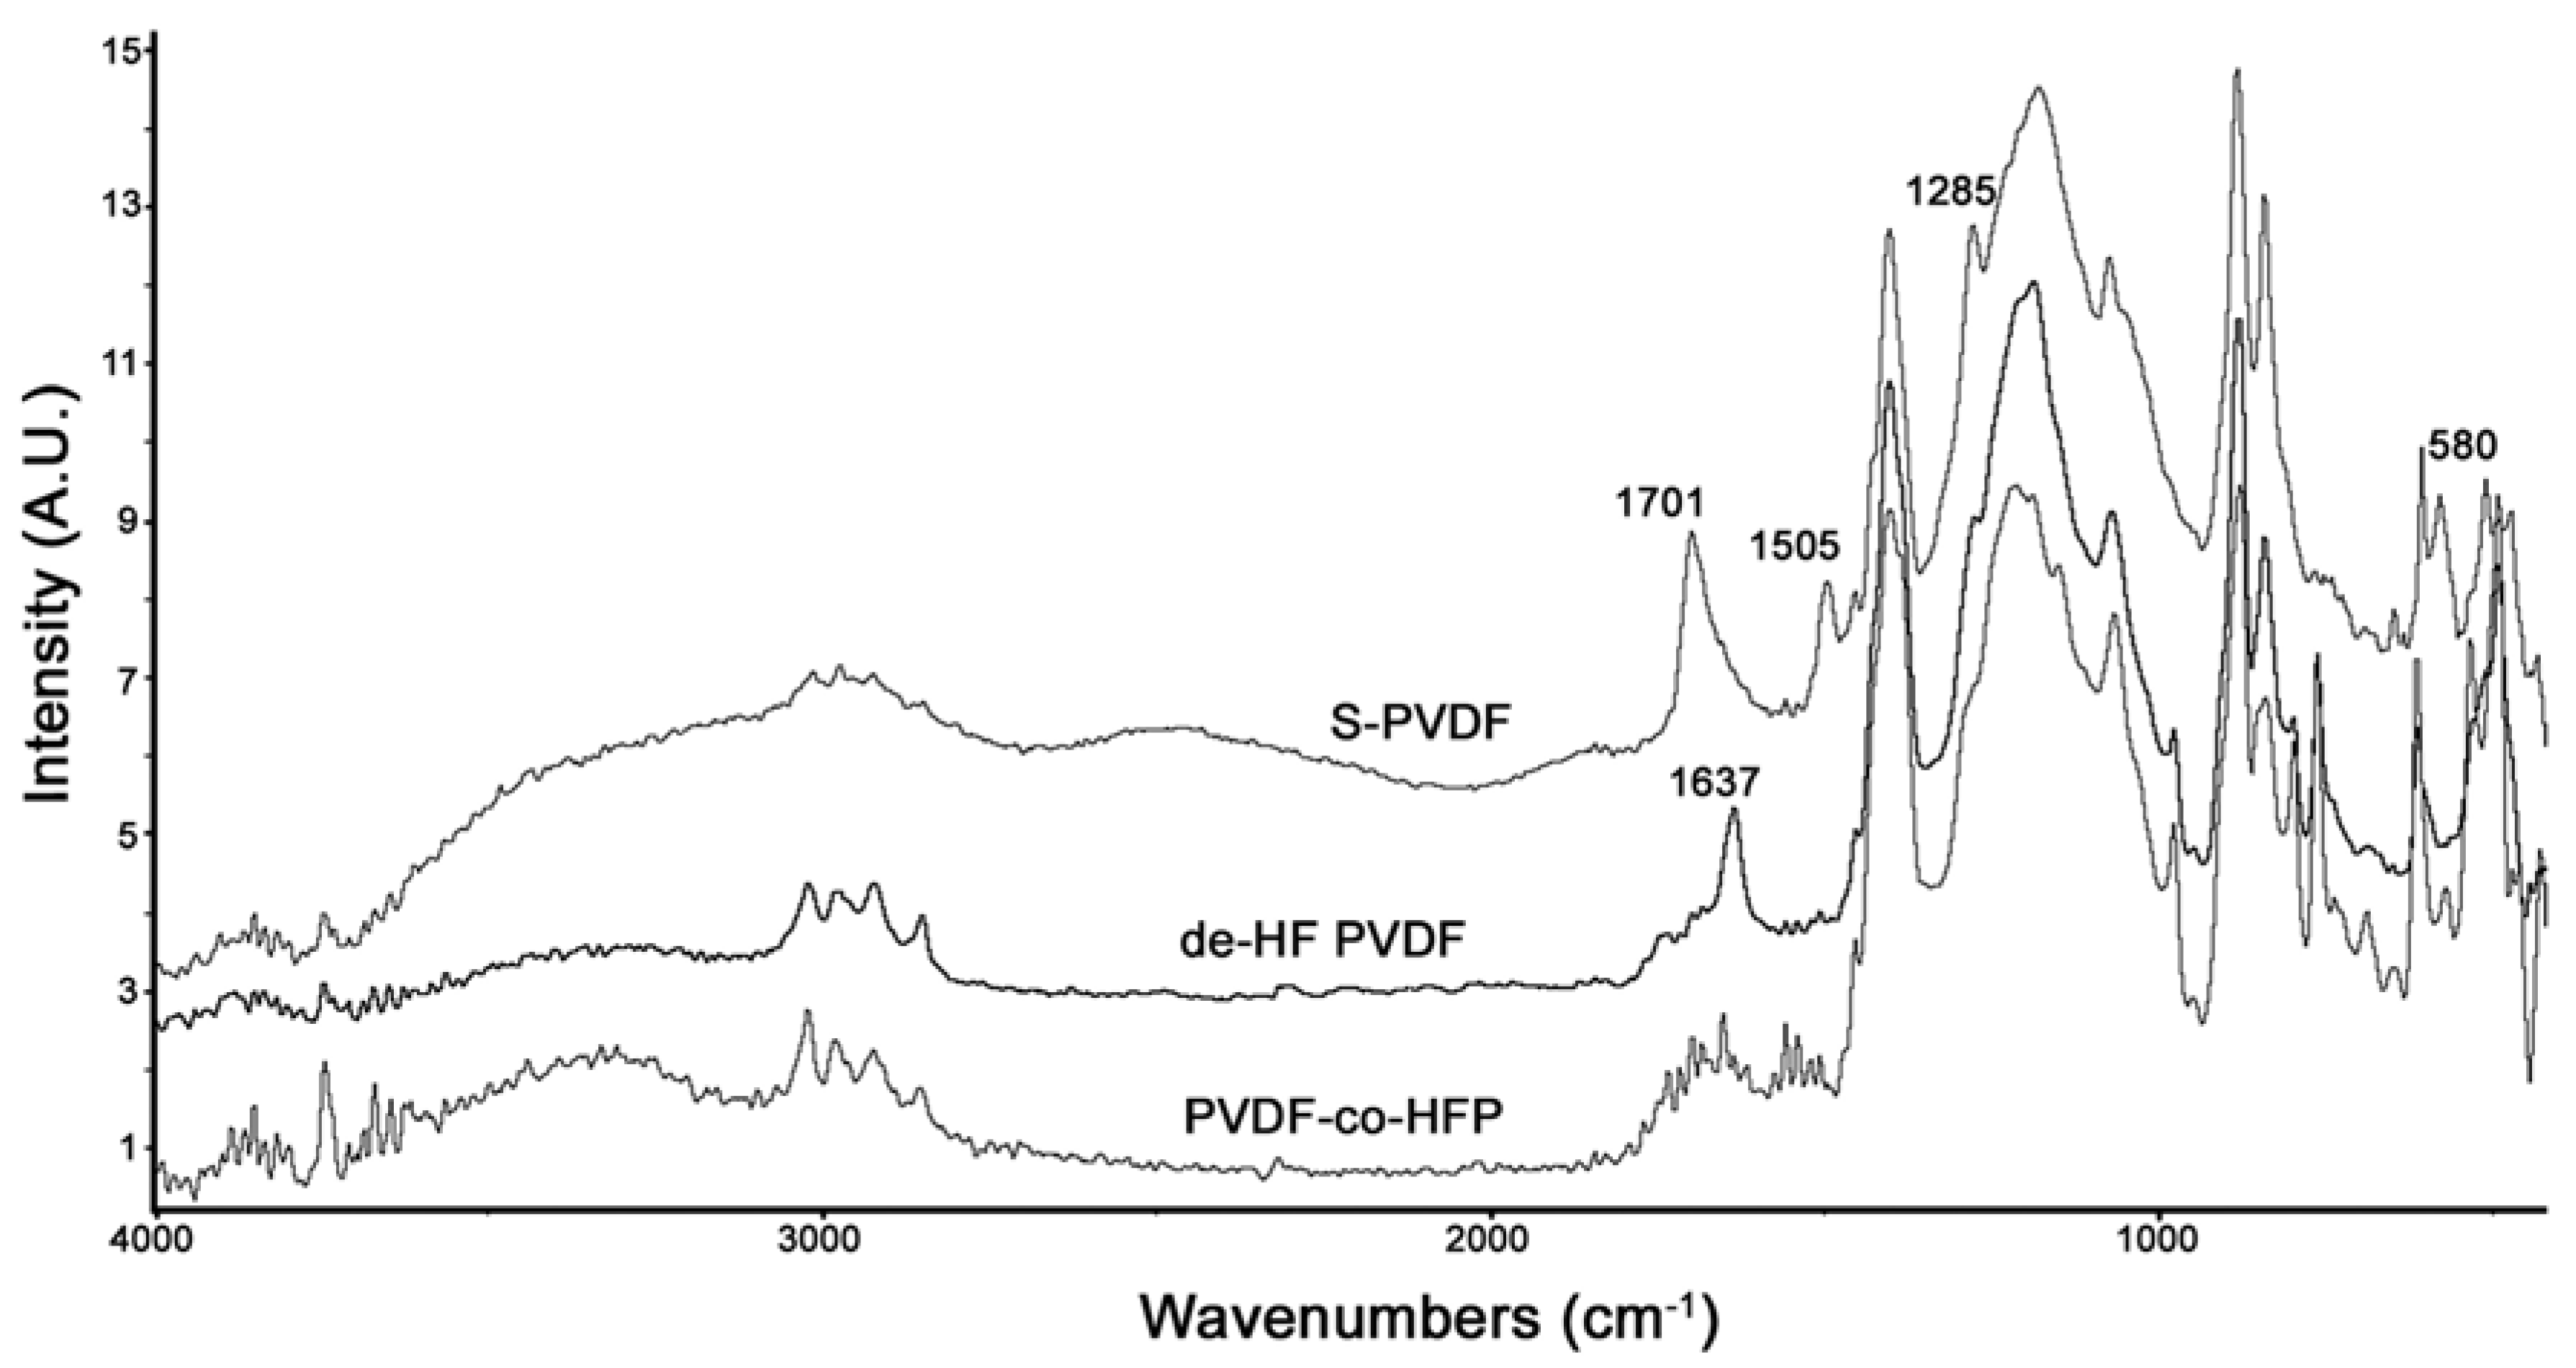
Figure 4 shows the comparison between the PA-FTIR spectra of PVDF-co-HFP, dehydrofluorinated PVDF-co-HFP, and S-PVDF. As can be seen, dehydrofluorination results in a new peak at 1637 cm
−1 due to the double bonds. After sulfonation, this peak has broadened and shifted to 1701 cm
−1. Sulfonation also resulted in a very broad peak at 3300–3500 cm
−1 and a peak at 1285 cm
−1 which is attributed to the sulfonic acid group. The peaks at 1505 and 580 cm
−1 are likely due to the presence of C–Cl bands present due to the use of chlorosulfonic acid.
Figure 4.
Photoacoustic FTIR spectra comparison between PVDF-co-HFP, dehydrofluorinated PVDF-co-HFP, and S-PVDF.
Figure 4.
Photoacoustic FTIR spectra comparison between PVDF-co-HFP, dehydrofluorinated PVDF-co-HFP, and S-PVDF.
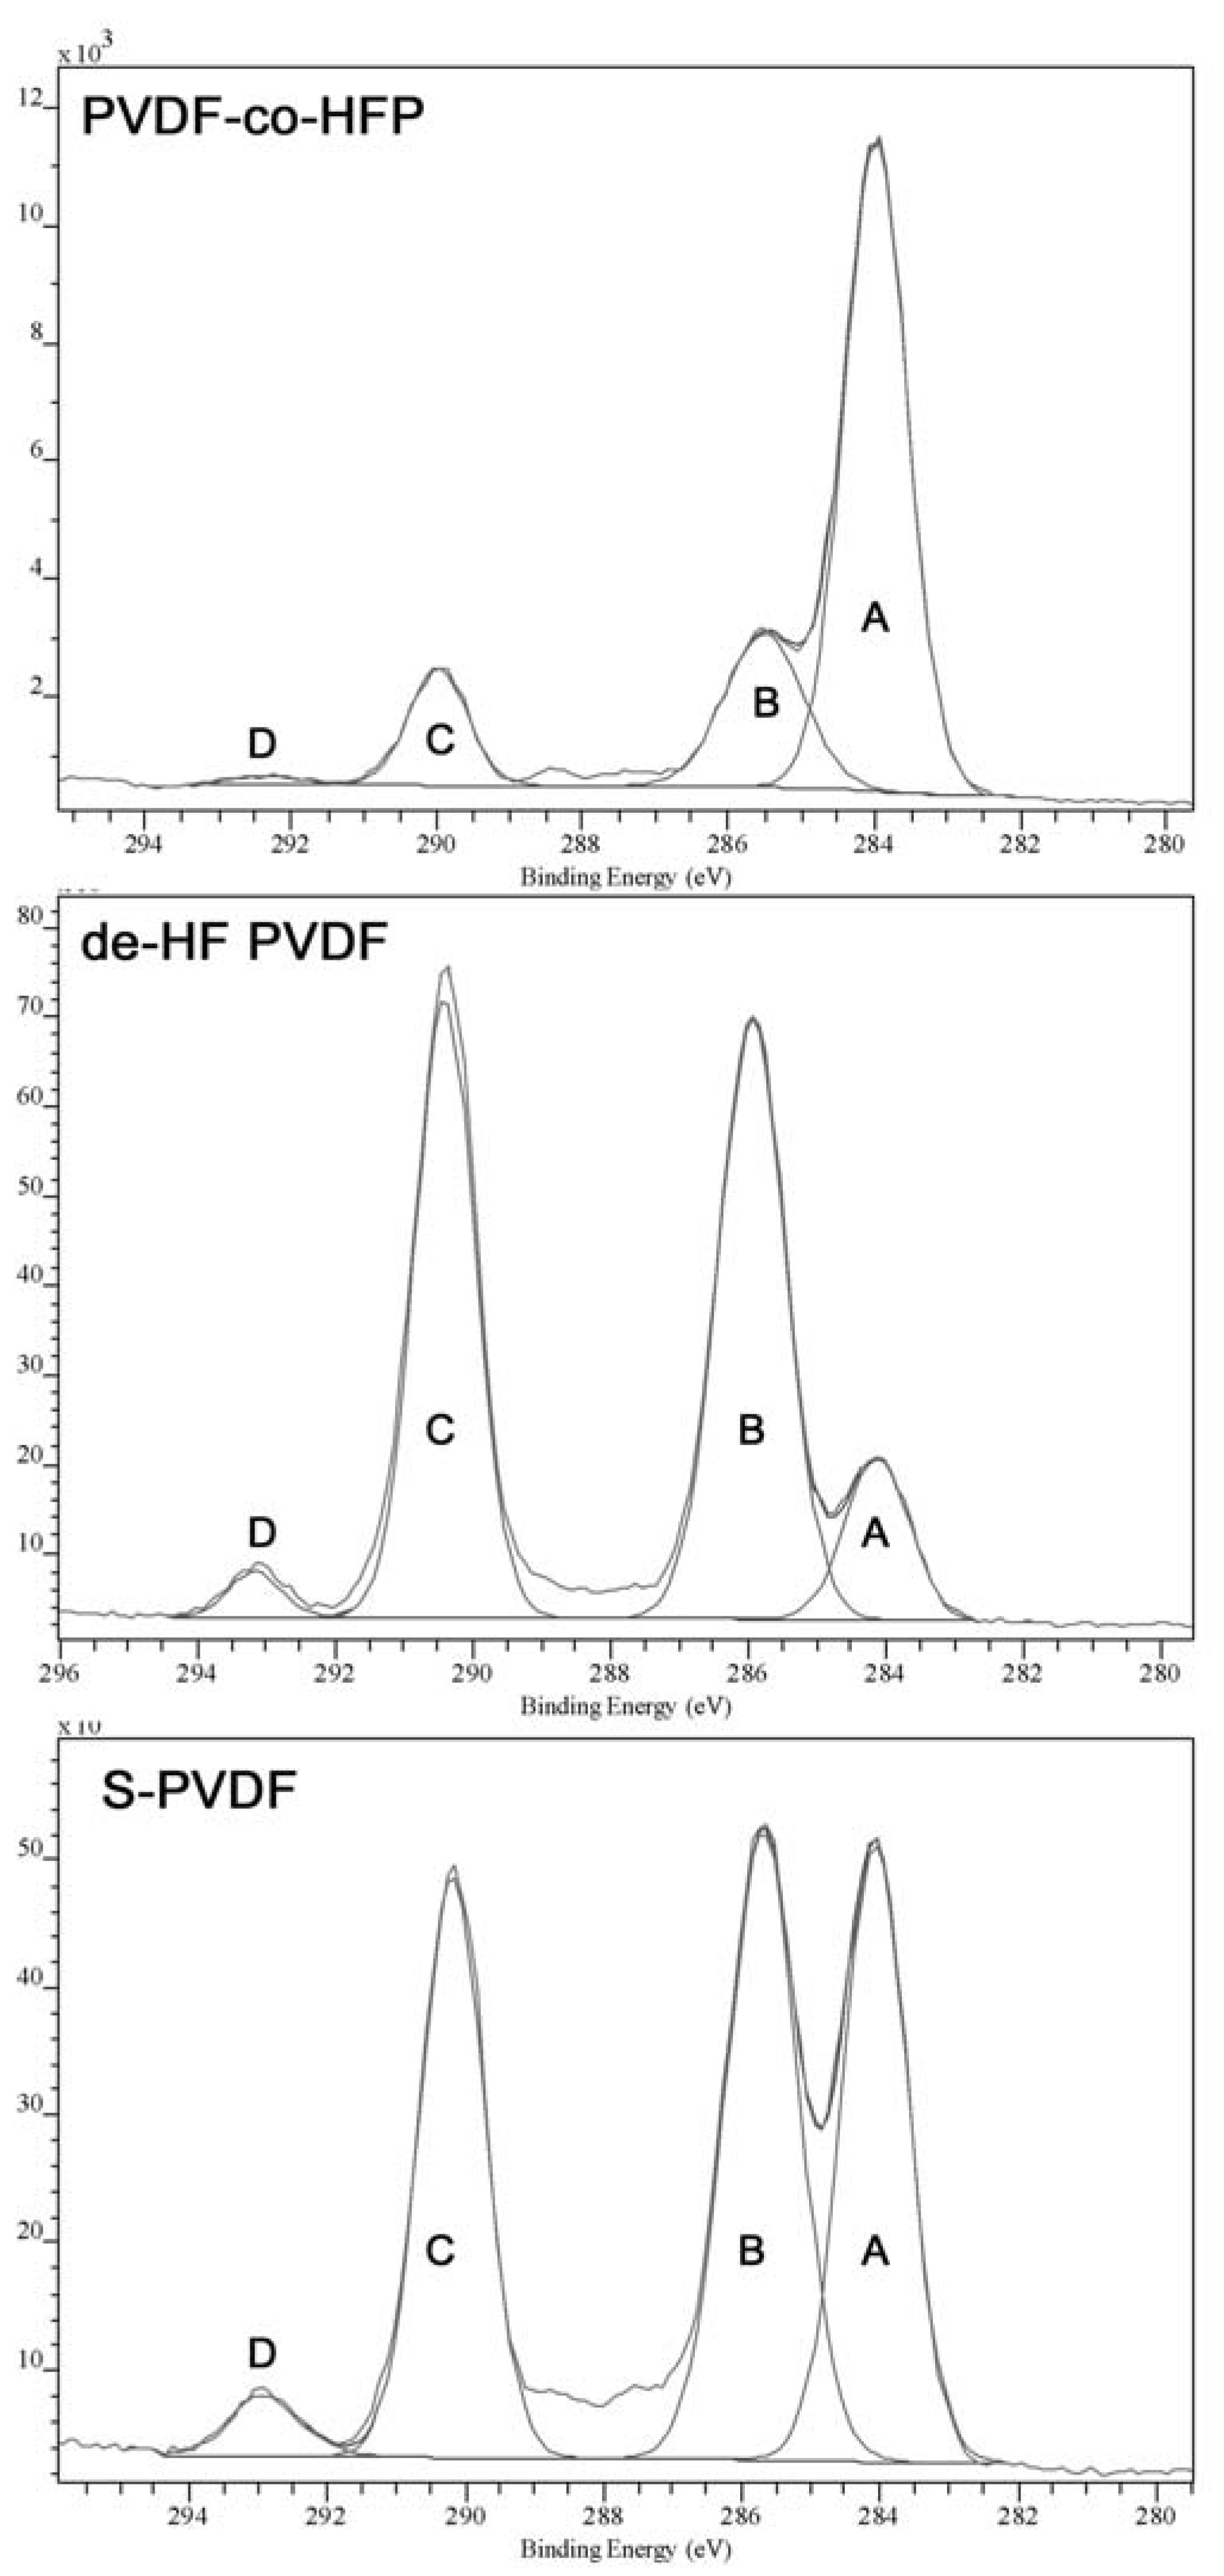
The low IEC value is due to the very low degree of sulfonation, which has been quantified through XPS and elemental analysis. Both analyses methods show only a small amount of sulfur in the material. Elemental analysis shows a 0.1%–0.3% of sulfur in the material, while XPS shows 0.2%–0.4% of sulfur. The XPS high resolution C1s spectra comparison also shows significant difference between the PVDF-co-HFP samples after dehydrofluorination or sulfonation. The peak fitting of C1S is given in
Figure 5, which shows that the spectrum has four main peaks at around 284, 285.5, 290, and 292.5 eV, labelled “A” to “D”, respectively. Although the actual number of peaks in the spectrum is likely to be higher, extra peaks may produce greater inaccuracies in the peak fitting and thus the analysis will be concerned mainly with the four main peaks, which are quite well-defined. As can be seen from
Table 2, chemical modification of the sample has resulted in Peak D becoming more prominent as well as being shifted to higher B.E. (binding energy), which is attributed to the effect of double bonds or sulfonic acid groups present in the modified polymer.
Figure 5.
High resolution XPS C1s spectrum of PVDF-co-HFP, dehydrofluorinated PVDF-co-HFP, and S-PVDF.
Figure 5.
High resolution XPS C1s spectrum of PVDF-co-HFP, dehydrofluorinated PVDF-co-HFP, and S-PVDF.
Table 2.
Binding energy assignments in high-resolution C1s XPS.
Table 2.
Binding energy assignments in high-resolution C1s XPS.
| Peak Label (Approx. B.E.) | Functional Group Assignment | B.E. (PVDF-co-HFP, Aldrich) | B.E. (dehydro fluorinated PVDF-co-HFP) | B.E. (S-PVDF) |
|---|
| A (284 eV) | –C–C– | 284 eV | 284 eV | 284 eV |
| B (285 eV) | –HCF– | 285.5 eV | 285.9 eV | 285.7 eV |
| C (290 eV) | –CF2–, –HC= | 290.0 eV | 290.4 eV | 290.2 eV |
| D (292 eV) | –CF3, –FC=, –FC–SO3H | 292.3 eV | 293.2 eV | 292.9 eV |
Table 3 shows the comparison of the peak area ratio between Peak B (predominantly influenced by vinylidene fluoride) and Peak C (predominantly influenced by hexafluoropropylene) also shows that dehydrofluorination is occurring with Peak B becoming less prominent as the vinylidene fluoride segments are dehydrofluorinated.
Table 3.
Peak area ratio of Peaks B and C in the high-resolution C1s spectra.
Table 3.
Peak area ratio of Peaks B and C in the high-resolution C1s spectra.
| Sample | Peak Area Ratio (Peak B/Peak C) |
|---|
| PVDF-co-HFP | 1.72 |
| De-HF PVDF | 1.09 |
| S-PVDF | 1.22 |
3.3. Casting of SPVDF-HPSU Composite Membrane
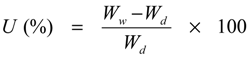
The S-PVDF/HPSU blend membranes were made by solvent casting from a mixture of DMAc (for S-PVDF) and DMSO (for HPSU). The two solutions were fully miscible, and there were no sign of phase separation during casting. The solvents were chosen for their miscibility and similar boiling points, which would prevent one solvent being completely removed before the other. Casting of the composite was done at high temperature to drive off the solvent and promote annealing of the sample, as subjecting SPVDF to high temperature promotes cross-linking in the sample and reduces their solubility. Sample dried at 120 °C shows good stability, and after annealing it also shows only a very small mass loss (<1%) upon leaching in water. The composite membrane also shows increased water uptake compared to blank S-PVDF membranes.
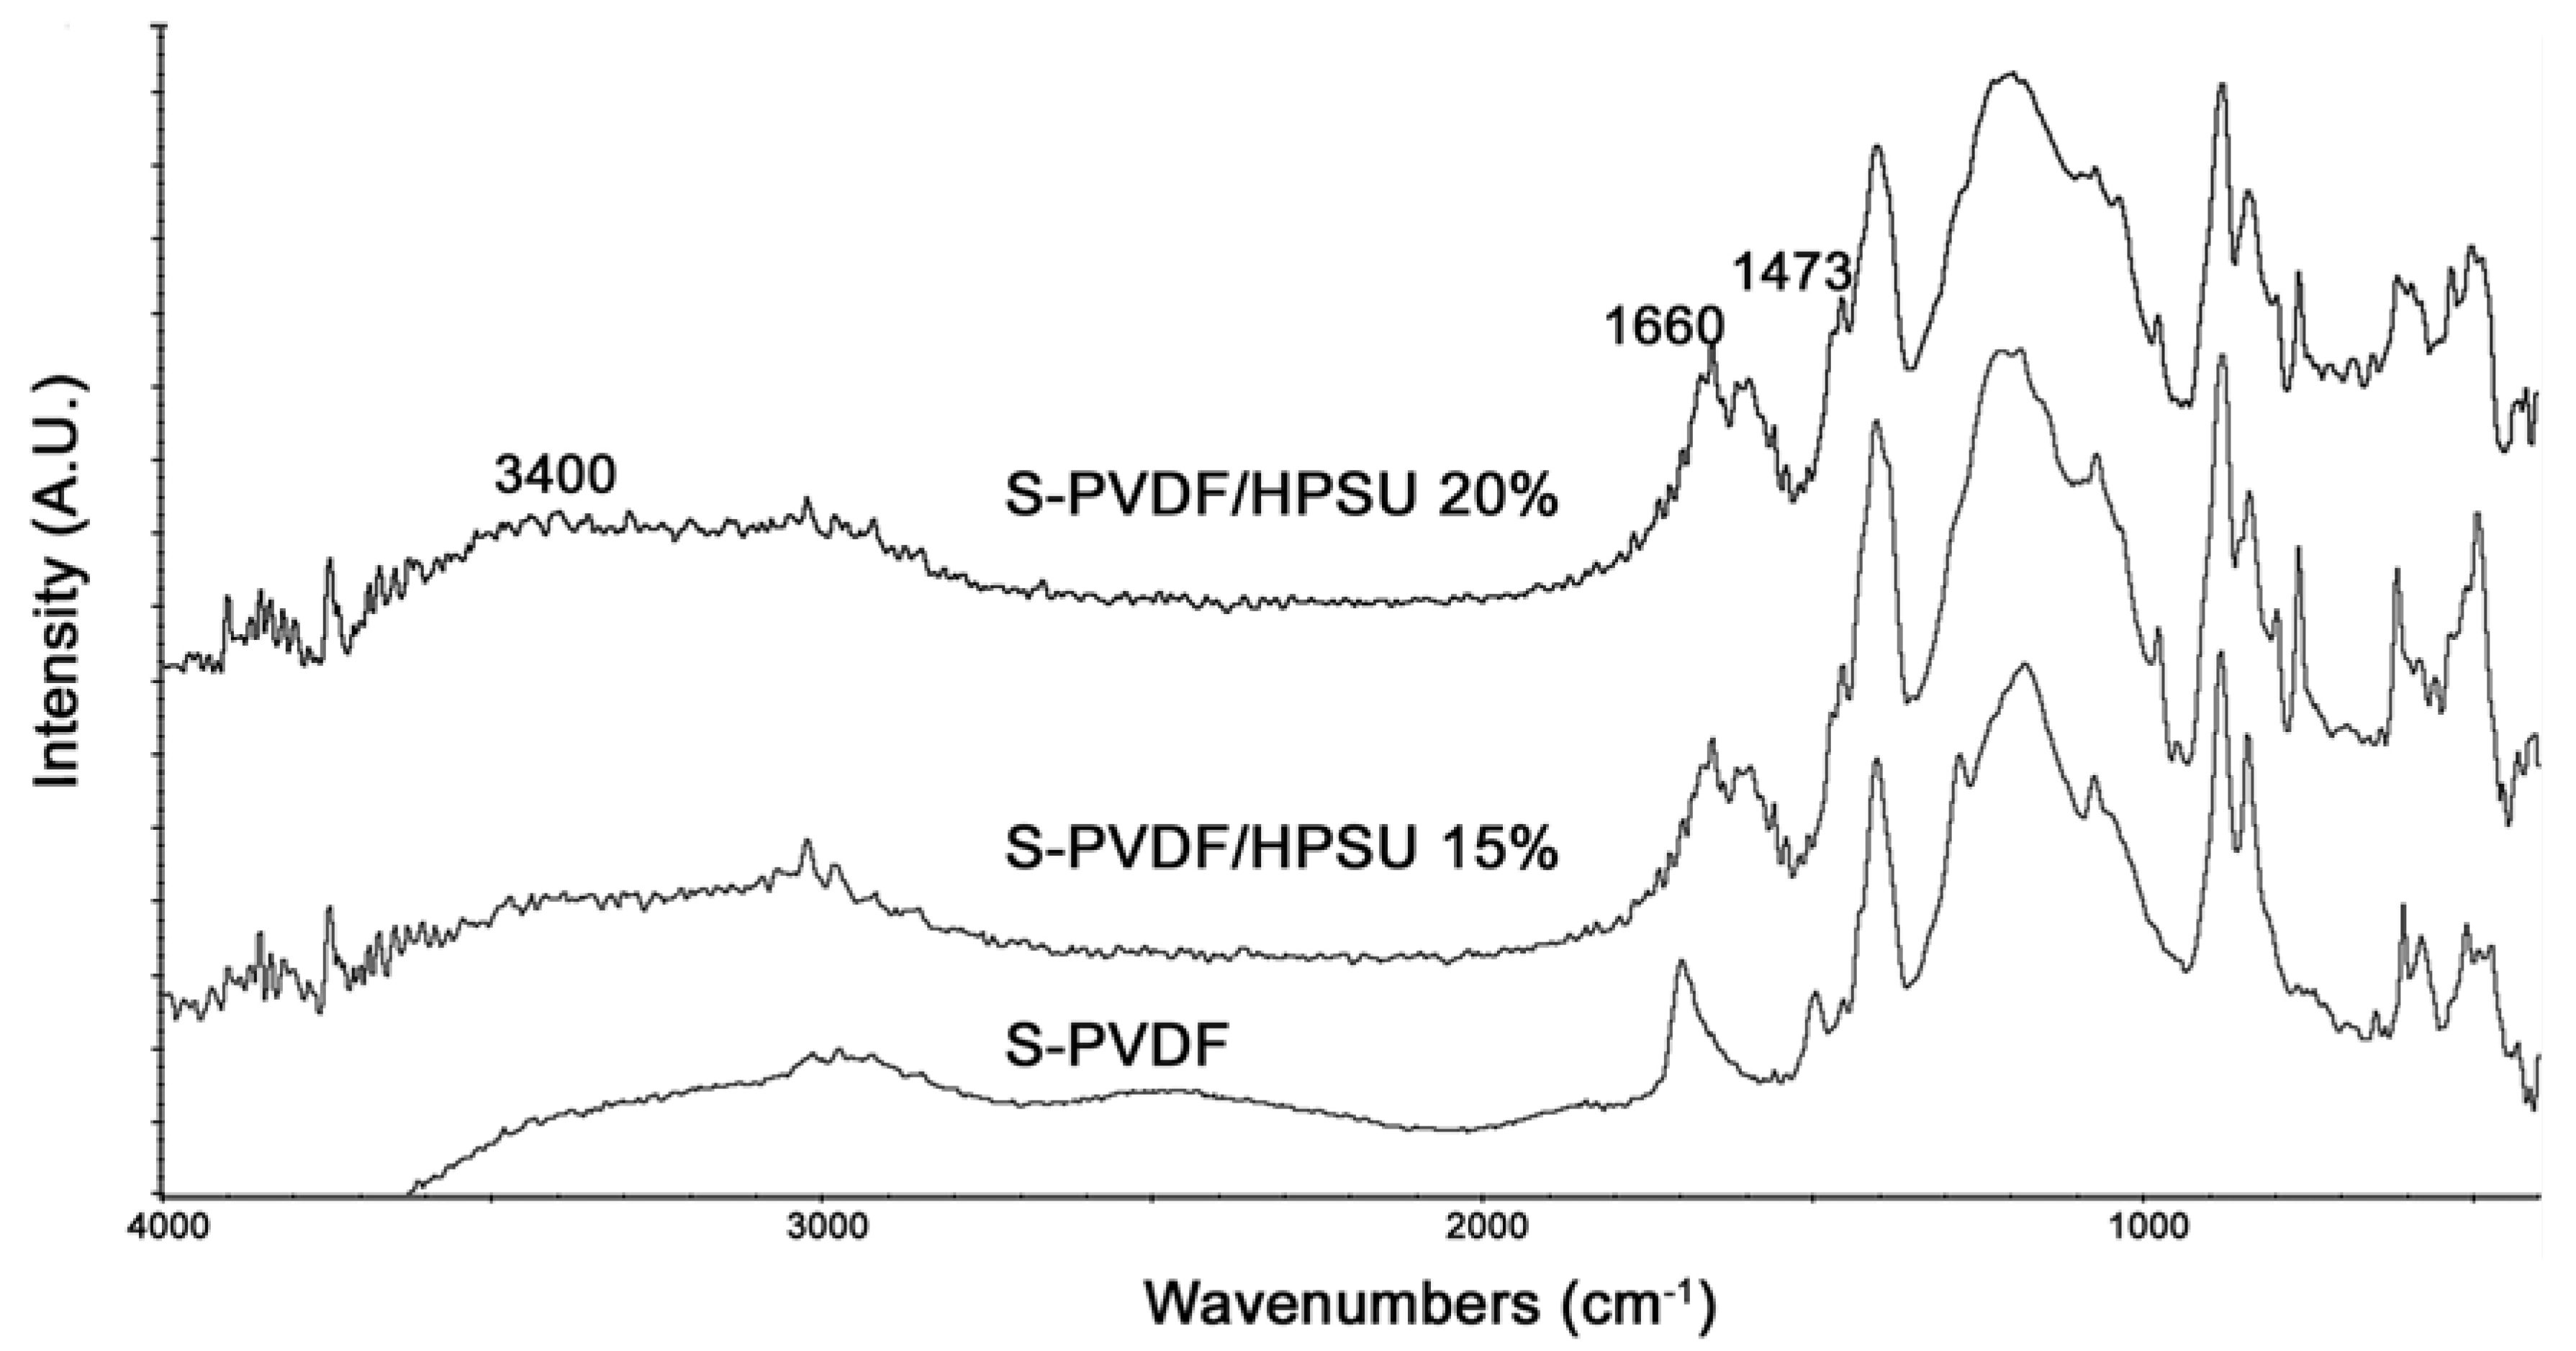
FTIR spectrum of the composite in
Figure 6 shows an increase in the peak at 3400, 1660, and 1473 cm
−1 with increasing hyperbranched PSU content due to the sulfonic acid and sulfone functionalities in the HPSU. The peak due to unsaturation at 1700 cm
−1 has also appeared to be suppressed, which indicates that annealing of the sample have promoted crosslinking of the PVDF-co-HFP matrix.
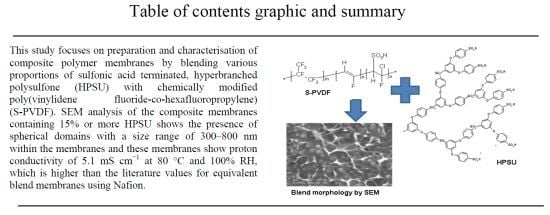
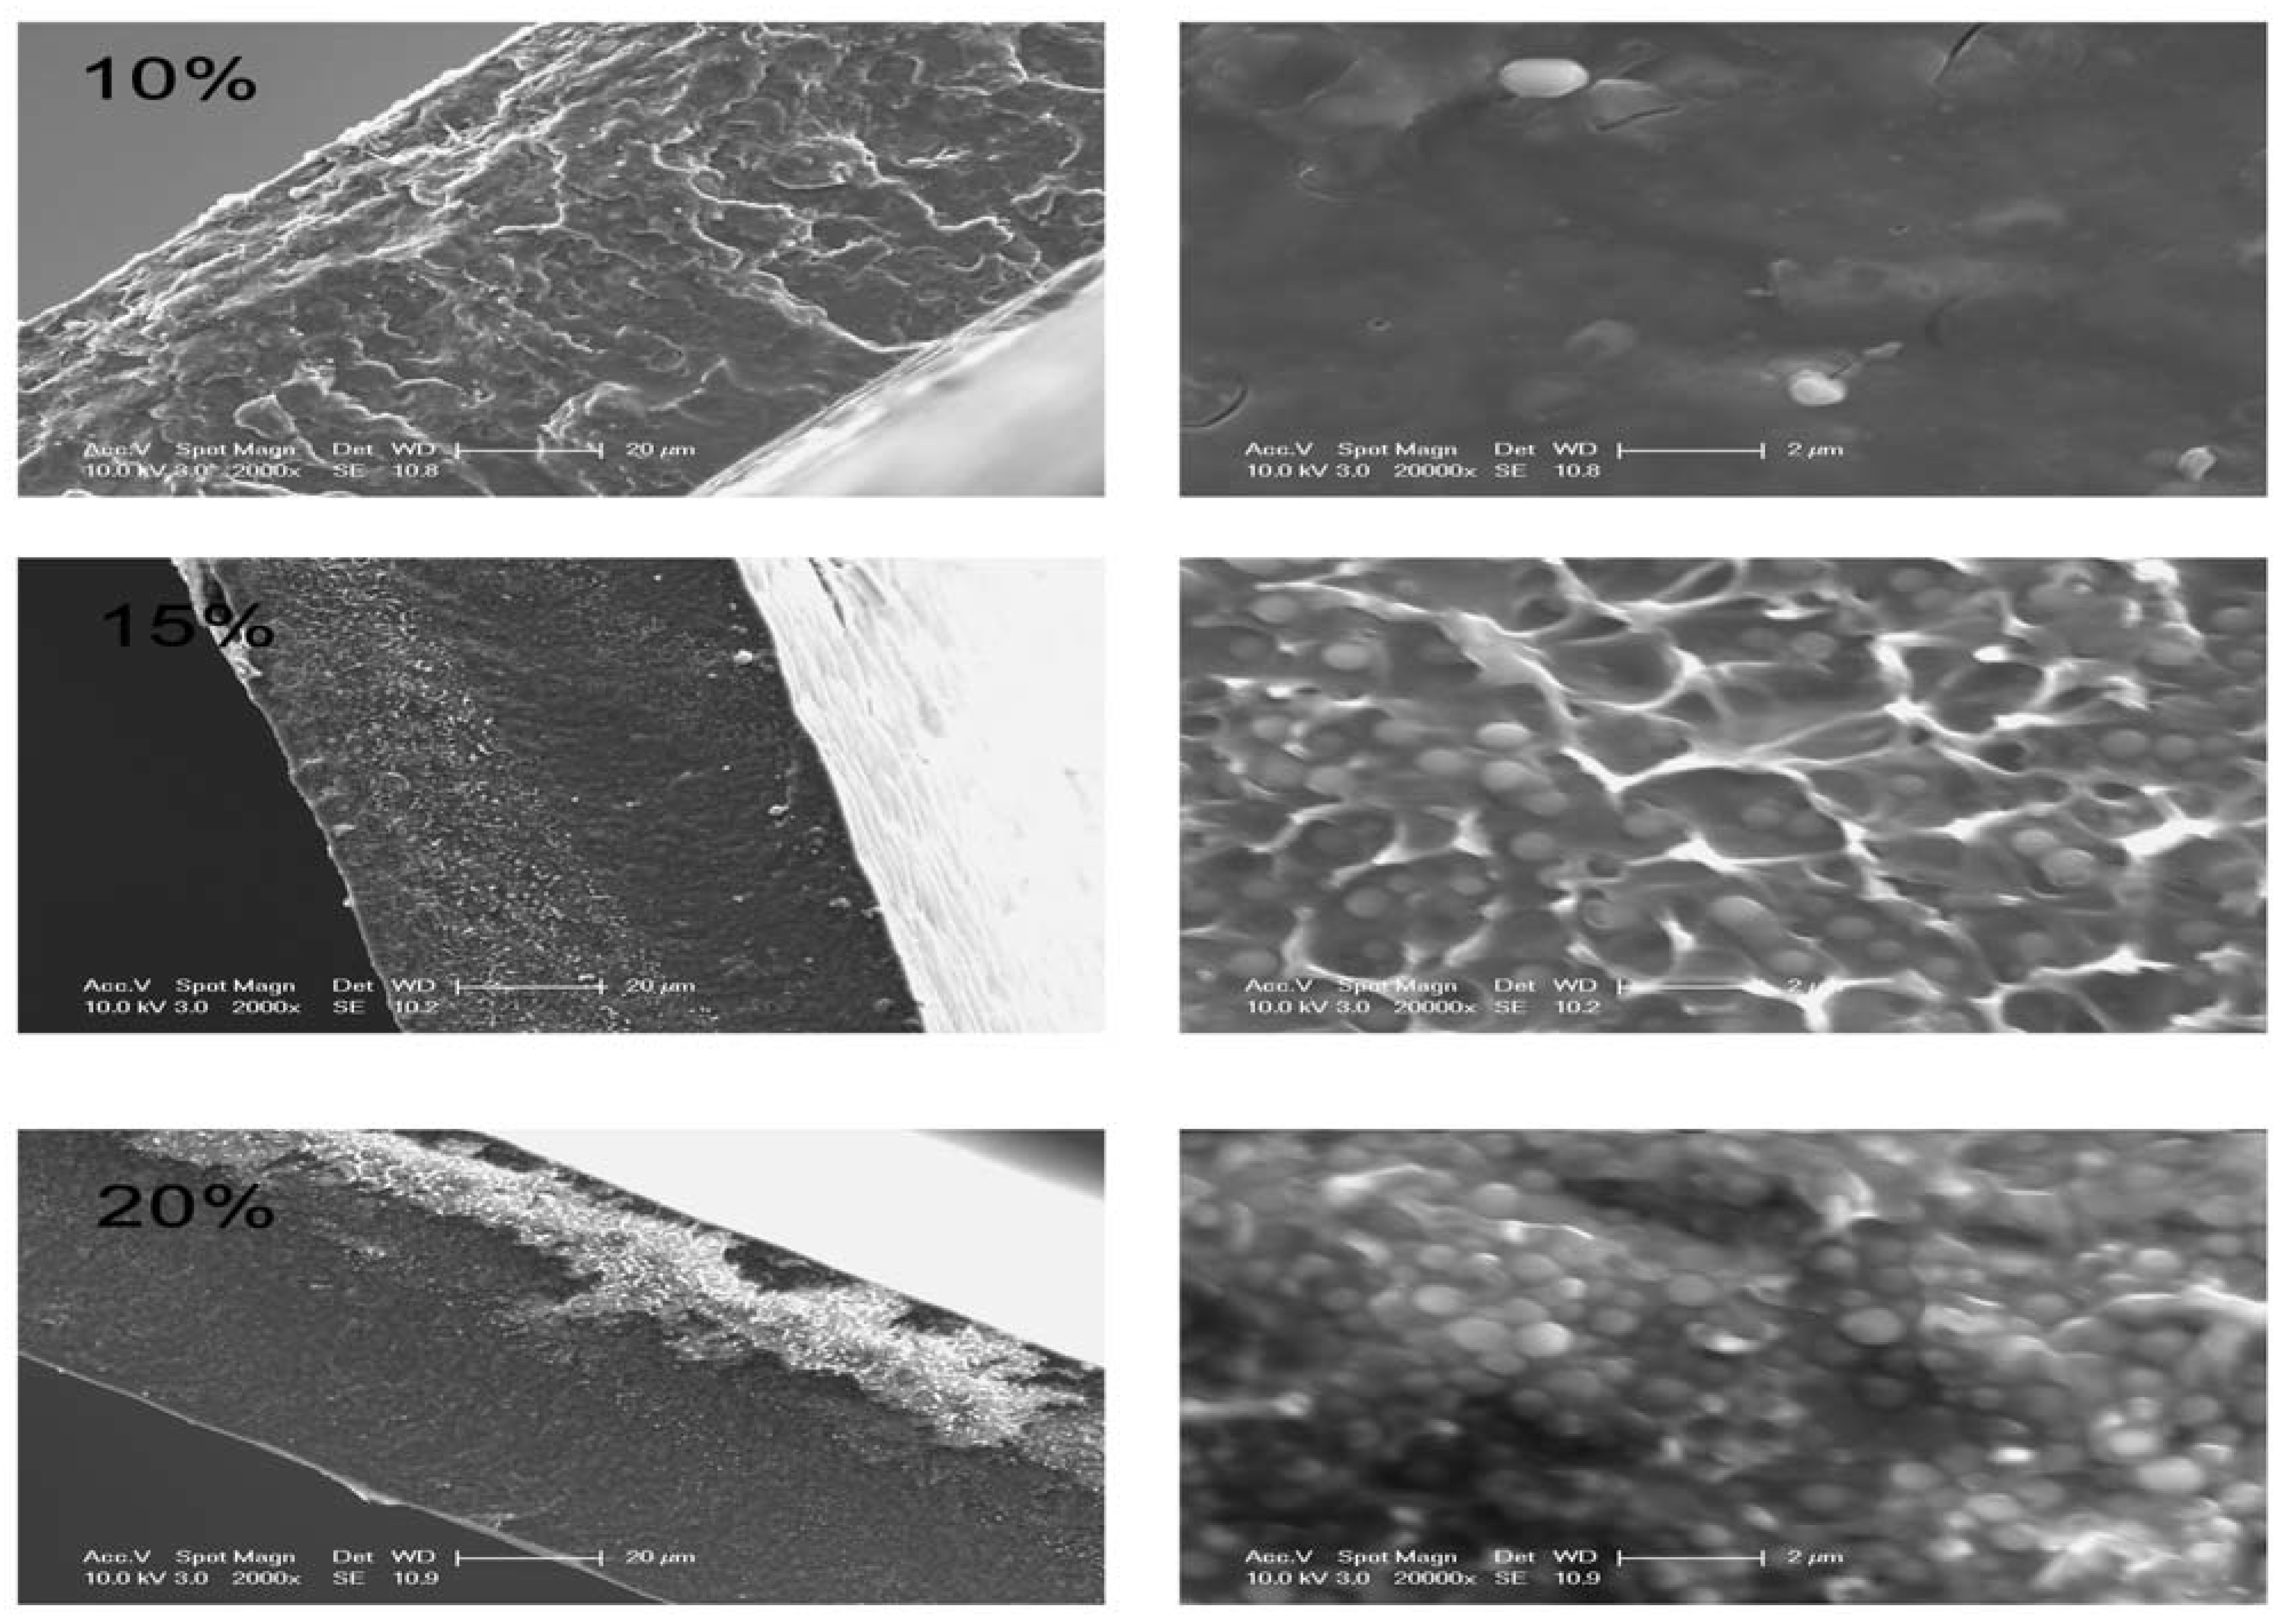
The composite was cast as a continuous film without any visual evidence of phase separation between the S-PVDF and HPSU in solution during casting. SEM images of the cross section of the film in
Figure 6 (left column images at a magnification of 20 μm) show a smooth, continuous film, without pores or excessive phase separation between the S-PVDF and HPSU. However, as can be seen in
Figure 7 (right column images at a magnification of 2 μm), there were some spherical domains, which were observed for samples containing 15% HPSU or more. The domains appear to be uniformly distributed and of similar size regardless of HPSU content. As can be seen from
Figure 7, the spherical domains are typically around 300–800 nm in diameter. The number of these spherical domains visible increases with HPSU content, indicating that the observed morphology is due to the HPSU.
Figure 6.
PA-FTIR Spectra of S-PVDF and the S-PVDF/HPSU composite.
Figure 6.
PA-FTIR Spectra of S-PVDF and the S-PVDF/HPSU composite.
Figure 7.
Cross section SEM images of the S-PVDF/HPSU composite membranes with 10%, 15% (volume %) HPSU (magnifications: left images 20 μm; right images: magnified view at 2 μm). Sample cross section was obtained by fracturing the membranes in liquid N2.
Figure 7.
Cross section SEM images of the S-PVDF/HPSU composite membranes with 10%, 15% (volume %) HPSU (magnifications: left images 20 μm; right images: magnified view at 2 μm). Sample cross section was obtained by fracturing the membranes in liquid N2.
As the PVDF-co-HFP was sulfonated in the vinylidene fluoride regions, these domains would be due to phase separation between polar areas of predominantly vinylidene fluoride/HPSU and nonpolar, hexafluoropropylene areas. The number of the spherical domains seems to increase with HPSU content as the HPSU forms the spherical domain. EDX analysis in
Table 4 shows an increase in sulphur content on the spherical domains compared to the matrix, confirming that the HPSU is contained within these domains. The presence of such spherical domains of quite uniform shape and size is of interest, as it has not been commonly observed with PVDF/ionomer blends, however, the spherical phase separation is similar to what has been observed with grafted [
22] or block [
7] polysulfone/PVDF composite. Such domains may have arisen due to the annealing process, as aggregates of HPSU are trapped by the crosslinking of the PVDF matrix. This is because the site for dehydrofluorination and sulfonation both relies on vinylidene fluoride segments, with hexafluoropropylene segments being inert and unchanged and, thus, acting as the matrix linking the domains.
Table 4.
Elemental analysis of a composite membrane containing 15% HPSU by SEM EDX.
Table 4.
Elemental analysis of a composite membrane containing 15% HPSU by SEM EDX.
| Area Analysed | Sulphur Content (Atom %) |
|---|
| Matrix | 3.91 |
| Spherical Particles | 5.95 |
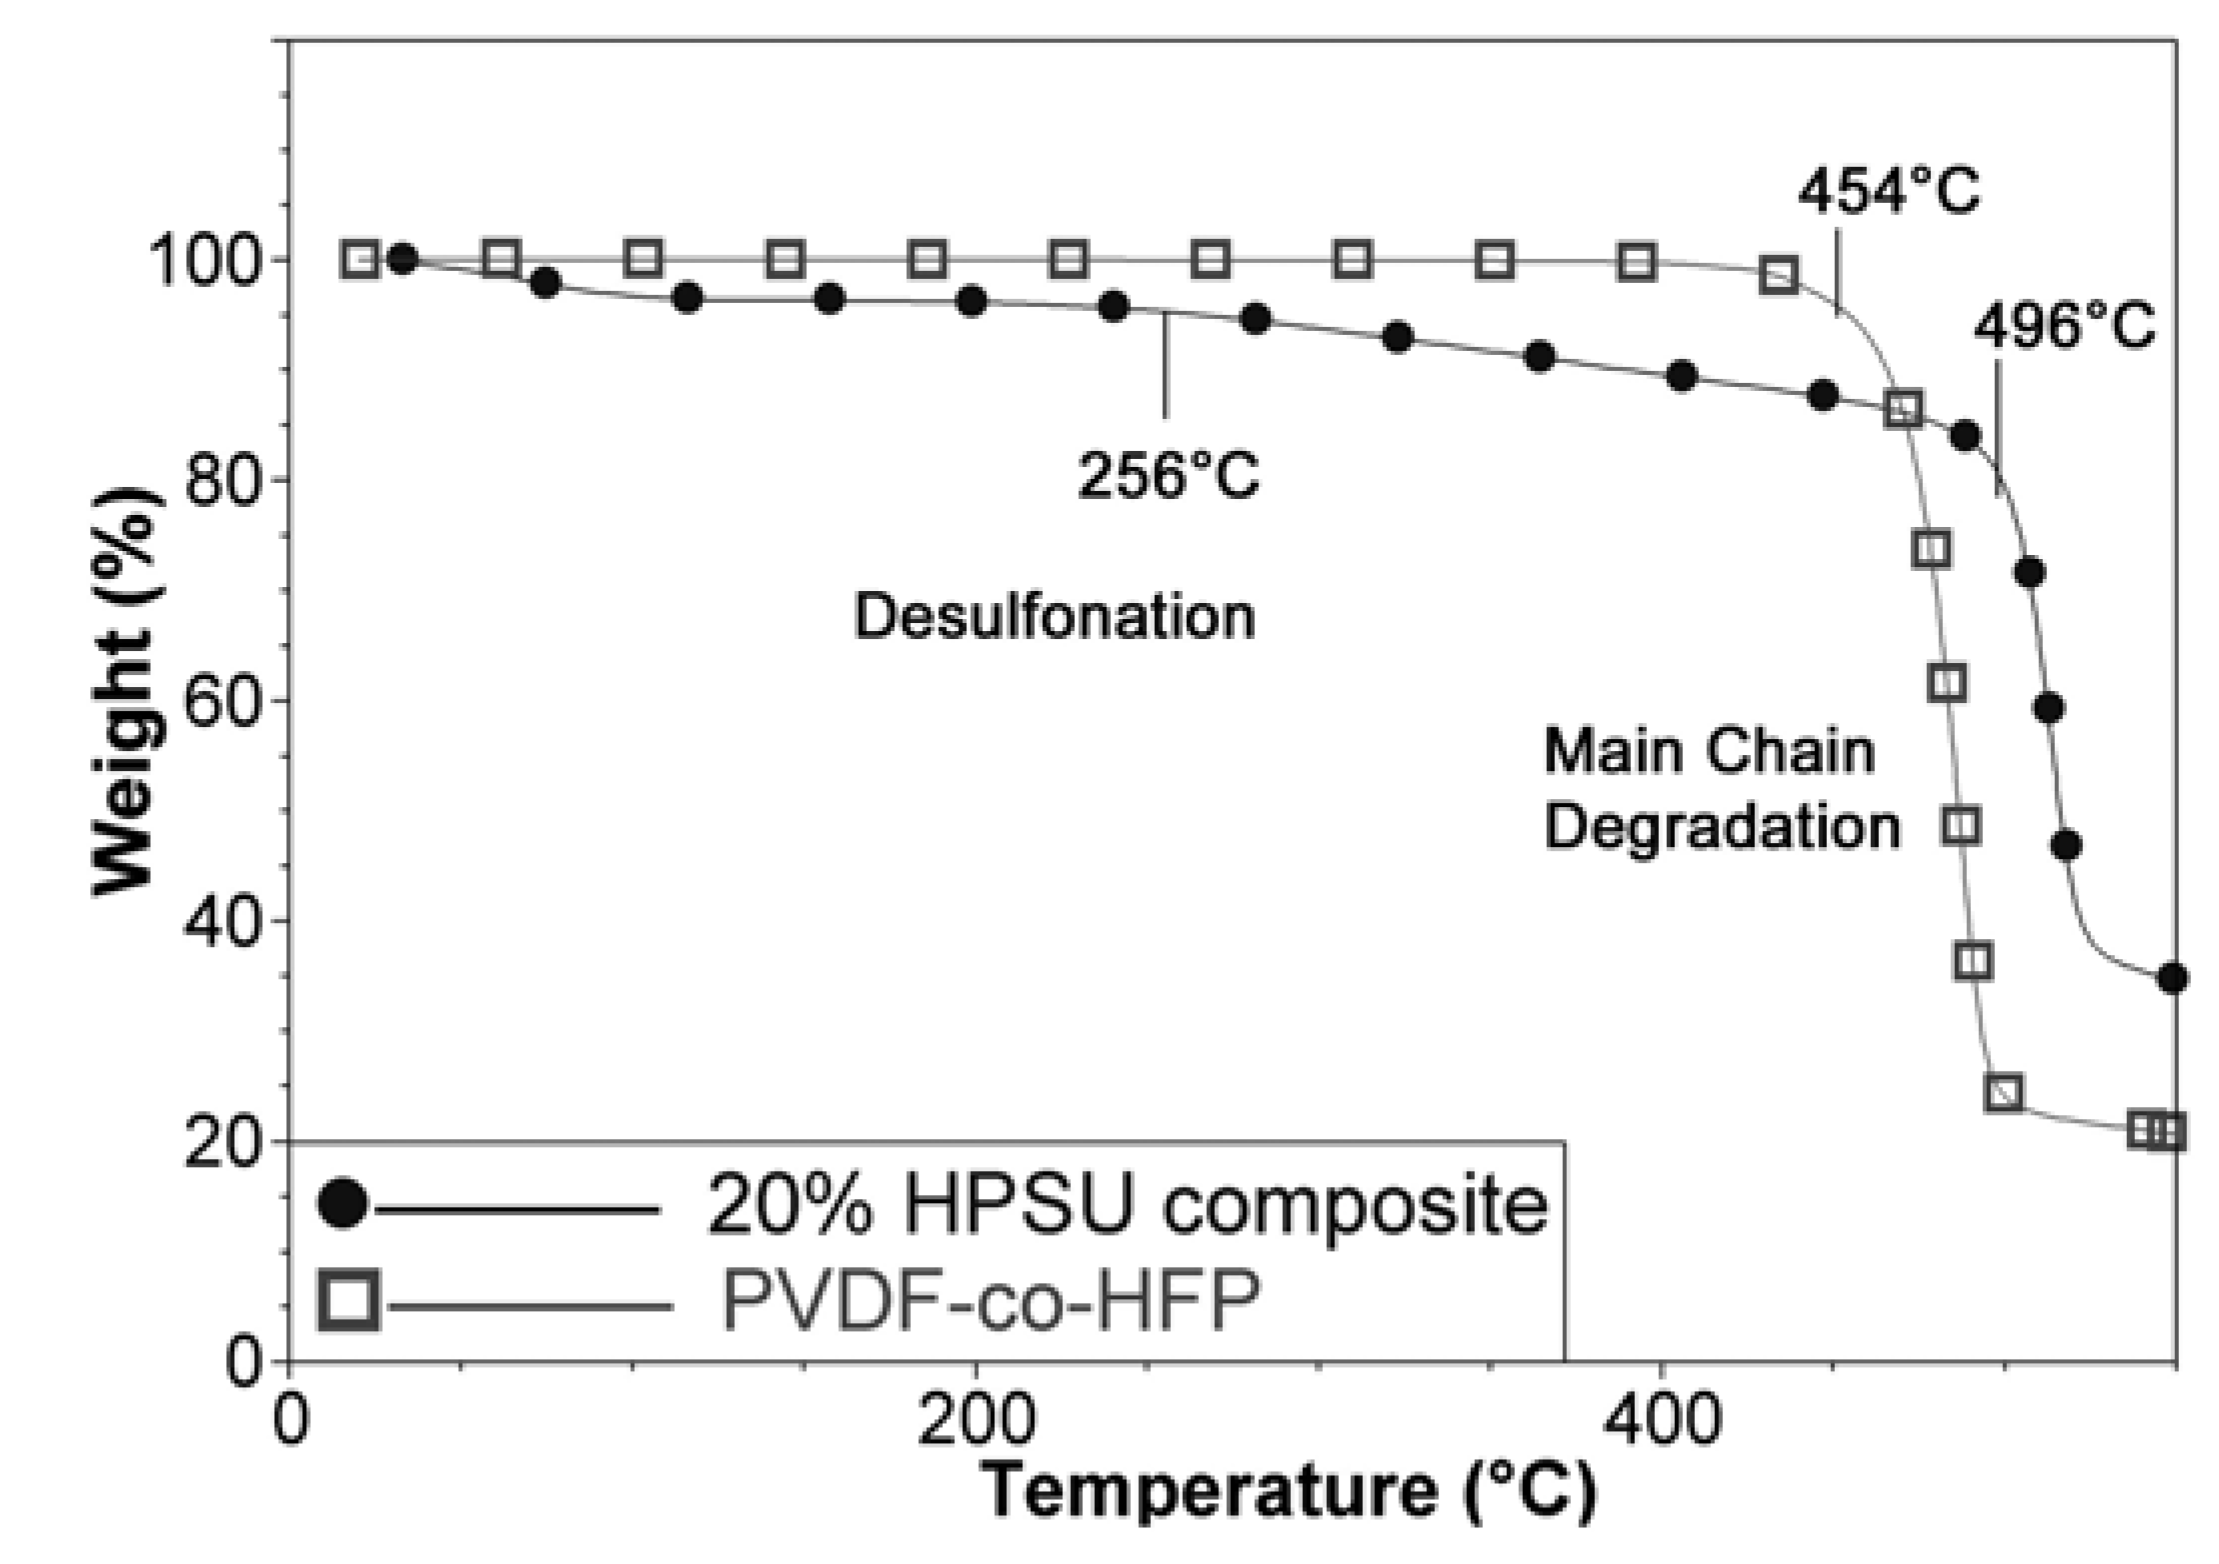
TGA analysis of the composite membrane shows two decomposition temperatures around 260 °C and 490 °C due to desulfonation and main chain degradation respectively. The appearance of water loss and desulfonation shows that the HPSU has been incorporated in the material, as S-PVDF alone contains too little sulfonic acid groups to show appreciable mass loss due to desulfonation. Furthermore, TGA comparison in
Figure 8 shows that the main chain degradation in the composite membrane occurs at higher temperature (496 °C) than the main chain degradation temperature of 450 °C for untreated PVDF-co-HFP. This is attributed to annealing and crosslinking of the residual double bonds present due to dehydrofluorination (as only a small amount are sulfonated), resulting in higher thermal stability of the composite membrane.
Figure 8.
TGA spectra of the blend membrane (20% HPSU) and untreated PVDF-co-HFP.
Figure 8.
TGA spectra of the blend membrane (20% HPSU) and untreated PVDF-co-HFP.
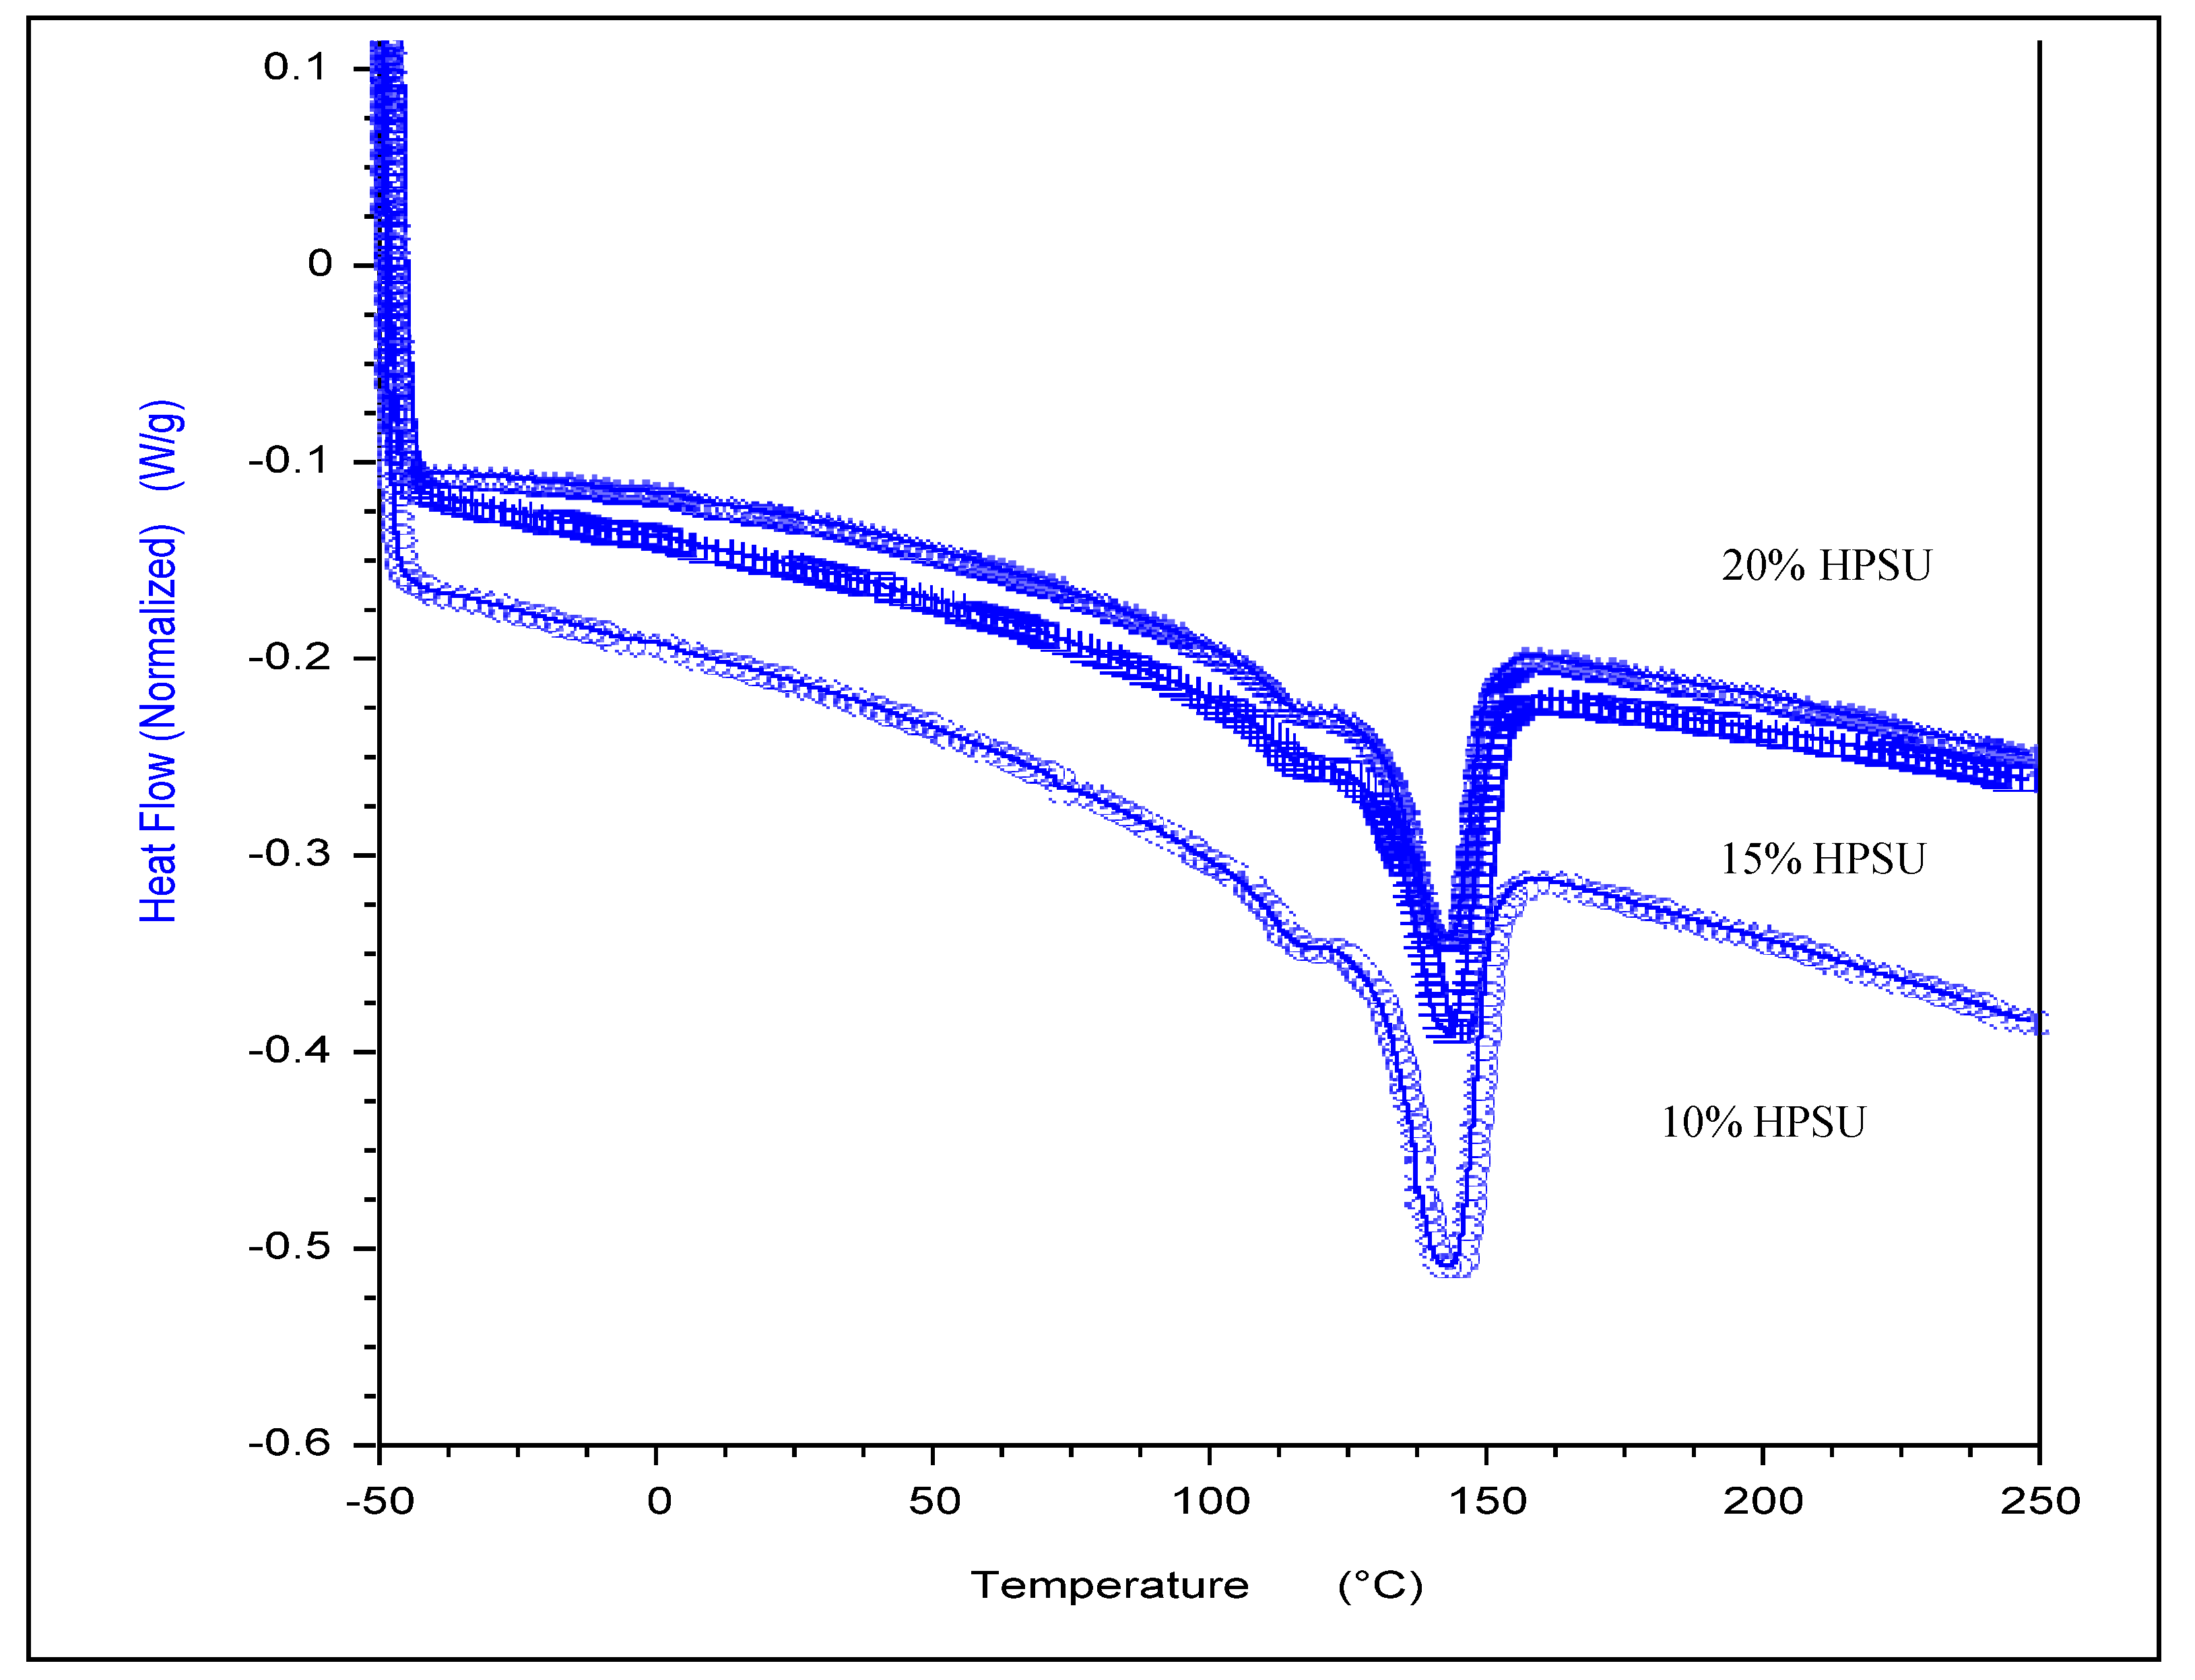
DSC curves for blend membranes under nitrogen in the range of −50 to 250 °C are shown in
Figure 9. Pure PVDF-HFP shows only a melting peak at 140 °C. The membranes show a large endothermic peak at 140 °C. This peak is related to the
Tm of PVDF-HFP. The small endothermic peak ~110 °C in all the samples is due to release of bound water, as also evidenced by TGA results, which is associated with hydrophilic HPSU content, as it can retain greater content of water molecules (2%–5%).While the slight lowering of enthalpy of melting (
Tm) for the fluoropolymer may indicate a small degree of mixing of minor component of HPSU with the PVDF-HFP amorphous segments, the blends are essentially incompatible. Therefore, phase separation between HPSU and PVDF-HFP contributes to the formation of droplet structure of HPSU in the PVDF-HFP matrix.
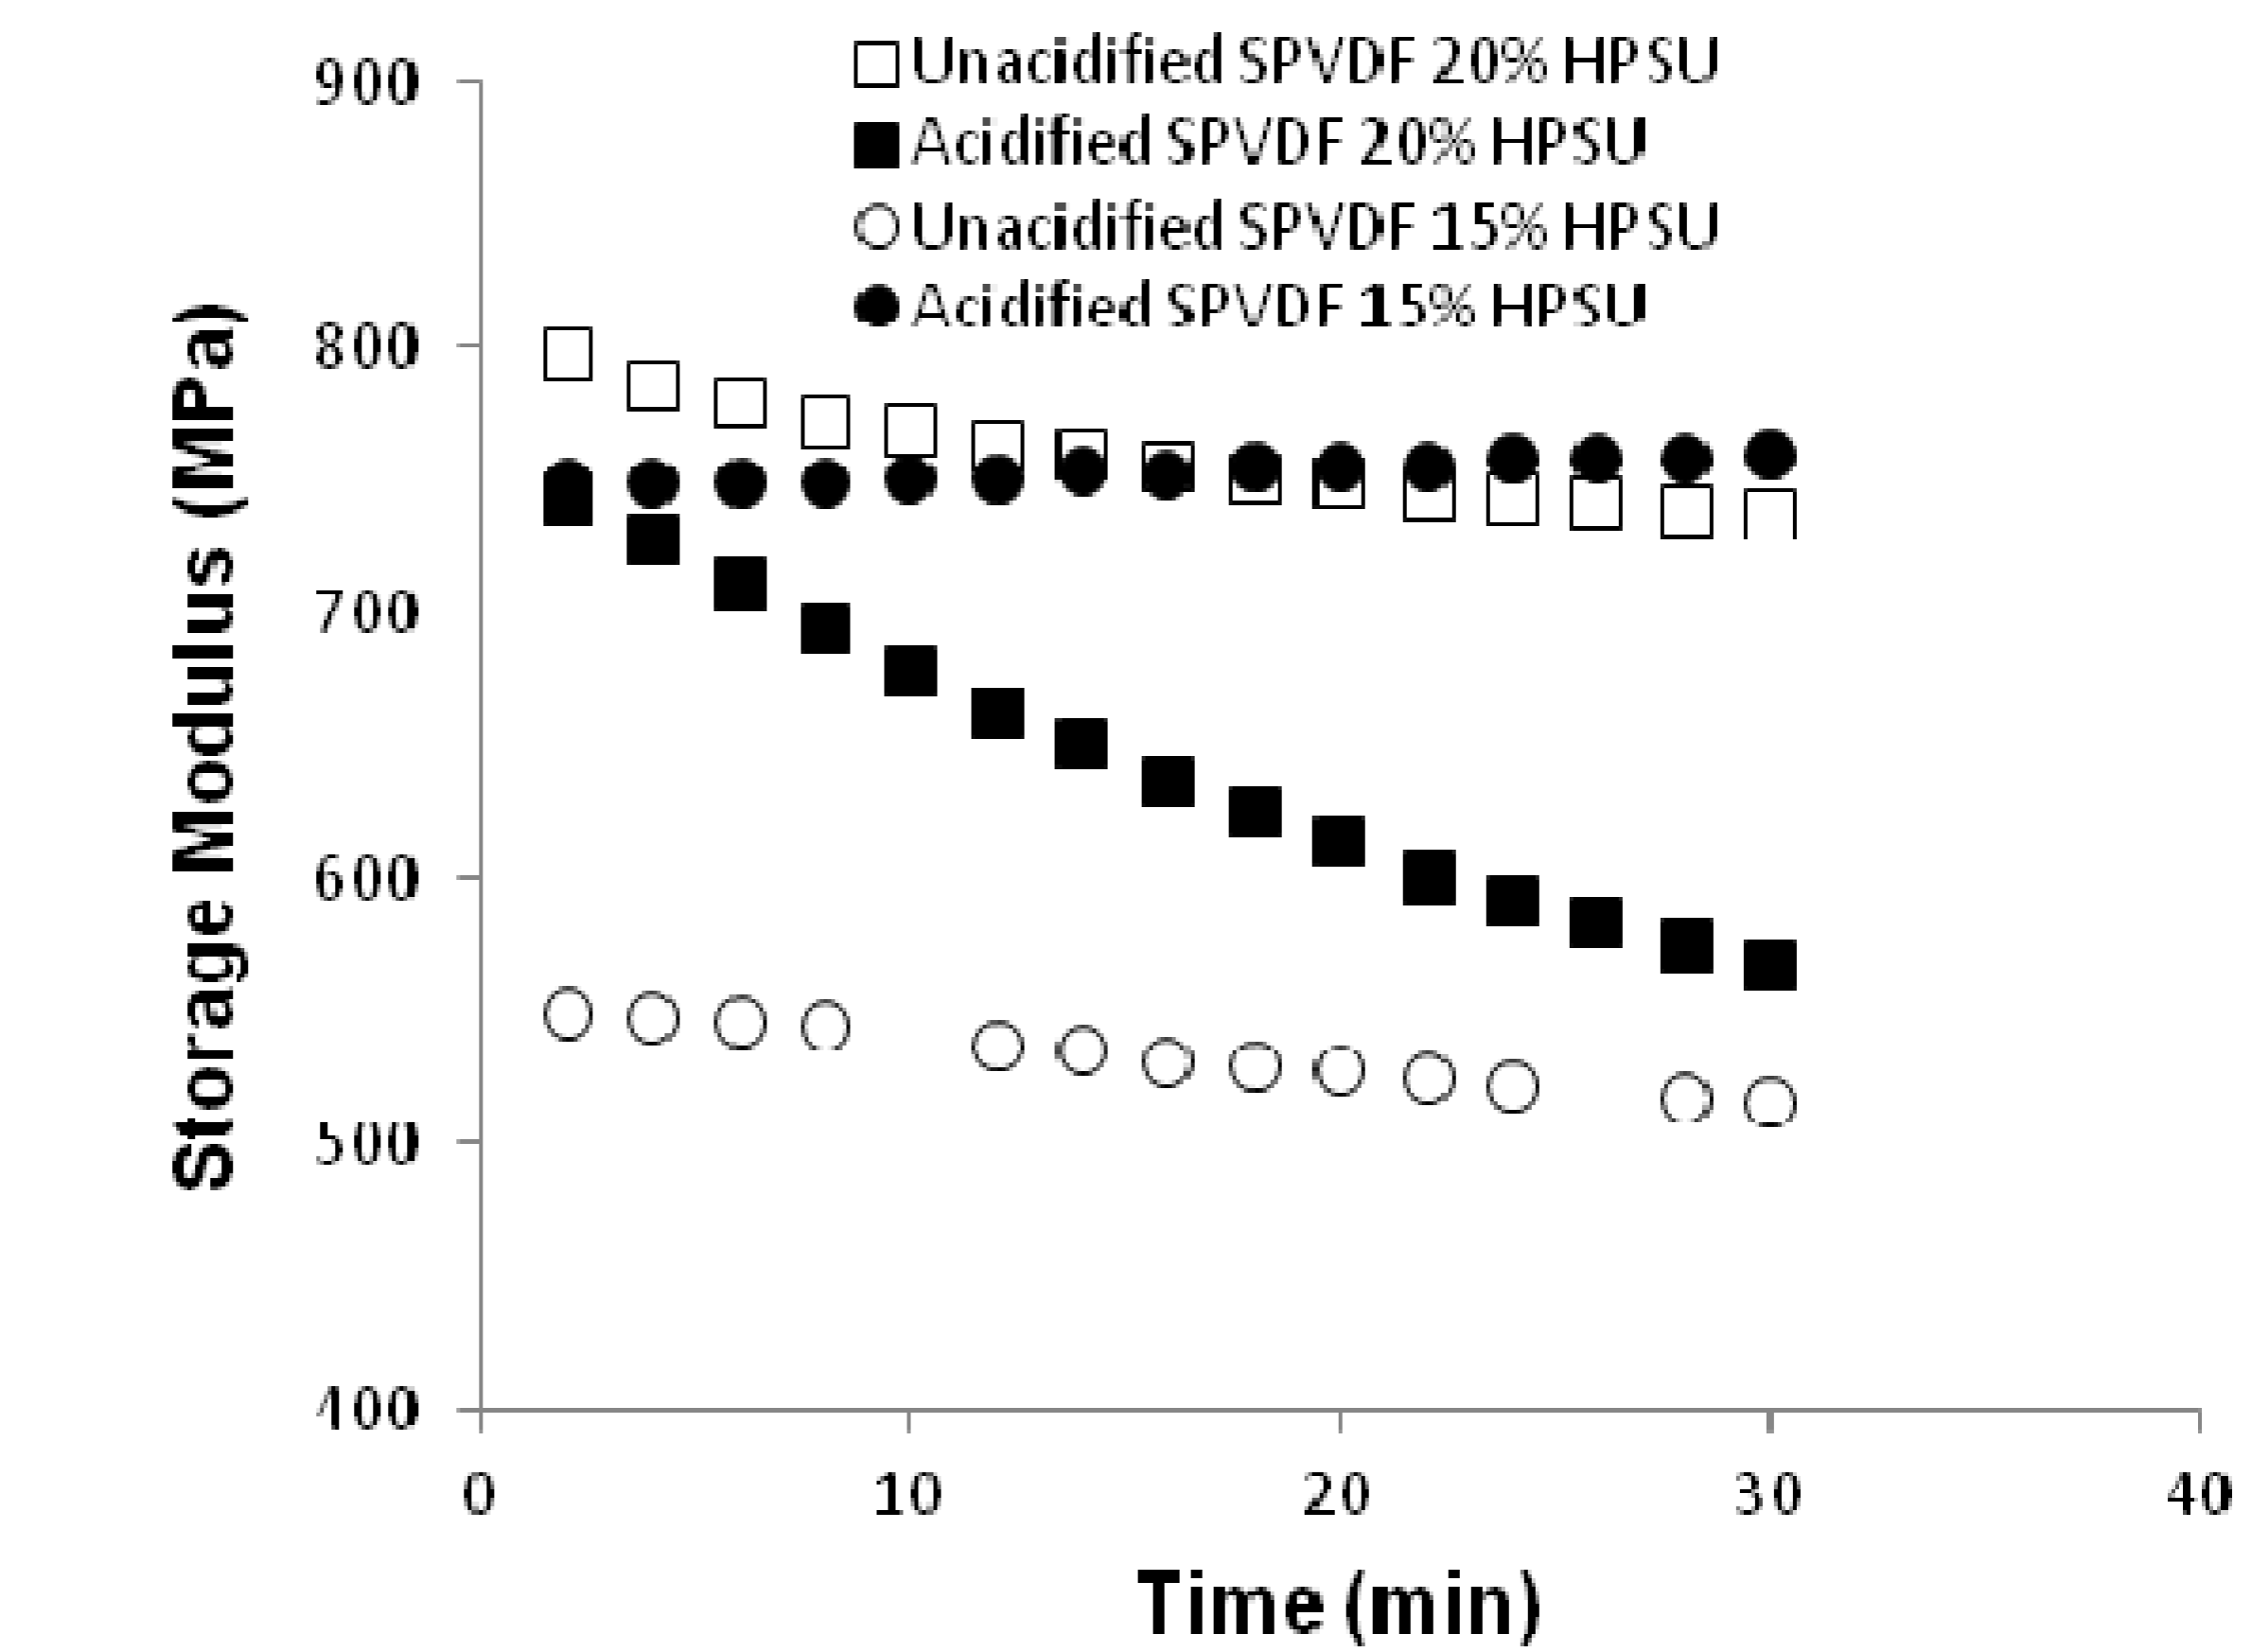
Dynamic Mechanical Property: Dynamic mechanical analysis was done using Q800 DMA under a constant humidity to investigate the effect of humidity on elastic modulus.
Figure 10 shows the plot of elastic modulus
vs. time at a relative humidity of 50%. It is clear that the unacidified blends with different contents of HPSU show marginal change in modulus with time, The modulus values of both the unacidified and acidified systems lie in the range of 800–500 MPa. However, an interesting feature has been observed for blend with 20% HPSU, which shows change in modulus over time under humidity. Such behavior can be accounted for the water absorption of this blend (~6% from
Figure 11) than the other systems.
Figure 9.
DSC thermograms of the blend membranes (10%, 15%, 20% HPSU) with S-PVDF.
Figure 9.
DSC thermograms of the blend membranes (10%, 15%, 20% HPSU) with S-PVDF.
Figure 10.
Storage moduli change of different blends at a constant humidity of 50%.
Figure 10.
Storage moduli change of different blends at a constant humidity of 50%.
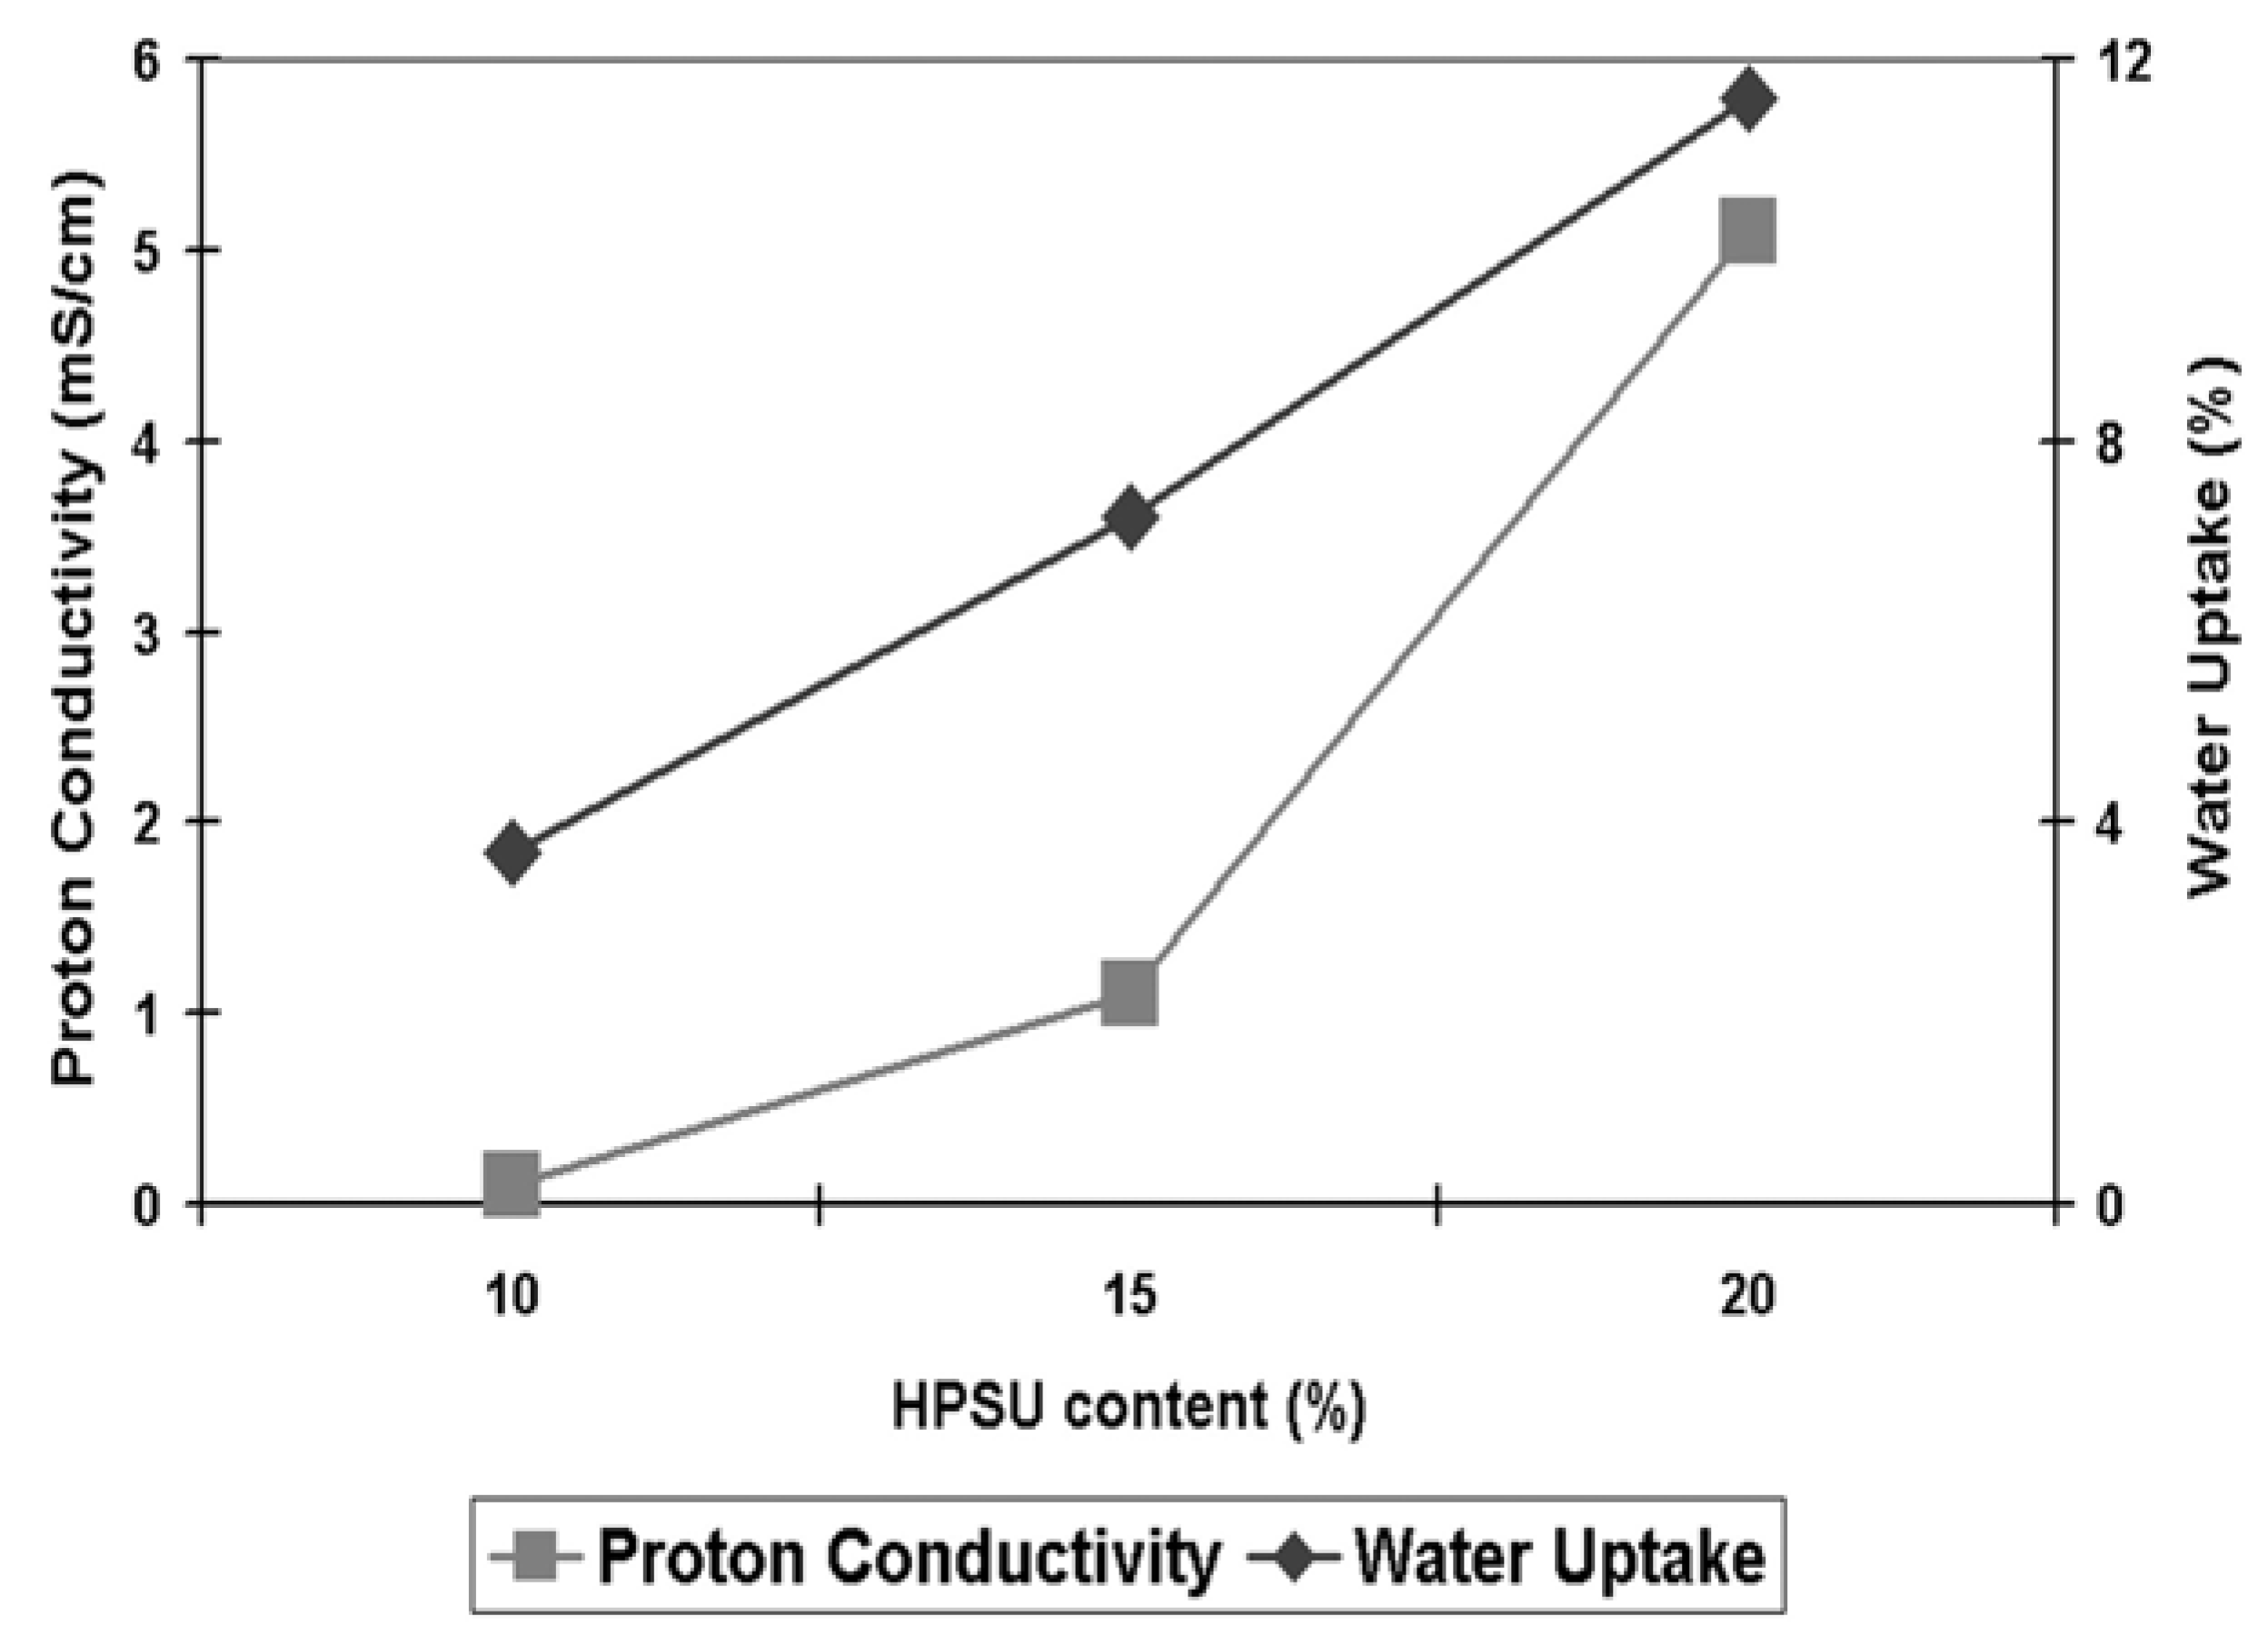
Figure 11.
Ionic conductivity at 80°C and 100% humidity and water uptake of samples containing 10%–20% HPSU.
Figure 11.
Ionic conductivity at 80°C and 100% humidity and water uptake of samples containing 10%–20% HPSU.
Proton Conductivity: As can be seen from
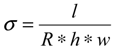
Figure 11, the S-PVDF/HPSU membrane shows an increase in both proton conductivity and water uptake, with both values increasing with higher HPSU content. This is attributed to greater amount of acidic functionalities of the membrane resulting in greater hydrophilicity of the membrane. Samples with less than 10% HPSU were insulating, indicating that 10% HPSU content is the threshold required to achieve a continuous, conducting path throughout the membrane. However, unlike the water uptake which increases linearly, there was a greater increase in proton conductivity between the sample containing 15% and 20% HPSU. As both water uptake and ionic conductivity rely on the HPSU, the increase in HPSU would result in greater hydrophilicity and more acidic functionalities, allowing the membrane to uptake more water and provides greater conductivity. The water-retention capability of the blends can be improved by annealing at high temperature (120 °C) as it promotes aggregation and self-condensation within the ionic groups, which also lowers the solubility of the material. However, proton conductivity also relies on achieving an inter-connected pathway through the membrane, and as such the non-linear increase in conductivity is due to the HPSU content reaching the percolation threshold in the membrane, resulting in greater increase in the number of pathways for proton conduction. Indeed, it is likely that the spherical domains visible in the cross-section SEM images are HPSU rich-area and those domains were more visible in samples with higher HPSU content which also have higher proton conductivity. The highest conductivity value was obtained with the membrane containing 20% HPSU, which shows a conductivity of 5.1 mS cm
−1 at 80 °C and 100% relative humidity.
Although the conductivity of the blend membrane is still much lower than that of Nafion™ (94 mS cm
−1 for Nafion 117 tested under the same conditions), it is still quite significant and compares favorably to previous studies of PVDF blends. In particular, Cho
et al. [
2] reported that their Nafion™/PVDF-co-HFP achieved a value of 1.5 mS cm
−1 for a 20% Nafion/PVDF-co-HFP blend at 80 °C and 100% RH, while Song
et al. [
9] reported that around 60%–70% Nafion content was required in their Nafion 115/PVDF blend to achieve similar conductivity to our membrane containing just 20% HPSU. This indicates that the greater density of functional group in the HPSU contributed to a better conductivity in the S-PVDF/HPSU membrane compared to blends using linear polymers, such as Nafion™.
The S-PVDF/HPSU blend also shows good morphology with no macroporosity and lower water uptake compared to the Nafion™/PVDF blend [
12], which shows some pores at 20% Nafion content. The membrane also shows good stability with no loss of conductivity observed after soaking in water for two weeks. As this stability was observed mostly in annealed membranes, this is attributed to crosslinking of the PVDF matrix due to unsaturated sites resulting from dehydrofluorination trapping the HPSU within the membrane.


