2.2. Structural Characterization
The TEM images in
Figure 1,
Figure 2 show the various morphologies and sizes of Fe
3O
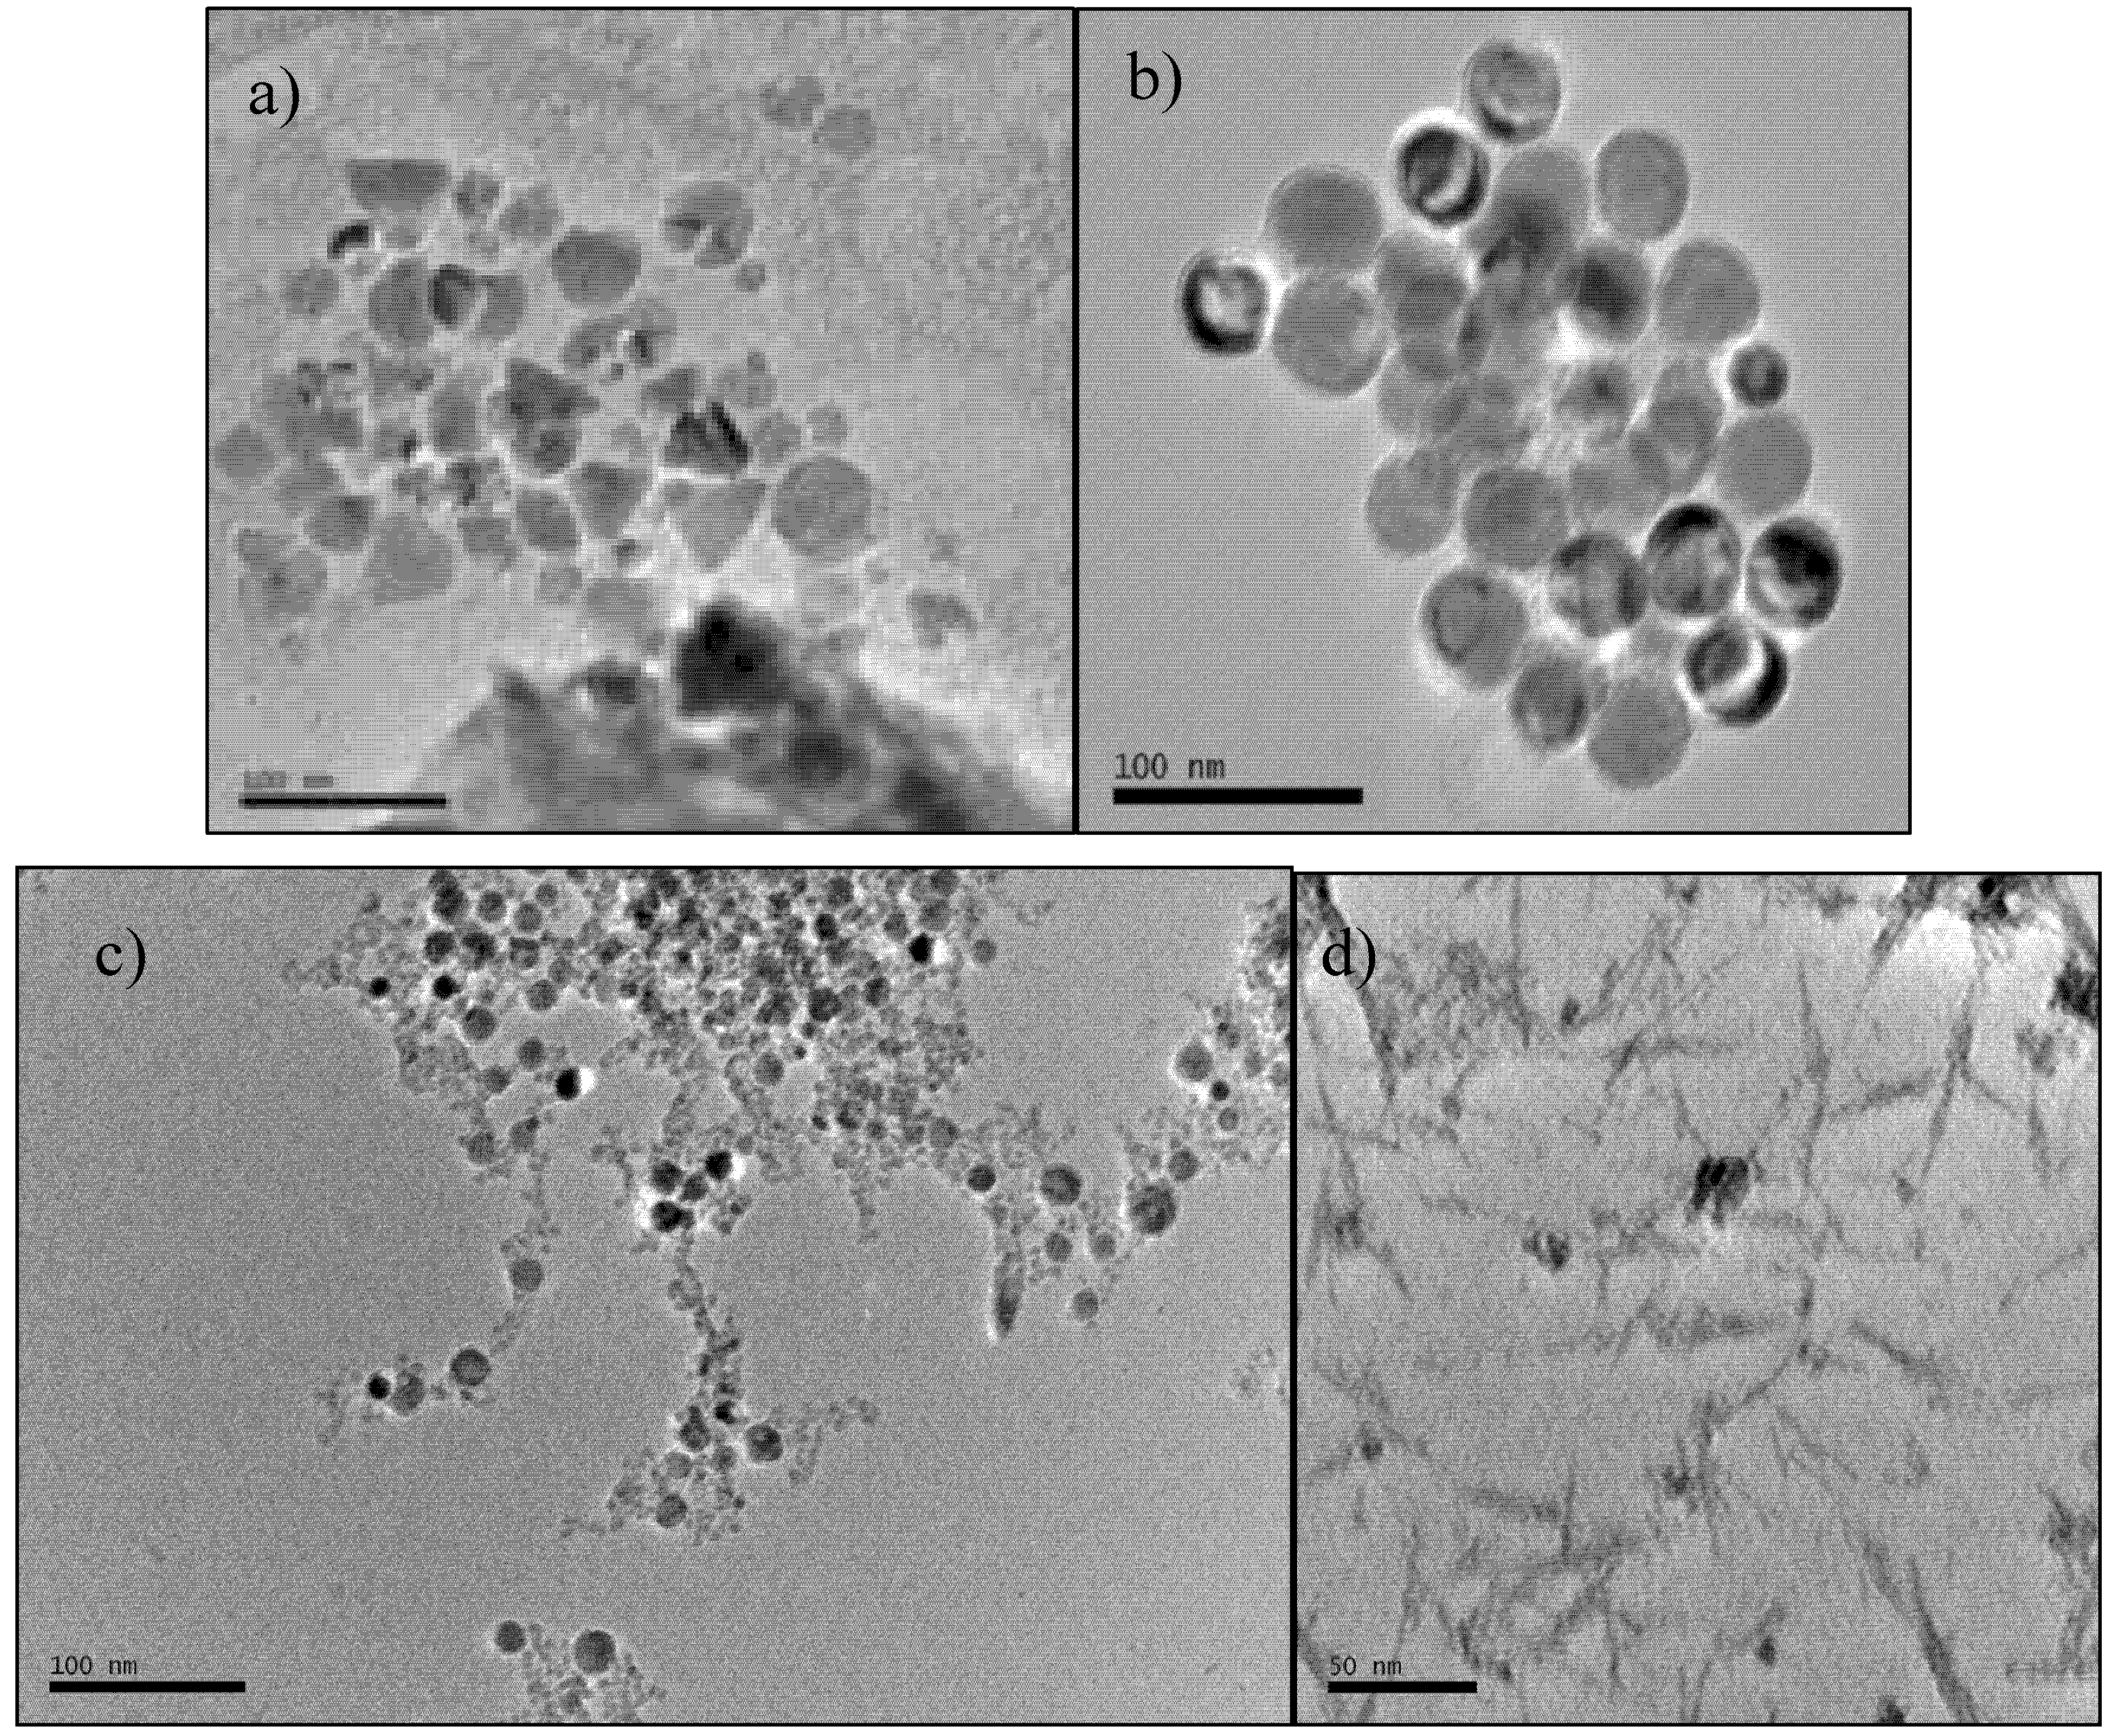
4 nanocrystals we were able to obtain prior to PEG capping. Polymorphous nanocrystals shown in
Figure 1a were obtained with eicosane solvent (342.7 °C boiling point). Monodisperse spheres with a diameter of ~ 30 nm in
Figure 1b formed from polymorphous nanocrystals shown in
Figure 1a) when the reaction mixture was allowed to cool for 30 min before being refluxed again. Spheres of ~22 nm in diameter (
Figure 1c and nanowires 55 × 2 nm (
Figure 1d) were made in
n-docosane (boiling point 370 °C) and
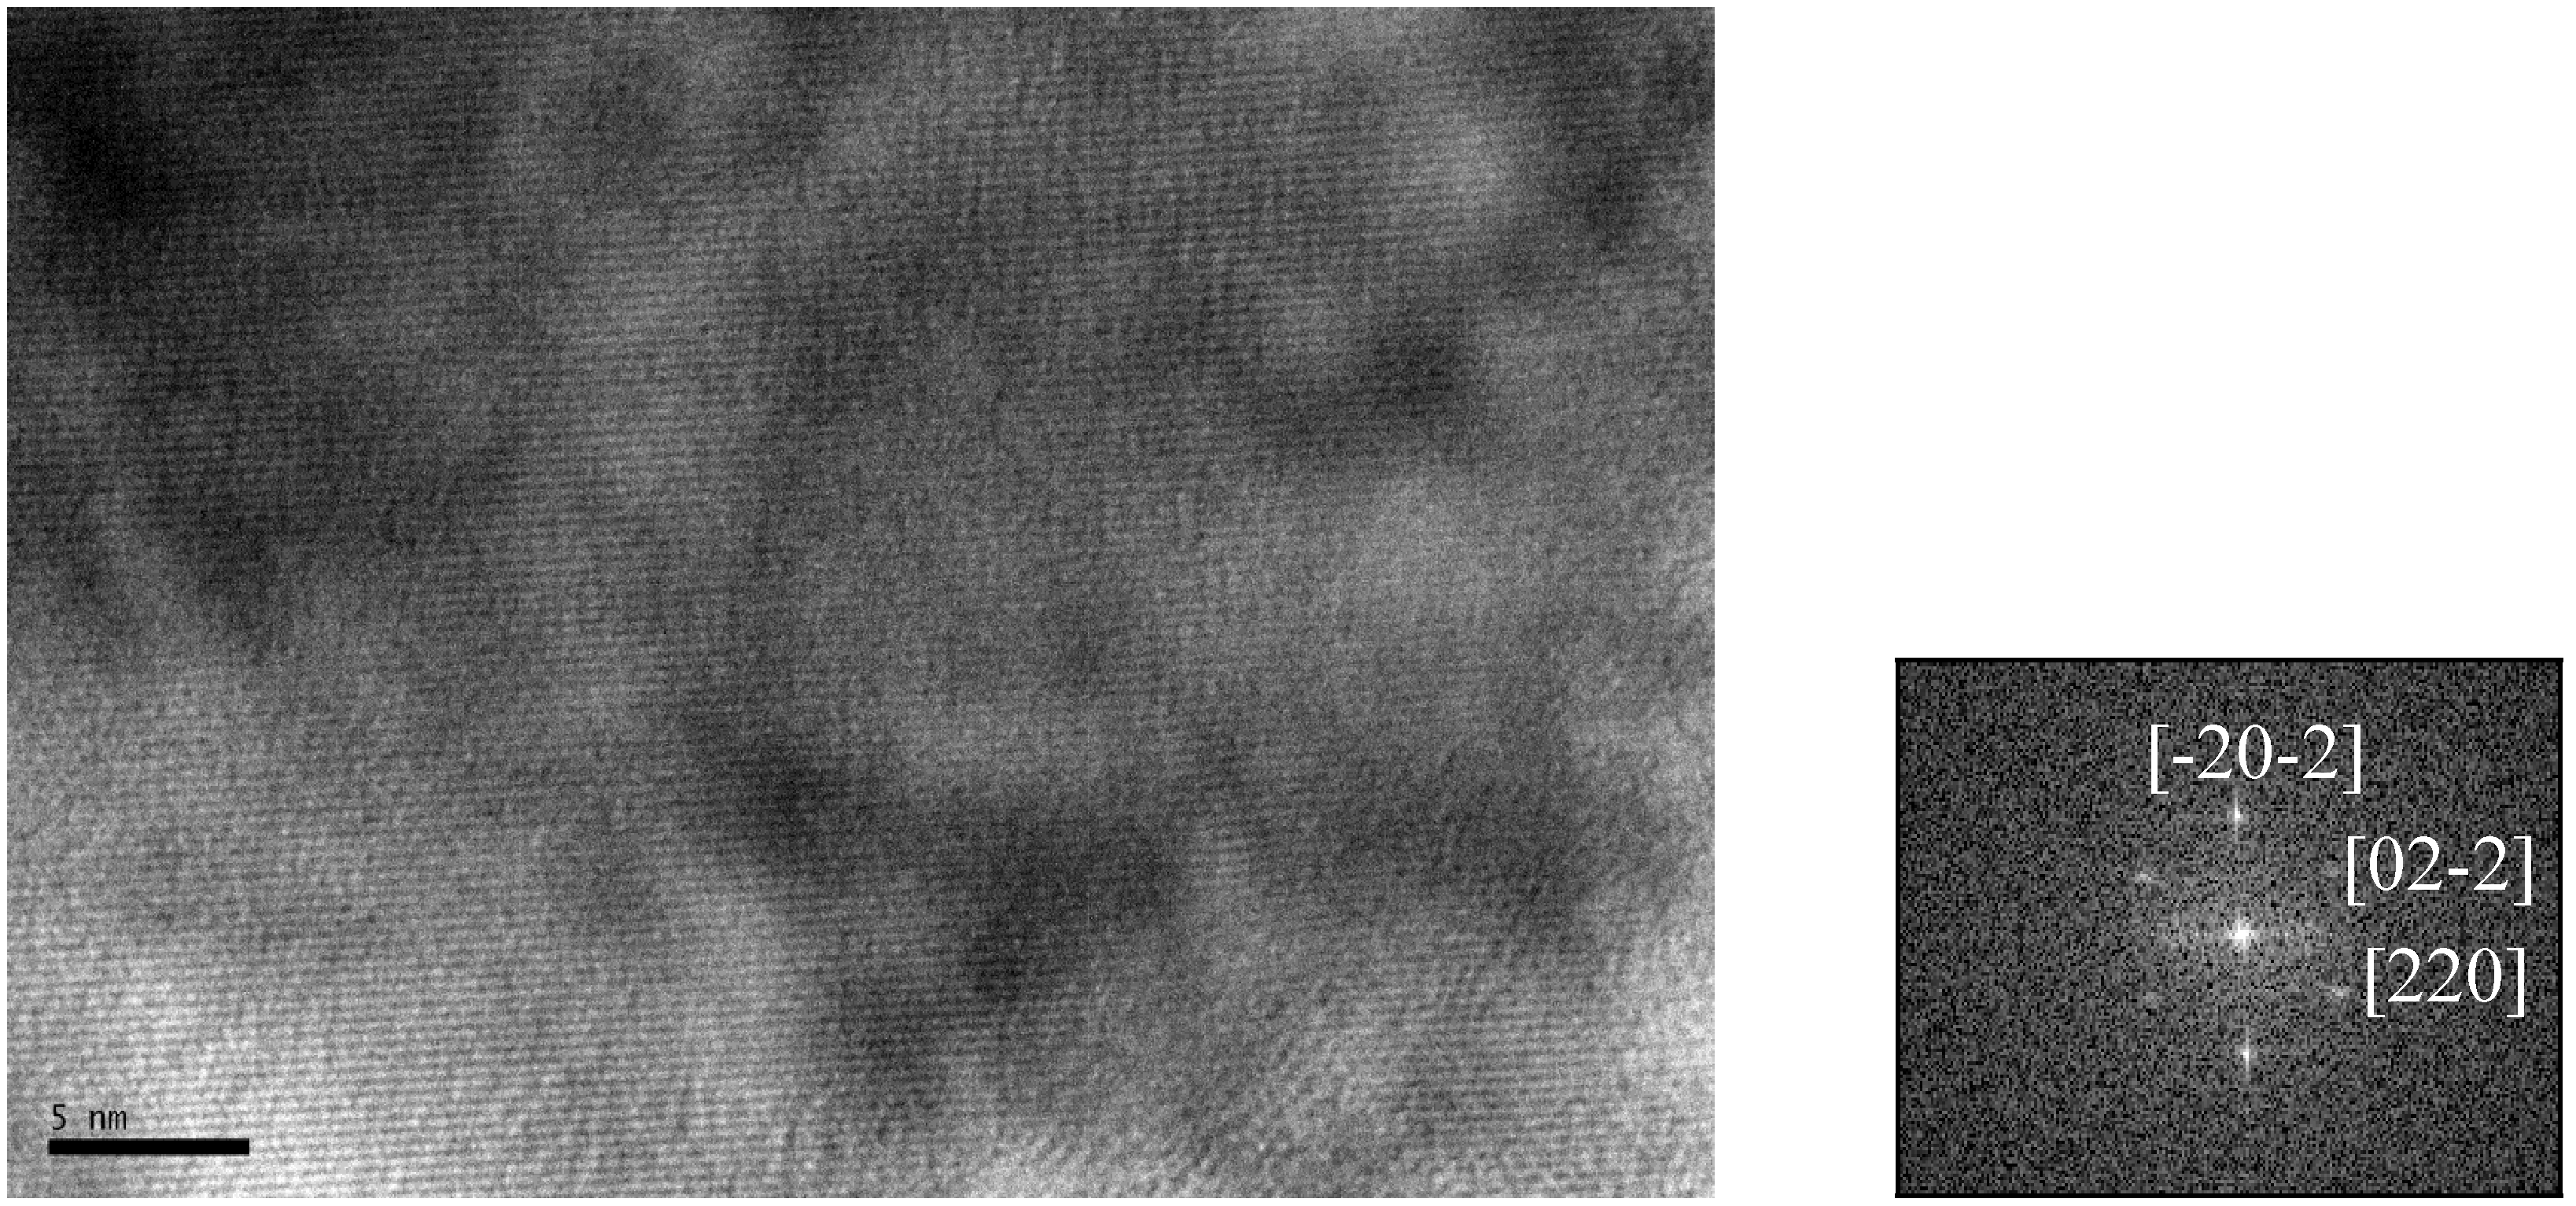
n-dodecane (boiling point 216.2 °C), respectively. We performed high-resolution TEM to confirm high crystallinity of the nanocrystals. Image in
Figure 2 represents fringes observed for the monodisperse spheres from
Figure 1b.
Figure 1.
Transmission electron microscopy (TEM) images of Fe3O4 nanocrystals prior to polyethylene glycol (PEG) capping: (a) polymorphous nanocrystals, scale bar 100 nm; (b) monodisperse spheres formed from polymorphous nanocrystals, scale bar 100 nm; (c) monodispere spheres ~22 nm in diameter, scale bar 100 nm; (d) nanowires, scale bar 50 nm.
Figure 2.
High-resolution TEM image and its Fast Fourier transform for the monodisperse spheres shown in
Figure 1b above.
Figure 2.
High-resolution TEM image and its Fast Fourier transform for the monodisperse spheres shown in
Figure 1b above.
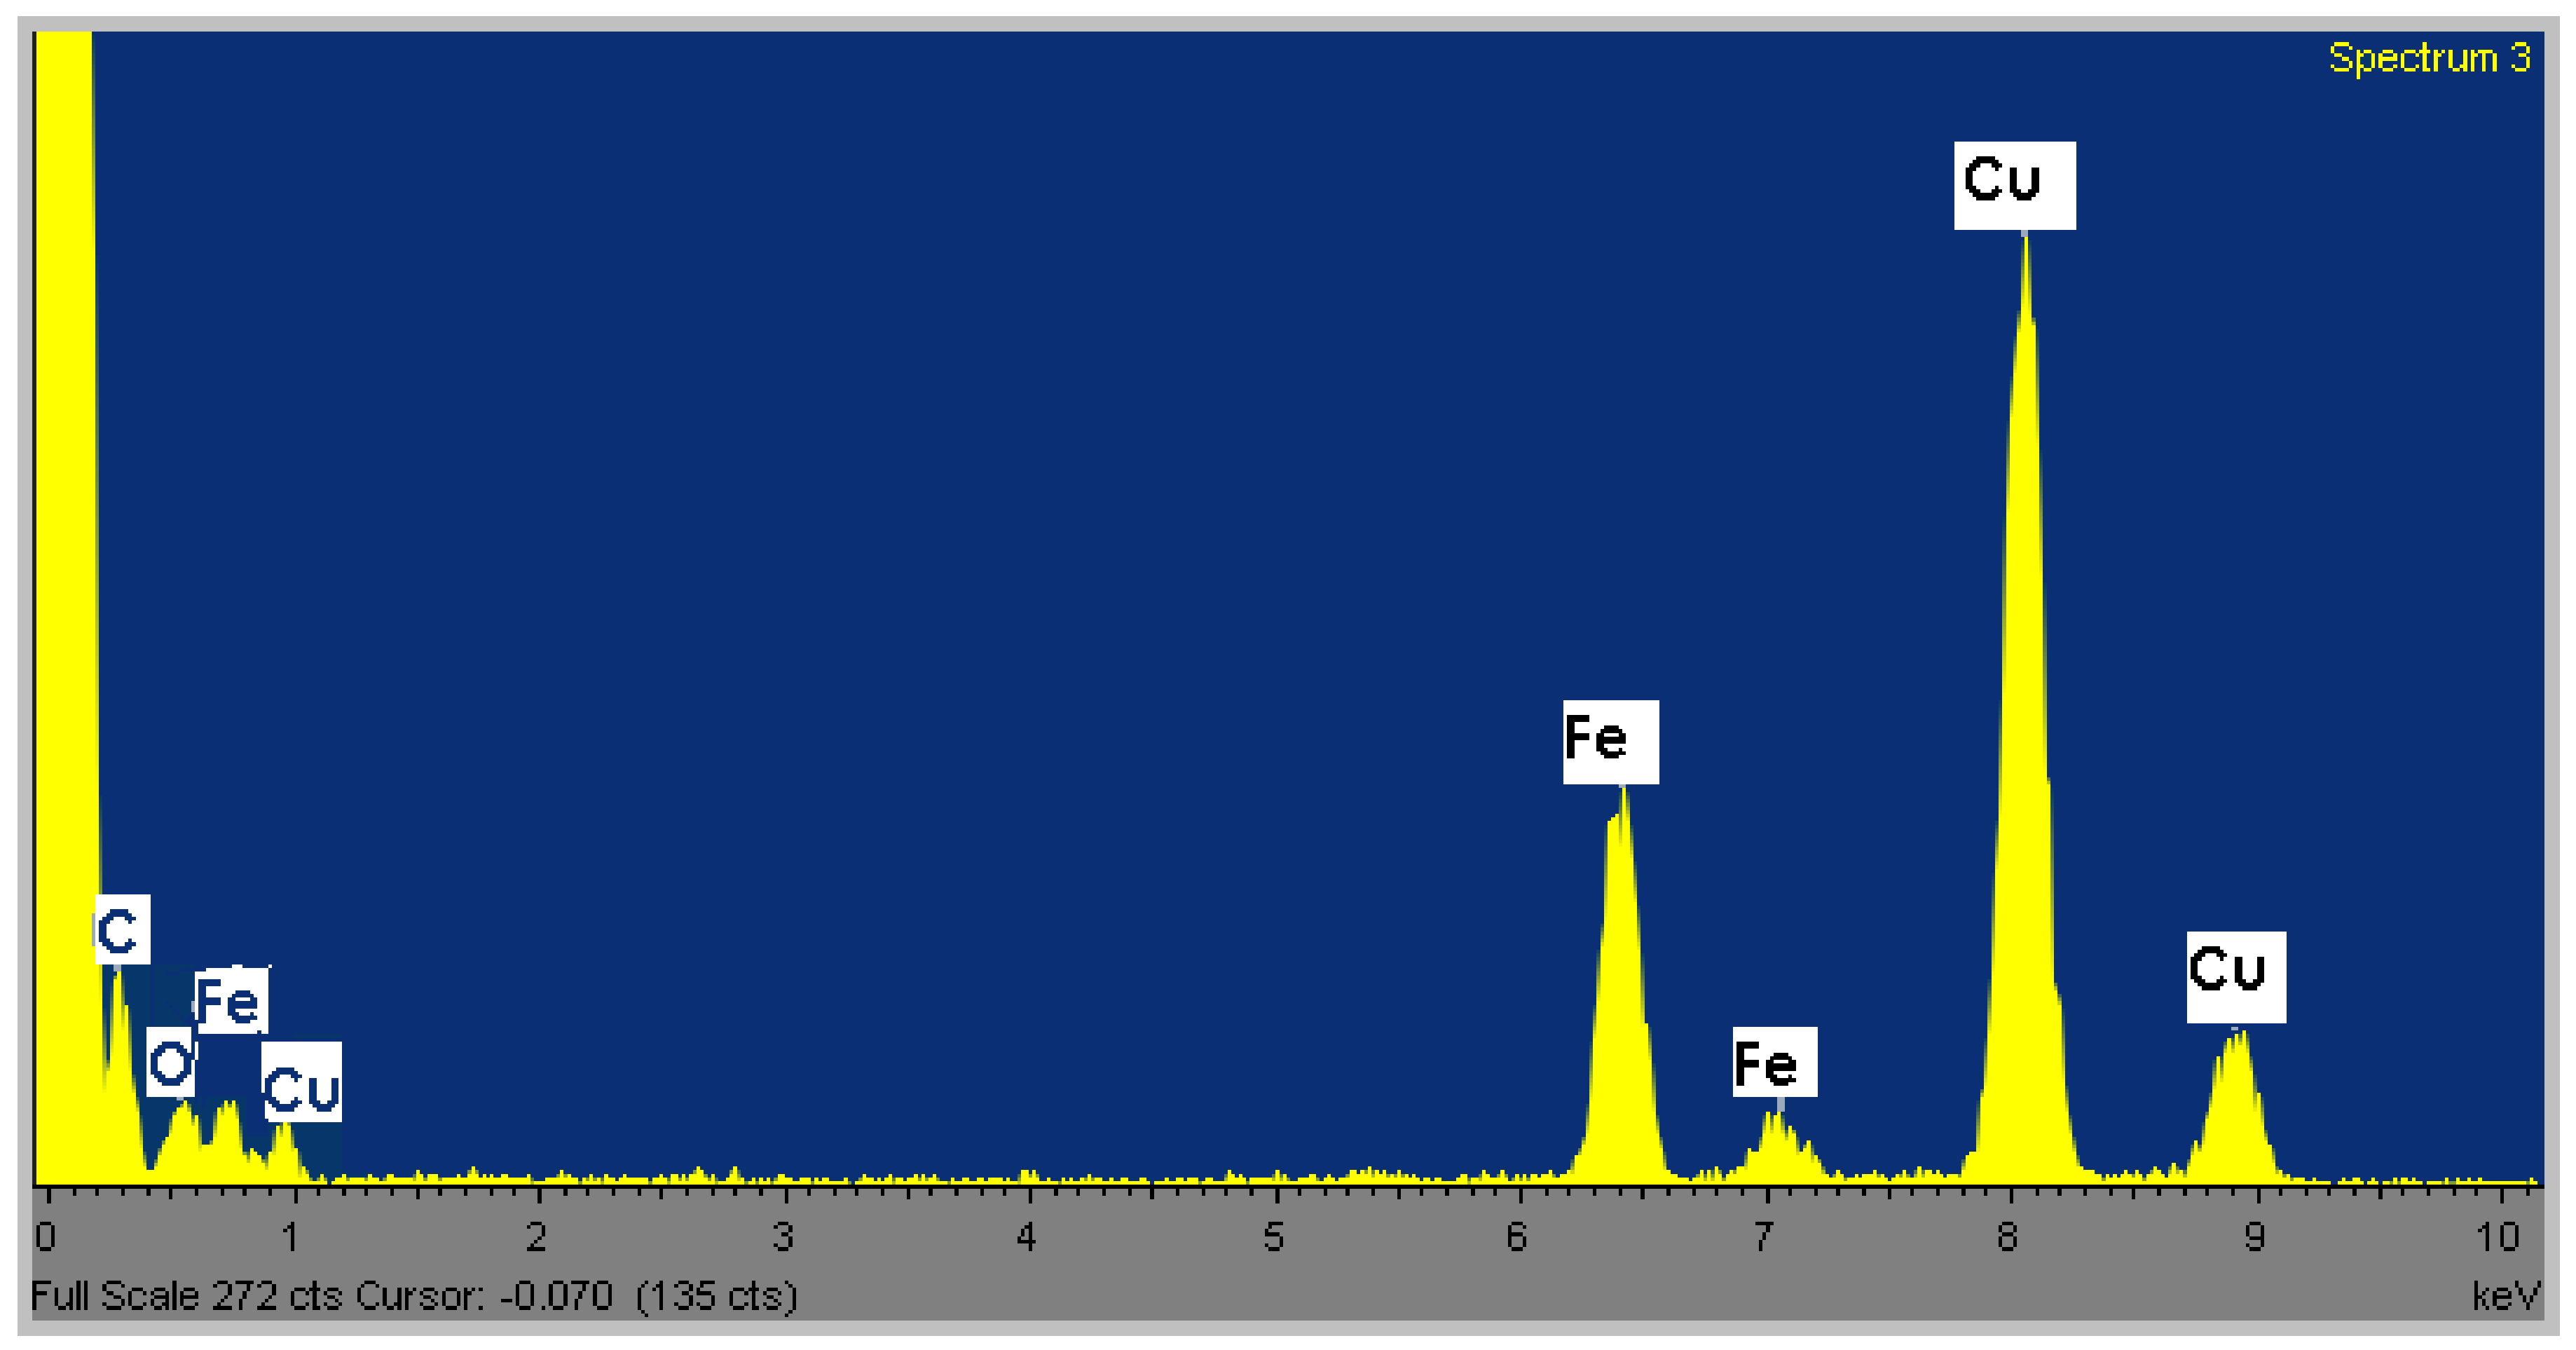
Elemental composition of the Fe
3O
4 nanocrystals was determined by EDS analysis. Iron and oxygen are present in monodisperse spheres from
Figure 1b, confirming their elemental composition (
Figure 3). The carbon and copper peaks are due to the carbon-coated copper grid.
Figure 3.
Energy dispersive X-ray spectroscopy (EDS) analysis of the monodisperse spheres from
Figure 1b.
Figure 3.
Energy dispersive X-ray spectroscopy (EDS) analysis of the monodisperse spheres from
Figure 1b.
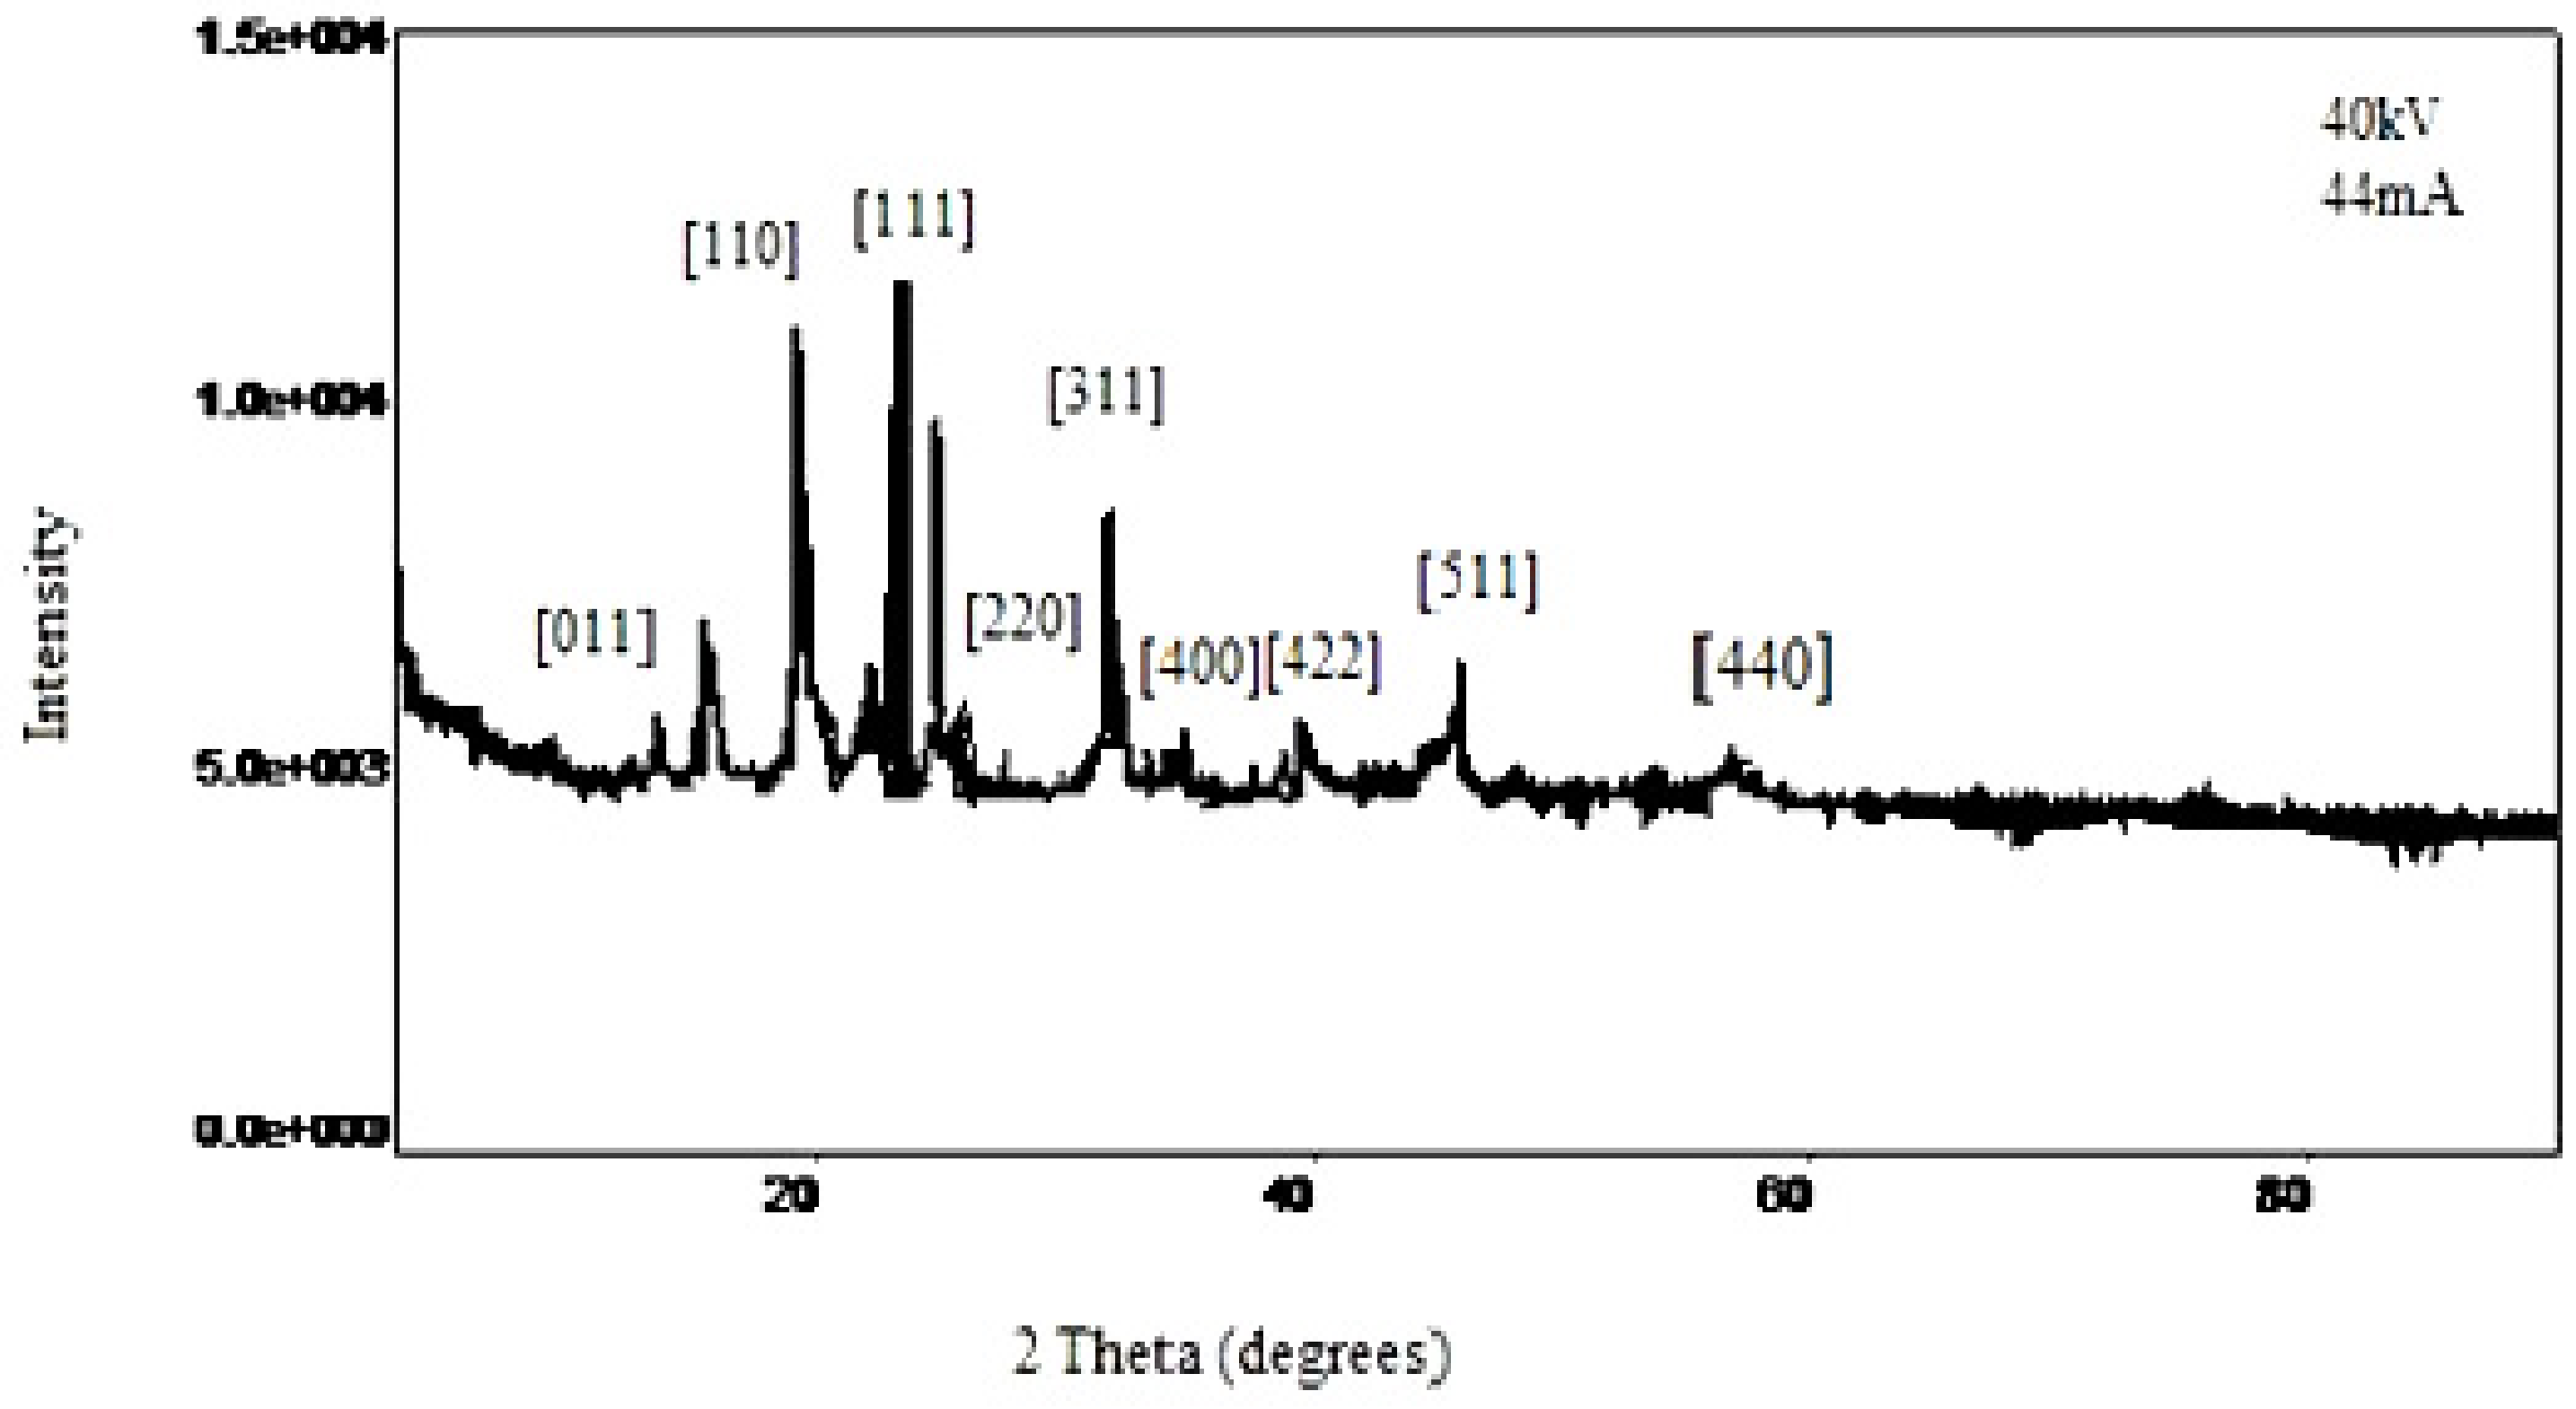
The XRD data for iron oxide polymorphous nanocrystals (
Figure 4) suggests that the composition of the nanocrystals is 70% Fe
3O
4 with space group Fd3m {F41/d 3 2/m}. There are peaks distinctive of
α-Fe
2O
3, which are likely the result of surface oxidation during the analysis. The remaining portions of the crystal appear to be composed of a yet unidentified phase of Fe
2O
3 in addition to wüstite phases, as we would expect for diiron (III) oxide, although with space groups and
a values being similar, the oxidation state is difficult to determine with absolute certainty.
Figure 4.
X-ray diffraction (XRD) data for iron oxide polymorphous nanocrystals.
Figure 4.
X-ray diffraction (XRD) data for iron oxide polymorphous nanocrystals.
2.3. Magnetic Characterization
A typical feature in magnetic nanocrystals is their irreversible ferromagnetic behavior below the blocking temperature TB and reversible magnetization above it, caused by superparamagnetic behavior of the nanocrystals. The blocking temperature can be found experimentally by measuring magnetization under field-cooling (FC) and zero-field cooling (ZFC) conditions. Below TB, the Néel relaxation time τN is larger than the measurement time τm (typically 100 s), and magnetization depends strongly on the field history. Above TB, magnetization is strongly affected by thermal fluctuations (τm > τN), making FC and ZFC curves coincide. In other words, for a given measurement time τm, hysteretic behavior observed below TB would not be observed above TB.
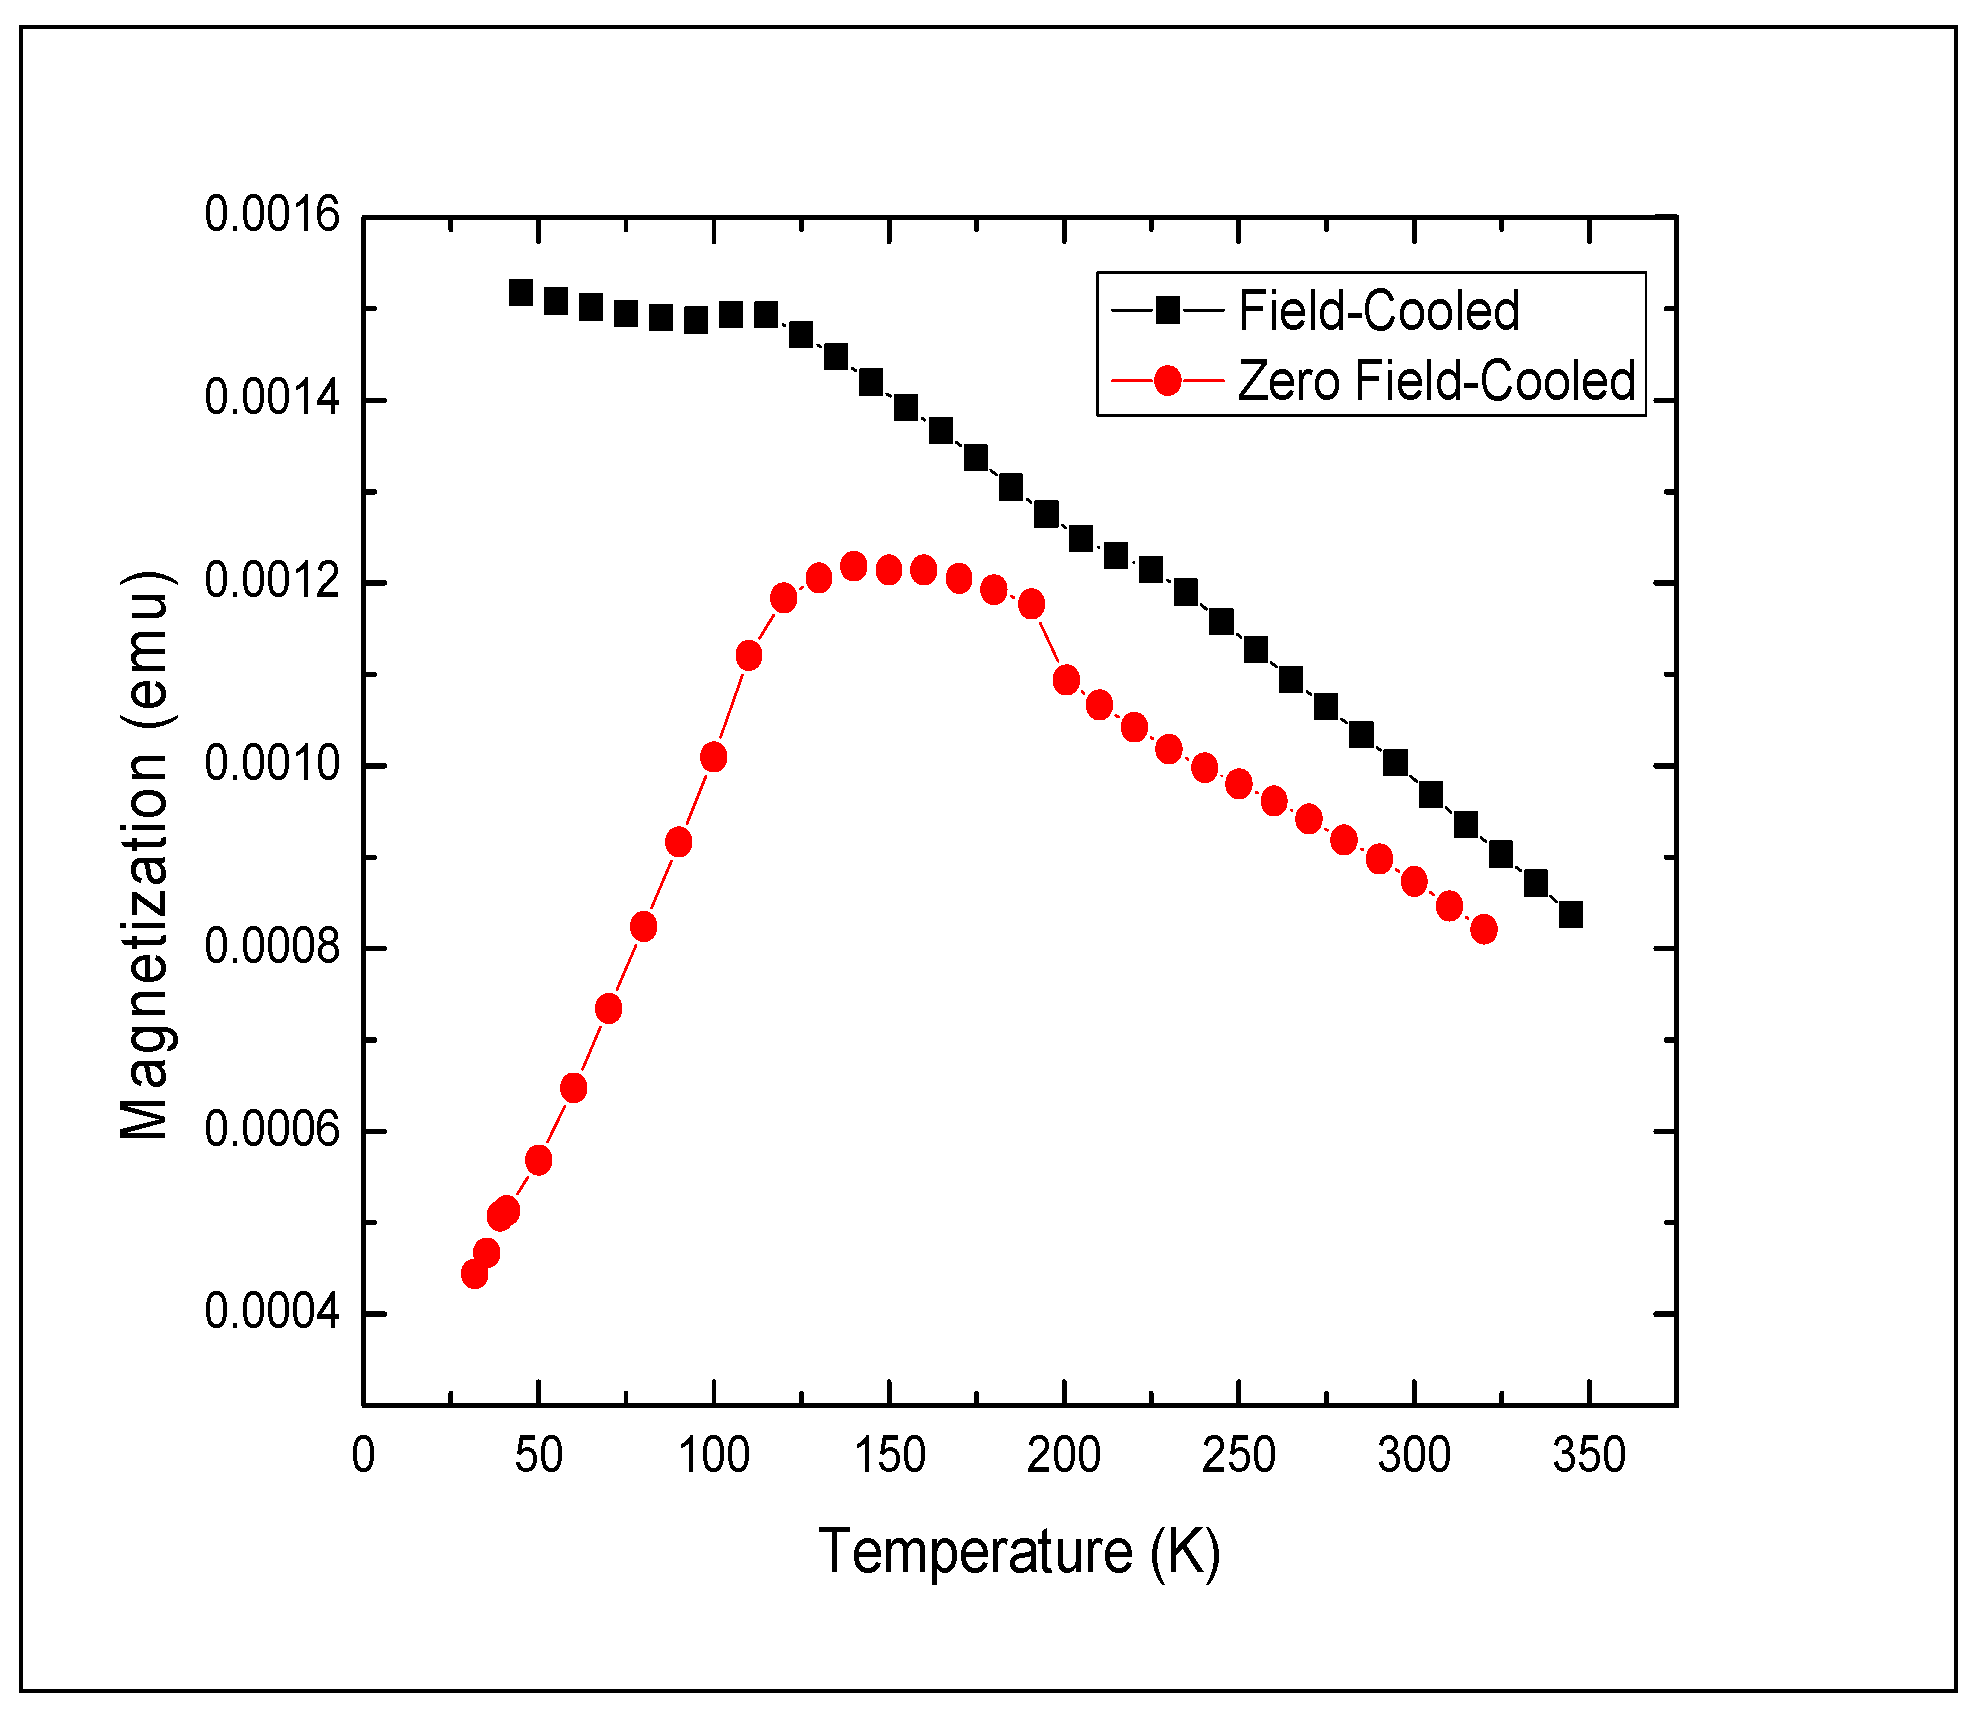
Figure 5.
Zero-field cooled (circle symbols) and field cooled (square symbols) magnetization vs. temperature for polymorphous Fe3O4 nanocrystals. Magnetization measured with a dc field of 100 Oe. τm = 100 s.
Figure 5.
Zero-field cooled (circle symbols) and field cooled (square symbols) magnetization vs. temperature for polymorphous Fe3O4 nanocrystals. Magnetization measured with a dc field of 100 Oe. τm = 100 s.
We measured temperature dependence of magnetization for the Fe3O4 nanocrystal samples under ZFC and FC conditions. The dc (τm = 100 s) magnetization of the ferrofluid samples was measured with a dc field of 100 Oe in the temperature range between 9 K and 350 K.
In the entire temperature range up to 350 K, the Fe
3O
4 nanocrystal samples demonstrated strong ferromagnetic behavior as evidenced by the gap between the ZFC and FC curves persisting even at 350 K (
Figure 5). From the ZFC curve, we can loosely estimate
TB to be ~175 K, but even above that temperature equilibrium magnetization of the nanocrystal sample was not reached, and superparamagnetic behavior of the nanocrystals was not observed.
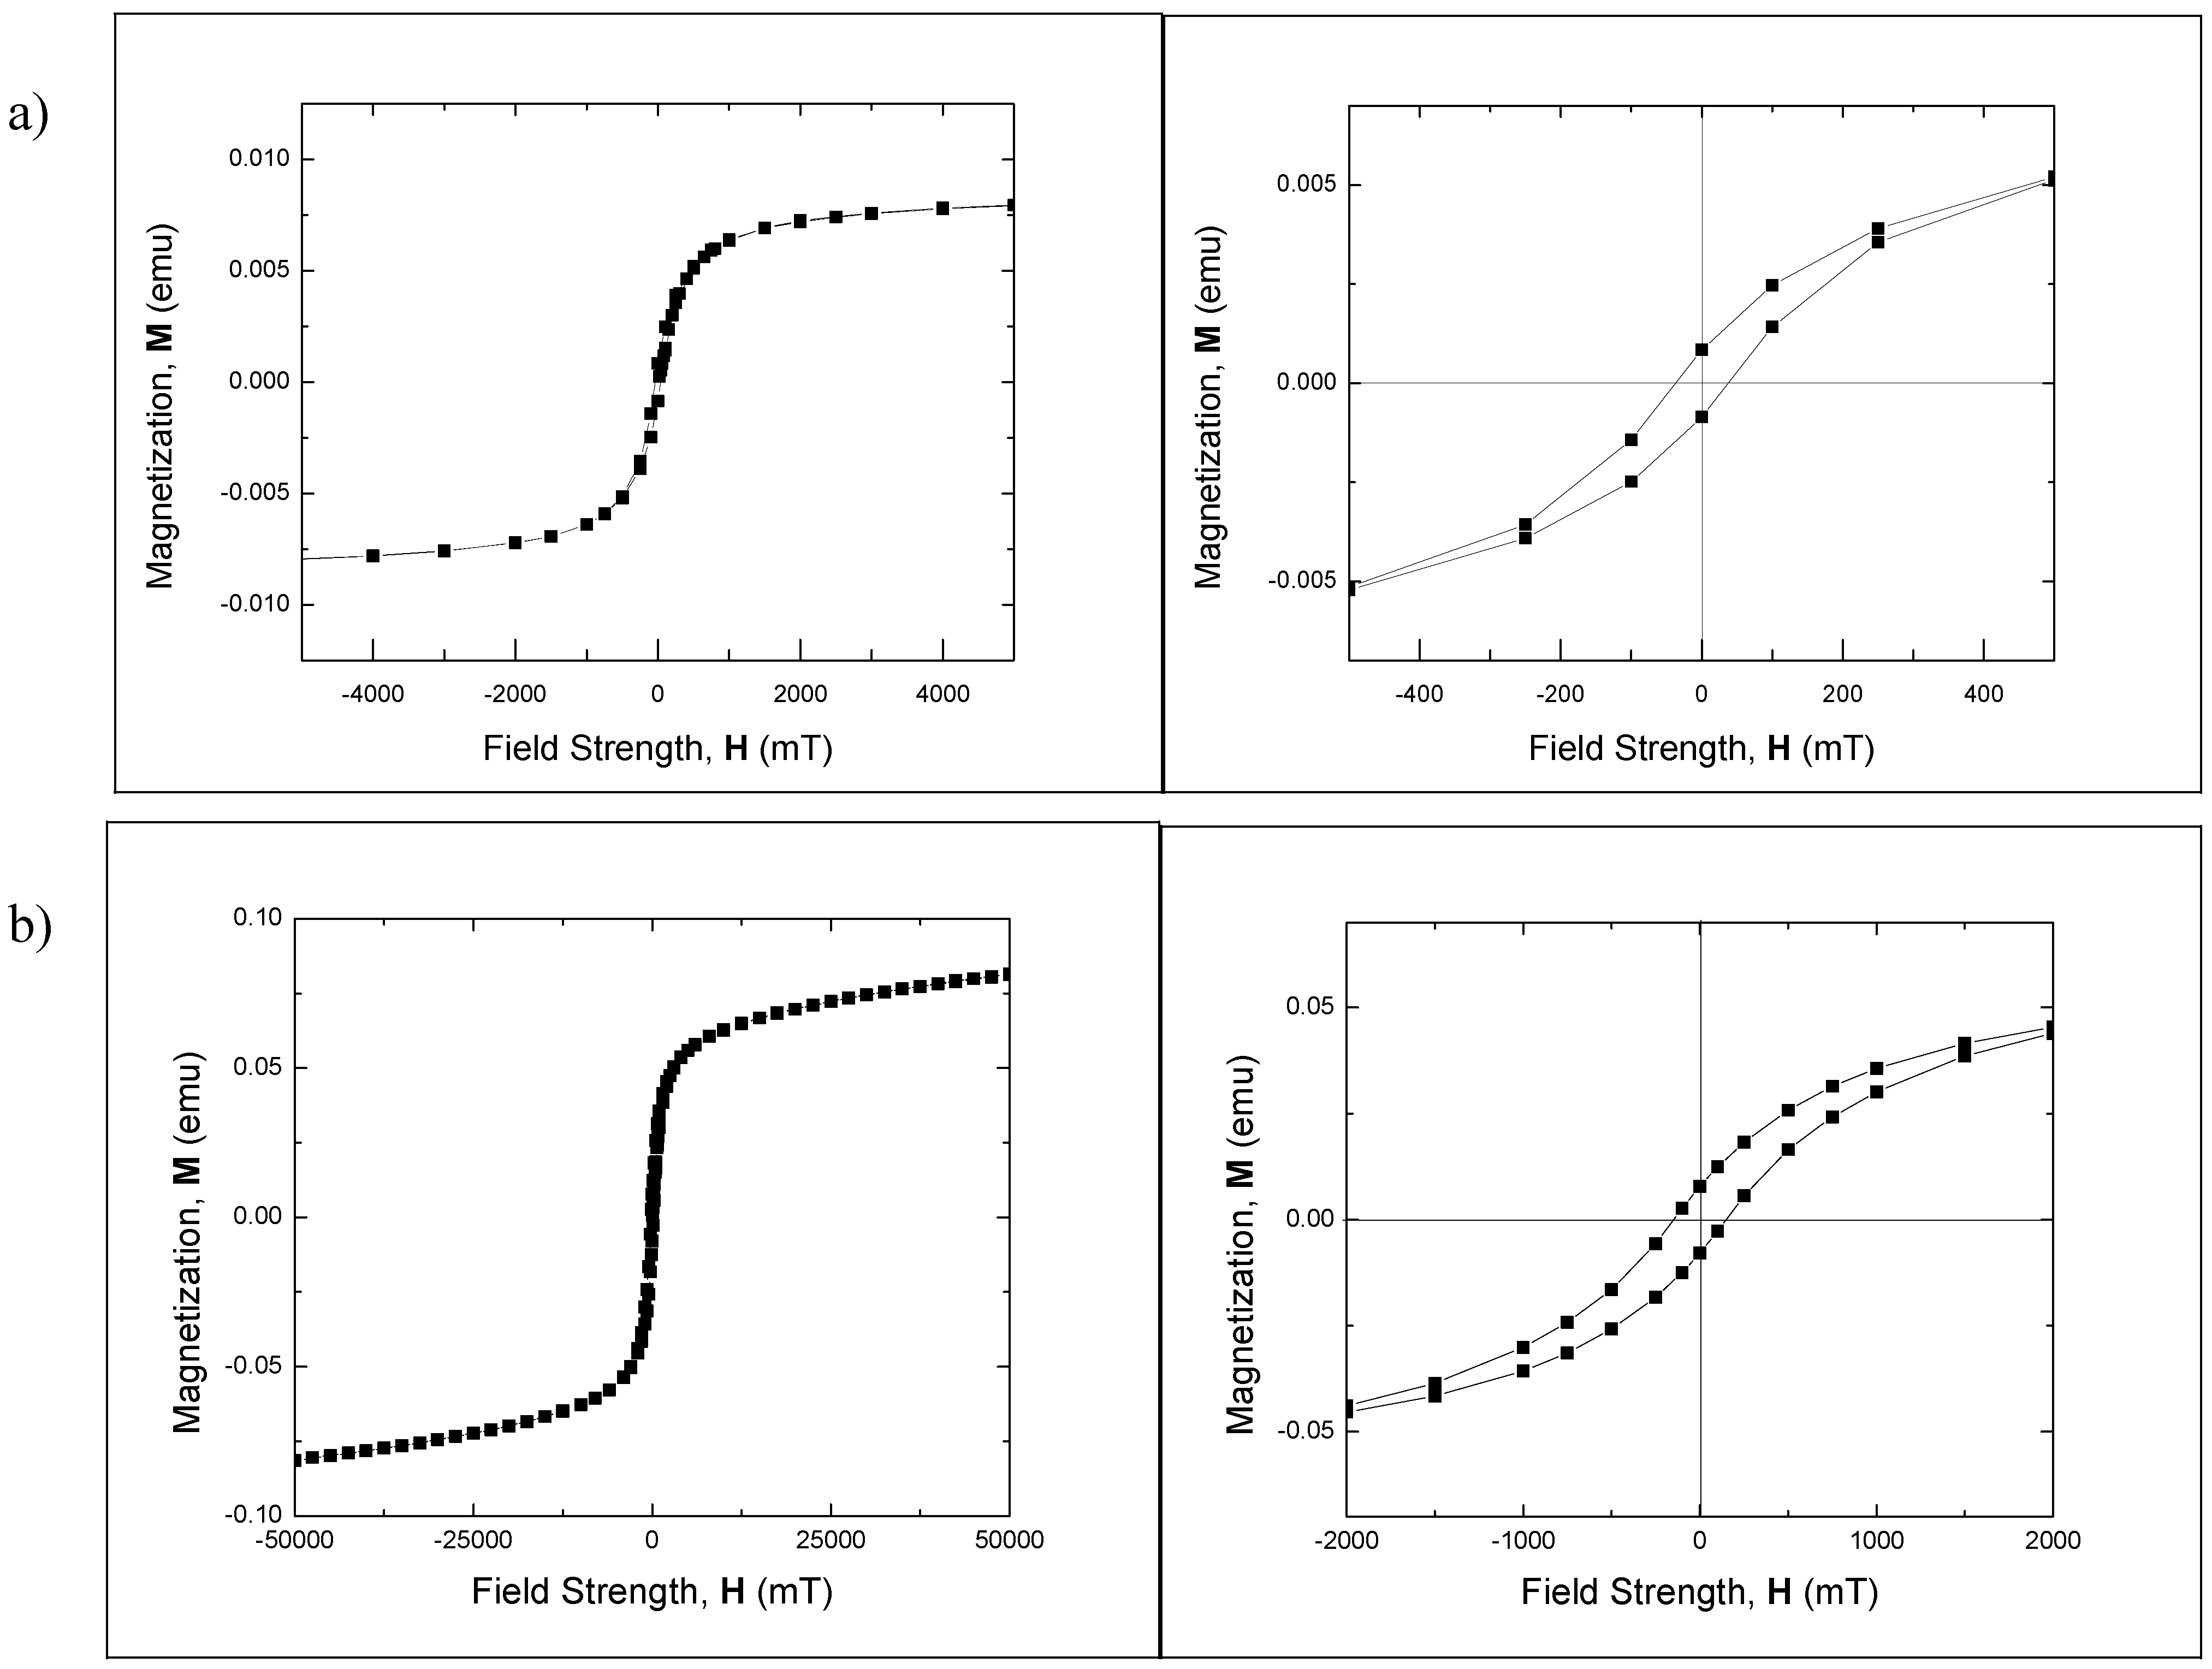
Strong ferromagnetic behavior of the Fe
3O
4 nanocrystal samples was confirmed in magnetic hysteresis measurements. Consistent with the results of dc magnetization measurements, magnetic hysteresis measurements at 293 K performed on Fe
3O
4 polymorphous nanocrystals (
Figure 6a) find large coercivity ~37 mT (~29 kA/m) at 100 s measurement time. Even larger coercivity of ~119 mT (~94.7 kA/m) was measured for ~22 nm Fe
3O
4 nanospheres.
Figure 6.
Hysteresis loop for (a) Fe3O4polymorphous nanocrystals and (b) ~22 nm Fe3O4 nanospheres. τm = 100 s. Left: full sweep of magnetic field measured at 293 K showing saturation. Right: enlarged loop measured at 293K at low field.
Figure 6.
Hysteresis loop for (a) Fe3O4polymorphous nanocrystals and (b) ~22 nm Fe3O4 nanospheres. τm = 100 s. Left: full sweep of magnetic field measured at 293 K showing saturation. Right: enlarged loop measured at 293K at low field.
2.4. Magnetic Hyperthermia Experiments
Magnetic hyperthermia for the Fe3O4 nanocrystal samples was tested using a NanoTherics, Ltd. Magnetherm that operates at frequencies between 100 and 1000 kHz. Samples were prepared as described in the Experimental Section and dispersed in deionized water. All concentrations were 30 mg/mL and sample volumes were 5 mL. The nanocrystals compared in the following graphs were 22 nm spheres, polymorphous nanocrystals, and 55 × 2 nm wires. Heating of the nanocrystals was tested at frequencies of 111.1 kHz and 629.2 kHz. Data acquisition for hyperthermia was started at ambient temperature. Temperature increase was measured using an optical thermometer with an accuracy of ±0.5 °C.
Figure 7.
Hyperthermia data comparing the frequency dependence for different nanocrystal morphologies (22 nm spheres, polymorphous nanocrystals, and 55×2 nm wires). Taken at frequency of (a) 111.1 kHz (magnetic field 25 mT) and (b) of 629.2 kHz (magnetic field 9 mT).
Figure 7.
Hyperthermia data comparing the frequency dependence for different nanocrystal morphologies (22 nm spheres, polymorphous nanocrystals, and 55×2 nm wires). Taken at frequency of (a) 111.1 kHz (magnetic field 25 mT) and (b) of 629.2 kHz (magnetic field 9 mT).
Figure 7a shows the heating of nanocrystals of various morphologies (spheres, polymorphous nanocrystals, and wires) at a frequency of 111.1 kHz (magnetic field of 25 mT).
Figure 7b shows the heating of the same nanocrystals at a frequency of 629.2 kHz (magnetic field of 9 mT). The spherical and polymorphous particles follow a similar trend consistent with their similar morphology and particle volume. Although they do heat at the frequency of 111.1 kHz, the observed heating was relatively low. Interestingly, the total increase in temperature after 40 min was 6 °C for spheres, whereas, it was only 1 °C for polymorphous nanocrystals. When the frequency of the oscillating magnetic field was increased to 629.2 kHz, the spheres and polymorphous nanocrystals showed increased heating. But, unlike the data obtained at 111.1 kHz, the total temperature increase was similar for the polymorphous nanocrystals and nanocrystals of spherical shape: 16 °C for spheres and 15 °C for polymorphous nanocrystals. As for the nanowires, the observed trend was just the opposite. The total temperature increase at 111.1 kHz after 40 min was remarkable 30 °C and, notably, saturation of the temperature was not reached in this timeframe. At 629.2 kHz, however, the increase of temperature generated by the wires was much less than the one obtained by spheres and polymorphous nanocrystals, representing the total temperature increase of 4 °C.
It has been shown that the transition from ferromagnetic to superparamagnetic behavior is associated with the change of the loss mechanism and, accordingly, of the heating effect of magnetic nanocrystals in hyperthermia experiments [
12]. Hysteresis losses dominate in ferromagnetic nanocrystals, whereas heat production in superparamagnetic ones is due to relaxation losses. Since the blocking temperature
TB explicitly depends on the measurement time τ
m (inversely proportional to the frequency of the oscillating magnetic field), superparamagnetic nanocrystals, as measured in dc magnetization experiments, become ferromagnetic at sufficiently high frequencies > 1/τ
N (or > 1/τ, where τ = τ
Ν τ
Β/(τ
Ν + τ
Β), if both Néel and Brownian relaxation mechanism are present) and generate heat due to hysteresis losses. With the Fe
3O
4 nanocrystal samples demonstrating strong ferromagnetic behavior in dc magnetization and hysteresis measurements, hysteresis losses are expected to be the main mechanism of heating in the operating frequency range of our hyperthermia experiments. We estimated the Néel relaxation time τ
N at room temperature for the Fe
3O
4 polymorphous nanocrystals (
Figure 5) as follows: τ
N = τ
0exp(
Eb/
kBT), where
Eb is the magnetic anisotropy energy barrier,
kB is the Boltzmann constant, and τ
0 = 10
−10 s is the attempt time.
Eb is related to the blocking temperature
TB as
Eb =
kBTB ln(τ
m/τ
0) = 27.6
kBTB, and we arrive at τ
N = τ
0exp(27.6
TB/
T) for the Néel relaxation time. At
T = 300 K, τ
N ≈ 0.001 s. At the frequencies of interest ω >> 1/τ
N, that is far from the relaxation resonance, the Néel relaxation losses saturate at a level that is negligible for large enough τ
N [
12]. Therefore, we will interpret our results based on the mechanism of hysteresis losses prevailing.
When hysteresis losses are the main heating factor, heating power is proportional to the area of the hysteresis loop and to the frequency of the applied magnetic field. Approximately 6-fold increase in the heating power is expected when the frequency is changed from 111.1 kHz to 629.2 kHz. The observed increase in heating power from the Fe3O4 polymorphous nanocrystals and nanospheres is not that large. We note, however, that both the frequency and amplitude of the magnetic field were changed in our experiments, and the magnetic field strength was reduced from 25 mT at 111.1 kHz to 9 mT at 629.2 kHz, which can explain the heating power increase not being proportional to the frequency for the Fe3O4 polymorphous nanocrystals and nanospheres. The higher temperature increase of 6 °C for the spheres compared to 1 °C for the polymorphous nanocrystals at 111.1 kHz can be explained by a significantly larger area of their hysteresis. However, the difference in the specific heat production between the spherical and polymorphous nanocrystals at 629.2 kHz is not that pronounced.
We consider hyperthermia experiments with nanowires separately, as their morphology differs dramatically from that of polymorphous nanocrystals and nanospheres, and may be the decisive factor. Fine magnetite particles of needle shape with high aspect ratio have been investigated previously by Hergt
et al. [
12]. High potential for hyperthermia was noted there for such particles that possess very high shape anisotropy, and hence high-energy barrier for remagnetization, resulting in a wide hysteresis and high hysteresis losses. It was concluded, however, that strong magnetic fields, very often unacceptable for human patients, are required to fully utilize their potential. Very strong nonlinear dependence of the hysteresis loss on the strength of the applied magnetic field was reported. Comparison was made among particles of different shape, and it was found that needles were by far superior when applied magnetic field exceeded ~35 kA/m, while below that value the magnetic field was not strong enough to open the hysteresis loop in needles, and their hysteresis losses were by several orders of magnitude lower compared to particles of other shapes with low aspect ratio. We expect similar effects to be observed in nanowires that are characterized with even higher aspect ratios of their shape. We believe that our results for hyperthermia in nanowires can be explained by similar superlinear dependence of their hysteresis loss on the magnetic field strength, with that superlinear dependence being much stronger than mere proportionality of the heating power to the frequency of the applied magnetic field.
We note that the remarkable 30 °C temperature increase was observed in nanowires sample at 111 kHz and magnetic field of 25 mT (19.6 kA/m), which is very close to the typical values used in medical treatments −100 kHz and 20 mT [
13,
14].
In our analysis, we have not considered one more possible mechanism of heat generation during hyperthermia, namely, Brownian relaxation that can be significant in particles of that size. Additional experiments are needed to clarify contribution of Brownian relaxation to the observed heat production in hyperthermia experiments.
