
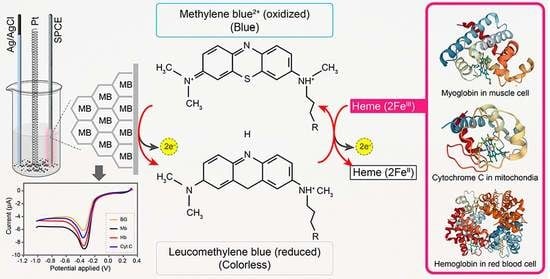
Bio-Electroanalysis Performance of Heme Redox-Center for π-π Interaction Bonding of a Methylene Blue-Graphene Modified Electrode
 ,
,
Abstract
:
1. Introduction
2. Materials and Methods
2.1. Reagents
2.2. Preparation of Nanohybrid Materials
2.3. Fabrication of Electrode
2.4. Instrumentation and Procedure
3. Results
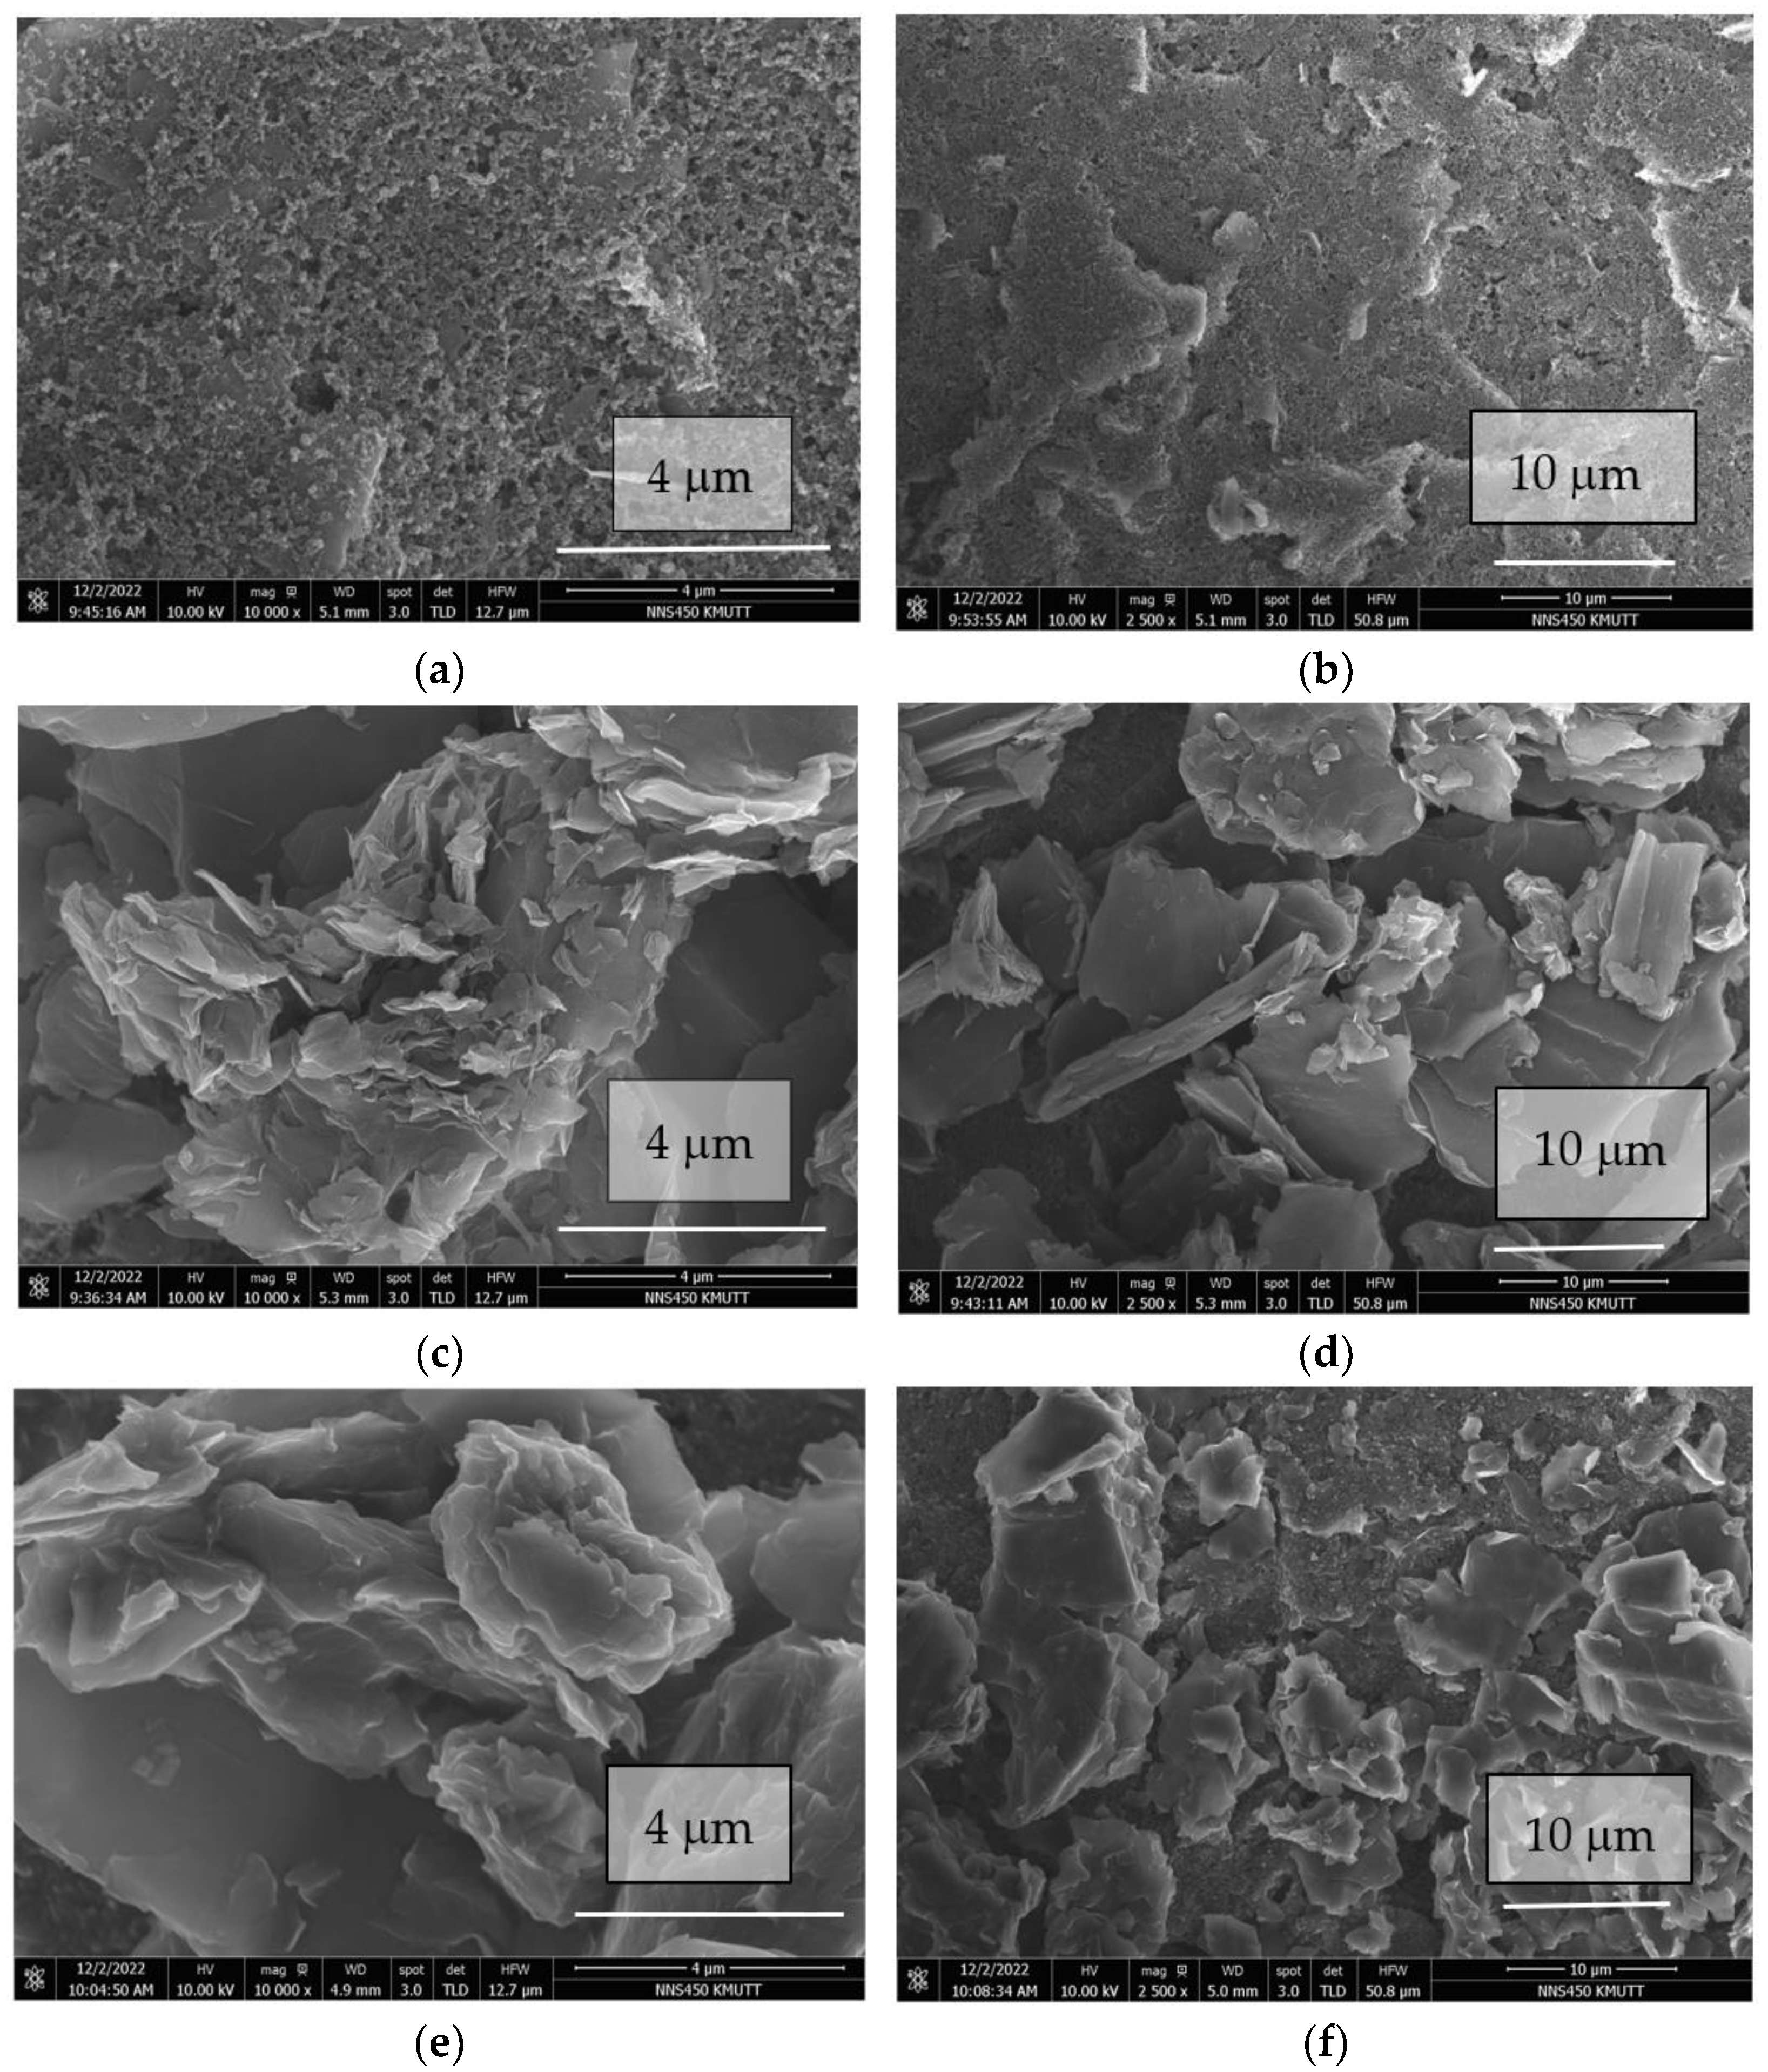
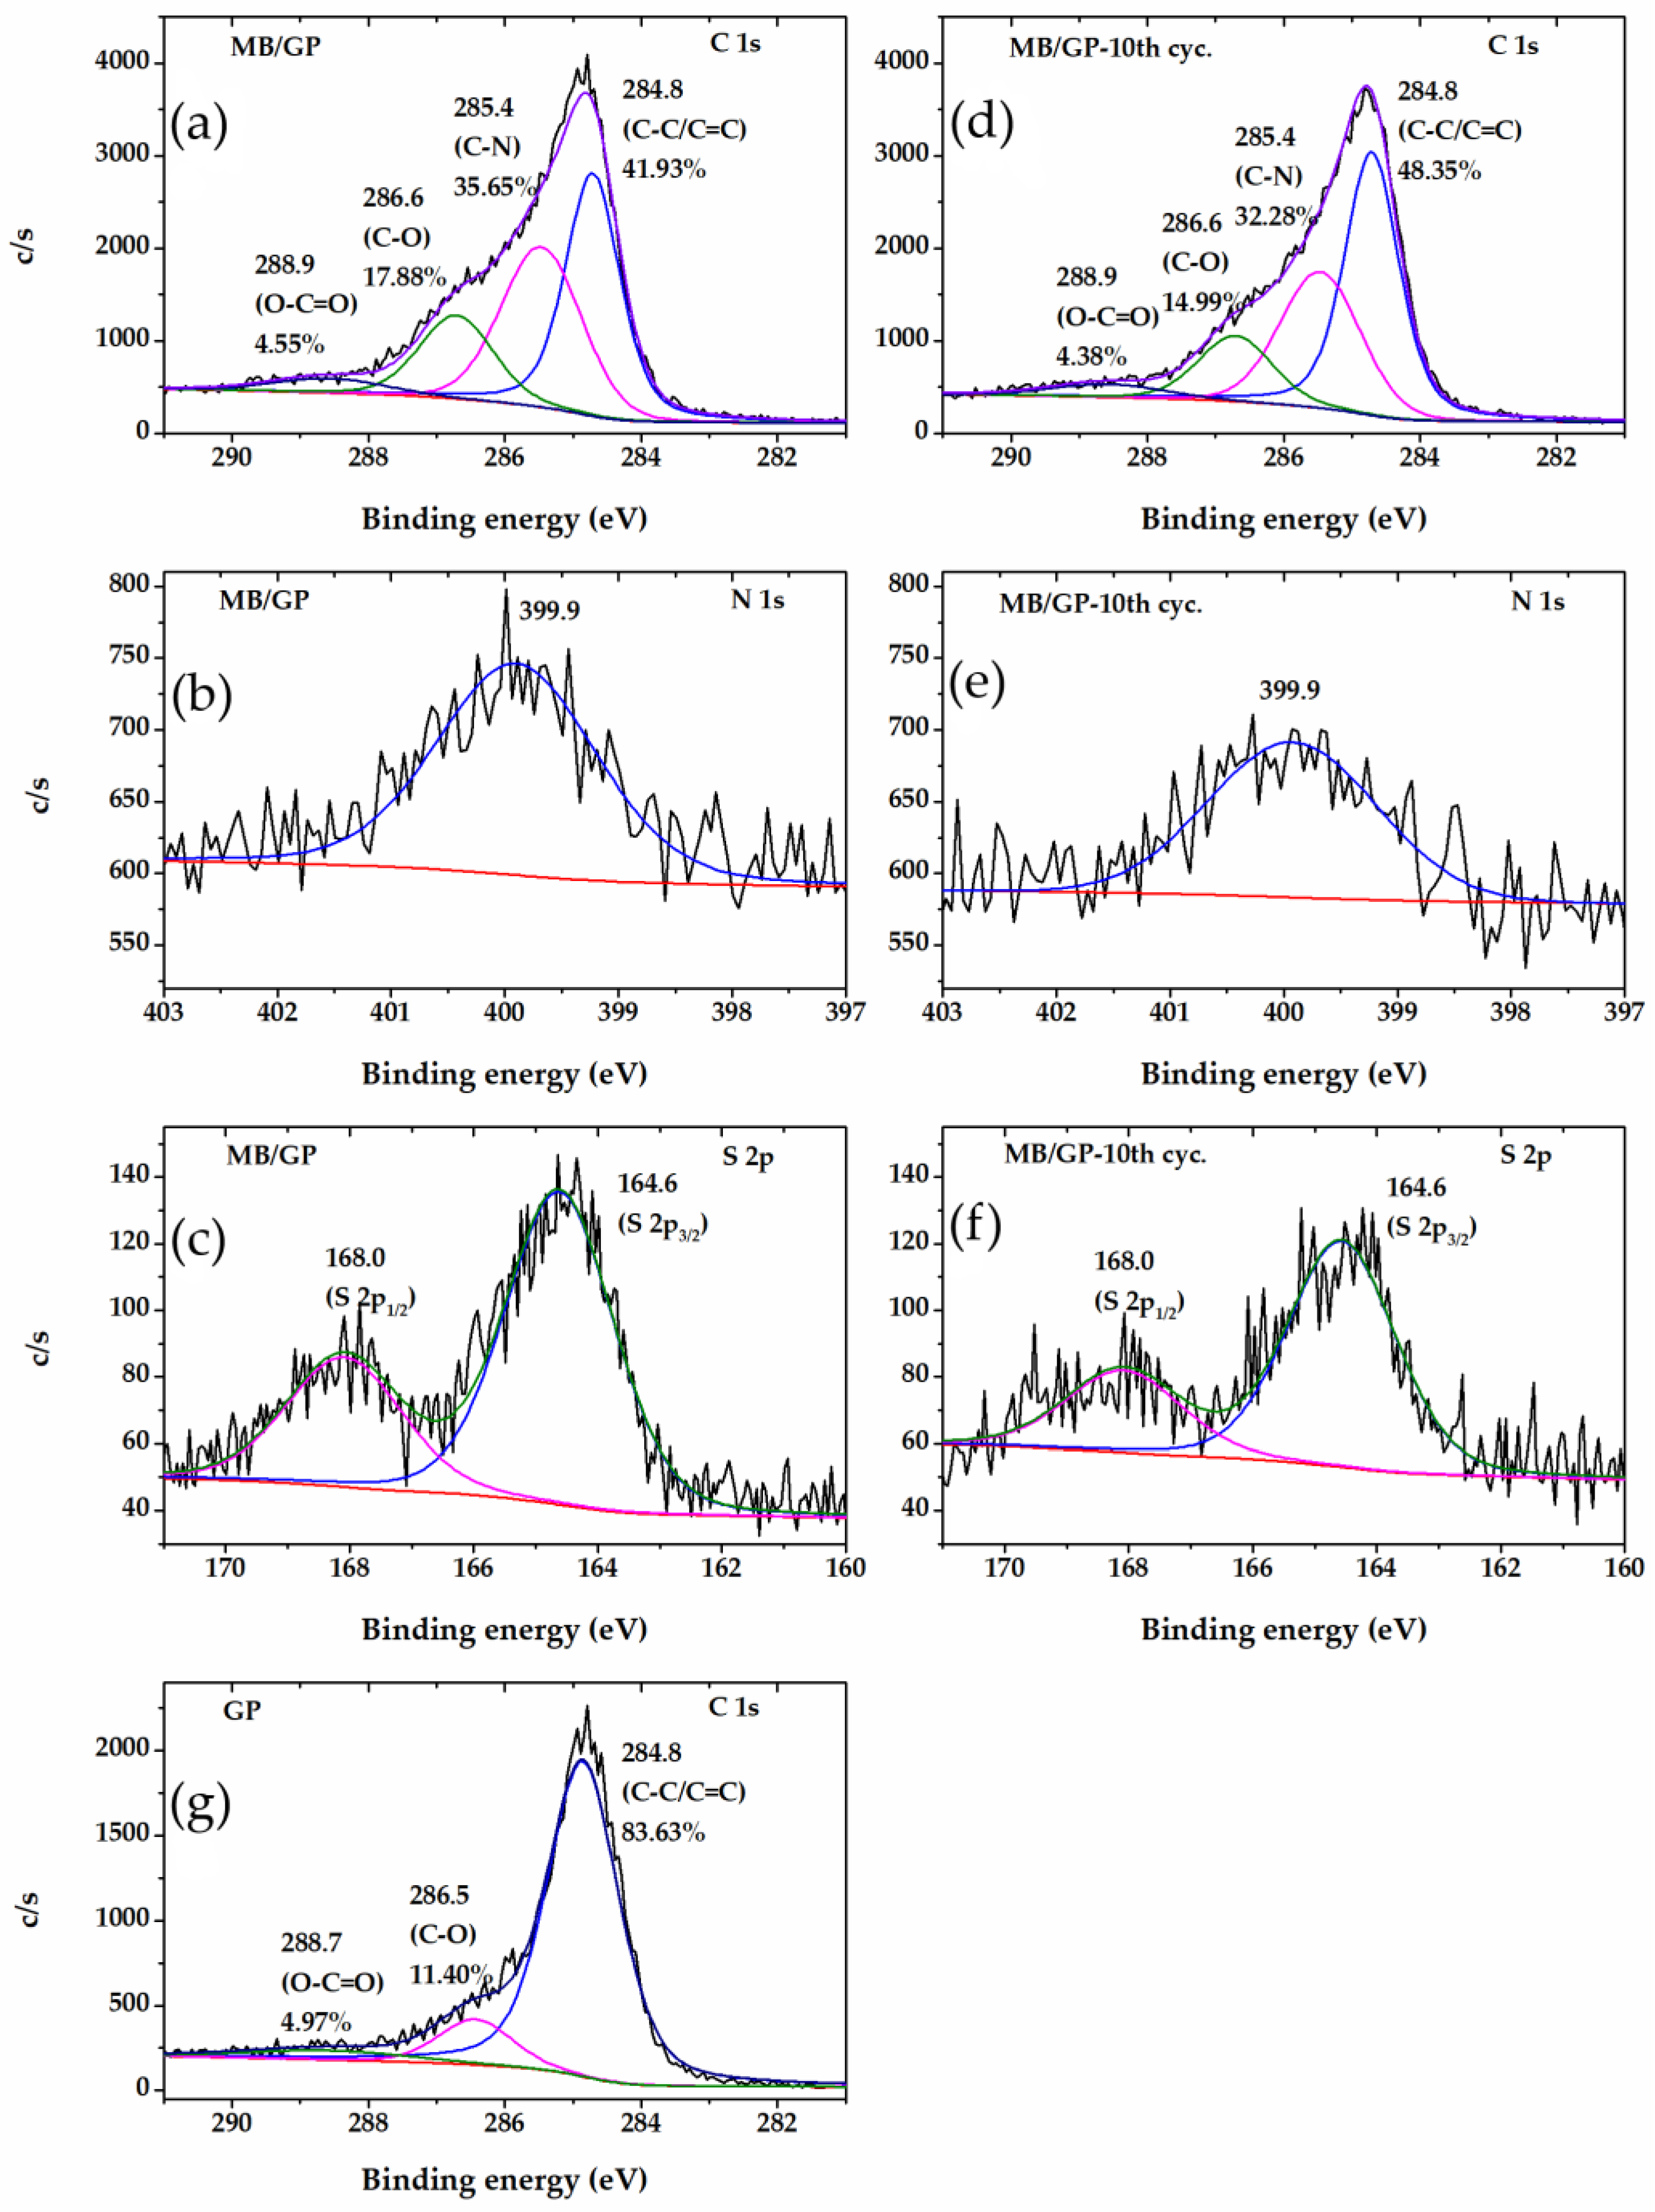
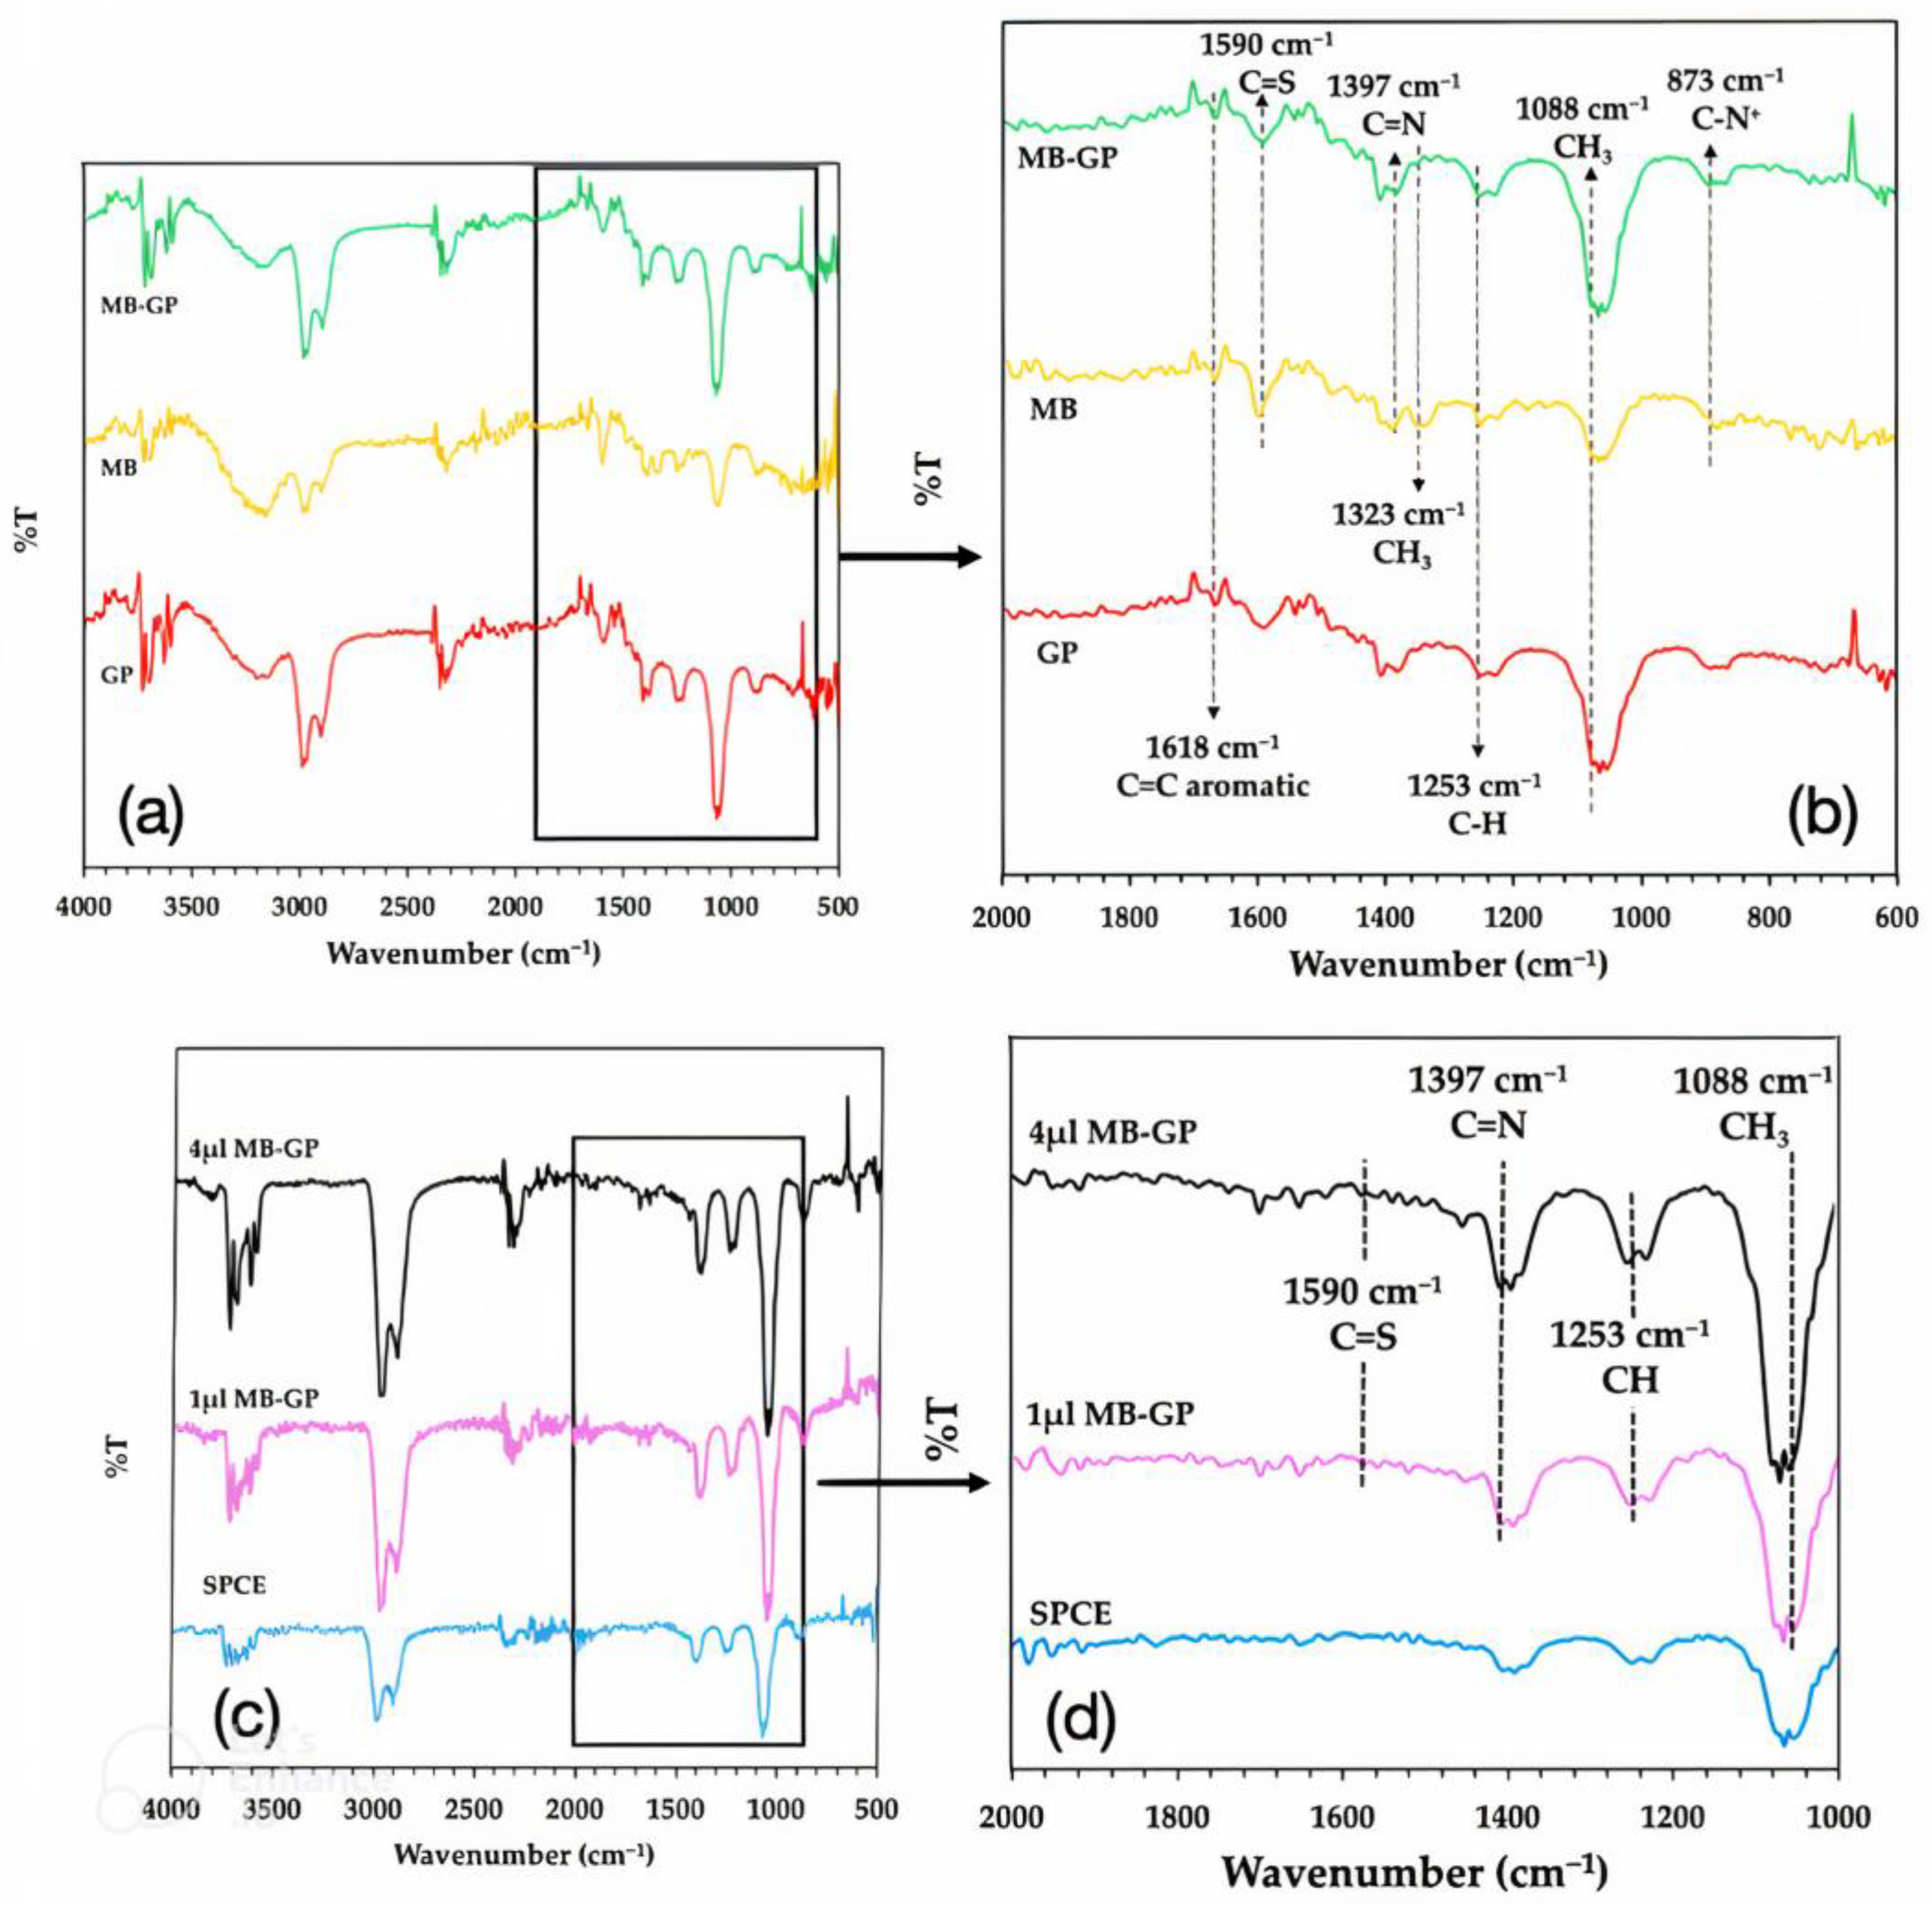
3.1. Characterization of MB/GP on Modified Electrode
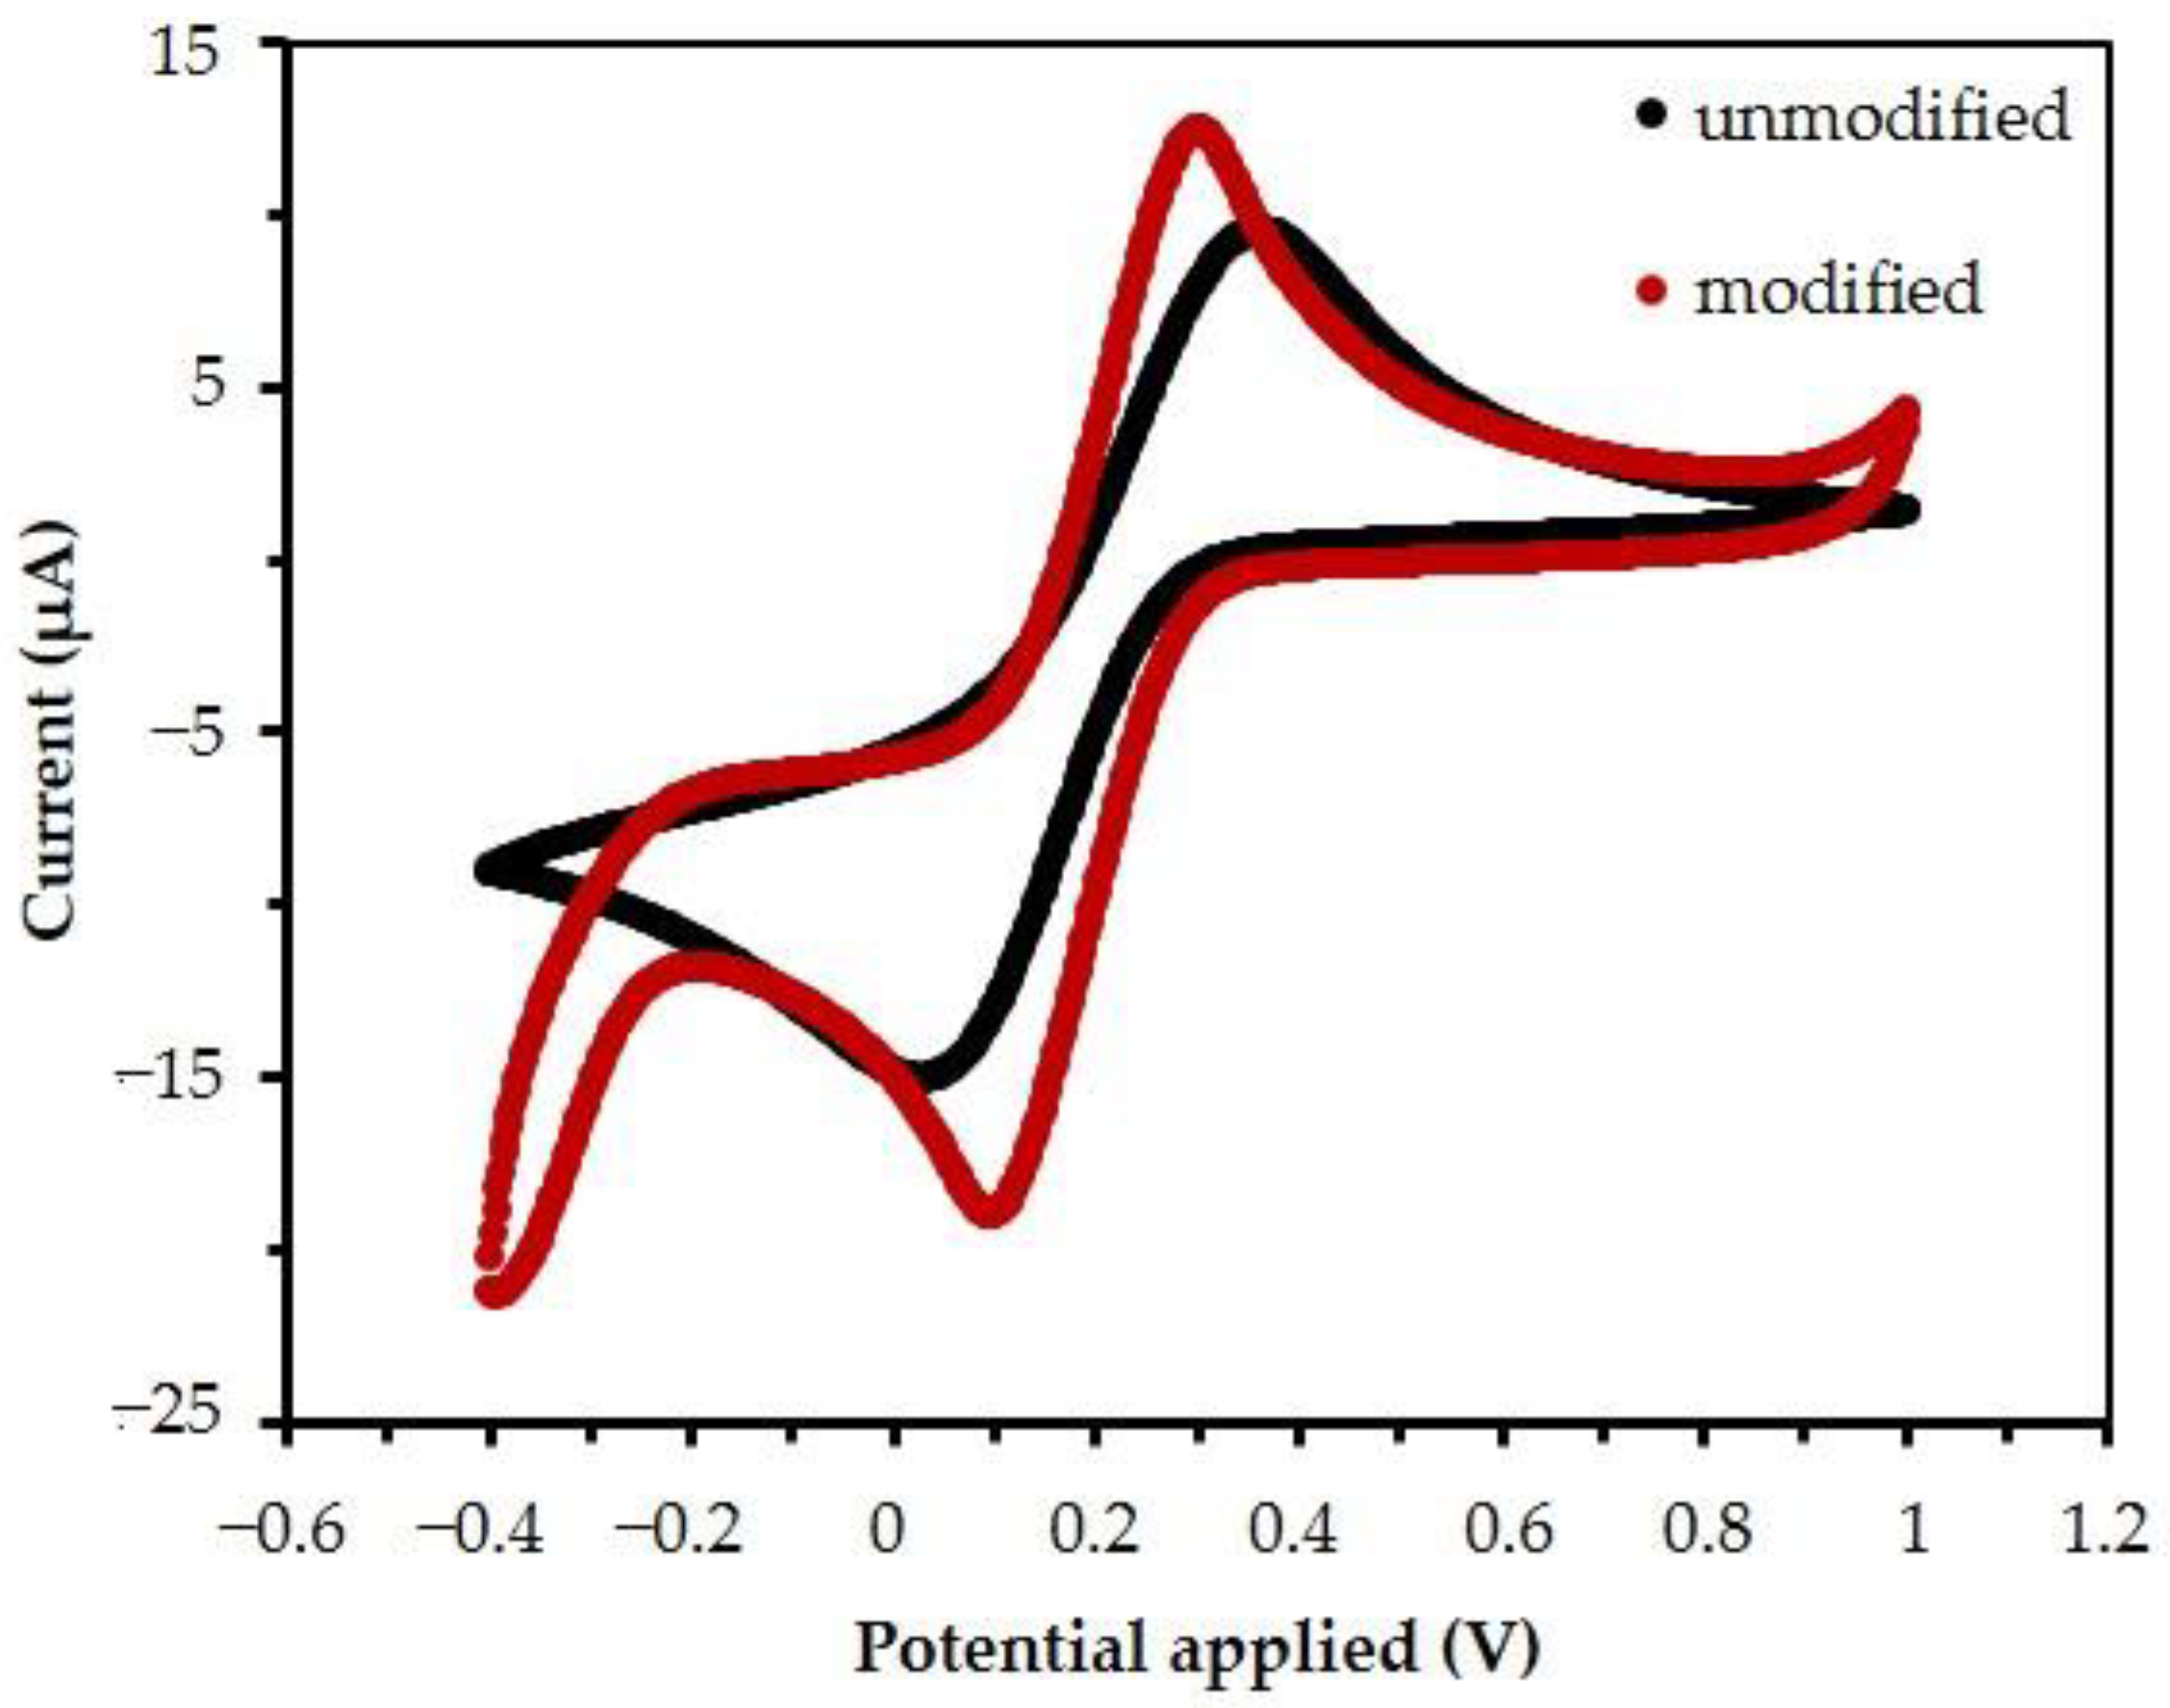
3.2. The Electrochemical Behavior of the Electrode
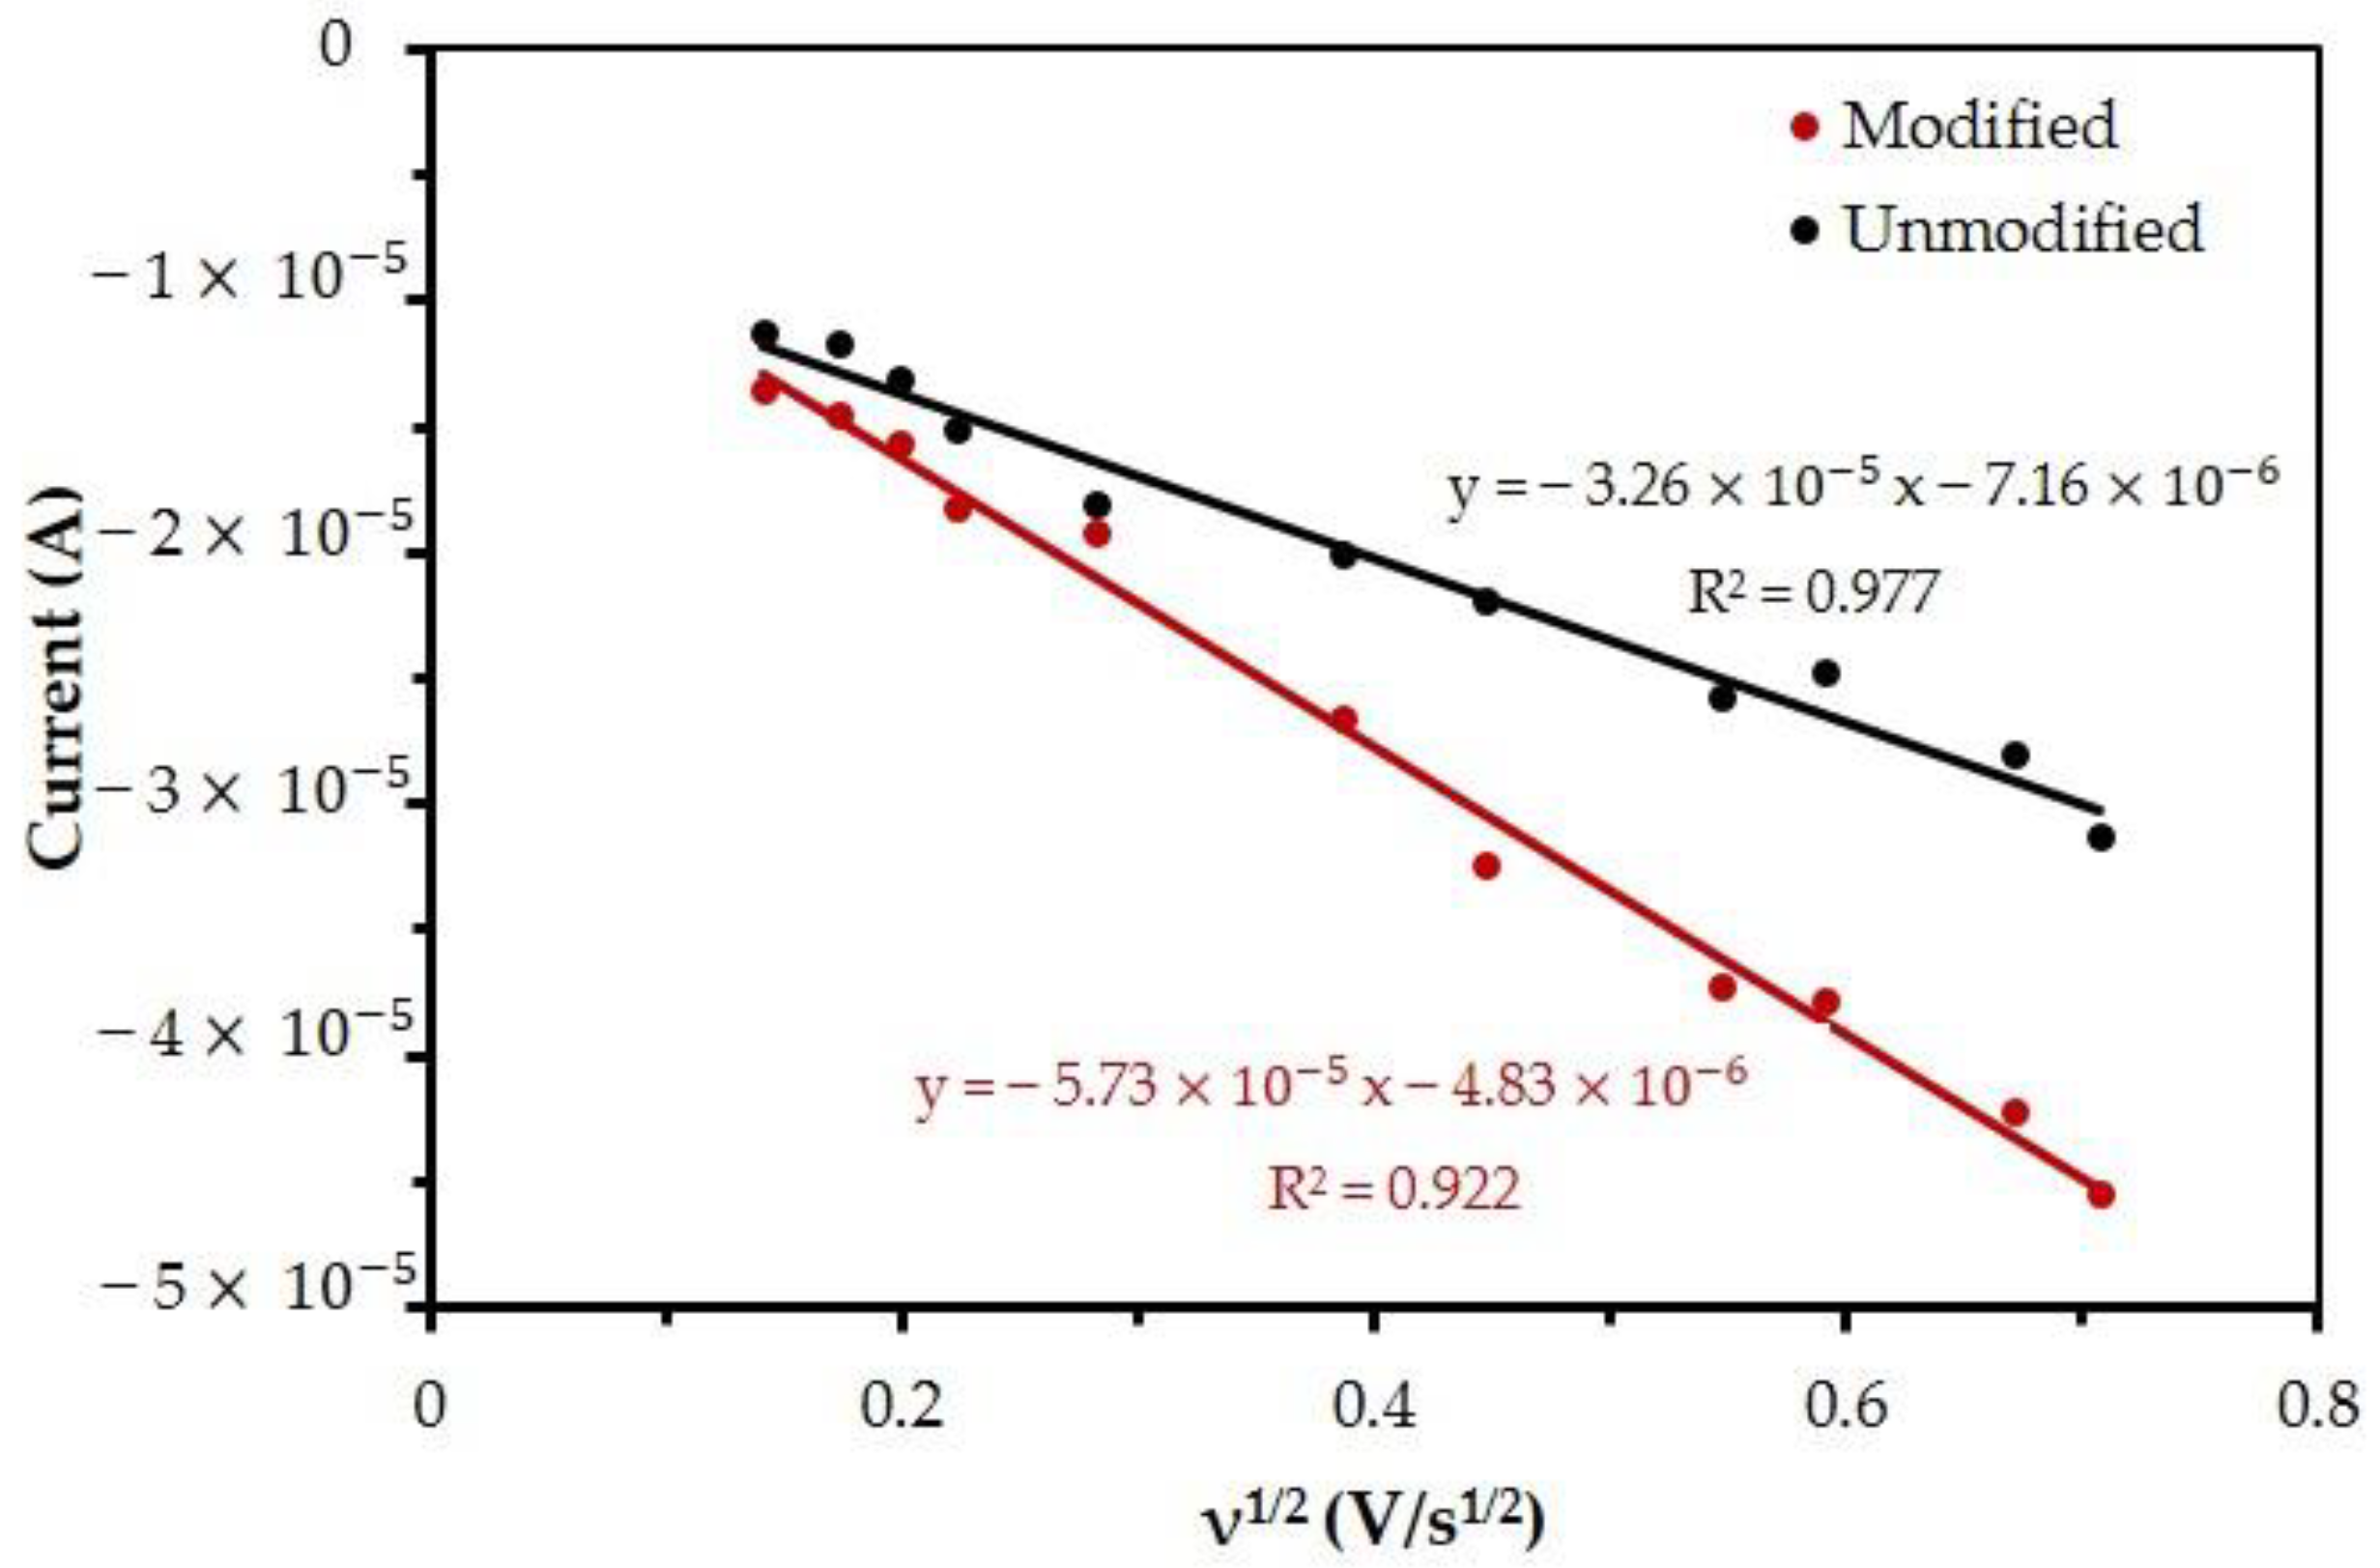
3.3. Total Active Area
3.4. The Surface Coverage
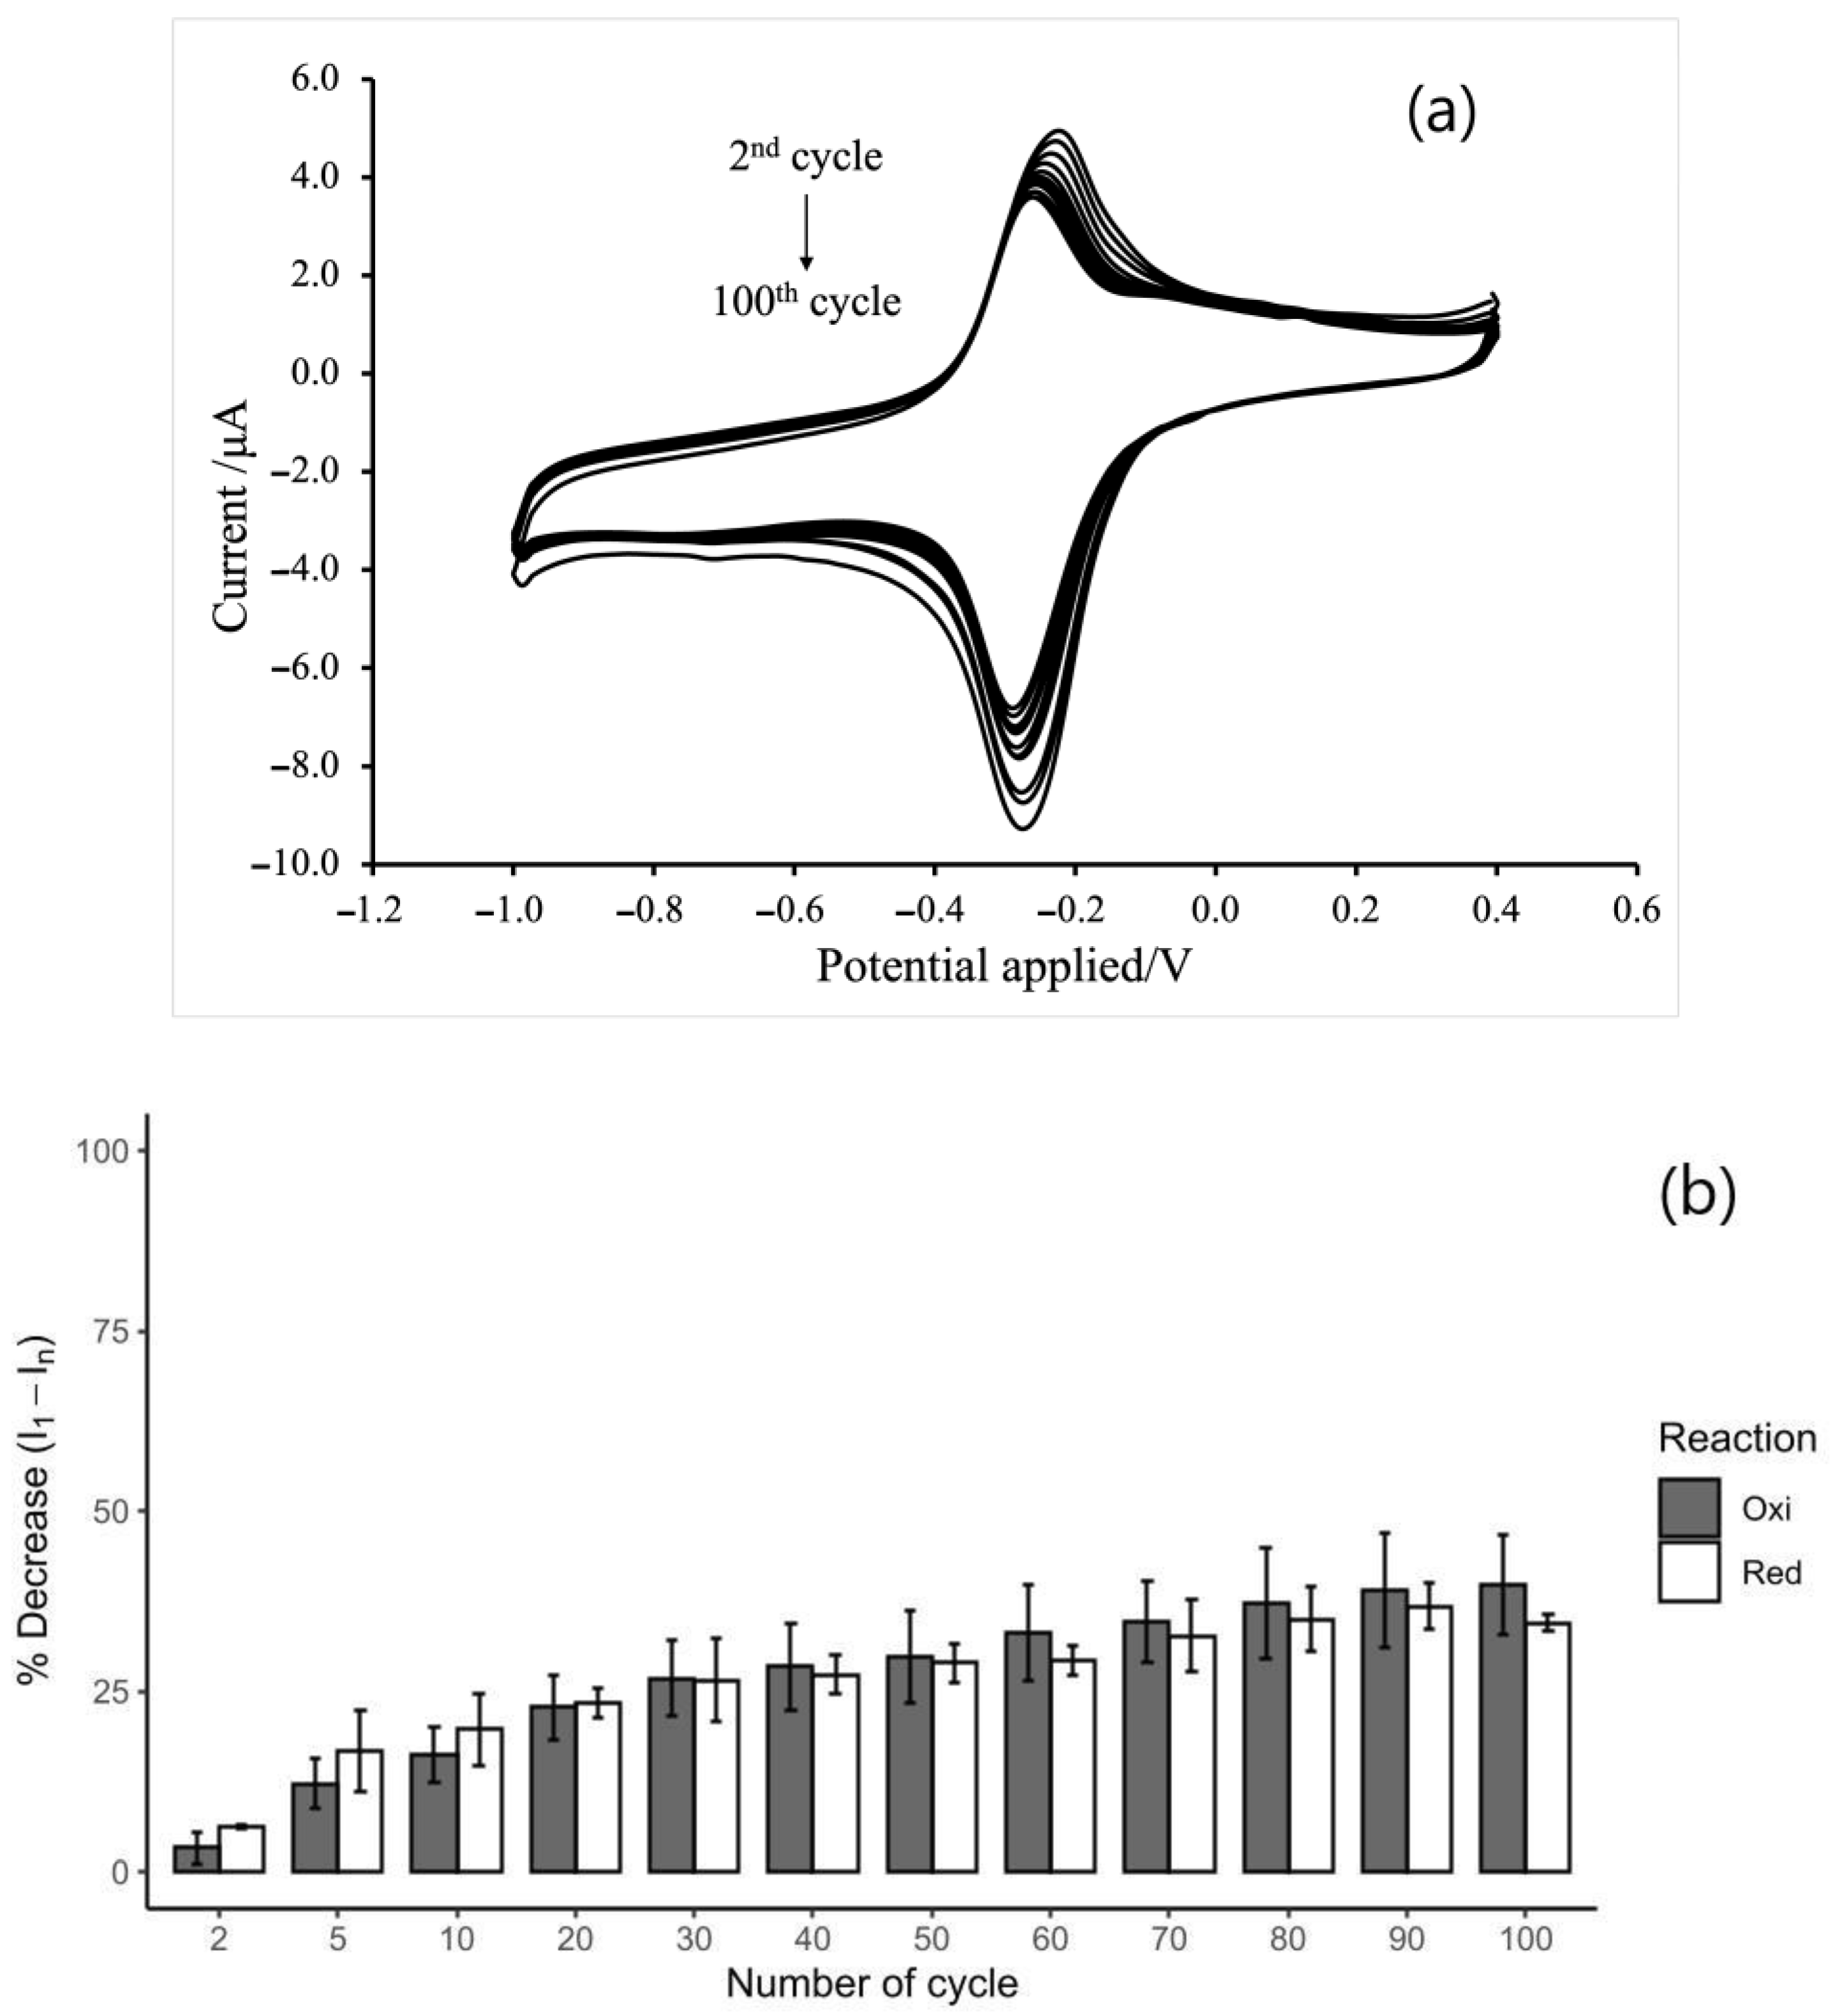
3.5. Stability of MB/GP Film on SPCE
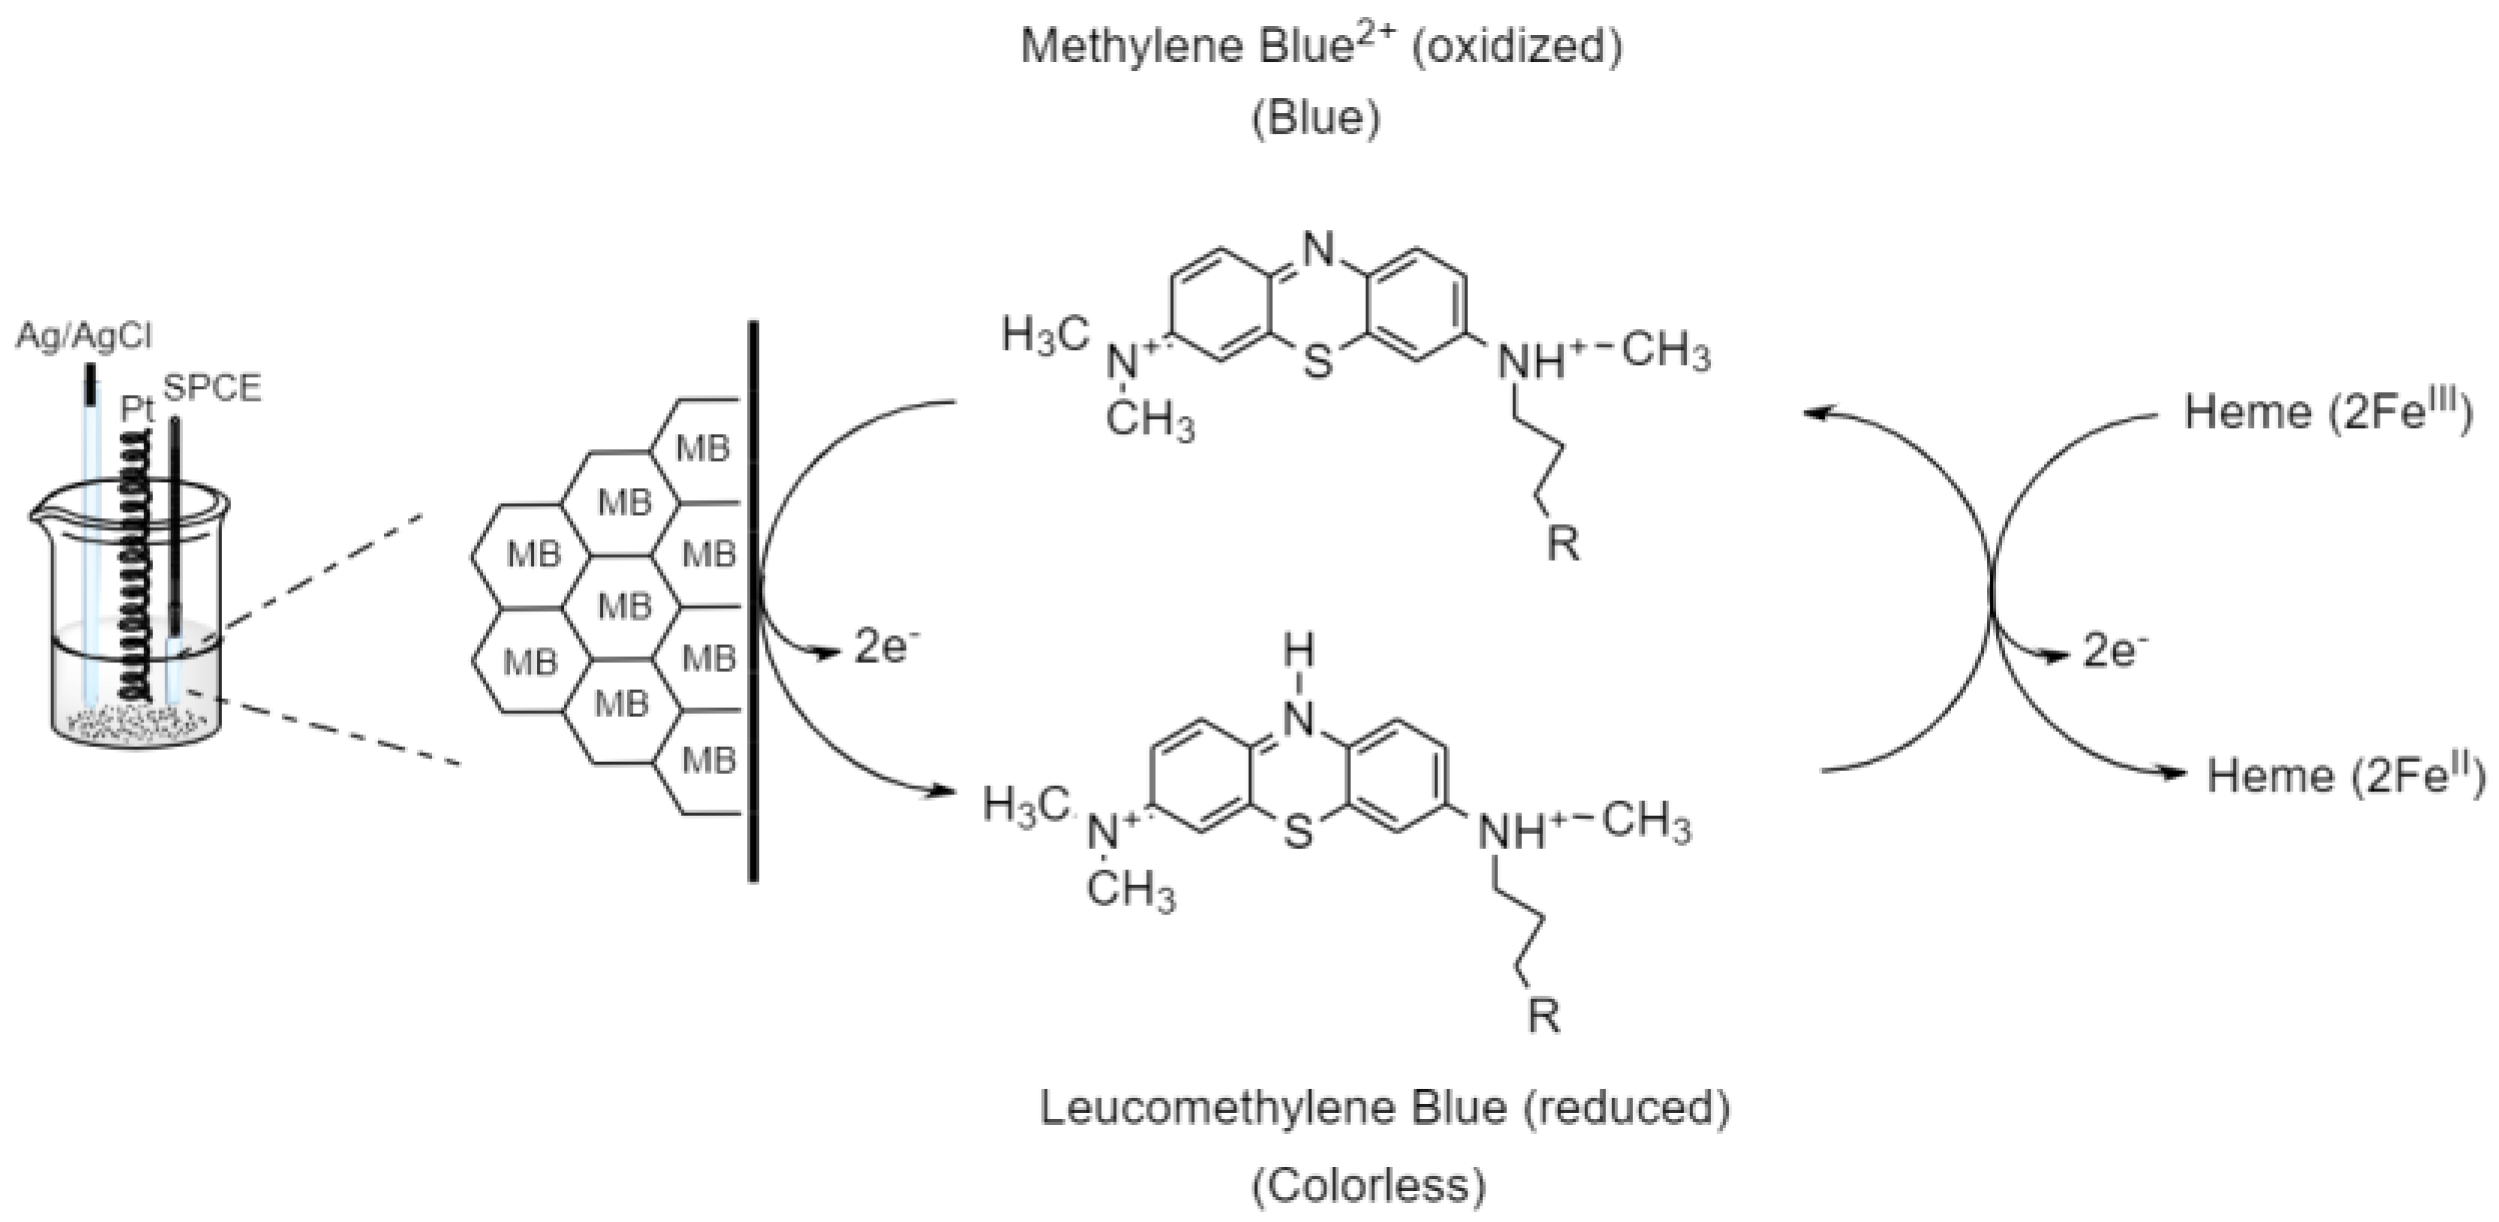
3.6. Electrocatalytic Reaction of Hemeproteins on MB/GP Modified Electrode
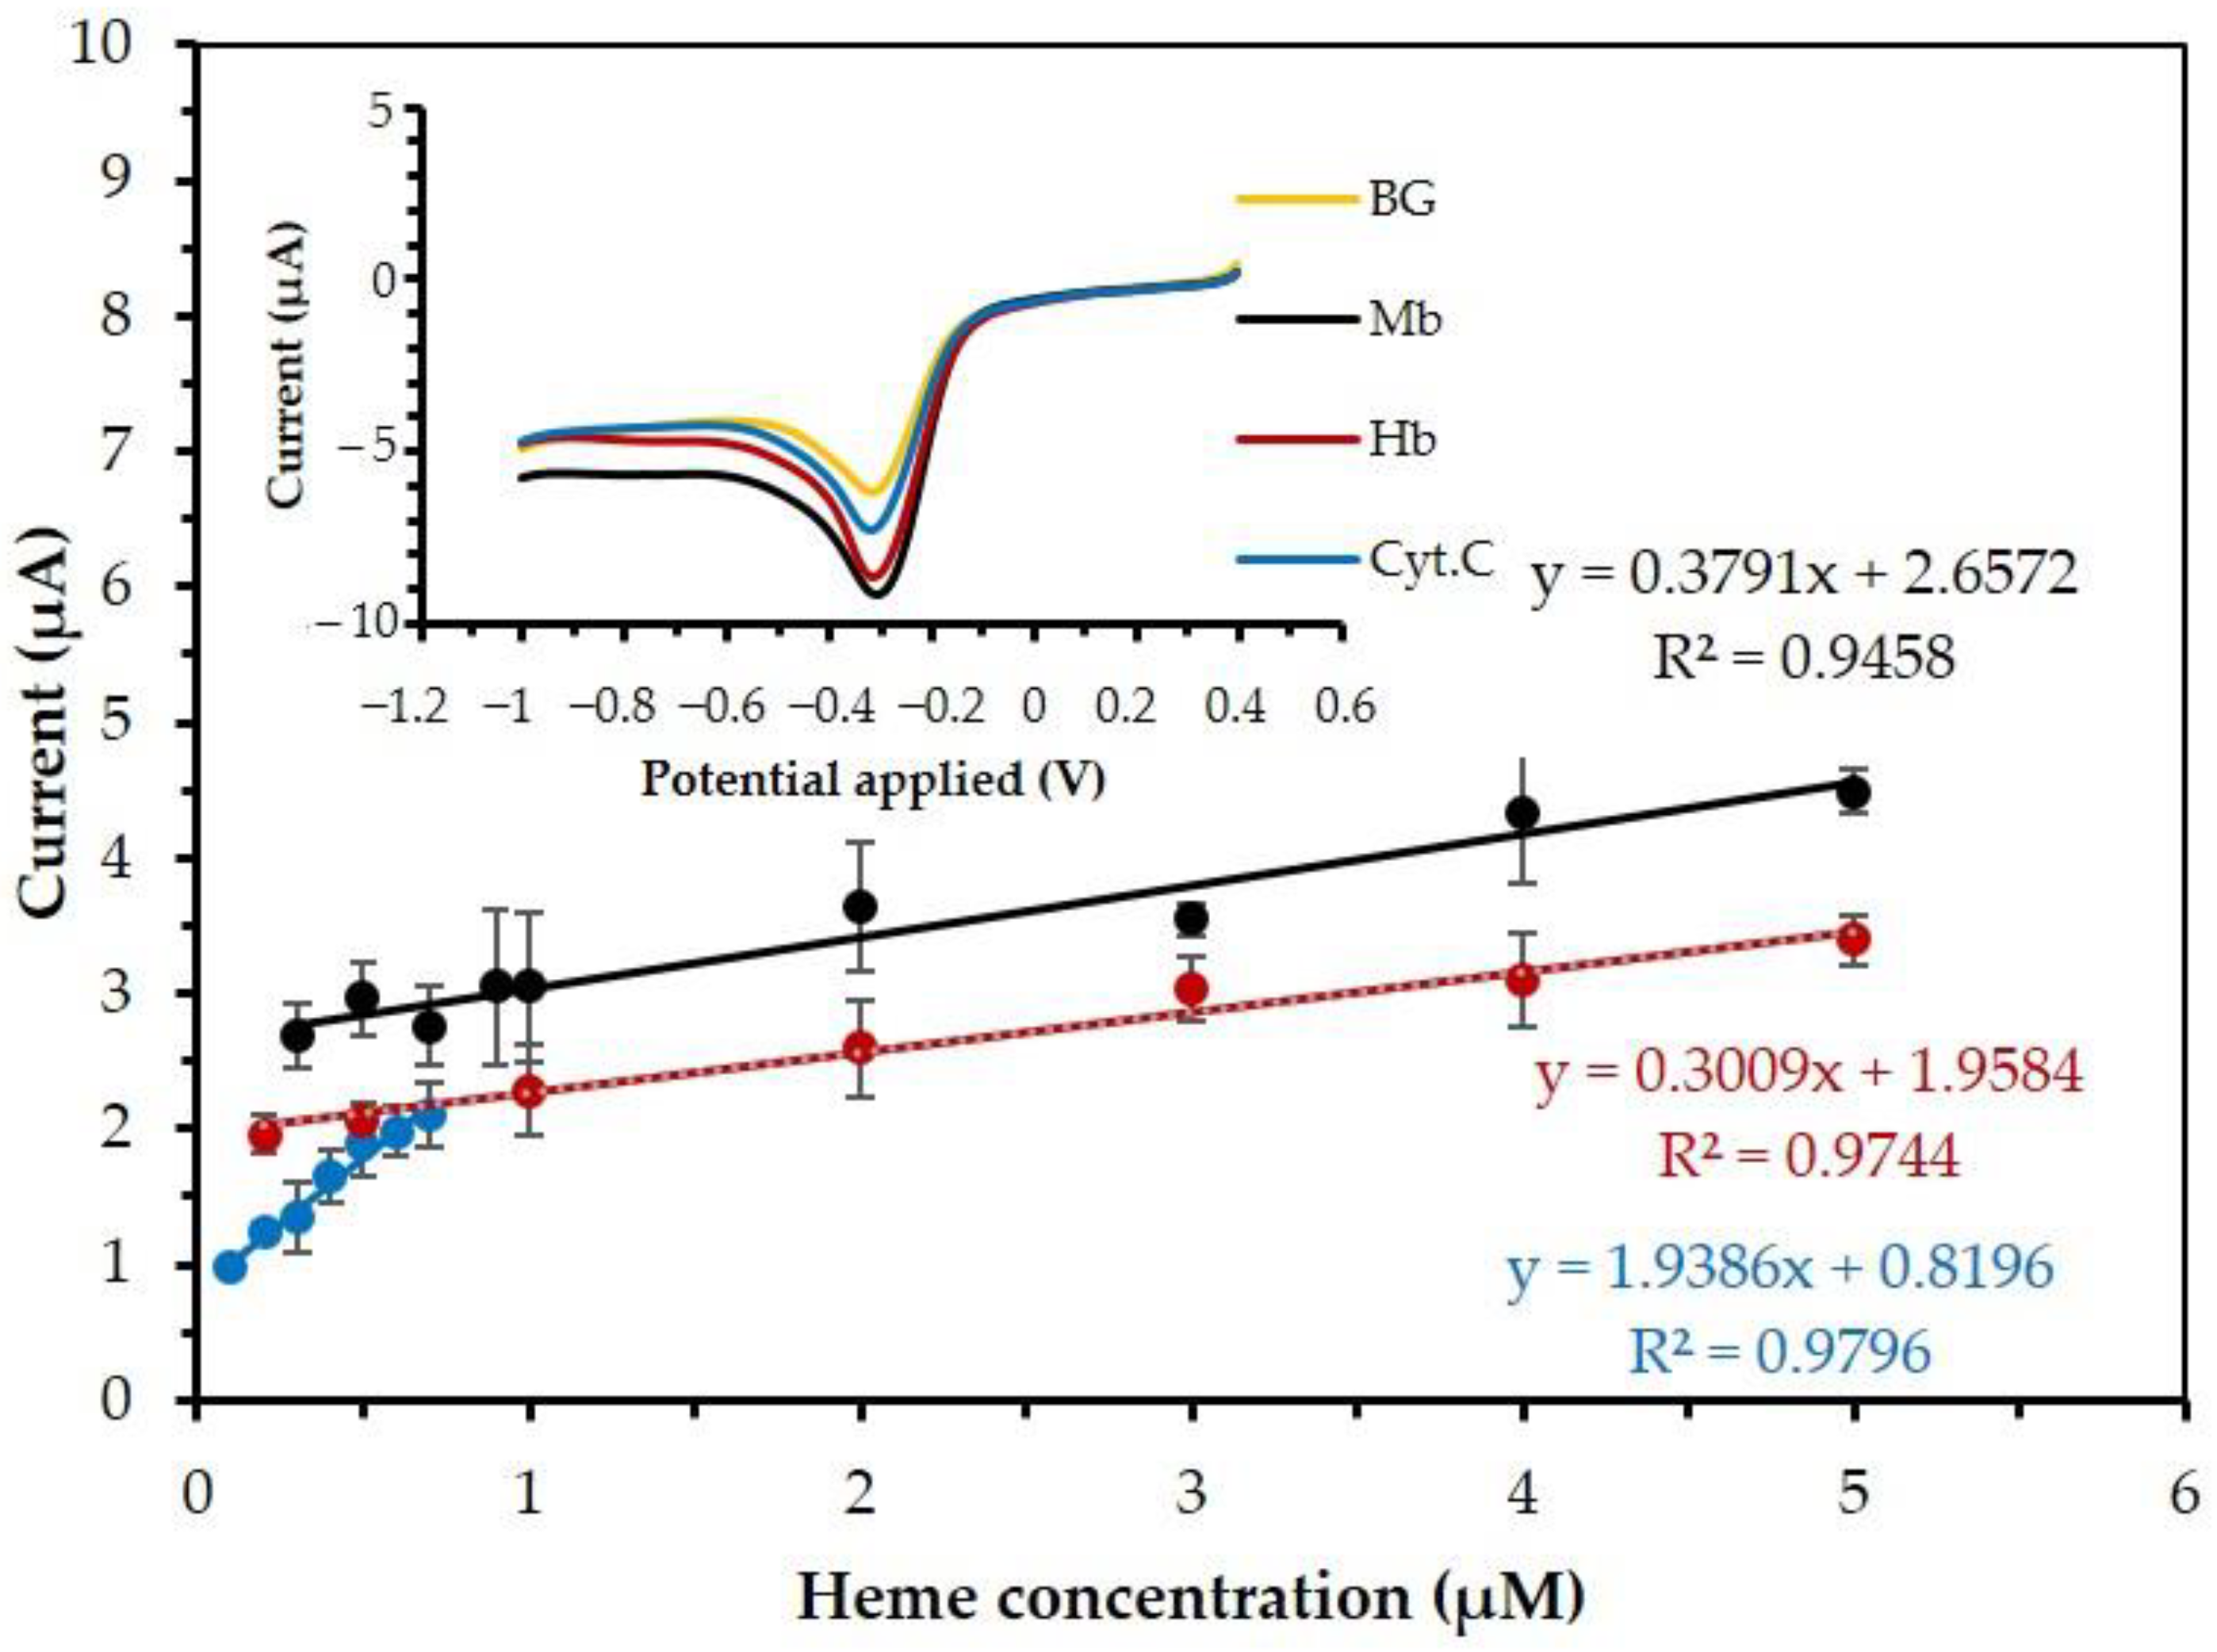
3.7. Performance of MB/GP Modified Electrode
3.8. Storage Stability of MB/GP Film on SPCE
4. Conclusions
Author Contributions
Funding
Data Availability Statement
Acknowledgments
Conflicts of Interest
References
- Lodish, H.; Berk, A.; Kaiser, C.-A.; Krieger, M.; Scott, M.-P.; Bretscher, A.; Matsudaira, P. Molecular Cell Biology, 6th ed.; W.H. Freeman and Company: New York, NY, USA, 2008. [Google Scholar]
- Nelson, D.-L.; Cox, M.-M. Principle of Biochemistry; W.H. Freeman and Company: New York, NY, USA, 2008. [Google Scholar]
- Pough, F.-H.; Janis, C.-M.; Heiser, J.-B. Vertebrate Life Boston; Pearson Benjamin Cummings: San Francisco, CA, USA, 2009. [Google Scholar]
- Baker, H.M.; Anderson, B.F.; Baker, E.N. Dealing with iron: Common structural principles in proteins that transport iron and heme. Proc. Natl. Acad. Sci. USA 2003, 58, 3579–3583. [Google Scholar] [CrossRef] [PubMed] [Green Version]
- Lei, C.; Woollenberger, U.; Bistolas, N.; Guiseppi-Elis, A.; Scheller, F.W. Analytical Bioanalytical. Chemistry 2002, 372, 235–239. [Google Scholar]
- Weissbluth, M. Hemoglobin; Springer: Heidelberg, Germany, 1974. [Google Scholar]
- Berg, J.-M.; Tymoczko, J.-L.; Stryer, T. Biochemistry, 5th ed.; W.H. Freeman and Company: New York, NY, USA, 2002. [Google Scholar]
- Pratt, C.-W.; Cornely, K. Essential Biochemistry; Wiley Global Education: Hoboken, NJ, USA, 2012. [Google Scholar]
- Schmidt, M.; Gerlach, F.; Avivi, A.; Laufs, T.; Wystub, S.; Simpson, J.C.; Nevo, E.; Saaler-Reinhardt, S.; Reuss, S.; Hankeln, T.; et al. Cytoglobin Is a Respiratory Protein in Connective Tissue and Neurons, Which Is Up-regulated by Hypoxia. J. Biol. Chem. 2004, 279, 8063–8069. [Google Scholar] [CrossRef] [PubMed] [Green Version]
- Palmer, G.; Reedijk, J. Nomenclature Committee of the International Union of Biochemistry (NC-IUB). Nomenclature of electron-transfer proteins. Recommendations 1989. Biochim. Biophys. Acta 1991, 267, 665–677. [Google Scholar]
- Sankaran, V.G.; Weiss, M.J. Anemia: Progress in molecular mechanisms and therapies. Nat. Med. 2015, 21, 221–230. [Google Scholar] [CrossRef] [Green Version]
- Gralnek, I.M.; Barkun, A.N.; Bardou, M. Management of Acute Bleeding from a Peptic Ulcer. N. Engl. J. Med. 2008, 359, 928–937. [Google Scholar] [CrossRef] [Green Version]
- Landefeld, C.; Beyth, R.J. Anticoagulant-related bleeding: Clinical epidemiology, prediction, and prevention. Am. J. Med. 1993, 95, 315–328. [Google Scholar] [CrossRef]
- Rother, R.P.; Bell, L.; Hillmen, P.; Gladwin, M.T. The Clinical Sequelae of Intravascular Hemolysis and Extracellular Plasma Hemoglobin: A novel mechanism of human disease. JAMA 2005, 293, 1653–1662. [Google Scholar] [CrossRef]
- Mayer, T.K.; Freedman, Z.R. Protein glycosylation in diabetes mellitus: A review of laboratory measurements and of their clinical utility. Clin. Chim. Acta 1983, 127, 147–184. [Google Scholar] [CrossRef]
- The Thalassaemia Working Party of the BCSH General Haematology Task Force. Guidelines for investigation of the α and β thalassemia traits. J. Clin. Pathol. 1994, 47, 289–295. [Google Scholar] [CrossRef] [Green Version]
- Working Party of the General Hematology Task Force of the British Committee for Standards in Hematology. The Laboratory Diagnosis of Haemoglobinopathies. Br. J. Haematol. 1998, 101, 783–792. [Google Scholar] [CrossRef] [PubMed]
- Silvestroni, E.; Bianco, I. A highly cost effective method of mass screening for thalassaemia. BMJ 1983, 286, 1007–1009. [Google Scholar] [CrossRef] [PubMed] [Green Version]
- Kattamis, C.; Efremov, G.; Pootrakul, S. Effectiveness of one tube osmotic fragility screening in detecting beta-thalassaemia trait. J. Med Genet. 1981, 18, 266–270. [Google Scholar] [CrossRef] [PubMed] [Green Version]
- Fischer, B.H. Treatment of Ulcers on the Legs with Hyperbaric Oxygen. J. Dermatol. Surg. Oncol. 1975, 1, 55–58. [Google Scholar] [CrossRef]
- Drabkin, D.L.; Austin, J.H. Spectrophotometric Studies: II. Preparations from washed Blood cells; Nitric oxide Hemoglobin and Self hemoglobin. J. Biol. Chem. 1935, 112, 51–65. [Google Scholar] [CrossRef]
- Kalaiyarasan, G.; Kumar, A.V.N.; Sivakumar, C.; Joseph, J. Photoluminescence of oligomers of aniline-2-sulfonic acid formed in the presence of AuCl4− and sodium citrate: Application in the optical detection of hemoglobin. Sens. Actuators B Chem. 2015, 209, 883–888. [Google Scholar] [CrossRef]
- Pourreza, N.; Golmohammadi, H. Hemoglobin detection using curcumin nanoparticles as a colorimetric chemosensor. RSC Adv. 2015, 5, 1712–1717. [Google Scholar] [CrossRef]
- Wajcman, H. Hemoglobin Disorders: Molecular Methods and Protocols; Humana Press Inc.: Totowa, NJ, USA, 2003; pp. 21–29. [Google Scholar]
- Traore, Z.S.; Shah, S.M.; Su, X. Flow-injection chemiluminescence determination of haemoglobin in the blood. Luminescence 2013, 28, 56–62. [Google Scholar] [CrossRef]
- Gabriel, L.; Soizic, C.; Cyrill, P.; Grard, S.; Corinne, L.; Joelle., R.-B. Direct Electron Transfer of Hemoglobin and Myoglobin at the Bare Glassy Carbon Electrode in an Aqueous BMI.BF4 Ionic-Liquid Mixture. ChemPhysChem 2011, 12, 411–418. [Google Scholar] [CrossRef]
- Handin, R.I.; Lux, S.E.; Stossel, T.P. Blood: Principles & Practica of Hematology, 1st ed.; Lippincott Williams & Wilkins: Philadelphia, PA, USA, 2003. [Google Scholar]
- Murray, S.S.; McKinney, E.S. Foundations of Maternal-Newborn Nursing, 4th ed.; Saunders Elsevier: Philadelphia, PA, USA, 2006; p. 919. [Google Scholar]
- Wu, A.H.; Laios, I.; Green, S.; Gornet, T.G.; Wong, S.S.; Parmley, L.; Tonnesen, A.S.; Plaisier, B.; Orlando, R. Immunoassays for serum and urine myoglobin: Myoglobin clearance assessed as a risk factor for acute renal failure. Clin. Chem. 1994, 440, 796–802. [Google Scholar] [CrossRef]
- Goldstein, J.C.; Muñoz-Pinedo, C.; Ricci, J.E.; Adams, S.R.; Kelekar, A.; Schuler, M.; Tsien, R.Y.; Green, D.R. Cytochrome c is released in a single step during apoptosis. Cell Death Differ. 2005, 12, 453–462. [Google Scholar] [CrossRef] [PubMed]
- Dejean, L.M.; Martinez-Caballero, S.; Guo, L.; Hughes, C.; Teijido, O.; Ducret, T.; Ichas, F.; Korsmeyer, S.J.; Antonsson, B.; Jonas, E.A.; et al. Oligomeric Bax Is a Component of the Putative Cytochrome c Release Channel MAC, Mitochondrial Apoptosis-induced Channel. Mol. Biol. Cell 2005, 16, 2424–2432. [Google Scholar] [CrossRef] [PubMed] [Green Version]
- Jow, G.-M.; Chou, C.-J.; Chen, B.-F.; Tsai, J.-H. Beauvericin induces cytotoxic effects in human acute lymphoblastic leukemia cells through cytochrome c release, caspase 3 activation: The causative role of calcium. Cancer Lett. 2004, 216, 165–173. [Google Scholar] [CrossRef] [PubMed]
- Armstrong, A.F.; Dudgeon, P. A systemic approach to occupational stress. Syst. Res. 1988, 5, 101–106. [Google Scholar] [CrossRef]
- Sun, H.; Hu, N.; Ma, H. Direct Electrochemistry of Hemoglobin in Polyacrylamide Hydrogel Films on Pyrolytic Graphite Elec-trodes. Electroanalysis 2000, 12, 1064–1070. [Google Scholar] [CrossRef]
- Hu, Y. Electrochemistry and electrocatalysis with myoglobin in biomembrane-like surfactant-polymer 2C12N+PA− composite films. Talanta 2000, 50, 1183–1195. [Google Scholar] [CrossRef]
- Chen, X.; Hu, N.; Zeng, Y.; Rusling, J.F.; Yang, J. Ordered Electrochemically Active Films of Hemoglobin, Didodecyldimethylammonium Ions, and Clay. Langmuir 1999, 15, 7022–7030. [Google Scholar] [CrossRef]
- Merino, M.; Nuñez-Vergara, L.-J.; Squella, J.-A. Cytochrome C reductase immobilized on carbon paste electrode and its electro-catalytic effect on the reduction of cytochrome C. Boletín De La Soc. Chil. De Química 2000, 45, 1–7. [Google Scholar]
- Feng, J.-J.; Zhao, G.; Xu, J.-J.; Chen, H.-Y. Direct electrochemistry and electrocatalysis of heme proteins immobilized on gold nanoparticles stabilized by chitosan. Anal. Biochem. 2005, 342, 280–286. [Google Scholar] [CrossRef]
- Zhao, G.-C.; Zhang, L.; Wei, X.-W. An unmediated H2O2 biosensor based on the enzyme-like activity of myoglobin on multi-walled carbon nanotubes. Anal. Biochem. 2004, 329, 160–161. [Google Scholar] [CrossRef]
- Pakapongpan, S.; Palangsuntikul, R.; Surareungchai, W. Electrochemical sensors for hemoglobin and myoglobin detection based on methylene blue-multiwalled carbon nanotubes nanohybrid-modified glassy carbon electrode. Electrochim. Acta 2011, 56, 6831–6836. [Google Scholar] [CrossRef]
- Qiao, L.; Wang, X.; Sun, X. A Novel Label-Free Amperometric Immunosensor Based on Graphene Sheets-Methylene Blue Nanocomposite/Gold Nanoparticles. Int. J. Electrochem. Sci. 2014, 9, 1399–1414. [Google Scholar]
- Li, Y.; Yang, W.-K.; Fan, M.-Q.; Liu, A. A Sensitive Label-free Amperometric CEA Immunosensor Based on Graphene-Nafion Nanocomposite Film as an Enhanced Sensing Platform. Anal. Sci. 2011, 27, 727–731. [Google Scholar] [CrossRef] [PubMed] [Green Version]
- Khan, M.U.; Hassan, G.; Shaukat, R.A.; Saqib, Q.M.; Chougale, M.Y.; Kim, J.; Bae, J. Wide range and highly linear signal processed systematic humidity sensor array using Methylene Blue and Graphene composite. Sci. Rep. 2021, 11, 16665. [Google Scholar] [CrossRef]
- Punetha, V.D.; Rana, S.; Yoo, H.J.; Chaurasia, A.; McLeskey, J.T., Jr.; Ramasamy, M.S.; Sahoo, N.G.; Cho, J.W. Functionalization of carbon nanomaterials for advanced polymer nanocomposites: A comparison study between CNT and graphene. Prog. Polym. Sci. 2017, 67, 1–47. [Google Scholar] [CrossRef]
- Poo-Arporn, Y.; Pakapongpan, S.; Chanlek, N.; Poo-Arporn, R.P. The development of disposable electrochemical sensor based on Fe3O4-doped reduced graphene oxide modified magnetic screen-printed electrode for ractopamine determination in pork sample. Sens. Actuators B Chem. 2018, 284, 164–171. [Google Scholar] [CrossRef]
- Lin, L.; Song, X.; Chen, Y.; Rong, M.; Zhao, T.; Jiang, Y.; Wang, Y.; Chen, X. One-pot synthesis of highly greenish-yellow fluorescent nitrogen-doped graphene quantum dots for pyrophosphate sensing via competitive coordination with Eu3+ions. Nanoscale 2015, 7, 15427–15433. [Google Scholar] [CrossRef]
- Poo-Arporn, R.P.; Pakapongpan, S.; Khownarumit, P.; Waraho-Zhmayev, D.; Poo-Arporn, Y.; Surareungchai, W. Development of Mevalonic Acid Biosensor Using Amperometric Technique Based on Nanocomposite of Nicotinamide Adenine Dinucleotide and Carbon Nanotubes. J. Electrochem. Soc. 2017, 164, B349–B355. [Google Scholar] [CrossRef]
- Zhou, X.; Xu, M.; Wang, L.; Liu, X. The Adsorption of Methylene Blue by an Amphiphilic Block Co-Poly(Arylene Ether Nitrile) Microsphere-Based Adsorbent: Kinetic, Isotherm, Thermodynamic and Mechanistic Studies. Nanomaterials 2019, 9, 1356. [Google Scholar] [CrossRef] [Green Version]
- Zhang, Z.; Huang, H.; Yang, X.; Zang, L. Tailoring Electronic Properties of Graphene by π–π Stacking with Aromatic Molecules. J. Phys. Chem. Lett. 2011, 2, 2897–2905. [Google Scholar] [CrossRef]
- Yan, Y.; Zhang, M.; Gong, K.; Su, L.; Guo, Z.; Mao, L. Adsorption of Methylene Blue Dye onto Carbon Nanotubes: A Route to an Electrochemically Functional Nanostructure and Its Layer-by-Layer Assembled Nanocomposite. Chem. Mater. 2005, 17, 3457–3463. [Google Scholar] [CrossRef]
- Yang, S.; Liu, D.; Meng, Q.B.; Wu, S.; Song, X.-M. Reduced graphene oxide-supported methylene blue nanocomposite as a glucose oxidase-mimetic for electrochemical glucose sensing. RSC Adv. 2018, 8, 32565–32573. [Google Scholar] [CrossRef] [PubMed] [Green Version]
- Saxena, S.; Tyson, T.A.; Shukla, S.; Negusse, E.; Chen, H.; Bai, J. Investigation of structural and electronic properties of graphene oxide. Appl. Phys. Lett. 2011, 99, 013104. [Google Scholar] [CrossRef] [Green Version]
- Sankar, R.; Karthik, A.; Prabu, A.; Karthik, S.; Shivashangari, K.S.; Ravikumar, V. Origanum vulgare mediated biosynthesis of silver nanoparticles for its antibacterial and anticancer activity. Colloids Surf. B Biointerfaces 2013, 108, 80–84. [Google Scholar] [CrossRef]
- Ai, L.; Zhang, C.; Liao, F.; Wang, Y.; Li, M.; Meng, L.; Jiang, J. Removal of methylene blue from aqueous solution with magnetite loaded multi-wall carbon nanotube: Kinetic, isotherm and mechanism analysis. J. Hazard. Mater. 2011, 198, 282–290. [Google Scholar] [CrossRef]
- Hayyan, M.; Abo-Hamad, A.; AlSaadi, M.A.; Hashim, M.A. Functionalization of graphene using deep eutectic solvents. Nanoscale Res. Lett. 2015, 10, 3–24. [Google Scholar] [CrossRef] [Green Version]
- Allen, J.-B.; Larry, R.-F. Electrochemical Methods: Fundamentals and Applications, 2nd ed.; David, H., Elizabeth, S., Charity, R., Eugene, A., Eds.; John Wiley & Sons: Hoboken, NJ, USA, 2001. [Google Scholar]
- Adams, R. Electrochemistry at Solid Electrodes; Marcel Dekker: New York, NY, USA, 1969; p. 1098. [Google Scholar]
- Zanello, P. Inorganic Electrochemistry: Theory, Practice and Application; Royal Society of Chemistry: London, UK, 2003. [Google Scholar]
- Stevens, N.P.C.; Rooney, M.B.; Bond, A.M.; Feldberg, S.W. A Comparison of Simulated and Experimental Voltammograms Obtained for the [+Fe(CN)6]3-/4- Couple in the Absence of Added Supporting Electrolyte at a Rotating Disk Electrode. J. Phys. Chem. A 2001, 105, 9085–9093. [Google Scholar] [CrossRef]
- Khownarumit, P.; Phanthong, C.; Surareungchai, W. Efficiency of Nanomaterials Modified Screen-Printed Electrode for Sudan I Detection Based on Electrochemical Experiments. KMUTT Res. Dev. J. 2017, 40, 473–483. [Google Scholar]
- Mechanism of Action. Available online: http://www.provayblue.com/MOA (accessed on 17 December 2019).
- Ju, H.; Xun, Y.; Chen, H. Heterogeneous catalytic reaction at a methylene blue/Nafion® modified carbon fiber microcylinder electrode. J. Electroanal. Chem. 1995, 380, 283–285. [Google Scholar] [CrossRef]
- Galus, Z. Fundamentals of Electrochemical Analysis; Eills Horwood: NewYork, NY, USA, 1994. [Google Scholar]
- Shen, L.; Hu, N. Heme protein films with polyamidoamine dendrimer: Direct electrochemistry and electrocatalysis. Biochim. Biophys. Acta BBA 2000, 1608, 23–33. [Google Scholar] [CrossRef] [PubMed] [Green Version]
- Royer, W.E., Jr. High-Resolution Crystallographic Analysis of a Co-operative Dimeric Hemoglobin. J. Mol. Biol. 1994, 235, 657–681. [Google Scholar] [CrossRef] [PubMed]
- Phillips, S.E. Structure and refinement of oxymyoglobin at 1·6 Å resolution. J. Mol. Biol. 1980, 142, 531–554. [Google Scholar] [CrossRef] [PubMed]
- Than, M.E.; Hof, P.; Huber, R.; Bourenkov, G.; Bartunik, H.D.; Buse, G.; Soulimane, T. Thermus thermophilus cytochrome-c552: A new highly thermostable cytochrome-c structure obtained by MAD phasing. J. Mol. Biol. 1997, 271, 629–644. [Google Scholar] [CrossRef] [PubMed]


| Sample | Calibration Equation | Linear Range (µM) | Correlation Coefficients (R2) | LOD (µM) | Sensitivity (µA/µM) |
|---|---|---|---|---|---|
| Hb | Y = 0.307x + 1.95 | 0.2 to 5 | 0.98 | 0.2 | 0.307 |
| Mb | Y = 0.363x + 2.582 | 0.3 to 5 | 0.95 | 0.3 | 0.363 |
| Cyt. C | Y = 2.047x + 0.787 | 0.1 to 0.7 | 0.98 | 0.1 | 2.047 |
| Hemeproteins | The Catalytic Reaction Rate Constant (kcat, (Ms)−1) | Sensitivity (µA/µM) | The Structure of Hemeproteins | The 3D Feature of Hemeproteins [65,66,67] |
|---|---|---|---|---|
| Hb | 2.10 × 10⁻⁶ | 0.307 | polypeptide chains 4 heme 4 Fe (3+) | 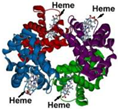 |
| Mb | 1.55 × 10⁻⁶ | 0.363 | polypeptide chain 1 heme 1 Fe (3+) | 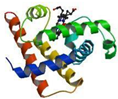 |
| Cyt. C | 1.50 × 10⁻⁶ | 2.047 | polypeptide chain 1 Fe (3+) 1 heme (the smallest protein molecule of heme) | 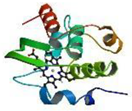 |
| The Item of the Electrode | The Number of Days | The Current Response (Ip (µA), (n = 3)) |
|---|---|---|
| #1 | 1st | −4.378 (SD ± 0.720) |
| #2 | 5th | −4.137 (SD ± 0.324) |
| #3 | 10th | −4.286 (SD ± 0.538) |
| #4 | 20th | −4.511 (SD ± 0.114) |
| #5 | 30th | −4.527 (SD ± 0.290) |
Disclaimer/Publisher’s Note: The statements, opinions and data contained in all publications are solely those of the individual author(s) and contributor(s) and not of MDPI and/or the editor(s). MDPI and/or the editor(s) disclaim responsibility for any injury to people or property resulting from any ideas, methods, instructions or products referred to in the content. |
© 2023 by the authors. Licensee MDPI, Basel, Switzerland. This article is an open access article distributed under the terms and conditions of the Creative Commons Attribution (CC BY) license (https://creativecommons.org/licenses/by/4.0/).
Share and Cite
Khownarumit, P.; Choosang, K.; Poo-arporn, R.P.; Poo-arporn, Y.; Chanlek, N.; Surareungchai, W. Bio-Electroanalysis Performance of Heme Redox-Center for π-π Interaction Bonding of a Methylene Blue-Graphene Modified Electrode. Nanomaterials 2023, 13, 745. https://doi.org/10.3390/nano13040745
Khownarumit P, Choosang K, Poo-arporn RP, Poo-arporn Y, Chanlek N, Surareungchai W. Bio-Electroanalysis Performance of Heme Redox-Center for π-π Interaction Bonding of a Methylene Blue-Graphene Modified Electrode. Nanomaterials. 2023; 13(4):745. https://doi.org/10.3390/nano13040745
Chicago/Turabian StyleKhownarumit, Porntip, Kanmanee Choosang, Rungtiva P. Poo-arporn, Yingyot Poo-arporn, Narong Chanlek, and Werasak Surareungchai. 2023. "Bio-Electroanalysis Performance of Heme Redox-Center for π-π Interaction Bonding of a Methylene Blue-Graphene Modified Electrode" Nanomaterials 13, no. 4: 745. https://doi.org/10.3390/nano13040745