
The Local and Electronic Structure Study of LuxGd1−xVO4 (0 ≤ x ≤ 1) Solid Solution Nanocrystals
by
 ,
,
Yang Chen
1,
Ziqing Li
2,
Nianjing Ji
3,
Chenxi Wei
4,*,
Xiulan Duan
1,* and
Huaidong Jiang
1,4,* 1
State Key Laboratory of Crystal Materials, Institute of Crystal Materials, Shandong University, Jinan 250100, China
2
Institute of Optoelectronics, Fudan University, Shanghai 200433, China
3
School of Materials Science & Engineering, Shandong Jianzhu University, Jinan 250101, China
4
Center for Transformative Science, ShanghaiTech University, Shanghai 201210, China
*
Authors to whom correspondence should be addressed.
Nanomaterials 2023, 13(2), 323; https://doi.org/10.3390/nano13020323
Submission received: 21 December 2022
/
Revised: 9 January 2023
/
Accepted: 10 January 2023
/
Published: 12 January 2023
(This article belongs to the Special Issue Optoelectronic Functional Nanomaterials and Devices)
Abstract
:Rare-earth-doped mixed crystals have demonstrated tunable optical properties, and it is of great importance to study the structural characteristics of the mixed-crystal hosts. Herein, LuxGd1-xVO4 (0 ≤ x ≤ 1) solid solution nanocrystals were synthesized by a modified sol–gel method, with a pure crystalline phase and element composition. The X-ray diffraction (XRD) and Rietveld refinement results showed that LuxGd1−xVO4 nanocrystals are continuous solid solutions with a tetragonal zircon phase (space group I41/amd) and the lattice parameters strictly follow Vegard’s law. The detailed local structures were studied by extended X-ray absorption fine structure (EXAFS) spectra, which revealed that the average bond length of Gd-O fluctuates and decreases, while the average bond length of Lu-O gradually decreases with the increase in Lu content. Furthermore, the binding energy differences of core levels indicate that the covalent V-O bond is relatively stable, while the ionicity of the Lu-O bond decreases with the increasing x value, and the ionicity of the Gd-O bond fluctuates with small amplitude. The valence band structures were further confirmed by the first-principles calculations, indicating that the valence band is contributed to by the O 2p nonbonding state, localized Gd 4f and Lu 4f states, and the hybridized states between the bonding O 2p and V 3d. The binding energies of the Lu core and the valence levels tend to decrease gradually with the increase in Lu content. This work provides insight into the structural features of mixed-crystal hosts, which have been developed in recent years to improve laser performance by providing different positions for active ions to obtain inhomogeneous broadening spectra.
1. Introduction
Benefiting from excellent optical, electronic, magnetic, and thermal properties, rare-earth orthovanadates (REVO4, RE = Sc, Y, and La-Lu) have wide applications in many fields, such as phosphors, laser hosts, scintillators, catalysts, polarizers, photovoltaic cells, dielectric ceramics, magnetocaloric materials, photothermal therapy, and optical probes [1,2,3,4,5,6,7,8,9]. Due to the strong UV absorption of VO43− groups and the efficient energy transfer from VO43− groups to emitting ions, REVO4 materials have been used as highly efficient host materials [10]. Their similar ionic radii are conducive to the doping of some active ions, such as all lanthanide active ions, Bi3+, etc. Due to the abundant energy levels of 4fn configurations, the 4f-4f and 5d-4f transitions of lanthanide active ions can emit light from ultraviolet to infrared [11]. In recent years, nanosized REVO4 materials with well-controlled shape, size, phase purity, and different active ions and doping concentrations have been widely studied to learn their luminescent properties and have been identified as promising materials for a wide range of optical applications [12,13,14,15,16]. In order to further expand the optical applications of REVO4-series materials, the influence of mixed-crystal hosts on the luminescence properties has also been explored. For example, Robinson et al. proved that Bi1−xDyxVO4 showed broader XRD peaks compared to DyVO4, and a progressive decrease in the bandgap with the increase in Bi concentration and crystal field effects should not be negligible for the 4f-4f transitions [17]. Kang et al. confirmed that the adjustment of the cation fractions could tune the excitation tail and emission band maximum of Bi3+ ions through bandgap modulation in the (Y,Sc)VO4 host [18]. For Nd:LuxY1−xVO4 mixed crystals, although the absorption and emission peak locations were unchanged, the full width at half-maximum (FWHM) exhibited obvious inhomogeneous broadening compared to the two single crystals, meaning better Q-switched and mode-locked laser performance [19].
As mentioned above, the doped mixed-crystal materials may also have better performance than the single-crystal materials, besides the tunability of the physical properties of the materials. Thus, it is of great importance to study the structural characteristics of the mixed-crystal hosts. Among all of the REVO4 nanomaterials, GdVO4 and LuVO4 have been extensively studied for their unit cell structures, properties, and applications. They both possess a tetragonal zircon structure, belong to the space group I41/amd, and can be used as catalysts and as hosts for luminescent materials [1,4,6,20,21,22,23,24]. Mixed crystals of the two orthovanadates LuxGd1−xVO4 doped with Nd3+ have been grown by the Czochralski method, and the XRD results revealed that GdVO4 and LuVO4 can form solid solutions in any proportion and maintain the zircon-phase structure [25]. By changing the composition of the solid solutions, the basic physical properties of the materials can be adjusted. Yu et al. demonstrated that the thermal, optical, and laser properties of Nd:LuxGd1−xVO4 show variation as a function of x [26]. Additionally, compared to pure crystals, the laser performance of mixed crystals is improved, due to the inhomogeneous broadening of the fluorescence lines generated by the mixed-crystal hosts, which indicate that although the spectroscopic and laser properties are mainly determined by the eigen multiplet of the active ions, they are also partly influenced by the crystal field [2,27]. As far as we know, there have been some previous reports on the growth and properties of large rare-earth-ion-doped LuxGd1−xVO4 crystals, but the local and electronic structures of nanosized LuxGd1−xVO4 solid solution materials are less studied.
It is known that the properties of a material are strongly dependent on its lattice structure. In the unit cell of zircon-type LuxGd1−xVO4, the Gd (Lu) atom coordinates with eight oxygen atoms to form an irregular dodecahedron with four longer and four shorter chemical bonds and occupies D2d sites, while the V atom coordinates with four oxygen atoms to form a regular tetrahedron [28]. Active ions can substitute Lu3+ or Gd3+ to occupy the center of GdO8 or LuO8 dodecahedrons. Previous reports suggested that the reason for the inhomogeneous broadening of the spectral peaks is that active ions are randomly distributed in mixed-crystal hosts, occupying different lattice locations and experiencing different local crystal fields, so the spectral peaks are contributed by many different structural centers [19]. Therefore, compared with GdVO4 and LuVO4, the application of LuxGd1−xVO4 nanomaterials can be expanded to present as promising host materials.
In this work, a series of LuxGd1−xVO4 (0 ≤ x ≤ 1) nanocrystals were prepared by a simple sol–gel method. The changes to the unit cell, local and electronic structures, and composition were studied by experimental and theoretical methods. In terms of experimental technology, we combined X-ray powder diffraction (XRD), extended X-ray absorption fine structure (EXAFS), and X-ray photoelectron spectroscopy (XPS) to study the unit cell structures, the local structures of the Lu3+ and Gd3+ ions, the chemical states of elements, the covalency or ionicity of metal–oxygen (M–O) chemical bonds, and the valence band structures of the series solid solutions. The valence band structures were also investigated by comparison with the density of electronic states (DOS) calculated by the LSDA + U method. Our findings could provide a comprehensive understanding of the mixed-crystal structures of LuxGd1−xVO4 nanocrystals, which will be helpful to explore more applications.
2. Materials and Methods
A series of LuxGd1−xVO4 (x = 0, 0.1, 0.2, 0.3, 0.4, 0.5, 0.6, 0.7, 0.8, 0.9, 1) nanocrystals were synthesized by the sol–gel method. Stoichiometric Gd2O3 and Lu2O3 (Aladdin, 99.9%) were dissolved in diluted HNO3 solution under heating and stirring to obtain a transparent nitrate solution. Then, citric acid (C6H8O7·H2O, Sinopharm, AR) with a molar ratio of 2:1 to metal cations (Gd3+ and Lu3+ ions) was added as the chelating agent. After the citric acid was completely dissolved, ammonium metavanadate solution obtained by dissolving NH4VO3 (Sinopharm, AR) in hot deionized water was added dropwise to the above solution. After stirring and heating, viscous gels formed. The gels were then dehydrated at 100 °C for 6 h and calcined in air at 800 °C for 6 h to obtain pale-yellow powders with a heating and cooling rate of 50 °C/h. The powders were then finely ground for subsequent experiments.
The series of powder samples were identified by powder X-ray diffraction performed on a Bruker D8 advance powder diffractometer with Cu Kα1,2 radiation (λaverage = 1.54184 Å). The molar contents of the constituent elements were measured using an EPMA-1720H (Shimadzu, Japan) Electron Probe Microanalyzer with the following parameters: AccV = 15.0 kV, BC = 9.9 nA, beam size = MIN, and SC = 6.8 nA. Additionally, YVO4, Gd3Ga5O12, and LuSiO5 were used as standard samples for the quantitative analysis of V, Gd, and Lu, respectively.
The local structures of the cations were investigated by extended X-ray absorption fine structure (EXAFS) measured at the beamline 14W1 of Shanghai Synchrotron Radiation Facility (SSRF, Shanghai, China). Gd L3-edge X-ray adsorption spectra at 7243 eV and Lu L3-edge X-ray adsorption spectra at 9244 eV of the samples were recorded in transmission and Lytle fluorescence (when the concentration was too low) modes at room temperature. The EXAFS spectra were normalized using Athena software, and the corresponding Fourier-transformed (FT) k3χ(k) plots were obtained by selecting the Hanning window. The FT plots were fitted using Artemis with k3-weighting to determine the distances between the central atoms and their coordination shells.
X-ray photoelectron spectroscopy (XPS) was performed using an ESCALAB 250XI spectrometer (Thermo Fisher Scientific) with monochromatized Al Kα X-ray radiation (1486.6 eV) in an ultrahigh vacuum (<10−7 Pa). A flood gun was used for charge neutralization. Survey scans were taken between 0 and 1300 eV with an energy step of 1 eV, fine scans of the elements’ characteristic peaks were taken with an energy step of 0.1 eV, and the valence bands were recorded between 0 and 37 eV with an energy step of 0.05 eV. All data were analyzed using the version 5.9918 of Thermo Avantage software.
Electronic structure calculations of Lu0.5Gd0.5VO4 (Figure S1) were performed using a LSDA + U approach [29] based on density functional theory (DFT) [30] implemented through the Cambridge Serial Total Energy Package (CASTEP) [31] program. The Hubbard-U corrections were introduced because simple local density approximation (LDA) [32] or generalized gradient approximation (GGA) [33] failed to describe the strong correlation between the highly localized 4f electrons of Gd and predicted a metallic band structure for GdVO4, which is inconsistent with its insulating nature. The calculations with several U values showed that Hubbard U has a significant impact on the Gd 4f energy level and the bandgap, and the Gd 4f is located at a deeper energy level when the U value is large. The U value (0.01 eV) added to the Gd 4f electrons was finally determined semi-empirically by comparing it to the XPS valence band spectra, but the calculated Gd 4f level was still deeper than the experimental binding energy. Vanderbilt-type ultra-soft pseudo-potentials were adopted to describe the electron–ion interactions. The atomic levels 4f145p65d16s2 of the Lu atom, 4f75s25p65d16s2 of the Gd atom, 3s23p63d34s2 of the V atom, and 2s22p4 of the O atom were treated as valence electrons. The plane-wave cutoff energy of 600 eV was chosen for the calculations of the energy and properties. The (3 × 3 × 3) Monkhorst-Pack grid was used for Brillouin zone integrations.
3. Results and Discussion
3.1. Synthesis and Characterization of LuxGd1−xVO4 Nanocrystals
3.1.1. XRD and Rietveld Refinement
All LuxGd1−xVO4 powder samples had a pure tetragonal zircon-phase structure with no impurity phase as identified by X-ray diffraction (Figure 1), which is indicative of continuous solid solutions. In the inset in Figure 1, a gradual shift to high angles for the positions of the diffraction peaks with increasing Lu content can be seen clearly, which is consistent with the trends of bulk mixed crystals [25]. This shift is probably due to the substitution of Lu3+ with a smaller ionic radius for Gd3+. The diffraction peaks of the LuxGd1−xVO4 (0 < x < 1) solid solutions show a broadening compared to the peaks of the two end members, which is also suggestive of compositional inhomogeneity due to the mismatch in radius between Lu3+ and Gd3+ ions.
Based on the XRD data, the unit cell parameters a and c, along with the unit cell volume (V) of the LuxGd1−xVO4 samples, were calculated by Rietveld refinement using FullProf Suite software (Table S1). They all decreased linearly with the increase in Lu content, as can be seen from Figure 2, which conforms to Vegard’s law [34]. When x changes from 0 to 1, the values of a, c, and V decrease by 2.6%, 1.9%, and 6.8%, respectively, showing anisotropy.
3.1.2. EPMA
EPMA was used to determine the actual compositions of the series of LuxGd1−xVO4 (x = 0.1, 0.3, 0.5, 0.7, 0.9) samples. It can be seen from Table 1 that the molar ratios of Lu/RE were very close to the nominal ratios (x values); therefore, x values are used to denote the actual Lu contents in this work. Because only metal elements were measured, V molar contents close to 50% for all of the samples indicate that they were also consistent with the stoichiometric ratios.
3.1.3. TEM
The morphology and grain sizes of the LuxGd1−xVO4 nanocrystals were observed from the TEM images (Figure 3). The crystalline grains of all of the samples were irregular in shape and easily agglomerated. Under the same calcination temperature and time, the grain size of these nanocrystals decreased with increasing x values, and the average grain sizes were about 30–50 nm. Therefore, continuous LuxGd1−xVO4 (0 ≤ x ≤ 1) solid solution nanocrystals with a tetragonal zircon-type structure were successfully synthesized by the sol–gel method.
3.2. Local Structure of Lanthanide Atoms in LuxGd1−xVO4 Solid Solutions
In order to further study the linear evolution of the unit cell parameters of the LuxGd1−xVO4 solid solutions caused by cation substitution, the local structures of the lanthanide cations were investigated by EXAFS. Because they share the same zircon-type structure, the atomic distributions of the coordination shells of Gd atoms in GdVO4 and Lu atoms in LuVO4 are similar. The first, second, and third coordination shells of Gd/Lu atoms consist of eight O atoms, two V atoms, and four Gd/Lu and four V atoms, respectively, as shown in Figure 4. More precisely, the first coordination shell consists of two subshells, with the same coordination number (4) and a bond length difference of 0.12 Å for GdVO4 and 0.15 Å for LuVO4. The interatomic distances of the first two coordination shells from the central atoms were obtained by fitting the Fourier-transformed (FT) EXAFS spectra; the values, along with the fitting parameters and the average bond lengths of the two subshells, are listed in Tables S2 and S3.
As shown in Figure 5, except for the samples with the lowest elemental contents (x = 0.9 in Figure 5a and x = 0.1 in Figure 5b), the FT-EXAFS spectra of the series of solid solutions showed little change in the range of the first two coordination shells. The change in the peak shape of the first coordination shell was probably due to the change in the distortion index of the REO8 dodecahedron (Table S4). The average Gd-O bond lengths reduced from 2.398 to 2.357 Å as x increased from 0 to 0.9, while the average Lu-O bond lengths reduced gradually from 2.356 to 2.314 Å as x increased from 0.1 to 1 (Figure 6). This suggests that the irregular REO8 dodecahedron is not rigid enough to remain unchanged in LuxGd1−xVO4 solid solutions but will shrink or relax slightly with the change of the unit cell. Although the Gd-O and Lu-O bond lengths did not follow Vegard’s law, the average RE-O bond lengths were distributed near the linear fits, following Vegard’s law. The Gd-V interatomic distances reduced gradually while the Lu-V interatomic distances first increased and then decreased as the Lu content increased. Moreover, the average RE-V interatomic distances followed Vegard’s law.
3.3. X-ray Photoelectron Spectroscopy of LuxGd1−xVO4 Solid Solutions
The elements, chemical states, and valence band structures of the LuxGd1−xVO4 nanocrystals were studied by XPS. The survey scans (Figure 7) confirmed the existence of only Lu, Gd, V, and O in all samples, except for the ubiquitous contaminated carbon. The intensity of characteristic peaks of Gd 3d, 4d and Lu 4p, 4d was enhanced with the increase in their respective contents; that is, they varied inversely with the change of x.
3.3.1. Chemical States of O, V, Lu, and Gd in LuxGd1−xVO4 Solid Solutions
The core-level O 1s, V 2p, Gd 4d, and Lu 4d XPS spectra (Figure 8, Figure 9 and Figure 10) were analyzed to determine the chemical states of these elements in the LuxGd1−xVO4 solid solutions. The C 1s spectra all showed two peaks with a separation of about 4.6 eV, in which the stronger C 1s peak (284.6 eV) of the adventitious carbon (C-C/C-H) was used as a reference for binding energy calibration [35].
Due to the small overlap between the O 1s and V 2p1/2 peaks, it was essential to analyze the O 1s and V 2p spectra together [36]. The V 2p spectra contained two peaks due to spin–orbit splitting—an asymmetrical 2p1/2 and a symmetrical 2p3/2—and the 2p1/2 peak was broadened because of the Coster–Kronig effect [37]. The O 1s peaks were located at the higher-energy side of V 2p1/2 peaks. All of these O 1s and V 2p spectra showed a similar shape but a small amount of peak position shift, as can be seen from Figure 8a. The binding energy of O 1s changed from 529.9 to 530.2 eV, and it first increased and then decreased with the increases in x (Table S5). In addition to the predominant lattice O 1s peak, a low-intensity component located at 1.5 eV higher (inset of Figure 8a) could be attributed to the surface-adsorbed hydroxyl groups [38,39,40]. The binding energy of V 2p3/2 changed from 517.1 to 517.4 eV, similar to the change in the lattice O 1s (Figure 8b and Table S5). All of the binding energies were about 517.4 eV, indicating that V ions have only one +5 valence state in these solid solutions [36,41,42].
All of the Lu 4d spectra (Figure 9a) exhibited a doublet character due to the spin–orbit interaction. The 4d3/2 and 4d5/2 peaks had almost the same FWHM, due to the 4f14 filled shell of Lu3+, whereas metal Lu 4d peaks usually show extra broadening [43]. A separation of about 9.9 eV was observed, and the peak area ratios were in the range of 0.60–0.69—close to the theoretical values of 10.00 eV and 2/3, respectively [44]. The binding energy of the Lu 4d5/2 peak decreased gradually from 196.8 to 196.1 eV as x increased from 0.2 to 1 (Figure 9b and Table S5).
Meanwhile, in the case of the Gd 4d core level, due to the existence of strong Coulomb-exchange interactions between 4d and the half-filled 4f7 states together with the spin–orbit interaction in the 4d state, the Gd 4d XPS spectra exhibited a broad multiplet splitting structure including four peaks (A, B, C and D), as shown in Figure 10a [45]. Kowalczyk et al. qualitatively described the multiplet with spin antiparallel 7DJ (J = 1, …, 5) (peaks B, C and D) and spin parallel 9DJ (J = 2, …, 6) (peak A) final states [46]. In this work, the 9D states were fitted by five sharp peaks with the same FWHM (1.66–1.83 eV) and a separation of 1.1 eV, and peak B was fitted by a broad Lorentzian–Gaussian mixed peak, according to the high-resolution XPS and lifetime broadening effect [41,45,47]. The fitting peaks of partial Gd 4d of GdVO4 are shown in the inset of Figure 10a as an example. The 9D5 states (141.5–141.8 eV) with the strongest intensity were selected to observe the evolution of the binding energies of the Gd 4d level. The binding energies of Gd 4d showed a 0.1–0.3 eV chemical shift with the variation in the Lu content (Figure 10b and Table S5).
As mentioned above, changes existed in the core-level binding energies of the elements in the series of solid solutions. Furthermore, the binding energy difference ΔBE(O-M) = BE(O 1s) − BE(M core level) was used to characterize the ionicity or covalency of M-O chemical bonds [48]. Additionally, it was concluded that lower ΔBE(O-M) values are associated with stronger ionicity or weaker covalency of M-O bonds, while higher ΔBE(O-M) values indicate weaker ionicity or stronger covalency [49,50]. For the LuxGd1−xVO4 solid solutions in this work, the ΔBE values of O-V, O-Lu, and O-Gd are listed in Table S5 and shown in Figure 8b, Figure 9b, and Figure 10b, respectively.
The ΔBE(O-V) value between O 1s and V 2p3/2 for all of the samples was 12.8 eV, which is consistent with the reported values of vanadium pentoxide [36,51]. The unchanged ΔBE(O-V) values indicate that the ionicity and covalency of V-O chemical bonds are stable and that the VO4 tetrahedrons show strong rigidity in the series of solid solutions. This is probably due to the more covalent character of V-O bonds in GdVO4 and LuVO4 revealed by the analysis of electron density difference and Mulliken population analysis [52,53]. The ΔBE(O-Lu) values between O 1s and Lu 4d5/2 tend to increase as the Lu content increases, indicating the decrease in the ionicity of the Lu-O chemical bonds with the increasing x. Meanwhile, the ΔBE(O-Gd) values between O 1s and Gd 4d show volatile changes with small amplitude, indicating that the ionicity of the Gd-O chemical bonds changes very little as the x increases.
3.3.2. Valence Band Structure Analysis of LuxGd1−xVO4 Solid Solutions
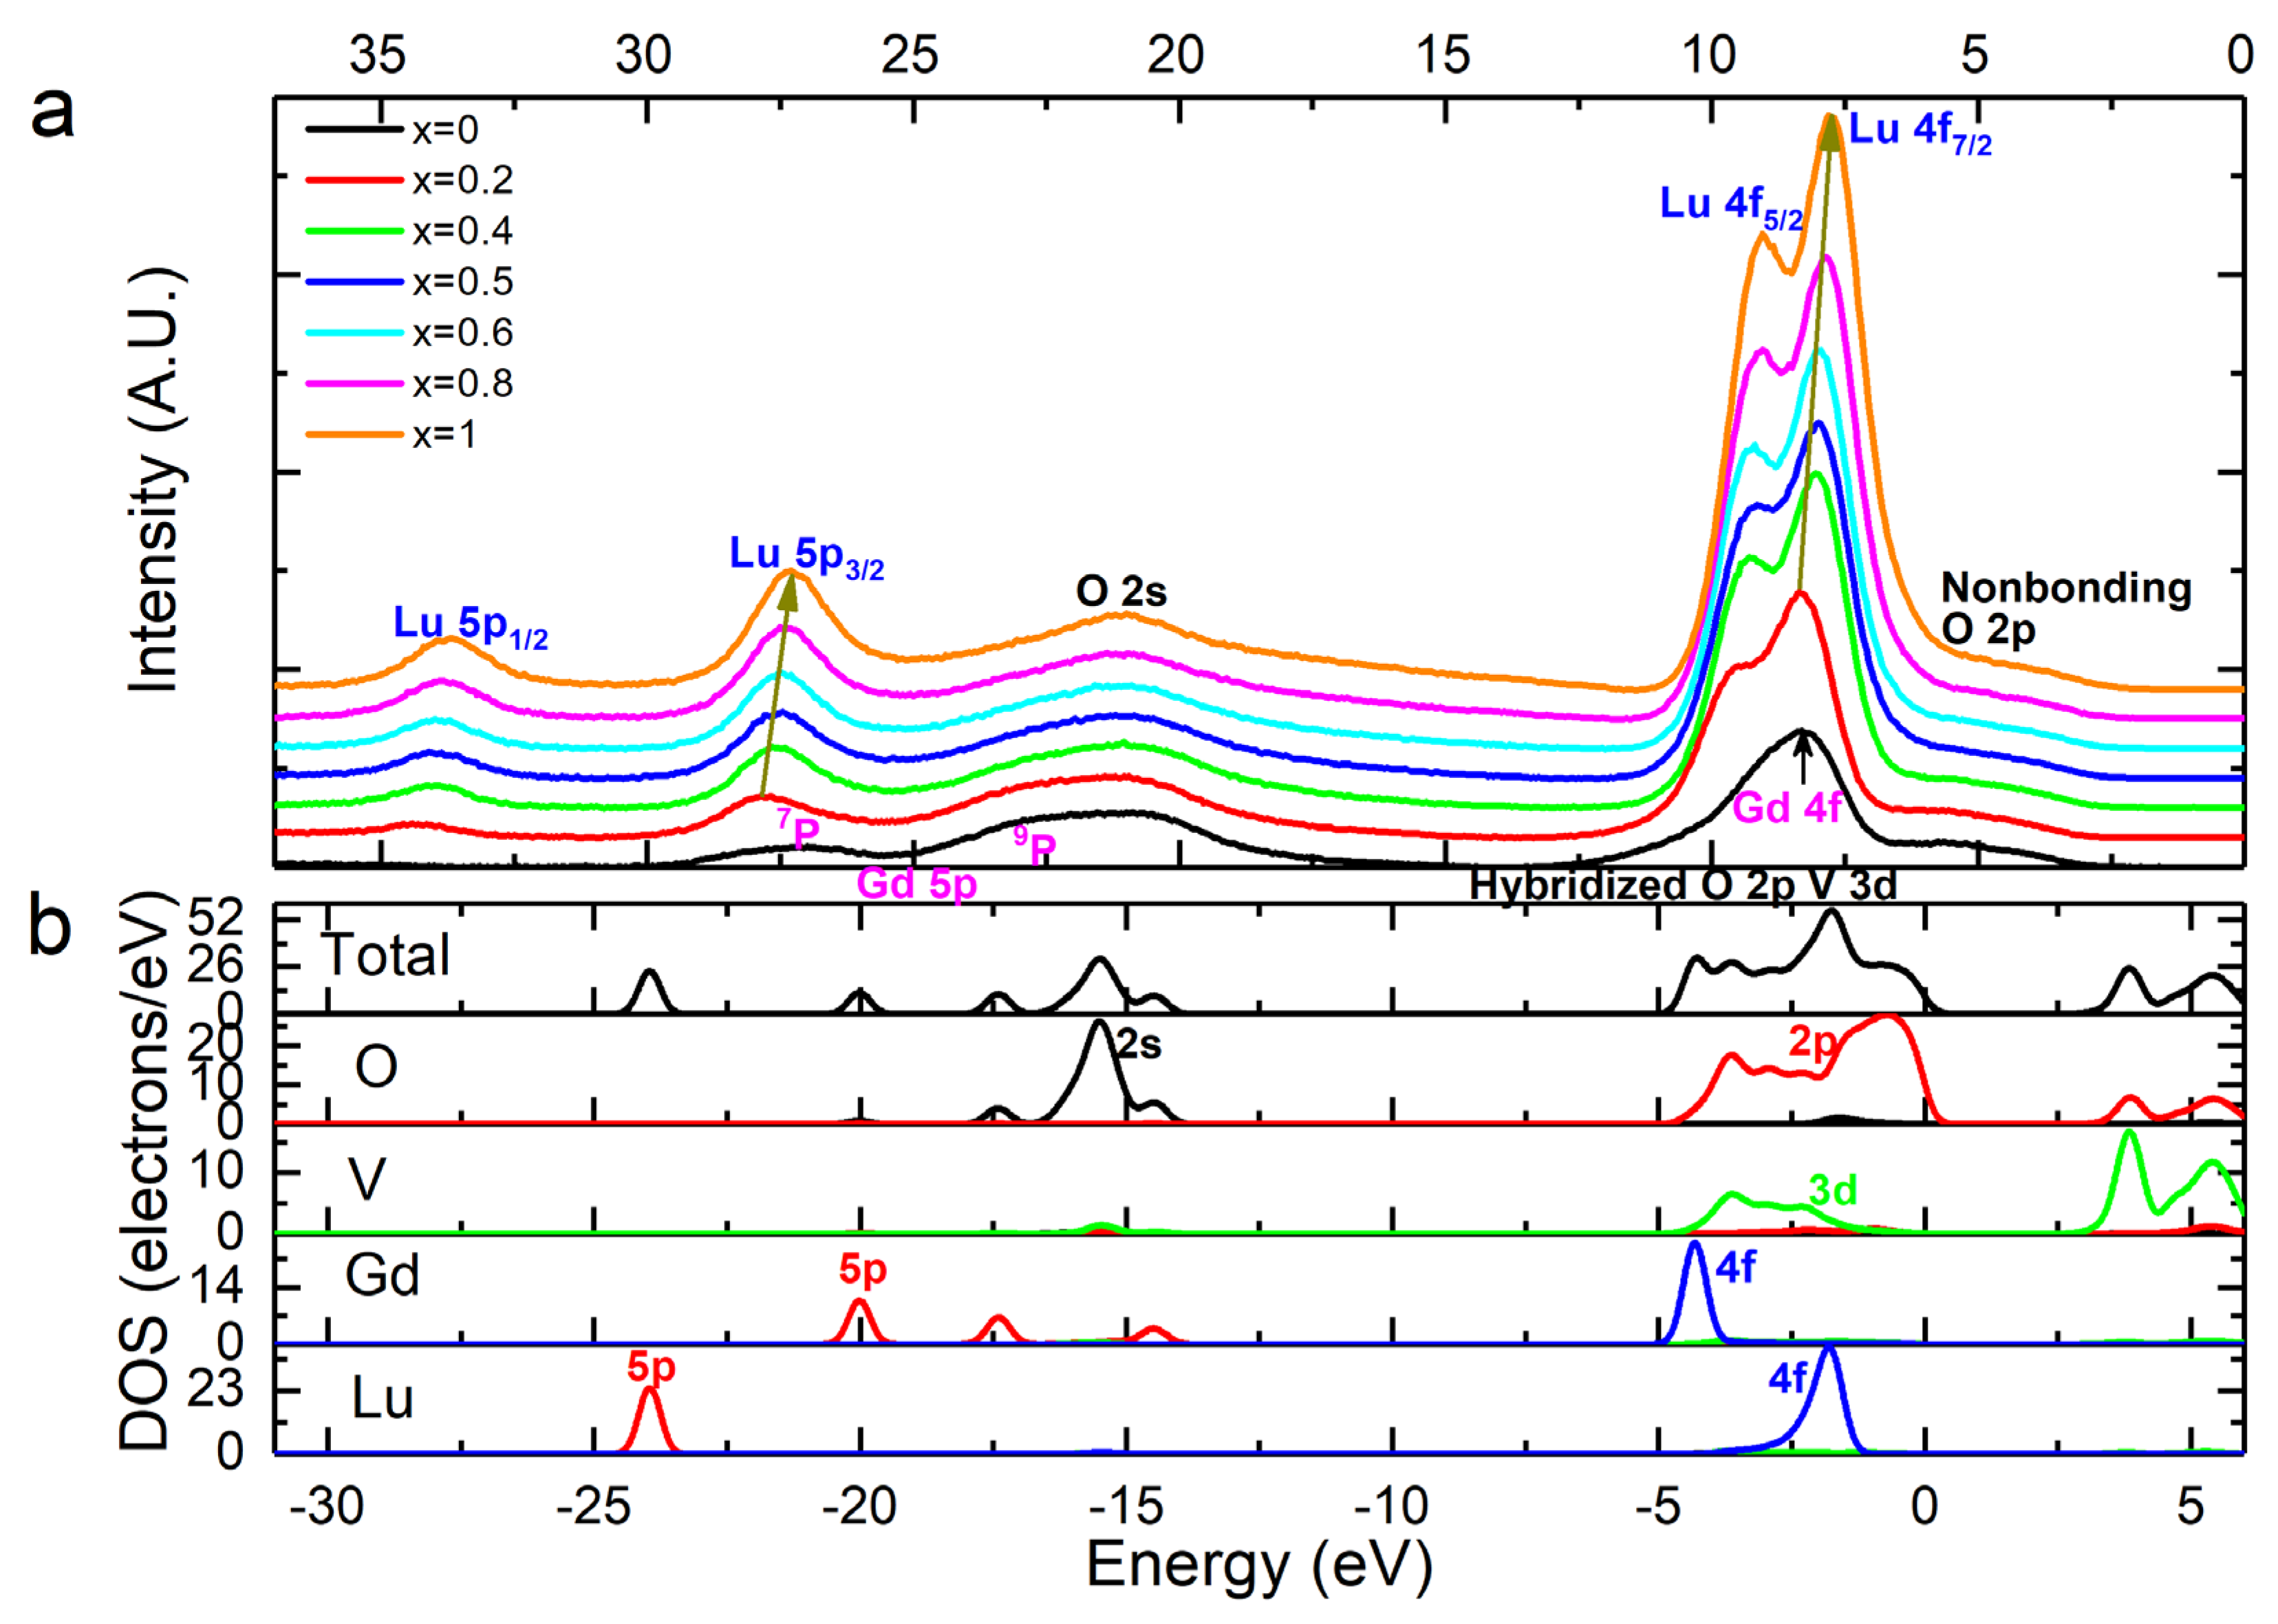
The XPS valence band spectra (Figure 11a) of the samples were analyzed in comparison with the first-principles-calculated density of states (DOS) and partial density of states (PDOS) of Lu0.5Gd0.5VO4 (Figure 11b).
The valence band spectra (0–37 eV) are mainly composed of peaks of the Lu 5p, Lu 4f, Gd 5p, Gd 4f, O 2s, O 2p, and V 3d states, in which the doublet peaks at ~33.7 eV and ~27.3 eV are assigned to the Lu 5p1/2 and Lu 5p3/2 states [54]. The wide band ranging from 12.0 eV to 30.0 eV, with lower intensity, is attributed to the Gd 5p 7P final state and the hybridization between the Gd 5p 9P final state and the O 2s state [55]. The predominant peak with a bump on its lower-binding-energy side, ranging from 2.5 eV to 12.5 eV, is the valence band (VB). The strongest splitting peaks located at ~9.0 eV and ~7.8 eV, in the middle of the VB, should be assigned to Lu 4f5/2 and 4f7/2 doublets [17]. Meanwhile, the Gd 4f state presents as an asymmetric peak with much lower intensity located at ~8.2 eV, which is overlapped with the Lu 4f doublet and a bump (broad and very low intensity) of the hybridized states between the bonding O 2p and V 3d. Nevertheless, the Gd 4f and Lu 4f states are highly localized and do not participate in chemical bonding with ligand O atoms, as can be seen from the DOS and PDOS. The valence band maximum (VBM) is a bump and is contributed to by the O 2p nonbonding state. The hybridized states between the bonding O 2p and V 3d determine the minimum and width of the VB, leading to a broader and broader VB as the x value decreases. Due to the higher intensity and specific doublet shape, it is obvious that the binding energies of the Lu 5p and 4f levels tend to decrease gradually with the increase in the Lu content, which is consistent with the evolutionary trend of the binding energy of the Lu 4d core level. This gradual change in the binding energies of the Lu core and valence levels originates from the variations in the lattice parameters induced by the displacement of Lu3+ with Gd3+.
4. Conclusions
A series of LuxGd1−xVO4 (0 ≤ x ≤ 1) nanocrystals of 30–50 nm in size were synthesized by a citric acid sol–gel process. XRD demonstrated that the as-synthesized nanocrystals were single-phase zircon-type continuous solid solutions, and the lattice parameters decreased linearly with the increase in the x value—a decreased from 7.21287 Å to 7.02852 Å, while c decreased from 6.35552 Å to 6.23600 Å, following Vegard’s law. The local structures of the central atoms of the GdO8 and LuO8 dodecahedrons studied by EXAFS showed that, to adapt to the shrunk unit cell, the Gd-O interatomic distances fluctuate reduced and Lu-O interatomic distances gradually reduced as the x value increased. The core-level electronic structures of all of the composition elements in LuxGd1−xVO4, as functions of the x values, were analyzed by XPS. With the Lu content increasing from 0 to 1, the binding energy values of O 1s and V 2p first increased and then decreased, and their differences remained unchanged, indicating that the covalency of V-O bonds is less affected by composition. The ionicity of the Lu-O bonds weakened with the increasing x, while the ionicity of the Gd-O bonds fluctuated with small amplitude. The valence band electronic structure of LuxGd1−xVO4 was also studied by the combination of XPS and first-principles calculations. The O 2p nonbonding state was located at the top of the VB, the Gd 4f and Lu 4f states were highly localized and located in the middle of the VB, while the hybridized state between the bonding O 2p and V 3d was located at the bottom of the VB and overlapped with Gd 4f and Lu 4f states. The Lu 5p, 4f levels and 4d core level tended to decrease gradually with the increase in the x value. In conclusion, due to the lanthanide contraction, the Gd-O and Lu-O bond lengths decreased to adapt to the shrunk unit cell, while the V-O bond length remained unchanged, as the x value increased from 0 to 1 throughout the LuxGd1−xVO4 series. Additionally, the binding energy shift of Lu and the ΔBE(O-Lu)-evaluated ionicity of the Lu-O bonds presented a positive correlation with the Lu-O bond length. This work provides insight into the local and chemical environments of the central atoms of GdO8 and LuO8 dodecahedrons in LuxGd1−xVO4, that is, the different positions provided for the substituted active ions, which are conductive to understanding the mechanism of inhomogeneous spectral broadening of mixed-crystal hosts in laser applications.
Supplementary Materials
The following supporting information can be downloaded at: https://www.mdpi.com/article/10.3390/nano13020323/s1, Figure S1: Unit cell model of Lu0.5Gd0.5VO4; Table S1: Rietveld-refined cell parameters and R factors for LuxGd1−xVO4 solid solutions; Table S2: Fitting results of LuxGd1−xVO4 for the nearest and next-nearest neighbor coordination shells at the Gd L3-edge; Table S3: Fitting results of LuxGd1−xVO4 for the nearest and next-nearest neighbor coordination shells at the Lu L3-edges; Table S4: Average distances from the dodecahedron central atoms to the first and second coordination shells and the dodecahedron distortion indices for the LuxGd1−xVO4 solid solutions; Table S5: Binding energies of the characteristic peaks of all component elements and binding energy differences (ΔBE) between metal and oxygen characteristic peaks of the LuxGd1−xVO4 solid solutions. Reference [56] is cited in the supplementary materials.
Author Contributions
Conceptualization, X.D. and H.J.; methodology, Y.C.; formal analysis, Y.C.; investigation, Y.C., Z.L. and N.J.; data curation, Y.C.; writing—original draft preparation, Y.C.; writing—review and editing, Y.C., Z.L., C.W., X.D. and H.J.; Supervision, H.J. All authors have read and agreed to the published version of the manuscript.
Funding
This research was supported by the Strategic Priority Research Program of the Chinese Academy of Sciences (grant No. XDB37040303).
Data Availability Statement
Not applicable.
Acknowledgments
The authors gratefully thank Fulei Wang (Shandong University) for his help in the EPMA measurements, Yanhua Leng (Shandong University) and Jing Yang (Shandong University) for their help with the first-principles calculations, the core facilities sharing platform of Shandong University for the XRD and TEM measurements, the researcher Peihong Cheng (ShanghaiTech University) for her help with the XPS measurements, and Jingyuan Ma and other staff at BL14W1 of the Shanghai Synchrotron Radiation Facility (SSRF) for the EXAFS measurements.
Conflicts of Interest
The authors declare no conflict of interest.
References
- Tymiński, A.; Grzyb, T.; Lis, S. REVO4-Based Nanomaterials (RE = Y, La, Gd, and Lu) as Hosts for Yb3+/Ho3+, Yb3+/Er3+, and Yb3+/Tm3+ Ions: Structural and Up-Conversion Luminescence Studies. J. Am. Ceram. Soc. 2016, 99, 3300–3308. [Google Scholar] [CrossRef]
- Yu, H.; Liu, J.; Zhang, H.; Kaminskii, A.A.; Wang, Z.; Wang, J. Advances in vanadate laser crystals at a lasing wavelength of 1 micrometer. Laser Photonics Rev. 2014, 8, 847–864. [Google Scholar] [CrossRef]
- Fujimoto, Y.; Yanagida, T.; Yokota, Y.; Chani, V.; Kochurikhin, V.V.; Yoshikawa, A. Comparative study of optical and scintillation properties of YVO4, (Lu0.5Y0.5)VO4, and LuVO4 single crystals. Nucl. Instrum. Methods Phys. Res. Sect. A Accel. Spectrometers Detect. Assoc. Equip. 2011, 635, 53–56. [Google Scholar] [CrossRef]
- Oshikiri, M.; Ye, J.; Boero, M. Inhomogeneous RVO4 Photocatalyst Systems (R = Y, Ce, Pr, Nd, Sm, Eu, Gd, Tb, Dy, Ho, Er, Tm, Yb, Lu). J. Phys. Chem. C 2014, 118, 8331–8341. [Google Scholar] [CrossRef]
- Bass, M. Correspondence Electrooptic Q Switching of the Nd: YVO4 Laser without an Intracavity Polarizer. IEEE J. Quantum Electron. 1975, 11, 938–939. [Google Scholar] [CrossRef]
- Yu, D.C.; Ye, S.; Peng, M.Y.; Zhang, Q.Y.; Qiu, J.R.; Wang, J.; Wondraczek, L. Efficient near-infrared downconversion in GdVO4:Dy3+ phosphors for enhancing the photo-response of solar cells. Sol. Energy Mater. Sol. Cells 2011, 95, 1590–1593. [Google Scholar] [CrossRef]
- Wang, Y.; Zuo, R.; Zhang, C.; Zhang, J.; Zhang, T. Low-Temperature-Fired ReVO4 (Re = La, Ce) Microwave Dielectric Ceramics. J. Am. Ceram. Soc. 2015, 98, 1–4. [Google Scholar] [CrossRef]
- Ryu, S.-M.; Nam, C. Effects of annealing on nanocrystalline GdVO4 and its magnetocaloric properties. Appl. Phys. A 2020, 126, 409. [Google Scholar] [CrossRef]
- del Rosal, B.; Pérez-Delgado, A.; Carrasco, E.; Jovanović, D.J.; Dramićanin, M.D.; Dražić, G.; de la Fuente, Á.J.; Sanz-Rodriguez, F.; Jaque, D. Neodymium-Based Stoichiometric Ultrasmall Nanoparticles for Multifunctional Deep-Tissue Photothermal Therapy. Adv. Opt. Mater. 2016, 4, 782–789. [Google Scholar] [CrossRef] [Green Version]
- Li, G.; Wang, Z.; Yu, M.; Quan, Z.; Lin, J. Fabrication and optical properties of core–shell structured spherical SiO2@GdVO4:Eu3+ phosphors via sol–gel process. J. Solid State Chem. 2006, 179, 2698–2706. [Google Scholar] [CrossRef]
- Blasse, G.; Grabmaier, B. Radiative return to the ground state: Emission. In Luminescent Materials; Springer: Berlin/Heidelberg, Germany, 1994; pp. 33–70. [Google Scholar]
- Xu, Z.; Li, C.; Hou, Z.; Peng, C.; Lin, J. Morphological control and luminescence properties of lanthanide orthovanadate LnVO4(Ln = La to Lu) nano-/microcrystals viahydrothermal process. CrystEngComm 2011, 13, 474–482. [Google Scholar] [CrossRef]
- Vairapperumal, T.; Saraswathy, A.; Ramapurath, J.S.; Kalarical Janardhanan, S.; Balachandran Unni, N. Catechin tuned magnetism of Gd-doped orthovanadate through morphology as T1-T2 MRI contrast agents. Sci. Rep. 2016, 6, 34976. [Google Scholar] [CrossRef] [Green Version]
- Jia, C.-J.; Sun, L.-D.; You, L.-P.; Jiang, X.-C.; Luo, F.; Pang, Y.-C.; Yan, C.-H. Selective Synthesis of Monazite- and Zircon-type LaVO4 Nanocrystals. J. Phys. Chem. B 2005, 109, 3284–3290. [Google Scholar] [CrossRef]
- Liu, J.; Li, Y. General synthesis of colloidal rare earth orthovanadate nanocrystals. J. Mater. Chem. 2007, 17, 1797–1803. [Google Scholar] [CrossRef]
- Qian, L.; Zhu, J.; Chen, Z.; Gui, Y.; Gong, Q.; Yuan, Y.; Zai, J.; Qian, X. Self-Assembled Heavy Lanthanide Orthovanadate Architecture with Controlled Dimensionality and Morphology. Chem.—A Eur. J. 2009, 15, 1233–1240. [Google Scholar] [CrossRef]
- Robinson, M.D.M.; Oropeza, F.E.; Cui, M.; Zhang, K.H.L.; Hohmann, M.V.; Payne, D.J.; Egdell, R.G.; Regoutz, A. Electronic Structure of Lanthanide-Doped Bismuth Vanadates: A Systematic Study by X-ray Photoelectron and Optical Spectroscopies. J. Phys. Chem. C 2019, 123, 8484–8499. [Google Scholar] [CrossRef] [Green Version]
- Kang, F.; Zhang, H.; Wondraczek, L.; Yang, X.; Zhang, Y.; Lei, D.Y.; Peng, M. Band-Gap Modulation in Single Bi3+-Doped Yttrium–Scandium–Niobium Vanadates for Color Tuning over the Whole Visible Spectrum. Chem. Mater. 2016, 28, 2692–2703. [Google Scholar] [CrossRef]
- Guo, L.; Wang, Z.; Yu, H.; Hu, D.; Zhuang, S.; Chen, L.; Zhao, Y.; Sun, X.; Xu, X. Thermal, spectroscopic, and laser characterization of Nd:LuxY1−xVO4 series crystals. AIP Adv. 2011, 1, 042143. [Google Scholar] [CrossRef]
- Milligan, W.O.; Vernon, L.W. Crystal Structure of Heavy Metal Orthovanadates. J. Phys. Chem. 1952, 56, 145–147. [Google Scholar] [CrossRef]
- Chumha, N.; Kittiwachana, S.; Thongtem, T.; Thongtem, S.; Kaowphong, S. Synthesis and characterization of GdVO4 nanoparticles by a malic acid-assisted sol–gel method. Mater. Lett. 2014, 136, 18–21. [Google Scholar] [CrossRef]
- Pan, B.; Tang, P.; Gao, S.; Shen, W.; Chen, H. Characterization and Photocatalytic Activity of Nanoparticulate LuVO4 Prepared by Sol-Gel Method. Integr. Ferroelectr. 2020, 206, 17–23. [Google Scholar] [CrossRef]
- Yin, W.; Zhou, L.; Gu, Z.; Tian, G.; Jin, S.; Yan, L.; Liu, X.; Xing, G.; Ren, W.; Liu, F.; et al. Lanthanide-doped GdVO4 upconversion nanophosphors with tunable emissions and their applications for biomedical imaging. J. Mater. Chem. 2012, 22, 6974. [Google Scholar] [CrossRef]
- Nunez, N.O.; Rivera, S.; Alcantara, D.; de la Fuente, J.M.; Garcia-Sevillano, J.; Ocana, M. Surface modified Eu:GdVO4 nanocrystals for optical and MRI imaging. Dalton Trans. 2013, 42, 10725–10734. [Google Scholar] [CrossRef] [Green Version]
- Yu, H.; Yu, Y.; Zhang, H.; Wang, Z.; Wang, J.; Cheng, X.; Shao, Z.; Jiang, M. Growth and laser characterization of mixed Nd:LuxGd1−xVO4 laser crystals. J. Cryst. Growth 2006, 293, 394–397. [Google Scholar] [CrossRef]
- Yu, H.H.; Zhang, H.J.; Wang, Z.P.; Wang, J.Y.; Yu, Y.G.; Cheng, X.F.; Shao, Z.S.; Jiang, M.H.; Ling, Z.C.; Xia, H.R. Characterization of mixed Nd:LuxGd1−xVO4 laser crystals. J. Appl. Phys. 2007, 101, 113109. [Google Scholar] [CrossRef]
- Yu, H.; Zhang, H.; Wang, Z.; Wang, J.; Yu, Y.; Shao, Z.; Jiang, M. Enhancement of passive Q-switching performance with mixed Nd:LuxGd1−xVO4 laser crystals. Opt. Lett. 2007, 32, 2152–2154. [Google Scholar] [CrossRef]
- Kutzler, F.W.; Ellis, D.E.; Lam, D.J.; Veal, B.W.; Paulikas, A.P.; Aldred, A.T.; Gubanov, V.A. Electronic structure of rare-earth orthovanadates and its relation to photoelectron and optical spectra. Phys. Rev. B 1984, 29, 1008–1021. [Google Scholar] [CrossRef]
- Anisimov, V.I.; Zaanen, J.; Andersen, O.K. Band theory and Mott insulators: Hubbard U instead of Stoner I. Phys. Rev. B 1991, 44, 943–954. [Google Scholar] [CrossRef] [Green Version]
- Hohenberg, P.; Kohn, W. Inhomogeneous Electron Gas. Phys. Rev. 1964, 136, B864–B871. [Google Scholar] [CrossRef] [Green Version]
- Segall, M.D.; Lindan, P.J.D.; Probert, M.J.; Pickard, C.J.; Hasnip, P.J.; Clark, S.J.; Payne, M.C. First-principles simulation: Ideas, illustrations and the CASTEP code. J. Phys. Condens. Matter 2002, 14, 2717–2744. [Google Scholar] [CrossRef]
- Ceperley, D.M.; Alder, B.J. Ground State of the Electron Gas by a Stochastic Method. Phys. Rev. Lett. 1980, 45, 566–569. [Google Scholar] [CrossRef] [Green Version]
- Perdew, J.P.; Wang, Y. Accurate and simple analytic representation of the electron-gas correlation energy. Phys. Rev. B 1992, 45, 13244–13249. [Google Scholar] [CrossRef]
- Denton, A.R.; Ashcroft, N.W. Vegard’s law. Phys. Rev. A 1991, 43, 3161–3164. [Google Scholar] [CrossRef] [PubMed]
- Barr, T.L.; Seal, S. Nature of the use of adventitious carbon as a binding energy standard. J. Vac. Sci. Technol. A 1995, 13, 1239–1246. [Google Scholar] [CrossRef]
- Silversmit, G.; Depla, D.; Poelman, H.; Marin, G.B.; De Gryse, R. Determination of the V2p XPS binding energies for different vanadium oxidation states (V5+ to V0+). J. Electron Spectrosc. Relat. Phenom. 2004, 135, 167–175. [Google Scholar] [CrossRef]
- Biesinger, M.C.; Lau, L.W.M.; Gerson, A.R.; Smart, R.S.C. Resolving surface chemical states in XPS analysis of first row transition metals, oxides and hydroxides: Sc, Ti, V, Cu and Zn. Appl. Surf. Sci. 2010, 257, 887–898. [Google Scholar] [CrossRef]
- Silversmit, G.; Poelman, H.; Depla, D.; Barrett, N.; Marin, G.B.; De Gryse, R. A comparative XPS and UPS study of VOx layers on mineral TiO2(001)-anatase supports. Surf. Interface Anal. 2006, 38, 1257–1265. [Google Scholar] [CrossRef]
- Bondarenka, V.; Grebinskij, S.; Kaciulis, S.; Mattogno, G.; Mickevicius, S.; Tvardauskas, H.; Volkov, V.; Zakharova, G. XPS study of vanadium–yttrium hydrates. J. Electron Spectrosc. Relat. Phenom. 2001, 120, 131–135. [Google Scholar] [CrossRef]
- Lu, A.; Liu, J.; Zhao, D.; Guo, Y.; Li, Q.; Li, N. Photocatalysis of V-bearing rutile on degradation of halohydrocarbons. Catal. Today 2004, 90, 337–342. [Google Scholar] [CrossRef]
- Chastain, J.; King, R.C., Jr. Handbook of X-ray photoelectron spectroscopy. Perkin-Elmer Corp. 1992, 40, 221. [Google Scholar]
- Demeter, M.; Neumann, M.; Reichelt, W. Mixed-valence vanadium oxides studied by XPS. Surf. Sci. 2000, 454–456, 41–44. [Google Scholar] [CrossRef]
- Lang, W.C.; Padalia, B.D.; Watson, L.M.; Fabian, D.J.; Norris, P.R. Multiplet structure in X-ray photoelectron spectra of rare earth elements and their surface oxides. Faraday Discuss. Chem. Soc. 1975, 60, 37–43. [Google Scholar] [CrossRef]
- Fadley, C.S.; Shirley, D.A. Multiplet Splitting of Metal-Atom Electron Binding Energies. Phys. Rev. A 1970, 2, 1109–1120. [Google Scholar] [CrossRef] [Green Version]
- Szade, J.; Lachnitt, J.; Neumann, M. High-resolution Gd 4d photoemission from different intermetallic compounds. Phys. Rev. B 1997, 55, 1430–1434. [Google Scholar] [CrossRef]
- Kowalczyk, S.P.; Edelstein, N.; McFeely, F.R.; Ley, L.; Shirley, D.A. X-ray photoemission spectra of the 4d levels in rare-earth metals. Chem. Phys. Lett. 1974, 29, 491–495. [Google Scholar] [CrossRef] [Green Version]
- Ogasawara, H.; Kotani, A.; Thole, B.T. Lifetime effect on the multiplet structure of 4d x-ray-photoemission spectra in heavy rare-earth elements. Phys. Rev. B 1994, 50, 12332–12341. [Google Scholar] [CrossRef] [PubMed]
- Atuchin, V.V.; Kesler, V.G.; Meng, G.; Lin, Z.S. The electronic structure of RbTiOPO4 and the effects of the A-site cation substitution in KTiOPO4-family crystals. J. Phys. Condens. Matter 2012, 24, 405503. [Google Scholar] [CrossRef]
- Bagus, P.S.; Illas, F.; Pacchioni, G.; Parmigiani, F. Mechanisms responsible for chemical shifts of core-level binding energies and their relationship to chemical bonding. J. Electron Spectrosc. Relat. Phenom. 1999, 100, 215–236. [Google Scholar] [CrossRef]
- Liu, J.; Duan, X.; Zhang, Y.; Li, Z.; Yu, F.; Jiang, H. Growth, electronic structure and properties of Rb2Ti1.95Yb0.05(PO4)3 crystals. J. Alloy. Compd. 2016, 660, 356–360. [Google Scholar] [CrossRef]
- Mendialdua, J.; Casanova, R.; Barbaux, Y. XPS studies of V2O5, V6O13, VO2 and V2O3. J. Electron Spectrosc. Relat. Phenom. 1995, 71, 249–261. [Google Scholar] [CrossRef]
- Huang, Z.; Zhang, L.; Feng, J.; Cui, X.; Pan, W. Electronic, elastic and optical properties of zircon GdVO4 investigated from experiments and LSDA+U. J. Alloy. Compd. 2012, 538, 56–60. [Google Scholar] [CrossRef]
- Huang, Z.; Zhang, L.; Pan, W. Physical properties of zircon and scheelite lutetium orthovanadate: Experiment and first-principles calculation. J. Solid State Chem. 2013, 205, 97–103. [Google Scholar] [CrossRef]
- Perego, M.; Seguini, G.; Scarel, G.; Fanciulli, M. X-ray photoelectron spectroscopy study of energy-band alignments of Lu2O3 on Ge. Surf. Interface Anal. 2006, 38, 494–497. [Google Scholar] [CrossRef]
- Lademan, W.J.; See, A.K.; Klebanoff, L.E.; van der Laan, G. Multiplet structure in high-resolution and spin-resolved X-ray photoemission from gadolinium. Phys. Rev. B 1996, 54, 17191–17198. [Google Scholar] [CrossRef] [PubMed]
- Baur, W. The geometry of polyhedral distortions. Predictive relationships for the phosphate group. Acta Cryst. 1974, B30, 1195–1215. [Google Scholar] [CrossRef]
Figure 1.
X-ray diffraction patterns of tetragonal LuxGd1−xVO4 with standard patterns of GdVO4 and LuVO4 shown at the bottom (vertical bar). The inset is an enlargement of the 2θ region between 22° and 38°.
Figure 1.
X-ray diffraction patterns of tetragonal LuxGd1−xVO4 with standard patterns of GdVO4 and LuVO4 shown at the bottom (vertical bar). The inset is an enlargement of the 2θ region between 22° and 38°.

Figure 2.
Lattice parameters a, c, and unit cell volume as functions of x values in LuxGd1−xVO4.

Figure 3.
Transmission electron microscopy images obtained for (a) x = 0, (b) x = 0.1, (c) x = 0.3, (d) x = 0.5, (e) x = 0.9 and (f) x = 1 of LuxGd1−xVO4 nanocrystals.
Figure 3.
Transmission electron microscopy images obtained for (a) x = 0, (b) x = 0.1, (c) x = 0.3, (d) x = 0.5, (e) x = 0.9 and (f) x = 1 of LuxGd1−xVO4 nanocrystals.
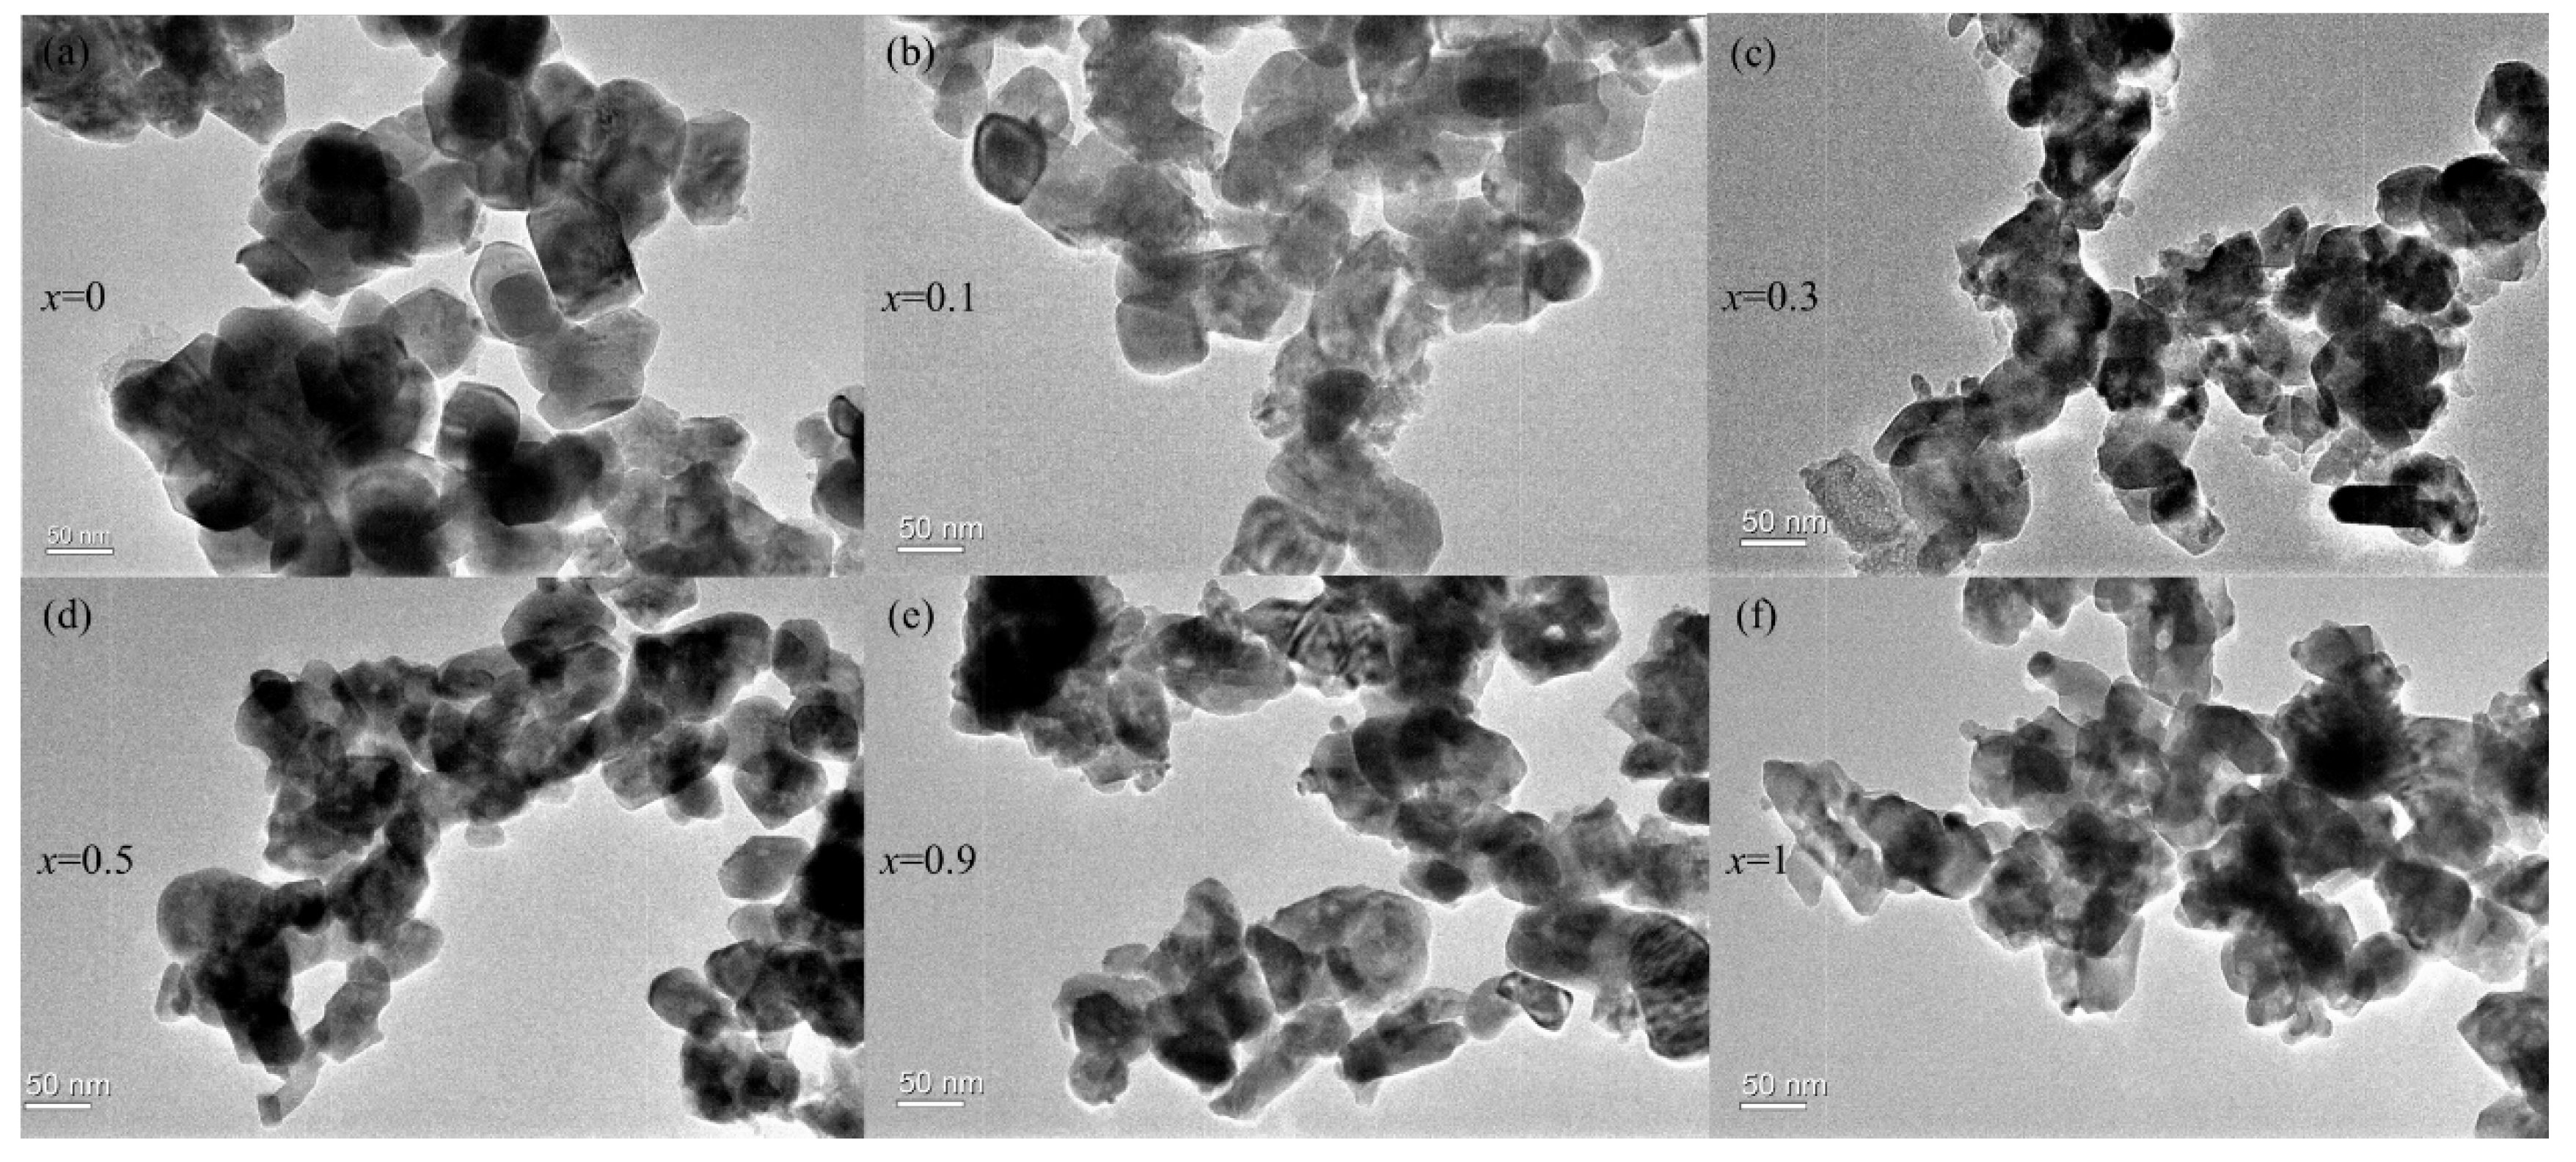
Figure 4.
Distribution of neighboring atoms of the first three shells of the central (a) Gd atom in GdVO4 and (b) Lu atom in LuVO4 with the zircon-type structure; the annotated interatomic distances of the first coordination shell were obtained from EXAFS.
Figure 4.
Distribution of neighboring atoms of the first three shells of the central (a) Gd atom in GdVO4 and (b) Lu atom in LuVO4 with the zircon-type structure; the annotated interatomic distances of the first coordination shell were obtained from EXAFS.
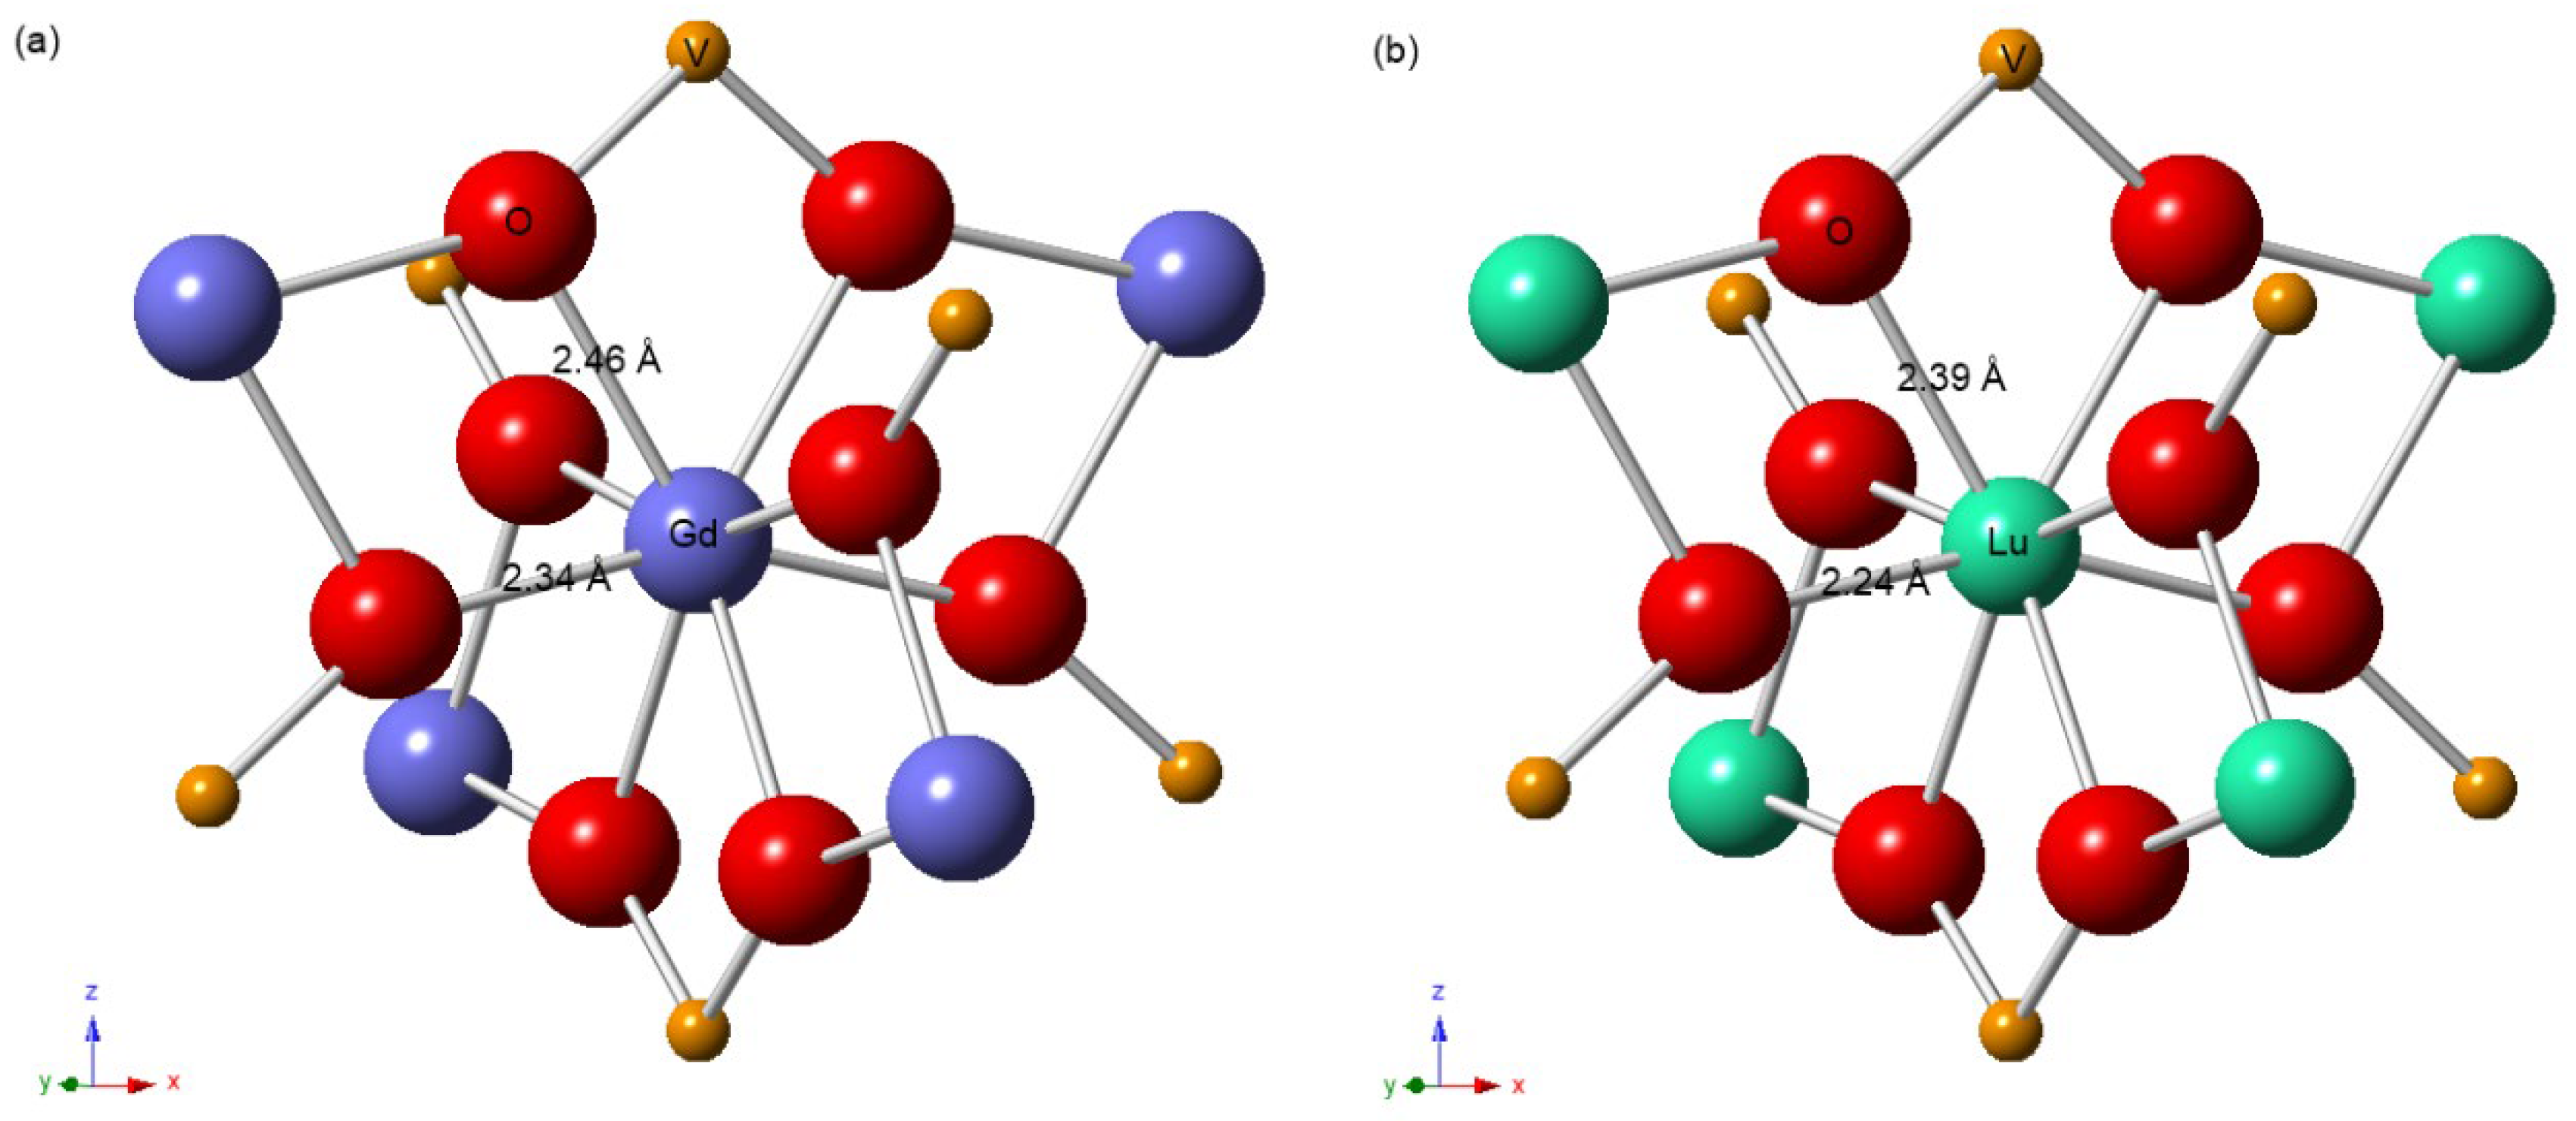
Figure 5.
Magnitude of the Fourier-transformed EXAFS spectra (hollow circles) and the corresponding fitting curves (solid lines) of the first two coordination shells at the (a) Gd L3-edge and (b) Lu L3-edge for LuxGd1−xVO4 solid solutions.
Figure 5.
Magnitude of the Fourier-transformed EXAFS spectra (hollow circles) and the corresponding fitting curves (solid lines) of the first two coordination shells at the (a) Gd L3-edge and (b) Lu L3-edge for LuxGd1−xVO4 solid solutions.

Figure 6.
The (a) first and (b) second coordination shells’ interatomic distances with respective error bars of Gd3+ (square) and Lu3+ (dot), and the average distances (triangles) in the LuxGd1−xVO4 solid solutions. The average distances are weighted values considering the elemental contents, and the solid blue lines are the linear fits.
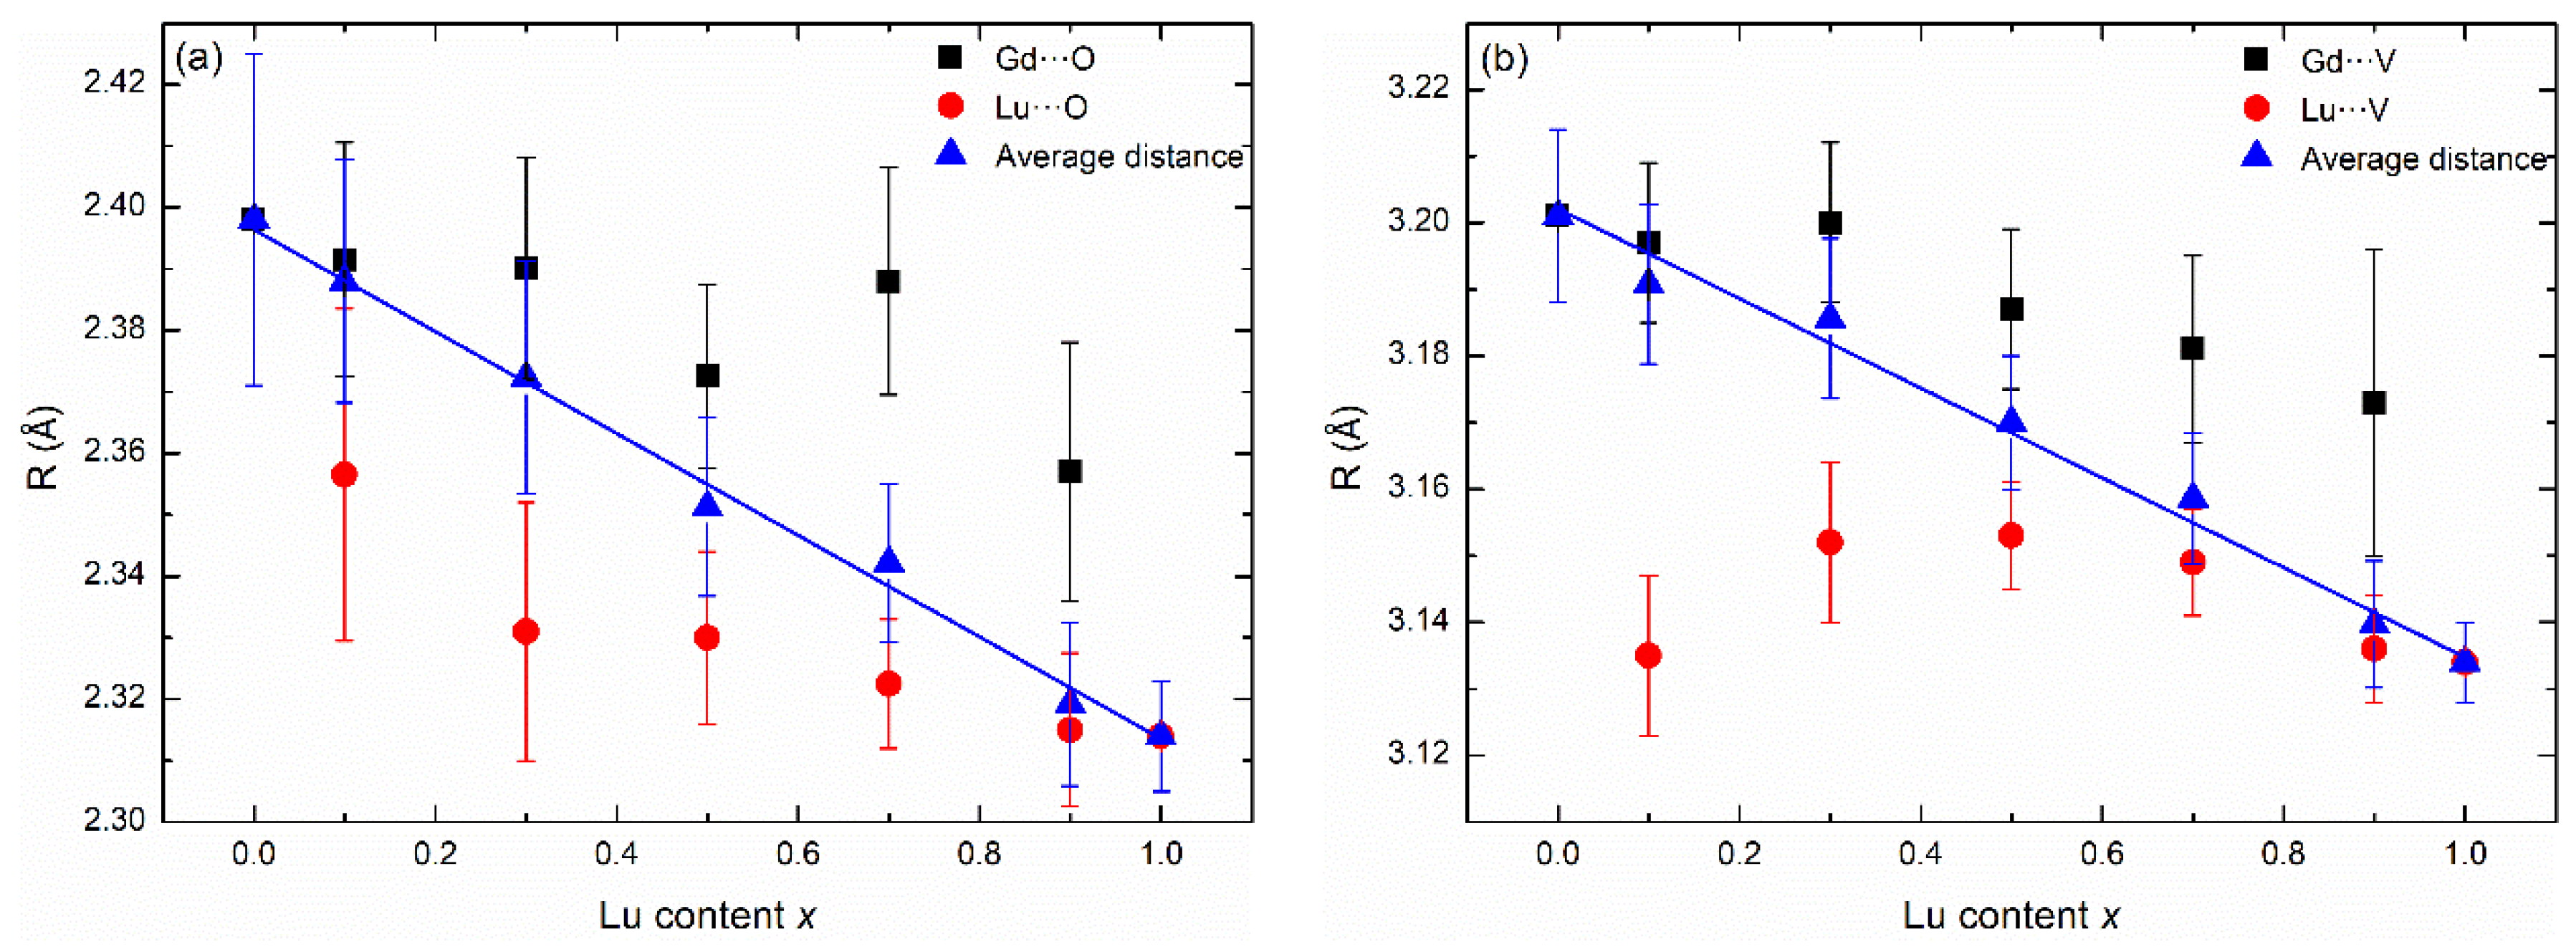
Figure 7.
XPS survey spectra of LuxGd1−xVO4 (0 ≤ x ≤ 1) nanocrystals.
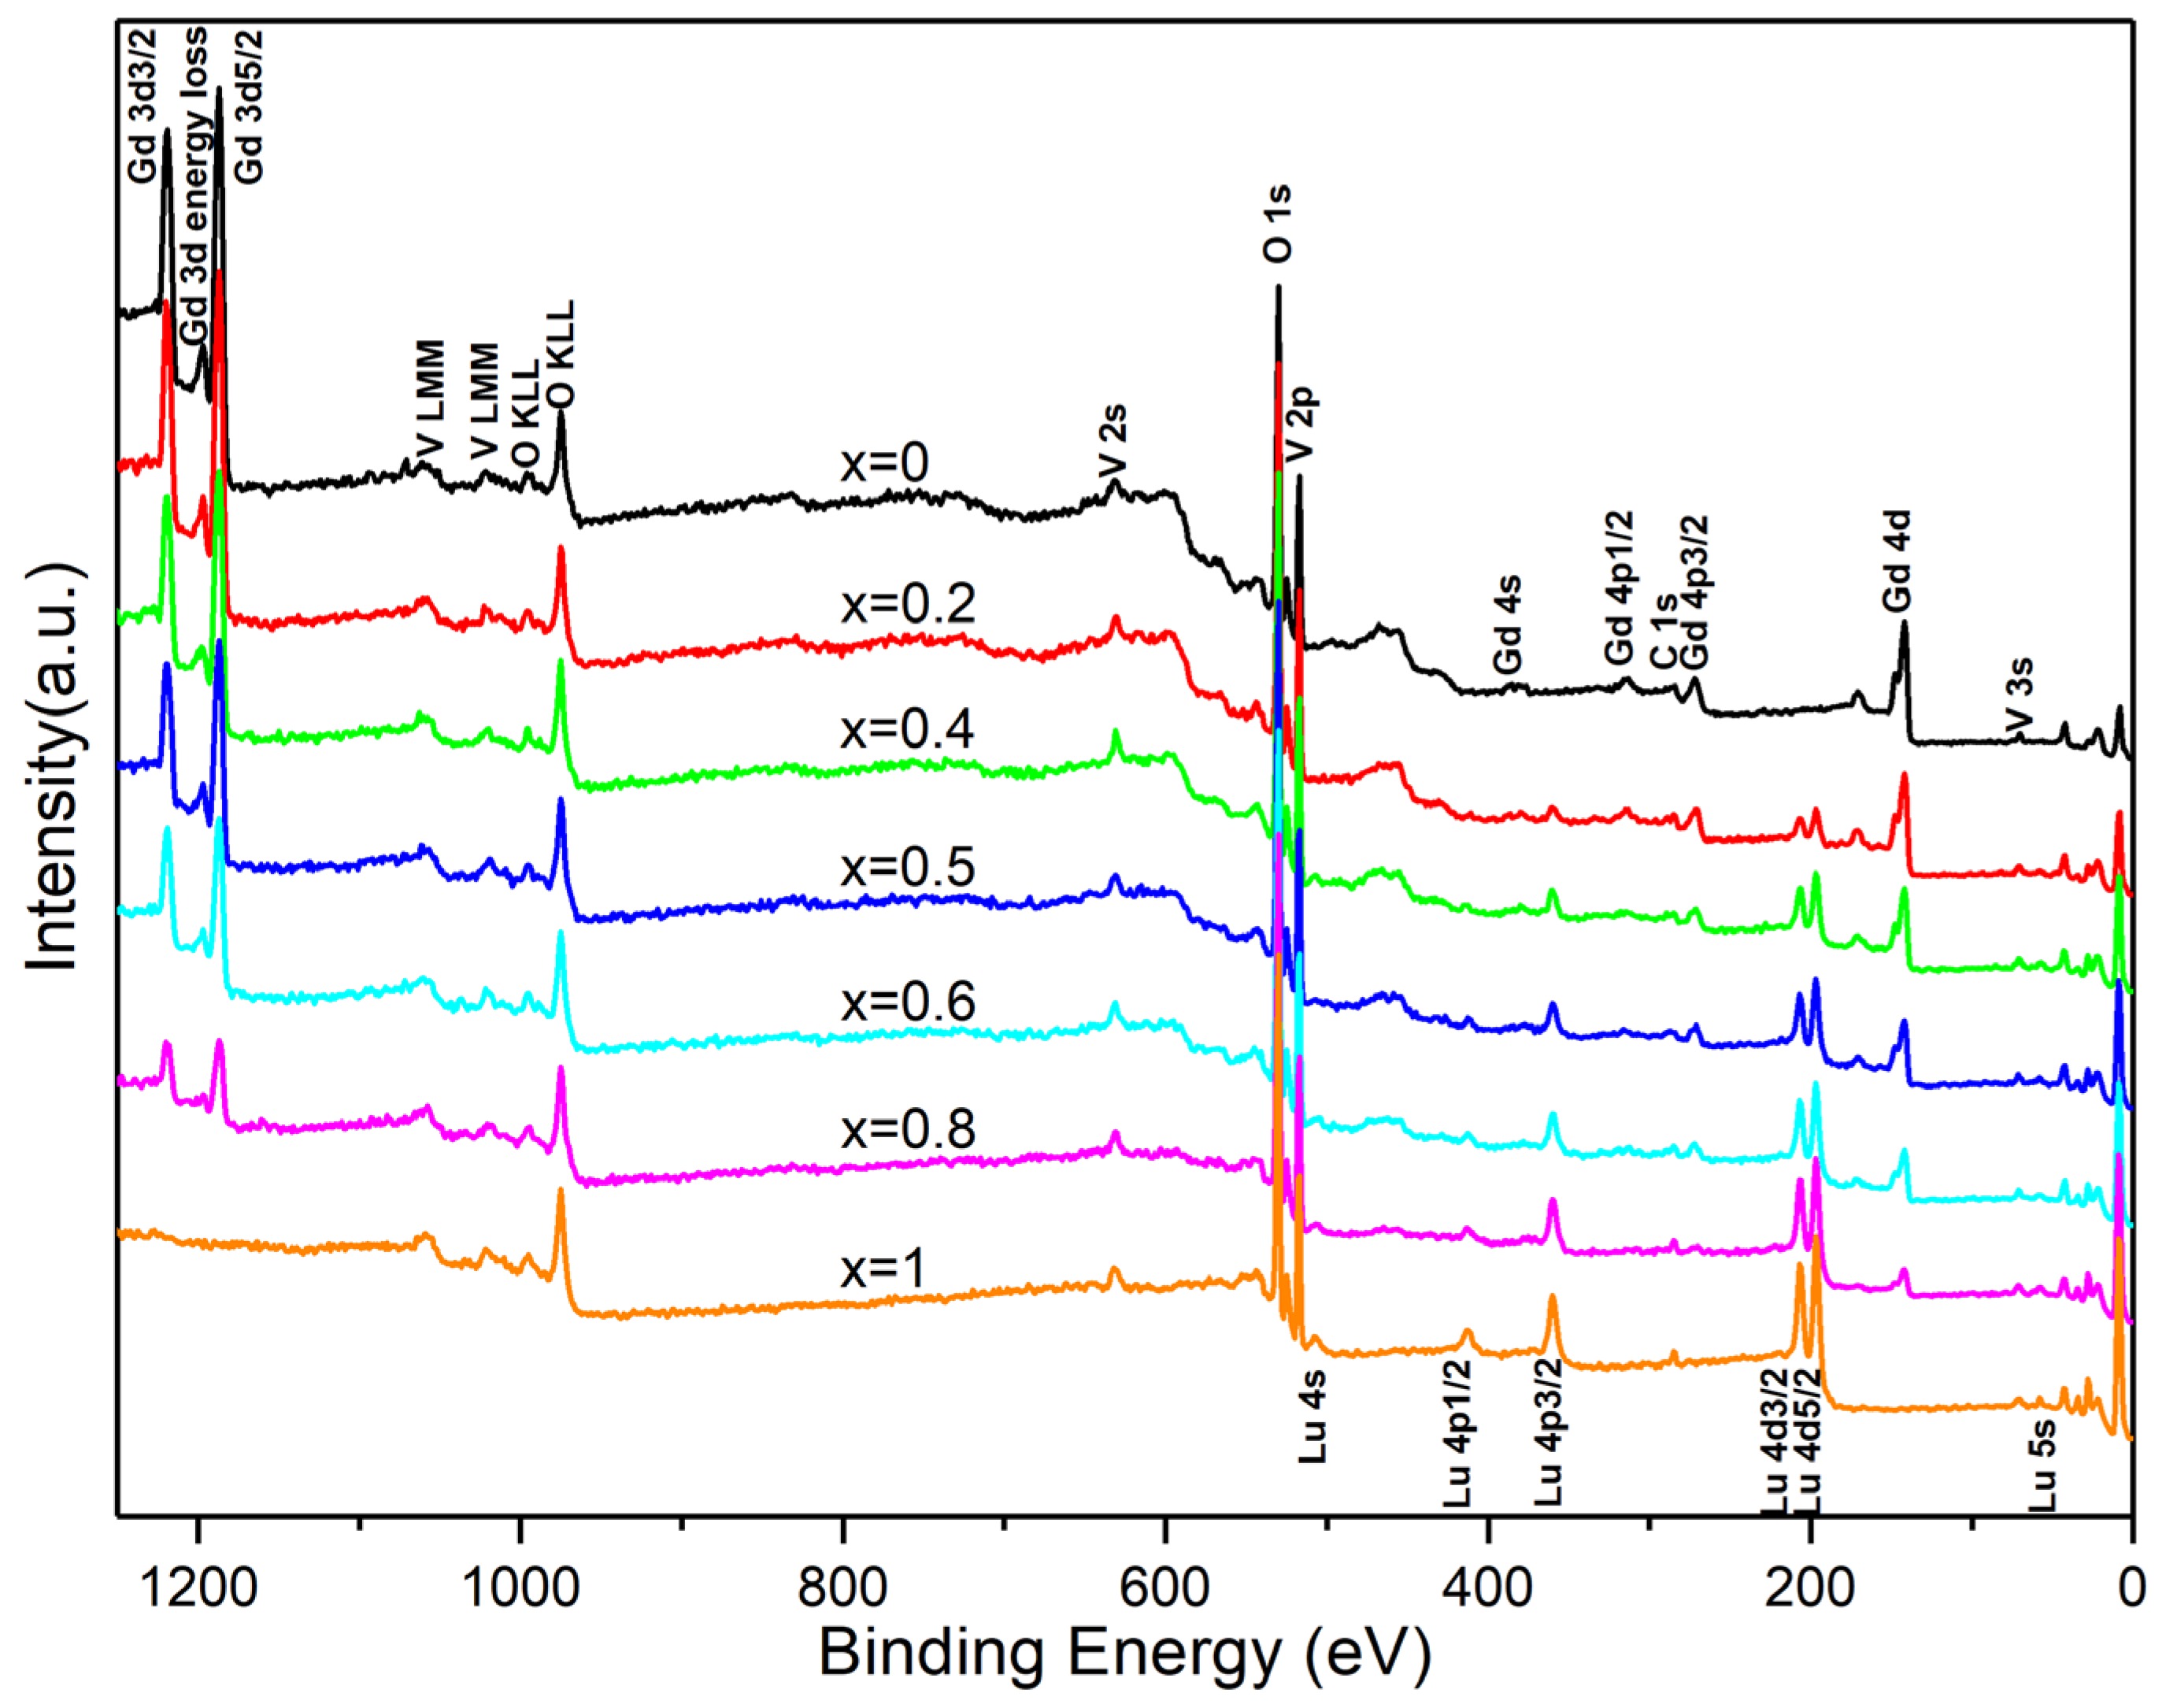
Figure 8.
(a) Stacked O 1s and V 2p XPS spectra of LuxGd1−xVO4 (0 ≤ x ≤ 1) and the deconvoluted spectrum of GdVO4 (inset). (b) Binding energy of V 2p3/2 and binding energy difference between O 1s and V 2p3/2 versus the Lu content x. The error bars are 0.1 and 0.2 eV, respectively.
Figure 8.
(a) Stacked O 1s and V 2p XPS spectra of LuxGd1−xVO4 (0 ≤ x ≤ 1) and the deconvoluted spectrum of GdVO4 (inset). (b) Binding energy of V 2p3/2 and binding energy difference between O 1s and V 2p3/2 versus the Lu content x. The error bars are 0.1 and 0.2 eV, respectively.

Figure 9.
(a) Background-subtracted Lu 4d XPS spectra of LuxGd1−xVO4 (0 < x ≤ 1) and the doublet fitting Lu 4d spectrum of LuVO4 (inset). (b) Binding energy of Lu 4d5/2 and the binding energy difference between O 1s and Lu 4d5/2 versus the Lu content x. The error bars are 0.1 and 0.2 eV, respectively.
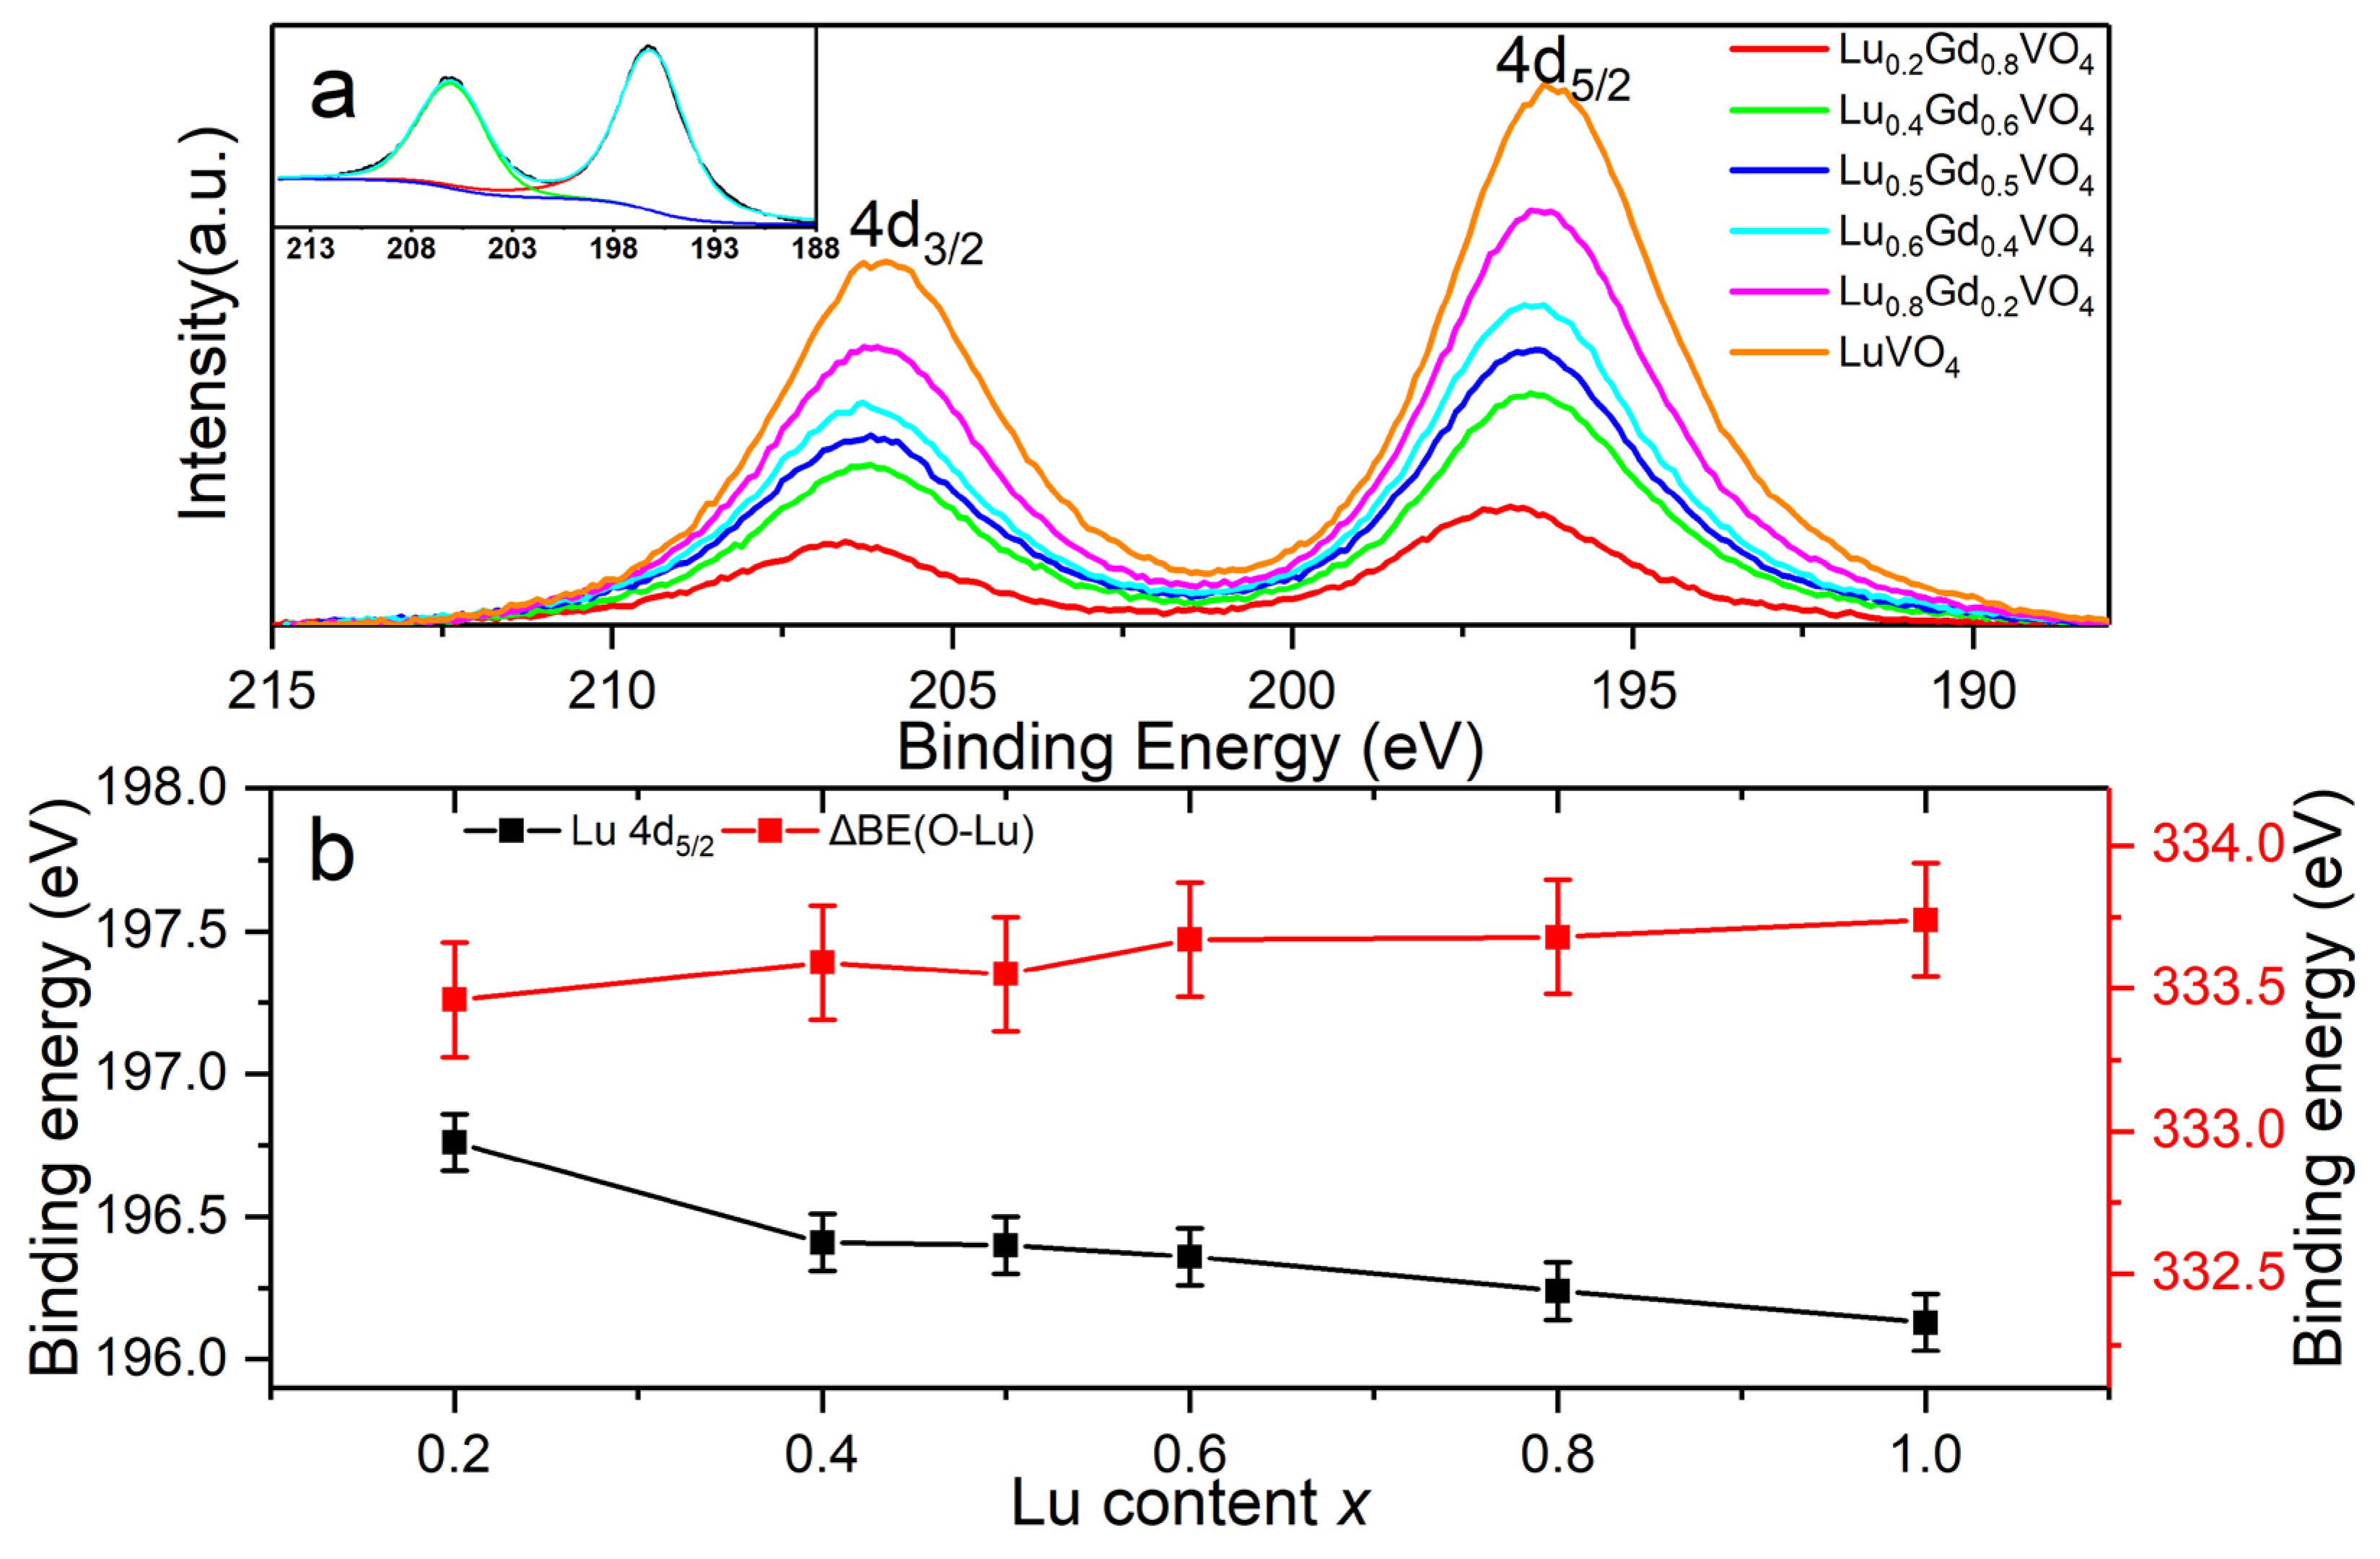
Figure 10.
(a) Background-subtracted Gd 4d XPS spectra of LuxGd1−xVO4 (0 ≤ x < 1) and the deconvolution of peaks A and B of GdVO4 (inset). (b) Binding energy of Gd 4d 9D5 peaks and binding energy difference between O 1s and Gd 4d 9D5 versus the Lu content x. The error bars are 0.1 and 0.2 eV, respectively.

Figure 11.
(a) Background-subtracted XPS valence band spectra of LuxGd1−xVO4 (0 ≤ x ≤1) solid solutions; (b) LSDA + U-calculated DOS and PDOS of Lu0.5Gd0.5VO4.
Figure 11.
(a) Background-subtracted XPS valence band spectra of LuxGd1−xVO4 (0 ≤ x ≤1) solid solutions; (b) LSDA + U-calculated DOS and PDOS of Lu0.5Gd0.5VO4.

Table 1.
EPMA compositions of LuxGd1−xVO4 solid solutions.
| x | 0.1 | 0.3 | 0.5 | 0.7 | 0.9 |
|---|---|---|---|---|---|
| V (mol %) | 50.295 | 50.719 | 49.543 | 51.071 | 50.627 |
| Gd (mol %) | 44.910 | 34.566 | 25.230 | 15.590 | 4.960 |
| Lu (mol %) | 4.795 | 14.714 | 25.227 | 33.338 | 44.413 |
| Molar ratio of Lu/RE 1 | 0.10 | 0.30 | 0.50 | 0.68 | 0.90 |
1 RE is the sum of Lu and Gd.
Disclaimer/Publisher’s Note: The statements, opinions and data contained in all publications are solely those of the individual author(s) and contributor(s) and not of MDPI and/or the editor(s). MDPI and/or the editor(s) disclaim responsibility for any injury to people or property resulting from any ideas, methods, instructions or products referred to in the content. |
© 2023 by the authors. Licensee MDPI, Basel, Switzerland. This article is an open access article distributed under the terms and conditions of the Creative Commons Attribution (CC BY) license (https://creativecommons.org/licenses/by/4.0/).
Share and Cite
MDPI and ACS Style
Chen, Y.; Li, Z.; Ji, N.; Wei, C.; Duan, X.; Jiang, H. The Local and Electronic Structure Study of LuxGd1−xVO4 (0 ≤ x ≤ 1) Solid Solution Nanocrystals. Nanomaterials 2023, 13, 323. https://doi.org/10.3390/nano13020323
AMA Style
Chen Y, Li Z, Ji N, Wei C, Duan X, Jiang H. The Local and Electronic Structure Study of LuxGd1−xVO4 (0 ≤ x ≤ 1) Solid Solution Nanocrystals. Nanomaterials. 2023; 13(2):323. https://doi.org/10.3390/nano13020323
Chicago/Turabian StyleChen, Yang, Ziqing Li, Nianjing Ji, Chenxi Wei, Xiulan Duan, and Huaidong Jiang. 2023. "The Local and Electronic Structure Study of LuxGd1−xVO4 (0 ≤ x ≤ 1) Solid Solution Nanocrystals" Nanomaterials 13, no. 2: 323. https://doi.org/10.3390/nano13020323
Note that from the first issue of 2016, this journal uses article numbers instead of page numbers. See further details here.