Article

Quantitative Detection of Mastitis Factor IL-6 in Dairy Cow Using the SERS Improved Immunofiltration Assay

1
State Key Laboratory of Animal Nutrition, Institute of Animal Science, Chinese Academy of Agricultural Sciences, Beijing 100193, China
2
Institude of Food Science and Technology, Chinese Academy of Agricultural Sciences, Beijing 100193, China
*
Authors to whom correspondence should be addressed.
Nanomaterials 2022, 12(7), 1091; https://doi.org/10.3390/nano12071091
Submission received: 8 March 2022 / Revised: 25 March 2022 / Accepted: 25 March 2022 / Published: 26 March 2022
(This article belongs to the Topic Advanced Nanomaterials for Sensing Applications)

Abstract

:
Interleukin-6 (IL-6) is generally used as a biomarker for the evaluation of inflammatory infection in humans and animals. However, there is no approach for the on-site and rapid detection of IL-6 for the monitoring of mastitis in dairy farm scenarios. A rapid and highly sensitive surface enhanced Raman scattering (SERS) immunofiltration assay (IFA) for IL-6 detection was developed in the present study. In this assay, a high sensitivity gold core silver shell SERS nanotag with Raman molecule 4-mercaptobenzoic acid (4-MBA) embedded into the gap was fabricated for labelling. Through the immuno-specific combination of the antigen and antibody, antibody conjugated SERS nanotags were captured on the test zone, which facilitated the SERS measurement. The quantitation of IL-6 was performed by the readout Raman signal in the test region. The results showed that the detection limit (LOD) of IL-6 in milk was 0.35 pg mL−1, which was far below the threshold value of 254.32 pg mL−1. The recovery of the spiking experiment was 87.0–102.7%, with coefficients of variation below 9.0% demonstrating high assay accuracy and precision. We believe the immunosensor developed in the current study could be a promising tool for the rapid assessment of mastitis by detecting milk IL-6 in dairy cows. Moreover, this versatile immunosensor could also be applied for the detection of a wide range of analytes in dairy cow healthy monitoring.

1. Introduction

Mastitis is a widespread disease in dairy cows, which not only great restricts the development of the dairy industry, but also causes heavy economic losses in the dairy farming industry. Due to the complex pathogenesis and low cure rate, the incidence of dairy cow mastitis could be as high as 50~70% in China, and the treatment cost is nearly 200 million yuan every year [1]. Many researchers are devoted to investigating the underlying biological pathogenesis of mastitis to diagnose and manage this disease [2,3,4]. Pathogen infection is the main cause of mastitis. When this occurs, cytokines are released to participate in the immune responses and regulate the local inflammatory reactions [5]. Moreover, due to a rapid increase in milk yield in the early lactation stage of dairy cows, mammary epithelial cells usually secrete some proinflammatory cytokines and trigger immune responses [6]. Consequently, cow mastitis is closely related to the immune response promoted by inflammatory cytokines.
Cytokines play important roles in the immune system of dairy cows by regulating various cell physiological functions. In addition, they act as transmitters of cell communication in the process of inflammation and immune response [7,8]. As a multifunctional cytokine, interleukin-6 (IL-6) is a kind of glycoproteins produced and secreted by activated macrophages, lymphocytes, and epithelial cells. When dairy cows have bacterial infections such as mastitis and endometritis, a lot of inflammatory and immunologic cells in the body can express the IL-6 gene and produce IL-6 [9,10]. Therefore, IL-6 is often used clinically as a monitoring index and as an evaluation standard for mastitis in dairy cows. Under normal circumstances, the IL-6 concentration in healthy dairy cows is less than 13.02 and 164.47 pg mL−1 in the serum and milk, respectively. When mastitis occurs, the IL-6 content in the serum and milk of dairy cows will increase significantly up to 254.32 and 432.09 pg mL−1, respectively [11,12]. So, the concentration of IL-6 in the milk of dairy cows can practically reflect the incidence of the inflammatory response [13,14]. Therefore, the rapid and high-sensitivity detection of IL-6 is of great significance in the early prevention and diagnosis of inflammatory diseases such as mastitis in dairy cows. On the contrary, delaying diagnosis and treatment will greatly increase the treatment cycle and medical cost [15].
At present, the commonly used methods for detecting the inflammatory biomarker IL-6 in dairy cows mainly include enzyme-linked immunoassay (ELISA) [16], chemiluminescence immunoassay (CLIA) [17], leukocyte count [18], and electrochemical immunosensor [19]. However, some limitations still exist in these methods, such as expensive equipment, time-consuming, complex procedures, and narrow linear range of results. These results are insufficient for the effective diagnosis of inflammatory diseases in dairy cows. It is urgent and challenging to establish a simple and easy method to quantitatively detect IL-6 in milk.
As an on-site real-time detection method, the immunofiltration assay (IFA, immunofiltration kit) has the advantage of having a simple structure, convenient operation, quick analysis, and low cost. It has been widely used in the field of inflammatory biomarker detection [20]. Nevertheless, the traditional colloidal gold-based assay uses color change to discriminate target concentration, which greatly limits the detection accuracy and sensitivity [21,22]. In recent years, with the development of surface plasmon optics, surface enhanced Raman scattering (SERS) spectroscopy has attracted increasing attention. Due to the interaction between the excitation light and the noble metal nanomaterials, surface plasmon resonance (SPR) is generated, which leads to electromagnetic field enhancement at “hot spots” and amplifies the Raman signal by 106–109 times. Thus, the SERS detection sensitivity can reach a single molecular level [23,24]. In addition, SERS inherently has the advantages of a short response time, no interference from an aqueous solution, low sample pretreatment requirement, high accuracy, and no damage to the samples [25,26,27,28,29,30,31,32]. Therefore, combining SERS with IFA is a promising method and has been previously reported for rapid and highly sensitive detection of multiplex prostate cancer biomarkers and inflammatory biomarkers in human serum [33,34]. However, the study of this method for the determination of IL-6 in dairy cow milk is still barely reported.
In this study, a gold-silver core shell SERS nanotag with 4-MBA as Raman molecule was prepared and used for labelling in IFA for highly sensitive and quantitative detection of IL-6 in milk. As shown in Figure 1a, first, the surface of colloidal gold was modified with 4-MBA, and then the silver shell was wrapped outside to rationally design the Au4-MBA@Ag SERS nanotag. Then, it was conjugated with an Anti-IL-6 labeled antibody to form a bio-functionalized SERS nanotag. After that, the bio-functionalized SERS nanotag was mixed with the target IL-6 and dropped onto the test region of the kit, and maintained for 5 min for an immune reaction. Subsequently, it was washed and finally the SERS signal of the test spot was detected, which is schematically depicted in Figure 1b. Due to the high surface to volume ratio (SVR) of the detection membrane and the high sensitivity of the SERS nanotag, a satisfactory result with a wide linear range and low detection limit was obtained. It was proven that the proposed SERS IFA method was reliable and sensitive for the detection of IL-6 in milk.

2. Materials and Methods

2.1. Materials and Instruments

Chloroauric acid (HAuCl4·3H2O), silver nitrate (AgNO3), ascorbic acid (AA) and trisodium citrate (Na3C6H5O7) were provided by Sigma-Aldrich (St. Louis, MO, USA). Bovine serum albumin (BSA), phosphate buffered saline (PBS, 0.1 M, and pH = 7.4), Tween 20, and 4-mercaptobenzoic acid (4-MBA) were obtained from Alfa-Aesar (Shanghai, China). Recombinant IL-6 and mouse anti-human IL-6 monoclonal antibody were commercially purchased from Beijing Key-bio Biotech Co., Ltd. (Beijing, China). IL-8, IL-10, CRP (C-reactive protein), and SAA (Serum amyloid A) were purchased from Biodee Biotechnology Co., Ltd. (Shanghai, China). The IFA components, including the nitrocellulose membranes, and absorbent pad were purchased from EMD Millipore Co., Ltd. (Billerica, MA, USA). Glassware was first soaked in a freshly prepared aqua regia solution (HCl/HNO3) overnight, and then rinsed with water before use. All distilled water was purified to Millipore Milli-Q quality. All of the chemicals were used as received.
SERS measurements were performed using a confocal Raman microscope IDSpec Aurora J300 and the objective magnification was 20× with a numerical aperture of 0.5. Its operating wavelength was 633 nm with a laser power of 10 mW, and providing a high-resolution Raman scattering spectrum with a resolution of 1 cm−1. The absorption spectrum of the nanoparticles was measured using a DU800 spectrometer and its scanning wavelength was from 200 to 800 nm. Scanning electron microscope (SEM) photographs were taken on a Mira3LMH (Tescan, Shanghai, China) with an accelerating voltage of 10 kV to characterize Au nanoparticles and SERS nanotags. The zeta potential and size distribution were acquired by a Zetasizer Nano Z (Malvern Instruments Ltd., Westborough, MA, USA). Moreover, the structure of the SERS nanotag was characterized using a transmission electron microscope (Hitachi 7650B, Berkshire, UK) with a resolution of 0.2 nm at an accelerating voltage of 40 kV.

2.2. Synthesis of Au4-MBA@Ag SERS Nanotags

The Au4-MBA@Ag were synthesized according to our previous paper [34], and the preparation procedure is illustrated in Figure 1a. Firstly, colloidal Au NPs were prepared using a method of reduction of chloroauric acid with sodium citrate according to the well-established Frens method, with minor modifications [35]. Briefly, 200 mL of chloroauric acid aqueous solution (0.01%, w/v) was heated under condensate reflux with magnetic stirring. When the solution was boiled, 1.5 mL of sodium citrate solution (1.0%, w/v) was quickly added once. After 10 min of reaction, the solution color changed to red wine, and was cooled down to room temperature. Then, the Au NPs were used as templates for the synthesis of Au4-MBA@Ag nanotags. Accordingly, 10 µM 4-MBA ethanol solution was added to 20 mL AuNP solution and vigorously stirred for 30 min. Then, 4-MBA molecular was connected to the surface of the AuNPs by the formation of Au-S bonds. Subsequently, 1 mL of 0.1 M ascorbic acid was added to Au4-MBA solution, and then 200 µL of 2.5 mM AgNO3 was added dropwise under vigorous stirring. Because of the reduction of AgNO3 by ascorbic acid, the Ag shell was gradually surrounded by Au4-MBA NPs, and eventually formed the Au4-MBA@Ag SERS nanotags. The Ag shell thickness was optimized to achieve maximum Raman enhancement [36].

2.3. Conjugation of IL-6 Antibody with Au4-MBA@Ag

Anti-IL-6 antibody labelled Au4-MBA@Ag nanotags were prepared as follows. Firstly, different volumes of K2CO3 (0.1 M) and HCl (0.1 M) were added to the prepared Au4-MBA@Ag solution (10 mL) to adjust the pH value to 8.5. After 3 min, 20 μL of labelled mAb against IL-6 (1.0 mg mL−1) was added to the Au4-MBA@Ag solution at 25 °C for 1 h. Subsequently, 200 µL of 5% BSA was added to the Au4-MBA@Ag conjugates and was allowed to react for another 30 min to block the unspecific binding sites on the sites of the NPs. Finally, the resulting solution was centrifuged at 6000 rpm for 10 min at 4 °C and the supernatant was discarded to remove the unbound antibody and chemicals. The residues containing the IL-6 conjugated Au4-MBA@Ag SERS nanotag was diluted with pure water to 1 mL and stored at 4 °C before use [37,38].

2.4. Preparation of IL-6 Solutions

IL-6 powder was dissolved in 10 mM PBS solution to prepare an IL-6 sample with different concentrations, and the solutions were stored at 4 °C before use.

2.5. Detection of IL-6 in Milk

Bovine raw milk was produced by lactating Holstein cows at the cow farm of the Institute of Animal Science, Chinese Academy of Agricultural Sciences. Then, IL-6 powder (1.0 mg) was spiked into 100 mL of liquid milk to reach a concentration of 0.1 mg mL−1 IL-6 as an initial solution. Thereafter, different concentrations of 0.01, 0.5, 2, 50, and 200 ng mL−1 of IL-6 in milk were prepared by serial dilutions of the initial solution. In order to prepare the milk samples for SERS detection, first, 4 mL of acetonitrile (acetone or ethyl alcohol) was added to 4 mL of the spiked milk sample [39]. Subsequently, the mixture was dispersed by ultrasonic for 5 min before centrifugation at 6000 rpm for 10 min. After that, 2 mL of deionized water was added into the centrifuge tube with the precipitate, and then the mixture was dispersed by ultrasonic for another 5 min and centrifuged at 6000 rpm for 5 min. Finally, the supernatant was transferred to a clean tube for measurement. The milk sample without IL-6 was used as the control.

2.6. Data Analysis

Every test was performed five times for repeated measurements in the current study. A smart phone equipped with a high-resolution camera was used to acquire visual pictures from NC membrane of this IFA kit within 5 min after each measurement. The images were processed using ImageJ software. The measured Raman spectra and visual intensity values were analyzed by Origin 2019 (OriginLab, Hampton, MA, USA). All the acquired data were shown as mean values with standard deviations.

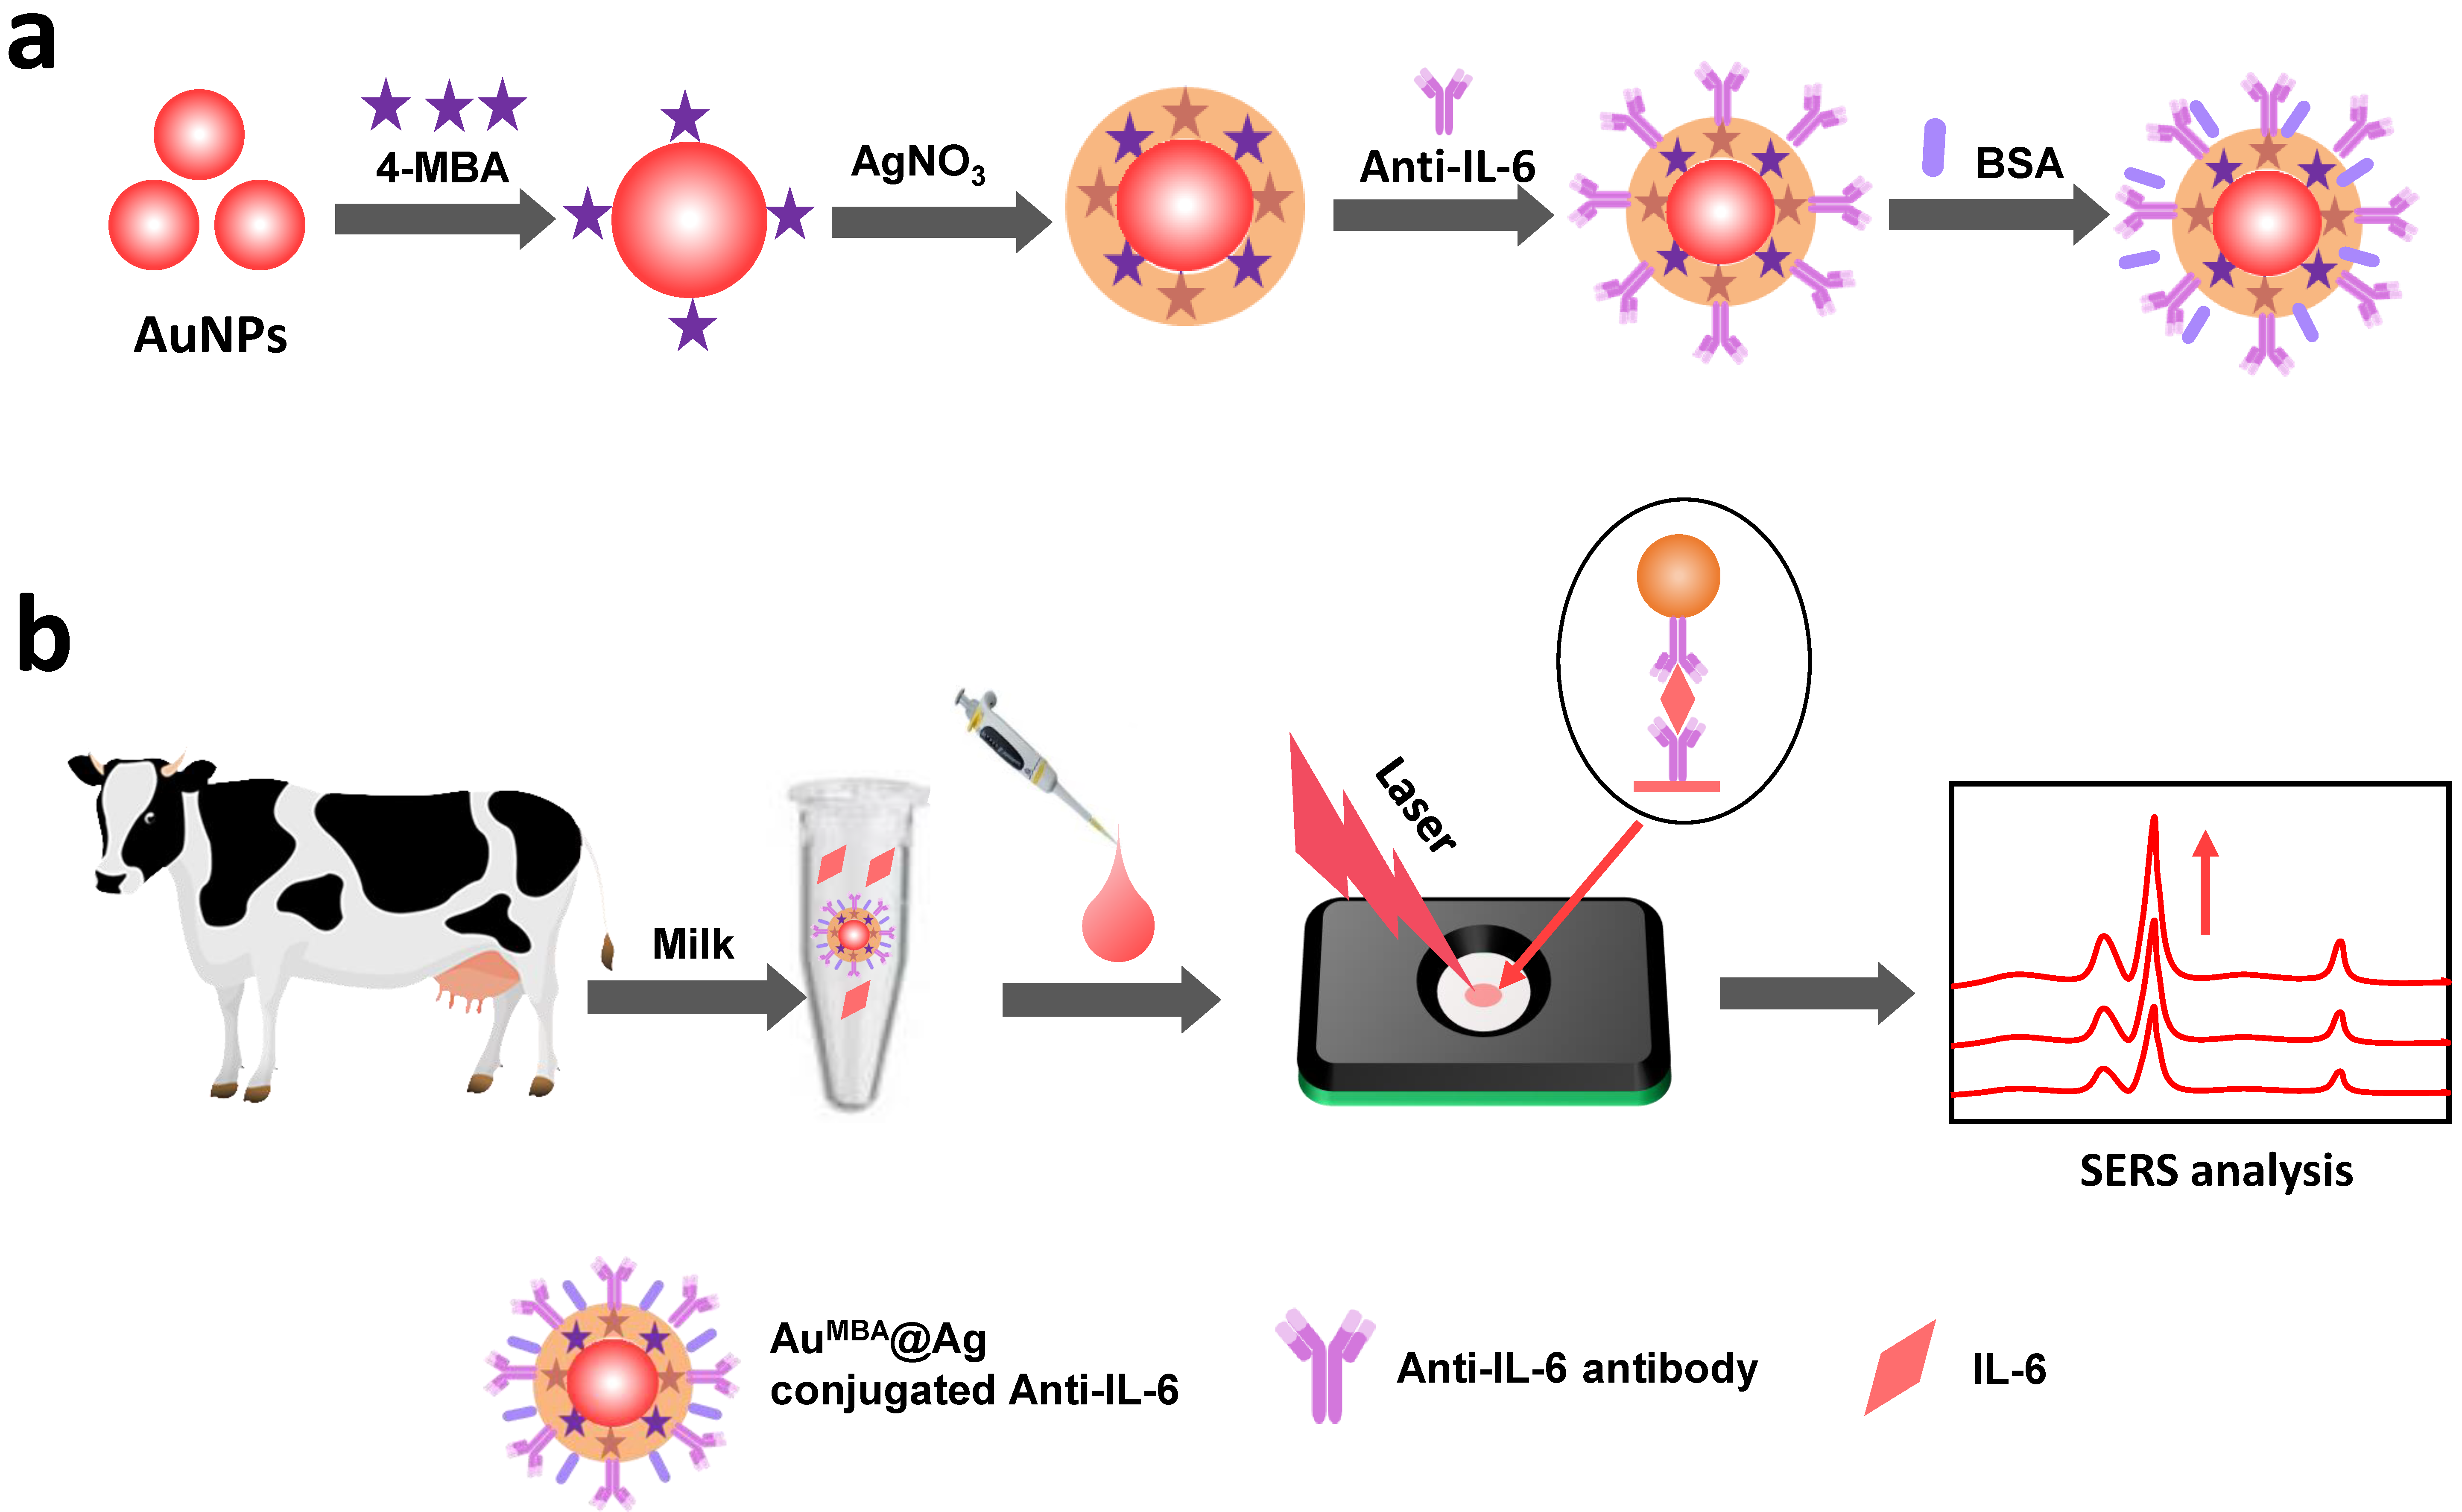
2.7. The Principle of the SERS IFA Method

In this study, a tube was employed to premix the sample solution and the detection reagent, and was then subjected to the IFA kit. Compared with normal two-step titration, this assay format provided a homogeneous system for antigen-antibody binding, which could produce a higher sensitivity [40,41]. The principle of the SERS-based IFA for IL-6 was similar to that based on traditional colloidal NPs, and the scheme is illustrated in Figure 1b. The IL-6 mAb antibodies were immobilized on the test region of the nitrocellulose membrane by physical adsorption and were used as the capture reagent, while the labeled IL-6 mAb antibody conjugated Au4-MBA@Ag SERS nanotags (Au4-MBA@Ag@Ab) were used as the detection reagent. In a positive situation (the sample contained IL-6 target and the concentration was high), the Au4-MBA@Ag@Ab was specifically bound with IL-6, and then dropped on the IFA kit. The solution was infiltrated through the NC membrane by capillary force and was captured by coating antibodies, forming sandwich immune complexes in the test region. After that, washing three times was done to reduce the nonspecific adsorption of the nanotags on the NC membrane. In this case, due to the accumulation of the immune complexes, a brown-yellow dot would appear on the NC membrane. In a negative situation (the sample without IL-6 target), the sample could not bind with Au4-MBA@Ag@Ab. When applied in the test region of the NC membrane, they could not be captured by the coating antibody, leading to no immune complexes being captured in the test region and no color change. Therefore, the degree of color intensity as well as the SERS signal on the test zone was positively related to the concentration of IL-6 in the sample solution. Moreover, the SERS intensity that arose from Au4-MBA@Ag captured on the test zone was measured with Raman equipment, allowing for more sensitive and extensive measurement than the conventional colorimetric method.

3. Results

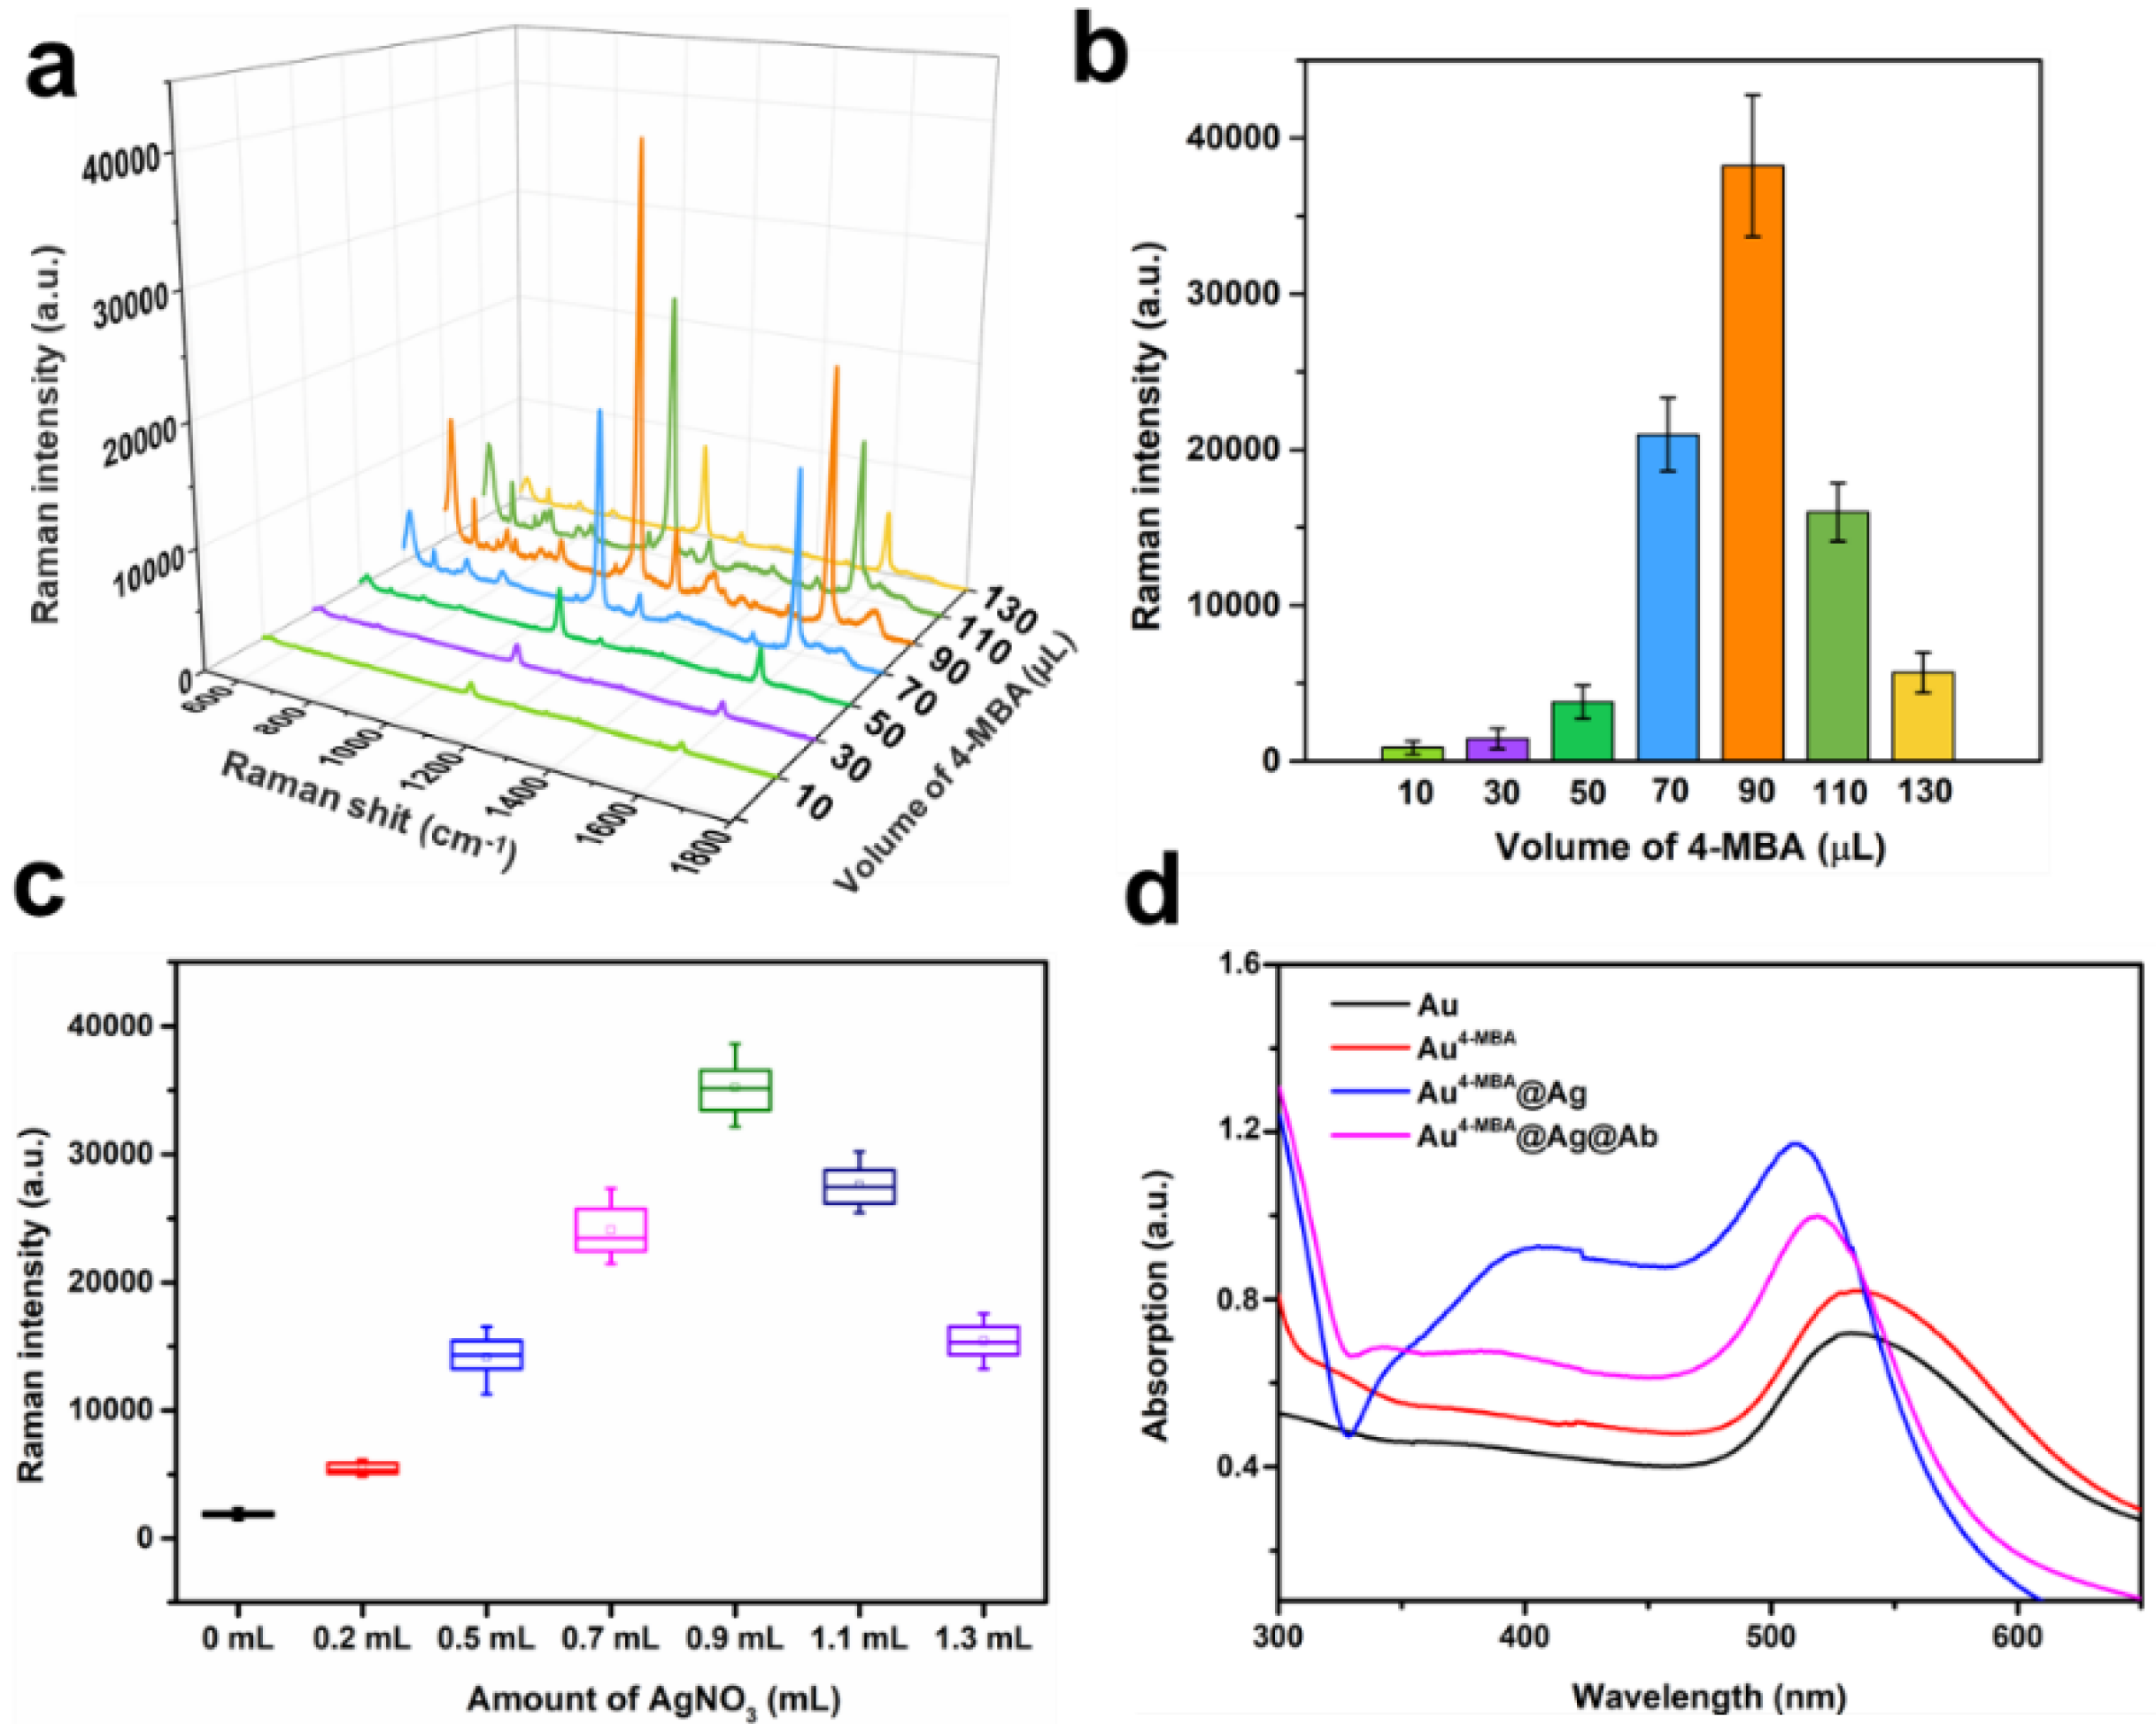
3.1. Characterization of Au4-MBA@Ag SERS Nanotag

In this study, an Au4-MBA@Ag SERS nanotag was adopted for the quantitative analysis of IL-6 in milk. Compared with the other protocols, it had merits such as being easy to use, and had a fast procedure and high sensitivity. AuNP cores were prepared by citrate reduction of the chloroauric acid solution, as described above [42]. The Figure 2a inset displays the colloid gold solution in purple, indicating the AuNPs were within 35–60 nm. Furthermore, most AuNPs had a round or spherical shape with a good dispersibility in the TEM image, as shown in Figure 2a. Based on the statistical analysis of the 100 AuNPs, the size distribution information is shown in Figure 2c. The average particle diameter was 55 ± 5 nm with a maximum absorption peak at 535 nm (Figure 3d). Subsequently, the Raman molecule 4-MBA was added to 20 mL Au colloids, which could be easily attached to the AuNP surface by the Au-S bond. Generally, the more 4-MBA molecules embedded into the gap of bimetal, the higher the SERS signal that will be generated, due to the ultrahigh enhancement of the electromagnetic field confined in the gap [43]. However, when excess 4-MBA was added to Au colloids, they would neutralize the surface change of AuNP and decrease its monodispersity, leading the AuNPs to aggregate or even precipitate, which would greatly affect the SERS intensity. To determine the proper amount of 4-MBA for the best SERS performance, different volumes of 4-MBA with a concentration of 10 µM were mixed with 20 mL of Au colloids. The averaged Raman spectra are shown in Figure 3a. Two dominated Raman peaks at 1076 and 1585 cm−1 were observed for Au4-MBA@Ag, which were attributed to the in-plane ring breathing mode coupled with the ν(C-S) and aromatic ring ν(C-C) vibration mode of 4-MBA molecular, respectively [44]. Since the Raman intensity at 1076 cm−1 was higher than that of 1585 cm−1, it was used as the characterized Raman peak for the quantitative analysis. Furthermore, with different amounts of 4-MBA, the SERS intensities at 1076 cm−1 are shown in Figure 3b. Alone, with the increasing amount of 4-MBA, the Raman intensity was significantly increased and then decreased, and the highest SERS intensity appeared when the volume of 4-MBA was 90 µL. Moreover, after the modification of 4-MBA, the UV–VIS peak of the Au NPs slightly red-shifted to 538 nm (Figure 3d), indicating that 4-MBA was successfully anchored on the Au surface. Thus, this amount of 4-MBA was optimal for the preparation of stable Au4-MBA and was chosen for the next step.
For the preparation of Au4-MBA@Ag SERS nanotags, ascorbic was acted as a reductive agent mixed with Au4-MBA colloid. Thereafter, AgNO3 was added dropwise under magnetic stirring. As a result, the Ag (+) in the AgNO3 solution was reduced to Ag (0) and was selectively grown on the Au cores. Owing to the match of the crystalline lattice between Ag and Au, the core–shell Au4-MBA@Ag SERS nanotags were formed [45]. As the thickness of Ag shell had a significant effect on SERS signal intensity, therefore the amount of AgNO3 was investigated. Figure 3c shows the SERS intensity at 1076 cm−1 of Au4-MBA@Ag with different amounts of AgNO3. It can be seen that Au4-MBA@Ag exhibited a higher SERS signal intensity than pure Au4-MBA. When the amount of AgNO3 (2.5 mM) increased to 0.9 mL, the highest Raman intensity of Au4-MBA@Ag was obtained. Thus, 0.9 mL of AgNO3 was chosen as the optimum volume for the preparation of Au4-MBA@Ag SERS nanotags. Moreover, as shown in Figure 3d, the main UV–VIS peak shifted from 538 nm to 515 nm after the coating of the Ag shell. Meanwhile, an Ag shoulder appeared at 400 nm, confirming the formation of Au4-MBA@Ag NPs. The picture of the Au4-MBA@Ag colloid is shown in the Figure 2b inset. Compared with the Au colloid displayed in the Figure 2a inset, an obvious orange yellow color appeared in the Au4-MBA@Ag colloid, indicating that Ag was successfully grown on the surface of Au4-MBA nanoparticles. The TEM image of Au4-MBA@Ag NPs is shown in Figure 2b. It was clear that the NPs had a uniform particle size and good mono-dispersity. Meanwhile, the size distribution shown in Figure 2d reveals that the diameter of Au4-MBA@Ag was in the range of 58 ± 3 nm. Compared to the TEM image and size distribution of Au NPs in Figure 2a,c, it could be deduced that the average Ag shell thickness of the Au4-MBA@Ag core shell NPs was about 3 nm.

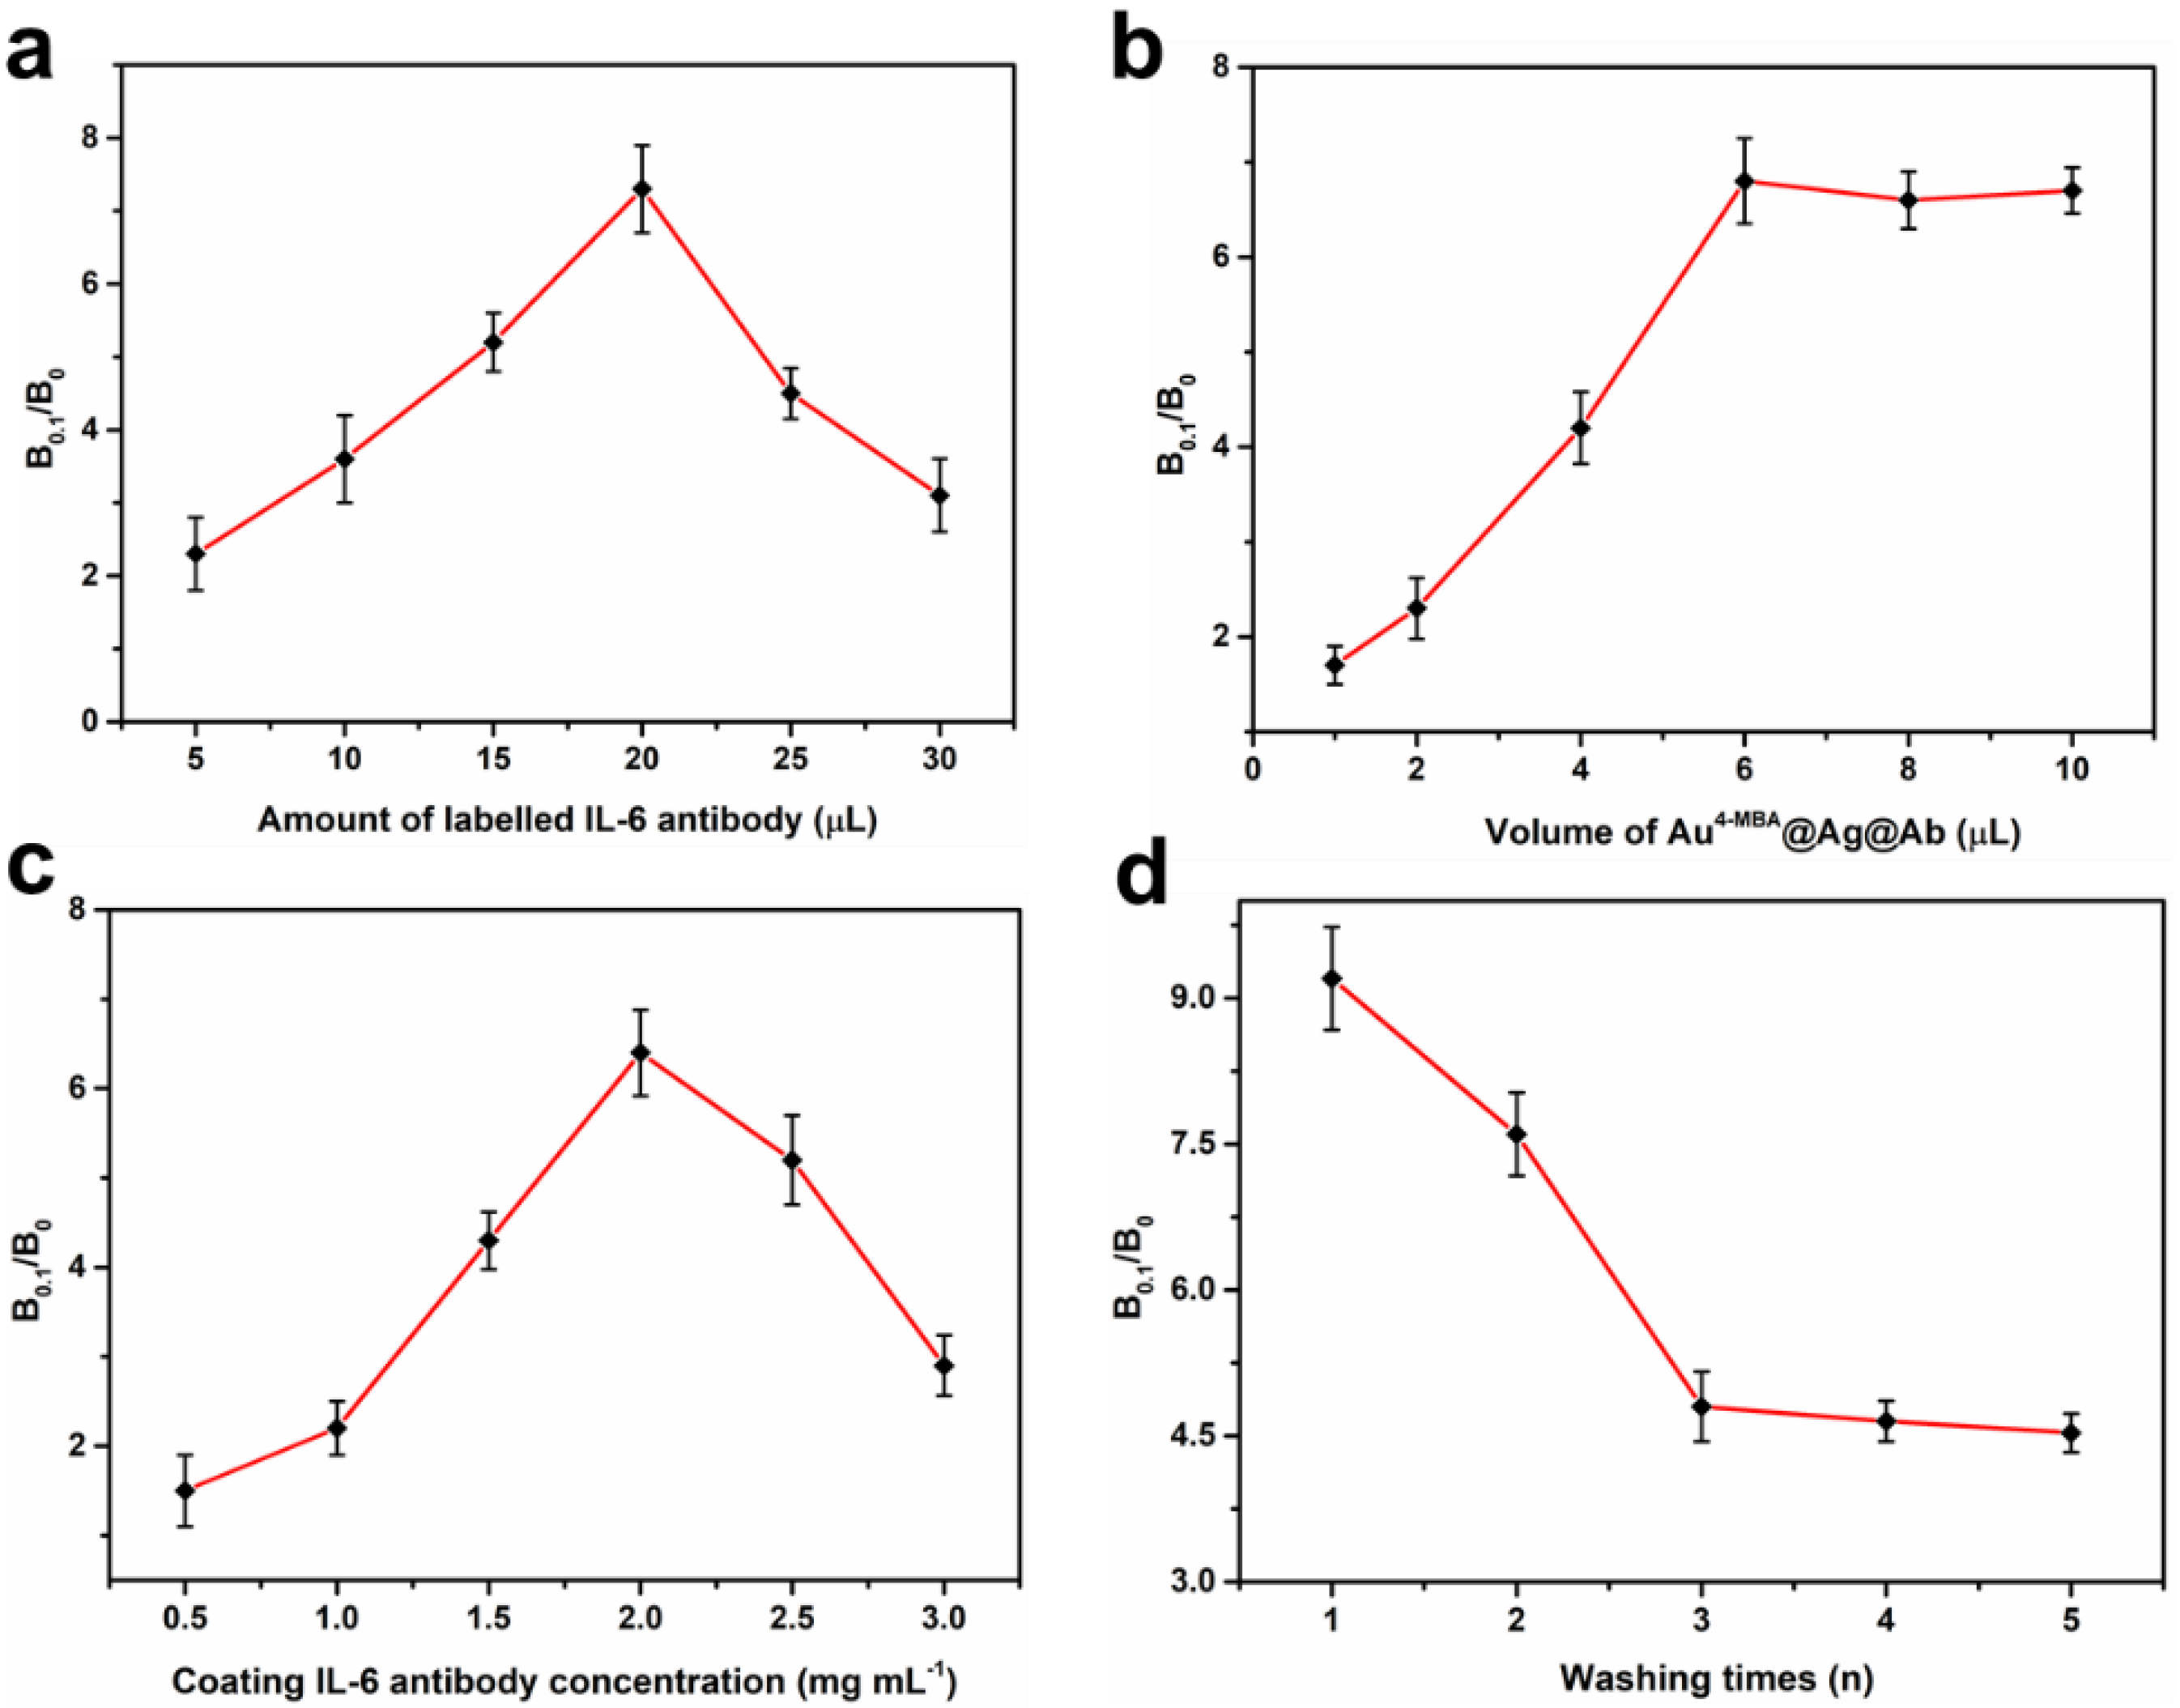
3.2. Optimization of the Assay Conditions

In this SERS IFA, it is well known that the amount of coating antibodies, the amount of antibodies used for preparing of Au4-MBA@Ag@Ab, the volume of labelled SERS nanotags, and the washing times were crucial for improving the detection sensitivity. To evaluate the optimized condition, B0.1/B0 was introduced to decrease the interface of background and was used as an assessing criterion. B0.1 and B0 were the Raman intensities at 1076 cm−1, with concentrations of IL-6 of 0.1 and 0 ng mL−1, respectively. The bigger the B0.1/B0 value, the higher the sensitivity of the assay [46]. To choose the optimum concentration of the labelled IL-6 antibody, different amounts of labelled antibodies (from 5 to 30 μL) with a concentration of 1 mg mL−1 were successively added to 5.0 mL of Au4-MBA@Ag NPs. Then, the B0.1/B0 value was investigated (Figure 4a). It was observed that with the increase in antibodies, the B0.1/B0 value increased and peaked at 20 μL, and then decreased with further additions. The reason for this could be that the redundant free antibodies in the solution may reduce the amount of Au4-MBA@Ag@Ab bound on the NC membrane, leading to declining B0.1/B0 values. Therefore, the optimal amount of antibody for preparing Au4-MBA@Ag@Ab was 20 μL. Similarly, when different volumes (from 2 to 10 μL) of Au4-MBA@Ag@Ab NPs were used to mix with IL-6, and 3 μL of coating IL-6 antibody with concentrations from 0.5 to 3 mg mL−1 were coated on the test dot. As shown in Figure 4b,c, 6 μL of Au4-MBA@Ag@Ab and 2.0 mg mL−1 coating IL-6 antibody were considered as the optimal assay conditions. In addition, in order to further improve the sensitivity and reduce the nonspecific immunoreaction on the NC membrane, the washing times were also examined. As shown in Figure 4d, with the increase in washing times, the B0.1/B0 value sharply decreased and then remained stable after washing three times. Thus, washing three times occurred in the immunoassay. These optimized experimental conditions could lay the foundation for the quantitative analysis of IL-6 in the next experiment.

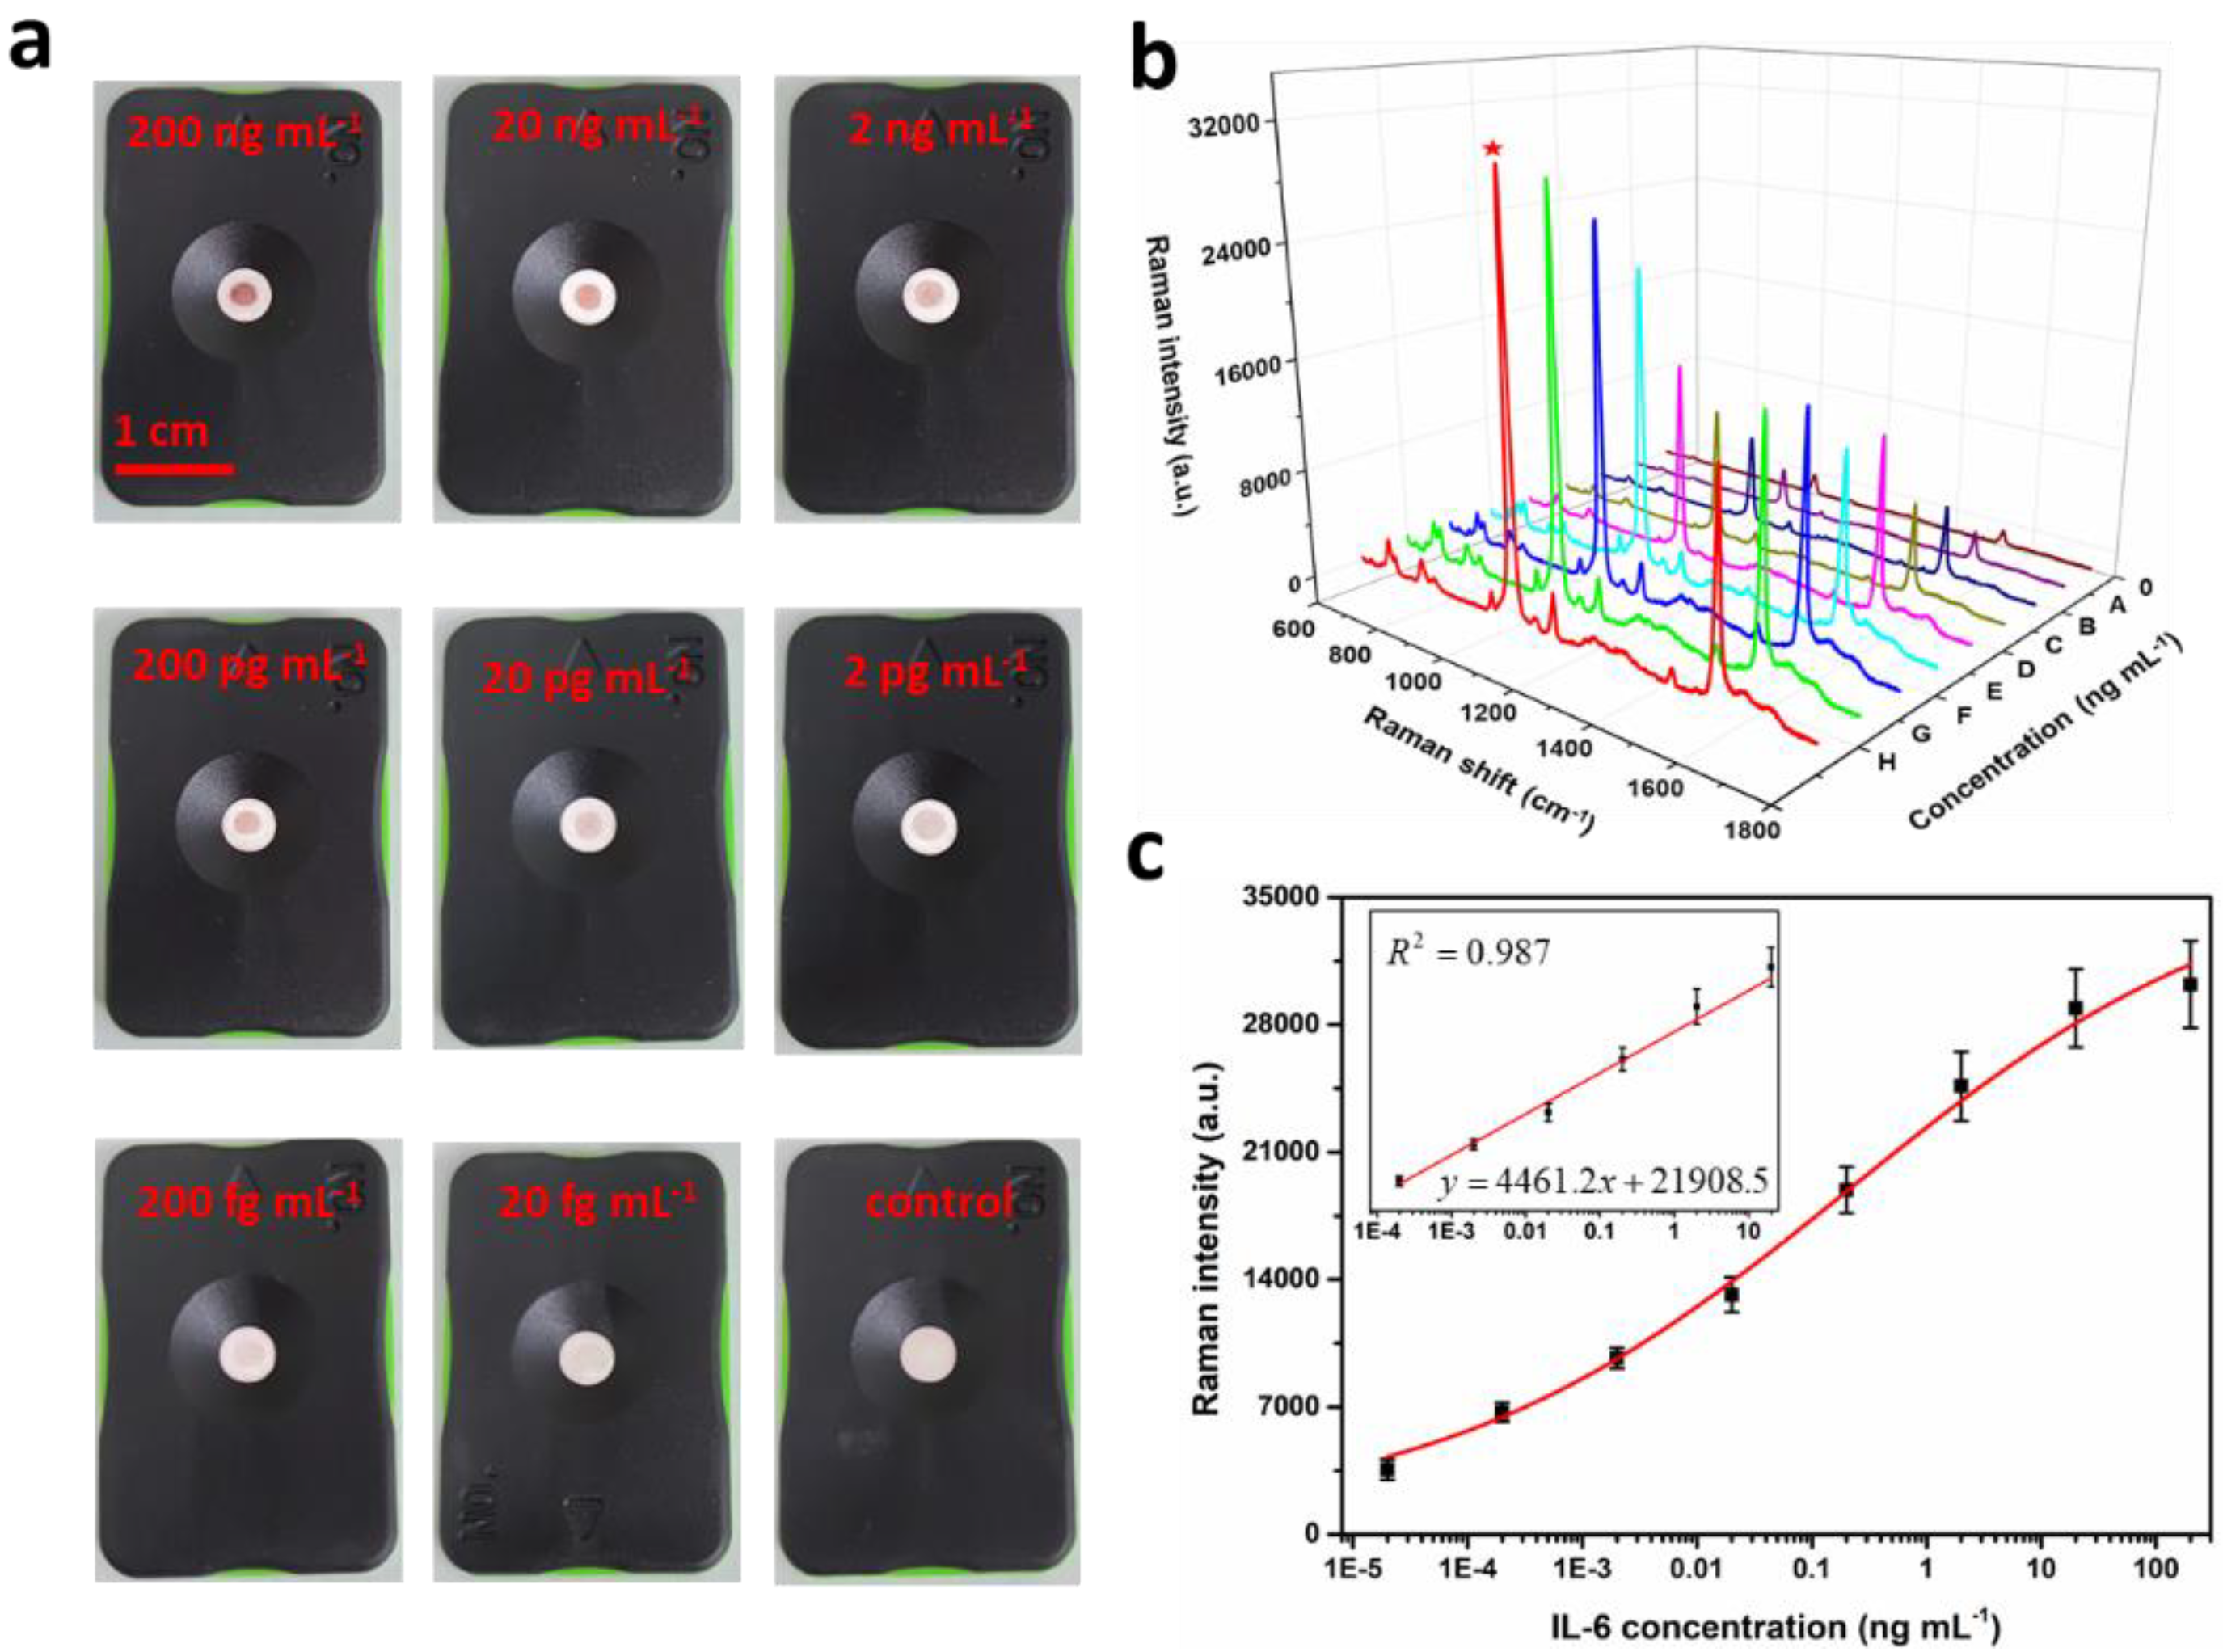
3.3. Quantitative SERS Measurements of IL-6

Under the optimized conditions, the feasibility of the SERS improved IFA was tested. First, analysis of IL-6 with concentrations of 100 and 0 ng mL−1 was performed. As expected, with the sample containing IL-6, the target could combine with SERS nanoprobes and was captured by the coating antibodies, and formed a sandwich immune complex. Meanwhile, with the accumulation of the immune complexes, there will be color change on the test dot to identify the existence of IL-6 (Figure S1, Supplementary Materials). As shown in the SEM image of Figure S1a, there were bright small dots on the fiber pores of the test NC membrane, and this observation confirmed the accumulation of the sandwich immune complexes. In contrast, with the absence of IL-6, there was no obvious bright spot on the SEM image, and no color change at the test spot and no obvious SERS signal could be detected (Figure S1b). These results showed that IL-6 could be quantitatively detected by this proposed biosensor. Then, the proposed SERS IFA platform was used for the quantitative analysis of IL-6 at concentrations of 0, 2 × 10⁻⁵, 2 × 10⁻⁴, 2 × 10⁻³, 2 × 10⁻², 0.2, 2.0, 20, and 200 ng mL−1. They were prepared by diluting the stock solution with the PBS solution. Briefly, 10 μL of the IL-6 antigen of each concentration was blended with Au4-MBA@Ag@Ab and then applied to the immune-kit and maintained for 5 min. In this process, it could be seen that the mixture gradually migrated downward through the NC membrane by the capillary force of the absorption pad, and a color dot appeared.
As shown in Figure 5a, with the decreased concentration of IL-6, the intensity of color of the test dot gradually weakened, and even disappeared when concentration less than 2.0 pg mL−1. Thus, the colorimetric assay worked only in the range of 200 ng mL−1–2 pg mL−1, and the results could only be semi-quantitative analyzed [47]. In order to obtain the highly sensitive and accurate detection of IL-6 for the judgement of mastitis in dairy cows, the SERS intensity of the test dot was measured using a Raman spectrometer. The average SERS spectra are shown in Figure 5b. The SERS intensity at 1076 cm−1 concomitantly increased with the increase in IL-6 concentrations. Based on this result, a standard curve in the form of the logarithmic concentration of IL-6 versus SERS peak intensity at 1076 cm−1 was established (Figure 5c). As shown in the Figure 5c inset, the linear dynamic range (LDR) spanned five orders of magnitude. The linear relationship between the SERS intensity at 1076 cm−1 and the logarithmic IL-6 concentration was y = 4461.2 x + 21 , 908.5 with R2 = 0.987. On the basis of three times the standard deviation of the blank sample, the limit of detection (LOD) of IL-6 was calculated as 0.074 pg mL−1, which was lower than those recently reported (Table S1, Supplementary Materials). This value was also much lower than the threshold of the clinical mastitis of dairy cows, demonstrating the ultra-high sensitivity of the proposed SERS IFA for IL-6 detection.

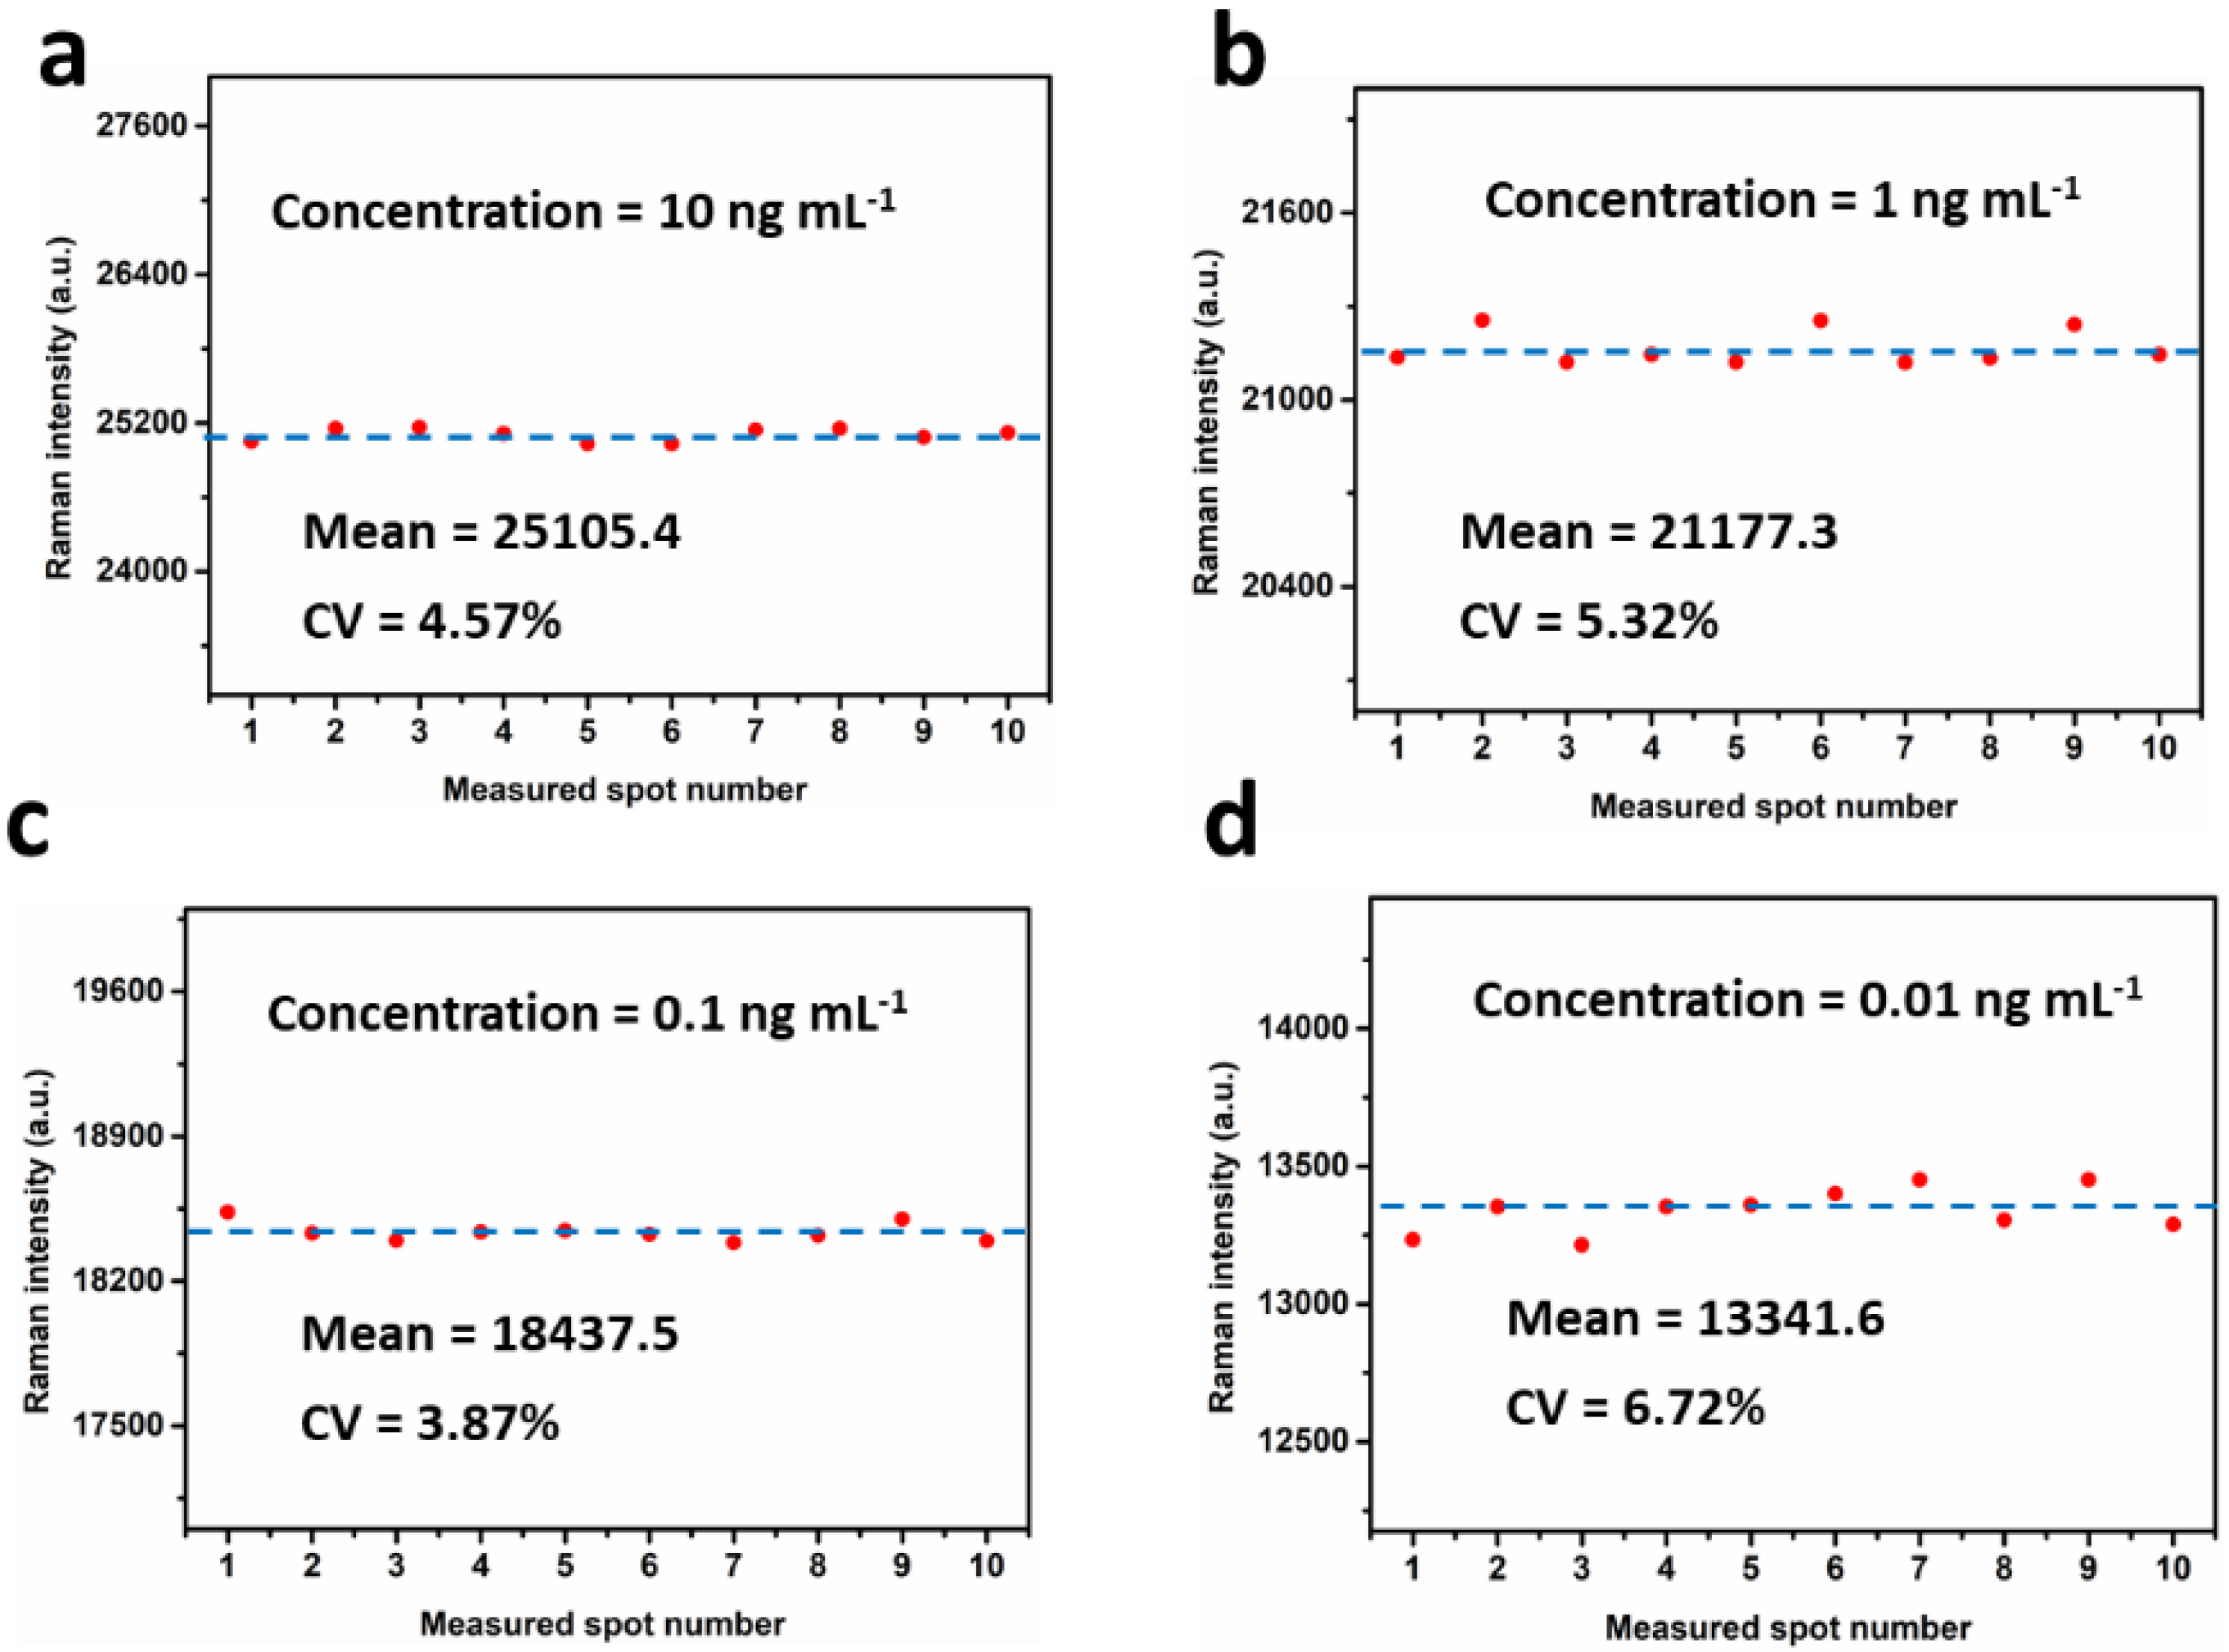
3.4. Reproducibility of the SERS IFA

In order to investigate the reproducibility of SERS IFA, the Raman intensity at 1076 cm−1 of ten different points in the center region of the test dot were examined with the concentrations of IL-6 solution at 10, 1.0, 0.1, and 0.01 ng mL−1, respectively. As shown in Figure 6, for each concentration, the relative standard deviation (RSD) value of the SERS intensity acquired from those ten different points were 4.57%, 5.32%, 3.87%, and 6.72%, respectively, indicating a high reproducibility and precision of the proposed SERS method.

3.5. Specificity of the SERS IFA

Generally, the cross-reaction usually affected the test results, and was crucial for the assessment of the specificity and selectivity of the immunoassay. To investigate the cross-reaction of this SERS IFA biosensor, SERS detection of other cytokines or inflammatory biomarkers including IL-8, IL-10, CRP, and SAA were performed. All of the compounds including IL-6 were prepared with a concentration of 100 pg mL−1, and were applied in SERS IFA procedures. Typical SERS spectra and Raman intensities recorded in response to these compounds are shown in Figure 7a,b. Compared with the signal of IL-6, the signal of the other compounds was neglectable, indicating there was no cross interference between IL-6 and the other compounds. These results could be attributed to two major reasons. The first one was that the utilized monoclonal capture and labelled antibodies had a high specificity with IL-6. The other one was that this platform features easy washing, noninterfering nature of the components, and high sensitivity. Therefore, this proposed bioassay system shows great potential for cow mastitis diagnosis.

3.6. Detection of IL-6 in Spiked Milk Sample

After pretreatment, the milk sample was used to estimate the accuracy and practicality of the SERS IFA. Firstly, Western blot analysis was performed to confirm that there was no IL-6 protein marker in the milk sample (Figure 8a). Subsequently, different concentrations of IL-6 were added to bovine whey to obtain a mixture with concentrations from 1 pg mL−1 to 1 µg mL−1. Quantitative analysis of IL-6 was carried out by measuring the SERS signal intensity of the test dot. As shown in Figure 8b, the Raman intensity increased with the increase in IL-6 concentrations. Based on the Raman signal intensity of 4-MBA, a linear calibration plot was constructed for the quantitative evaluation of IL-6 (Figure 8c). There was a significantly linear relationship between the intensity of the Raman signal and the logarithm of the IL-6 concentration (Figure 8c). The regression equation was y = 3688.8 x + 10 , 380.9 with R2 = 0.991, and the minimum detection limit was 0.35 pg mL−1, which indicated that the proposed biosensor had a high detection accuracy for IL-6 in milk. At the same time, different concentrations of IL-6, ranging from 0.18 to 504.1 ng mL−1, were added to the milk sample, and were determined with the electrochemiluminescence assay (ECLIA) kit and the proposed method (Table S2, Supplementary Materials), respectively. The comparison of the two methods is shown in Figure 8d. The correlation coefficient between the methods was close to 1.0. Moreover, the average recovery of IL-6 calculated from the spiked milk sample was 87.0% to 102.7%, with RSD values ranged from 2.5% to 8.7% (Table S2, Supplementary Materials). These results suggest that the high accuracy of the SERS IFA was in good consistency with ECLIA. In addition, the sample consumption was less and the operation procedure was more convenient in comparison with ECLIA. These advantages strongly illustrated that the proposed method could provide a potential practical application in the early diagnosis of mastitis for dairy cows.

4. Conclusions

In this study, a novel SERS-based IFA using the Au4-MBA@Ag conjugated antibody for the quantitative and sensitive detection of IL-6 in milk was developed. Raman peak intensity centered at 1074 cm−1 was monitored and its variation was used to evaluate the content of IL-6. Under optimal conditions, a logistic relationship between the Raman intensity, and the logged IL-6 concentration was obtained in the range from 2 × 10⁻⁵ to 200 pg mL−1. The LODs calculated from three standard deviations were 0.074 and 0.35 pg mL−1 for IL-6 in the PBS and milk samples, respectively. Meanwhile, the determination of IL-6 was also performed by ECLIA and SERS IFA in the spiked milk sample. The recovery of the spiking experiment was 87.0–102.7%, with coefficients of variation that ranged from 2.5% to 8.7%, demonstrating the high accuracy of the proposed method. Additionally, compared with the ECLIA method, SERS IFA had the advantages of simple operation, time saving, and good reproducibility. This proposed method also has the advantages of being low cost and having a high precision compared with traditional dairy cow mastitis detection laws, such as microbiological diagnosis, somatic cell count, and nuclear drug sensitivity tests. Encouragingly, SERS IFA equipped with a portable Raman spectrometer developed in the current study could potentially provide a practical and effective method for early milk IL-6 detection in cow mastitis diagnosis.

Supplementary Materials

The following supplementary materials can be downloaded at: www.mdpi.com/article/10.3390/nano12071091/s1. Figure S1: Feasibility test of the SERS improved IFA. The test with (a) and without IL-6 (b), and the typical pictures of their corresponding SEM images and SERS spectra of the test dots, respectively. Table S1: Comparison of different detection methods for inflammatory biomarker IL-6 [17,48,49,50,51]. Table S2: The detection and recovery test of the spiked IL-6 in the milk sample.

Author Contributions

Conceptualization, R.C. and H.W.; methodology, Y.Z.; software, X.N.; validation, W.W., X.N. and Y.Z.; formal analysis, investigation, C.D.; resources, Q.L.; data curation, F.Z.; writing—original draft preparation, R.C.; writing—review and editing, Y.Z.; visualization, L.Y.; supervision, B.X.; project administration, B.X.; funding acquisition, B.X. All authors have read and agreed to the published version of the manuscript.

Funding

This research was financially supported by the State Key Laboratory of Animal Nutrition (2004DA125184G2104), the National Key R&D Program of China (grant no. 2021YFD2000804), and the Central Public-interest Scientific Institution Basal Research Fund (no. 2022-YWF-ZYSQ-06).

Institutional Review Board Statement

Not applicable.

Informed Consent Statement

Not applicable.

Data Availability Statement

Not applicable.

Conflicts of Interest

The authors declare no conflict of interest.

References

  1. Morin, D.E.; Petersen, G.C.; Whitmore, H.L.; Hungerford, L.L.; Hinton, R.A. Economic analysis of a mastitis monitoring and control program in four dairy herds. J. Am. Vet. Med. Assoc. 1993, 202, 540–548. [Google Scholar] [PubMed]
  2. Santos, J.; Cerri, R.; Ballou, M.; Higginbotham, G.; Kirk, J. Effect of timing of first clinical mastitis occurrence on lactational and reproductive performance of Holstein dairy cows. Anim. Reprod. Sci. 2004, 80, 31–45. [Google Scholar] [CrossRef]
  3. Maity, S.; Das, D.; Ambatipudi, K. Quantitative alterations in bovine milk proteome from healthy, subclinical and clinical mastitis during S. aureus infection. J. Proteom. 2020, 223, 103815. [Google Scholar] [CrossRef] [PubMed]
  4. Viguier, C.; Arora, S.; Gilmartin, N.; Welbeck, K.; O’Kennedy, R. Mastitis detection: Current trends and future perspectives. Trends Biotechnol. 2009, 27, 486–493. [Google Scholar] [CrossRef]
  5. Day, J.; Legrand, E. Synergy of local, regional, and systemic non-specific stressors for host defense against pathogens. J. Theor. Biol. 2015, 367, 39–48. [Google Scholar] [CrossRef]
  6. Cravero, D.; Martignani, E.; Miretti, S.; Macchi, E.; Accornero, P.; Baratta, M. Bovine mammary epithelial cells retain stem-like phenotype in long-term cultures. Res. Vet. Sci. 2014, 97, 367–375. [Google Scholar]
  7. Shakeeb, N.; Varkey, P.; Ajit, A. Human Saliva as a Diagnostic Specimen for Early Detection of Inflammatory Biomarkers by Real-Time RT-PCR. Inflammation 2021, 44, 1713–1723. [Google Scholar] [CrossRef]
  8. Sadek, K.; Saleh, E.; Ayoub, M. Selective, reliable blood and milk bio-markers for diagnosing clinical and subclinical bovine mastitis. Trop. Anim. Health Prod. 2016, 49, 431–437. [Google Scholar] [CrossRef]
  9. Shuster, D.E.; Kehrli, M.; Stevens, M.G. Cytokine production during endotoxin-induced mastitis in lactating dairy cows. Am. J. Vet. Res. 1993, 54, 80–85. [Google Scholar]
  10. Mukherjee, J.; Varshney, N.; Chaudhury, M.; Mohanty, A.; Dang, A. Immune response of the mammary gland during different stages of lactation cycle in high versus low yielding Karan Fries crossbred cows. Livest. Sci. 2013, 154, 215–223. [Google Scholar] [CrossRef]
  11. Bochniarz, M.; Zdzisińska, B.; Wawron, W.; Szczubiał, M.; Dabrowski, R. Milk and serum IL-4, IL-6, IL-10, and amyloid A concentrations in cows with subclinical mastitis caused by coagulase-negative staphylococci. J. Dairy Sci. 2017, 100, 9674–9680. [Google Scholar] [CrossRef] [PubMed] [Green Version]
  12. Zhu, Y.; Fossum, C.; Berg, M.; Magnusson, U. Morphometric analysis of proinflammatory cytokines in mammary glands of sows suggests an association between clinical mastitis and local production of IL-1beta, IL-6 and TNF-alpha. Vet. Res. 2007, 38, 871–882. [Google Scholar] [CrossRef] [PubMed] [Green Version]
  13. Rezamand, P.; McGuire, M. Short communication: Effects of trans fatty acids on markers of inflammation in bovine mammary epithelial cells. J. Dairy Sci. 2011, 94, 316–320. [Google Scholar] [CrossRef] [PubMed] [Green Version]
  14. Dernfalk, J.; Persson Waller, K.; Johannisson, A. The xMAP technique can be used for detection of the inflammatory cytokines IL-1beta, IL-6 and TNF-alpha in bovine samples. Vet. Immunol. Immunopathol. 2007, 118, 40–49. [Google Scholar] [CrossRef] [PubMed]
  15. Wu, Y.; Liu, F.F.; Xu, Y.; Wang, J.J.; Samadli, S.; Wu, Y.F.; Liu, H.H.; Chen, W.X.; Luo, H.H.; Zhang, D.D.; et al. Interleukin-6 is prone to be a candidate biomarker for predicting incomplete and IVIG nonresponsive Kawasaki disease rather than coronary artery aneurysm. Clin. Exper. Med. 2019, 19, 173–181. [Google Scholar] [CrossRef] [PubMed]
  16. Fu, Q.; Schoenhoff, F.S.; Savage, W.J.; Zhang, P.; Van Eyk, J.E. Multiplex assays for biomarker research and clinical applica-tion: Translational science coming of age. Proteom. Clin. Appl. 2010, 4, 271–284. [Google Scholar] [CrossRef] [PubMed]
  17. Luo, L.; Zhang, Z.; Hou, L.; Wang, J.; Tian, W. The study of a chemiluminescence immunoassay using the peroxyoxalate chemiluminescent reaction and its application. Talanta 2007, 72, 1293–1297. [Google Scholar] [CrossRef]
  18. Cho, A.-R.; Lee, J.-H.; Lee, H.S.; Lee, Y.-J. Leukocyte count, C-reactive protein level and incidence risk of type 2 diabetes among non-smoking adults: A longitudinal finding over 12 years from the Korean Genome and Epidemiology Study. Prim. Care Diabetes 2021, 15, 385–390. [Google Scholar] [CrossRef]
  19. Kokkinos, C.; Economou, A.; Prodromidis, M.I. Electrochemical immunosensors: Critical survey of different architectures and transduction strategies. TrAC Trends Anal. Chem. 2016, 79, 88–105. [Google Scholar] [CrossRef]
  20. Oh, Y.K.; Joung, H.-A.; Kim, S.; Kim, M.-G. Vertical flow immunoassay (VFA) biosensor for a rapid one-step immunoassay. Lab Chip 2013, 13, 768–772. [Google Scholar] [CrossRef]
  21. Chinnasamy, T.; Segerink, L.I.; Nystrand, M.; Gantelius, J.; Andersson Svahn, H. Point-of-care vertical flow allergen microar-ray assay: Proof of concept. Clin. Chem. 2014, 60, 1209–1216. [Google Scholar] [CrossRef] [PubMed] [Green Version]
  22. Rivas, L.; Reuterswärd, P.; Rasti, R.; Herrmann, B.; Mårtensson, A.; Alfvén, T.; Gantelius, J.; Andersson-Svahn, H. A vertical flow paper-microarray assay with isothermal DNA amplification for detection of Neisseria meningitidis. Talanta 2018, 183, 192–200. [Google Scholar] [CrossRef] [PubMed]
  23. Kneipp, J.; Kneipp, H.; Kneipp, K. SERS—A single-molecule and nanoscale tool for bioanalytics. Chem. Soc. Rev. 2008, 37, 1052–1060. [Google Scholar] [CrossRef] [PubMed]
  24. Shin, J.H.; Park, J.K. Functional packaging of lateral flow strip allows simple delivery of multiple reagents for multistep assays. Anal. Chem. 2016, 88, 10374–10378. [Google Scholar] [CrossRef]
  25. Cheng, Z.; Choi, N.; Wang, R.; Lee, S.; Moon, K.C.; Yoon, S.-Y.; Chen, L.; Choo, J. Simultaneous Detection of Dual Prostate Specific Antigens Using Surface-Enhanced Raman Scattering-Based Immunoassay for Accurate Diagnosis of Prostate Cancer. ACS Nano 2017, 11, 4926–4933. [Google Scholar] [CrossRef]
  26. Kamińska, A.; Winkler, K.; Kowalska, A.; Witkowska, E.; Szymborski, T.; Janeczek, A.; Waluk, J. SERS-based Immunoassay in a Microfluidic System for the Multiplexed Recognition of Interleukins from Blood Plasma: Towards Picogram Detection. Sci. Rep. 2017, 7, 10656. [Google Scholar] [CrossRef]
  27. Wang, H.; Zhou, Y.; Jiang, X.; Sun, B.; Zhu, Y.; Wang, H.; Su, Y.; He, Y. Simultaneous Capture, Detection, and Inactivation of Bacteria as Enabled by a Surface-Enhanced Raman Scattering Multifunctional Chip. Angew. Chem. Int. Ed. 2015, 54, 5132–5136. [Google Scholar] [CrossRef]
  28. Zhou, W.; Tian, Y.F.; Yin, B.C.; Ye, B.C. Simultaneous surface-enhanced Raman spectroscopy detection of multiplexed Mi-croRNA biomarkers. Anal. Chem. 2017, 89, 6120–6128. [Google Scholar] [CrossRef]
  29. Choi, H.-K.; Park, W.-H.; Park, C.-G.; Shin, H.-H.; Lee, K.S.; Kim, Z.H. Metal-Catalyzed Chemical Reaction of Single Molecules Directly Probed by Vibrational Spectroscopy. J. Am. Chem. Soc. 2016, 138, 4673–4684. [Google Scholar] [CrossRef]
  30. Xi, W.; Haes, A.J. Elucidation of HEPES Affinity to and Structure on Gold Nanostars. J. Am. Chem. Soc. 2019, 141, 4034–4042. [Google Scholar] [CrossRef]
  31. Pallaoro, A.; Mirsafavi, R.Y.; Culp, W.T.; Braun, G.B.; Meinhart, C.D.; Moskovits, M. Screening for canine transitional cell carcinoma (TCC) by SERS-based quantitative urine cytology. Nanomed. Nanotechnol. Biol. Med. 2018, 14, 1279–1287. [Google Scholar] [CrossRef] [PubMed]
  32. Zong, C.; Xu, M.; Xu, L.-J.; Wei, T.; Ma, X.; Zheng, X.-S.; Hu, R.; Ren, B. Surface-Enhanced Raman Spectroscopy for Bioanalysis: Reliability and Challenges. Chem. Rev. 2018, 118, 4946–4980. [Google Scholar] [CrossRef] [PubMed]
  33. Chen, R.P.; Du, X.; Cui, Y.J.; Zhang, X.Y.; Ge, Q.Y.; Dong, J.; Zhao, X.W. Vertical flow assay for inflammatory biomarkers based on nanofluidic channel array and SERS nanotags. Small 2020, 16, 2002801. [Google Scholar] [CrossRef] [PubMed]
  34. Chen, R.; Liu, B.; Ni, H.; Chang, N.; Luan, C.; Ge, Q.; Dong, J.; Zhao, X. Vertical flow assays based on core–shell SERS nanotags for multiplex prostate cancer biomarker detection. Analyst 2019, 144, 4051–4059. [Google Scholar] [CrossRef] [PubMed]
  35. Karimi, S.; Moshaii, A.; Nikkhah, M. Controlled synthesis of colloidal monodisperse gold nanoparticles in a wide range of sizes; investigating the effect of reducing agent. Mater. Res. Express 2019, 6, 1150f2. [Google Scholar] [CrossRef]
  36. Liu, H.; Chen, C.; Zhang, C.; Du, X.; Li, P.; Wang, S. Functionalized Au MBA @Ag Nanoparticles as an Optical and SERS Dual Probe in a Lateral Flow Strip for the Quantitative Detection of Escherichia coli O157:H7. J. Food Sci. 2019, 84, 2916–2924. [Google Scholar] [CrossRef]
  37. Lin, L.-K.; Stanciu, L.A. Bisphenol A detection using gold nanostars in a SERS improved lateral flow immunochromatograph-ic assay. Sens. Actuator B Chem. 2018, 276, 222–229. [Google Scholar] [CrossRef]
  38. Xiong, Z.; Chen, X.; Liou, P.; Lin, M. Development of nanofibrillated cellulose coated with gold nanoparticles for measurement of melamine by SERS. Cellulose 2017, 24, 2801–2811. [Google Scholar] [CrossRef]
  39. Zhou, J.; Nie, W.; Chen, Y.; Yang, C.; Gong, L.; Zhang, C.; Chen, Q.; He, L.; Feng, X. Quadruplex gold immunochromatogaraphic assay for four families of antibiotic residues in milk. Food Chem. 2018, 256, 304–310. [Google Scholar] [CrossRef]
  40. Han, M.; Gong, L.; Wang, J.; Zhang, X.; Jin, Y.; Zhao, R.; Yang, C.; He, L.; Feng, X.; Chen, Y. An octuplex lateral flow immu-noassay for rapid detection of antibiotic residues, aflatoxin M1 and melamine in milk. Sens. Actuator B Chem. 2019, 292, 94–104. [Google Scholar] [CrossRef]
  41. Doyen, M.; Bartik, K.; Bruylants, G. UV-Vis and NMR study of the formation of gold nanoparticles by citrate reduction: Ob-servation of gold-citrate aggregates. J. Colloid Interface Sci. 2013, 399, 1–5. [Google Scholar] [CrossRef] [PubMed]
  42. Zhu, J.; Ren, Y.-J.; Zhao, S.-M.; Zhao, J.-W. The effect of inserted gold nanosphere on the local field enhancement of gold nanoshell. Mater. Chem. Phys. 2012, 133, 1060–1065. [Google Scholar] [CrossRef]
  43. Zhou, L.; Liu, Y.; Wang, F.; Jia, Z.; Zhou, J.; Jiang, T.; Petti, L.; Chen, Y.; Xiong, Q.; Wang, X. Classification analyses for prostate cancer, benign prostate hyperplasia and healthy subjects by SERS-based immunoassay of multiple tumour markers. Talanta 2018, 188, 238–244. [Google Scholar] [CrossRef] [PubMed]
  44. Liu, B.; Han, G.; Zhang, Z.; Liu, R.; Jiang, C.; Wang, S.; Han, M.-Y. Shell Thickness-Dependent Raman Enhancement for Rapid Identification and Detection of Pesticide Residues at Fruit Peels. Anal. Chem. 2012, 84, 255–261. [Google Scholar] [CrossRef]
  45. Shi, Q.; Huang, J.; Sun, Y.; Yin, M.; Hu, M.; Hu, X.; Zhang, Z.; Zhang, G. Utilization of a lateral flow colloidal gold immuno-assay strip based on surface-enhanced Raman spectroscopy for ultrasensitive detection of antibiotics in milk. Spectrochim. Acta A Mol. Biomol. Spectrosc. 2018, 197, 107–113. [Google Scholar] [CrossRef]
  46. Deng, D.; Yang, H.; Liu, C.; Zhao, K.; Li, J.; Deng, A. Ultrasensitive detection of diclofenac in water samples by a novel sur-face-enhanced Raman scattering (SERS)-based immunochromatographic assay using AgMBA@SiO2-Ab as immunoprobe. Sens. Actuator B Chem. 2019, 283, 563–570. [Google Scholar] [CrossRef]
  47. Huang, W.; Guo, E.; Li, J.; Deng, A. Quantitative and ultrasensitive detection of brombuterol by a surface-enhanced Raman scattering (SERS)-based lateral flow immunochromatographic assay (FLIA) using AgMBA@Au–Ab as an immunoprobe. Analyst 2021, 146, 296–304. [Google Scholar] [CrossRef]
  48. Rathnayake, N.; Akerman, S.; Klinge, B.; Lundegren, N.; Jansson, H.; Sorsa, Y.T.; Gustafsson, A. Salivary biomarkers for detection of systemic diseases. PLoS ONE 2013, 8, e61356–e61361. [Google Scholar] [CrossRef] [Green Version]
  49. Tertis, M.; Leva, P.I.; Bogdan, D.; Suciu, M.; Graur, F.; Cristea, C. Impedimetric aptasensor for the label-free and selective detection of interleukin-6 for colorectal cancer screening. Biosens. Bioelectron. 2019, 137, 1293–1297. [Google Scholar] [CrossRef]
  50. Barman, S.C.; Sharifuzzaman, M.; Zahed, M.A.; Park, C.; Yoon, S.H.; Zhang, S.P.; Kim, H.; Yoon, H.; Park, J.Y. A highly selective and stable cationic polyelectrolyte encapsulated black phosphorene based impedimetric immunosensor for interleukin-6 detection. Biosens. Bioelectron. 2021, 186, 1873–4235. [Google Scholar]
  51. Wang, X.M.; Ma, L.; Hu, C.M.; Liu, T.W.; Sun, S.J.; Liu, X.H.; Guan, M. Simultaneous quantitative detection of IL-6 and PCT using SERS magnetic immunoassay with sandwich structure. Nanotechnology 2021, 32, 255702. [Google Scholar] [CrossRef] [PubMed]
Figure 1. Schematic illustration of (a) the synthesis of bio-functionalized core-shell SERS nanotag; (b) the detection of IL-6 by core-shell SERS nanotags combined with the IFA kit.
Nanomaterials 12 01091 g001
Figure 2. (ac) TEM image and size distribution of Au NPs; (bd) TEM image and size distribution of Au4-MBA@Ag. Insets of (a,b) are the photographs of their corresponding colloidal dispersion.
Nanomaterials 12 01091 g002
Figure 3. (a) Raman spectra and (b) Raman intensities at 1076 cm−1 of different amounts of 4-MBA; (c) Raman intensities at 1076 cm−1 of different amounts of AgNO3; (d) UV-VIS extinction spectra of Au, Au4-MBA, Au4-MBA@Ag, and Au4-MBA@Ag@Ab.
Nanomaterials 12 01091 g003
Figure 4. Optimization of the SERS IFA conditions: (a) optimization of the amount of labelled antibody in the preparation of Au4-MBA@Ag@Ab; (b) optimization of the amount of Au4-MBA@Ag@Ab solution; (c) optimization of coating IL-6 antibody concentration on the NC membrane; (d) optimization of different washing times.
Nanomaterials 12 01091 g004
Figure 5. (a) Image of the test dot (4 mm in diameter) for different concentrations of IL-6; (b) averaged Raman spectra of test dot for different concentrations of IL-6 (A-H corresponding to 20 fg mL〓1-200 ng mL−1); (c) the calibration curve of IL-6, and the inset shown the linear part. The error bars are calculated from three measurements.
Nanomaterials 12 01091 g005
Figure 6. The SERS intensity of Au4-MBA@Ag at 1076 cm−1 from ten different spots in the center part of the test spot with concentrations of (a) 10 ng mL−1, (b) 1.0 ng mL−1, (c) 0.1 ng mL−1, and (d) 0.01 ng mL−1, respectively.
Nanomaterials 12 01091 g006
Figure 7. Specificity of SERS IFA. (a) SERS spectra of Au4-MBA@Ag at 1076 cm−1, and (b) Raman intensity for IL-6, IL-8, IL-10, CRP, and SAA at a concentration of 100 pg mL−1.
Nanomaterials 12 01091 g007
Figure 8. (a) Western blot analysis of IL-6 protein spiked in the milk; (b) SERS spectra of different concentrations (0 ng mL–1-1 µg mL−1) of IL-6 spiked in the milk and (c) the linear calibration curve; (d) comparison of detection results obtained from proposed method (red circles) and reference ECLIA method (black squares). Error bars are calculated from three measurements.
Nanomaterials 12 01091 g008
Publisher’s Note: MDPI stays neutral with regard to jurisdictional claims in published maps and institutional affiliations.

