Article

Preventing Response Elimination Strategies Improves the Convergent Validity of Figural Matrices

1
Differentielle Psychologie und Psychologische Diagnostik, Universität des Saarlandes, Campus A1.3, 66123 Saarbrücken, Germany
2
Differentielle Psychologie und Psychologische Diagnostik, Universität Ulm, Albert-Einstein-Allee 47, 89081 Ulm, Germany
3
Hochbegabtenforschung, Universität Trier, 54286 Trier, Germany
*
Author to whom correspondence should be addressed.
Submission received: 30 September 2015 / Accepted: 1 February 2016 / Published: 6 February 2016

Abstract

:
Several studies have shown that figural matrices can be solved with one of two strategies: (1) Constructive matching consisting of cognitively generating an idealized response, which is then compared with the options provided by the response format; or (2) Response elimination consisting of comparing the response format with the item stem in order to eliminate incorrect responses. A recent study demonstrated that employing a response format that reduces response elimination strategies results in higher convergent validity concerning general intelligence. In this study, we used the construction task, which works entirely without distractors because the solution has to be generated in a computerized testing environment. Therefore, response elimination is completely prevented. Our results show that the convergent validity of general intelligence and working memory capacity when using a test employing the construction task is substantially higher than when using tests employing distractors that followed construction strategies used in other studies. Theoretical as well as practical implications of this finding are discussed.

1. Introduction

This study addresses the influence that the design of the response format for figural matrices has on the convergent validity of tests employing these items. To provide a nomenclature for the components of figural matrices, they are described in the first section of the introduction. As aspects of the respondents’ solution process are crucial for the convergent validity of matrices tests, current models are discussed in the second section. In the third section, we address response format designs. In the last section, we discuss hypotheses that address how the design of the response format should influence the convergent validity of matrices tests.

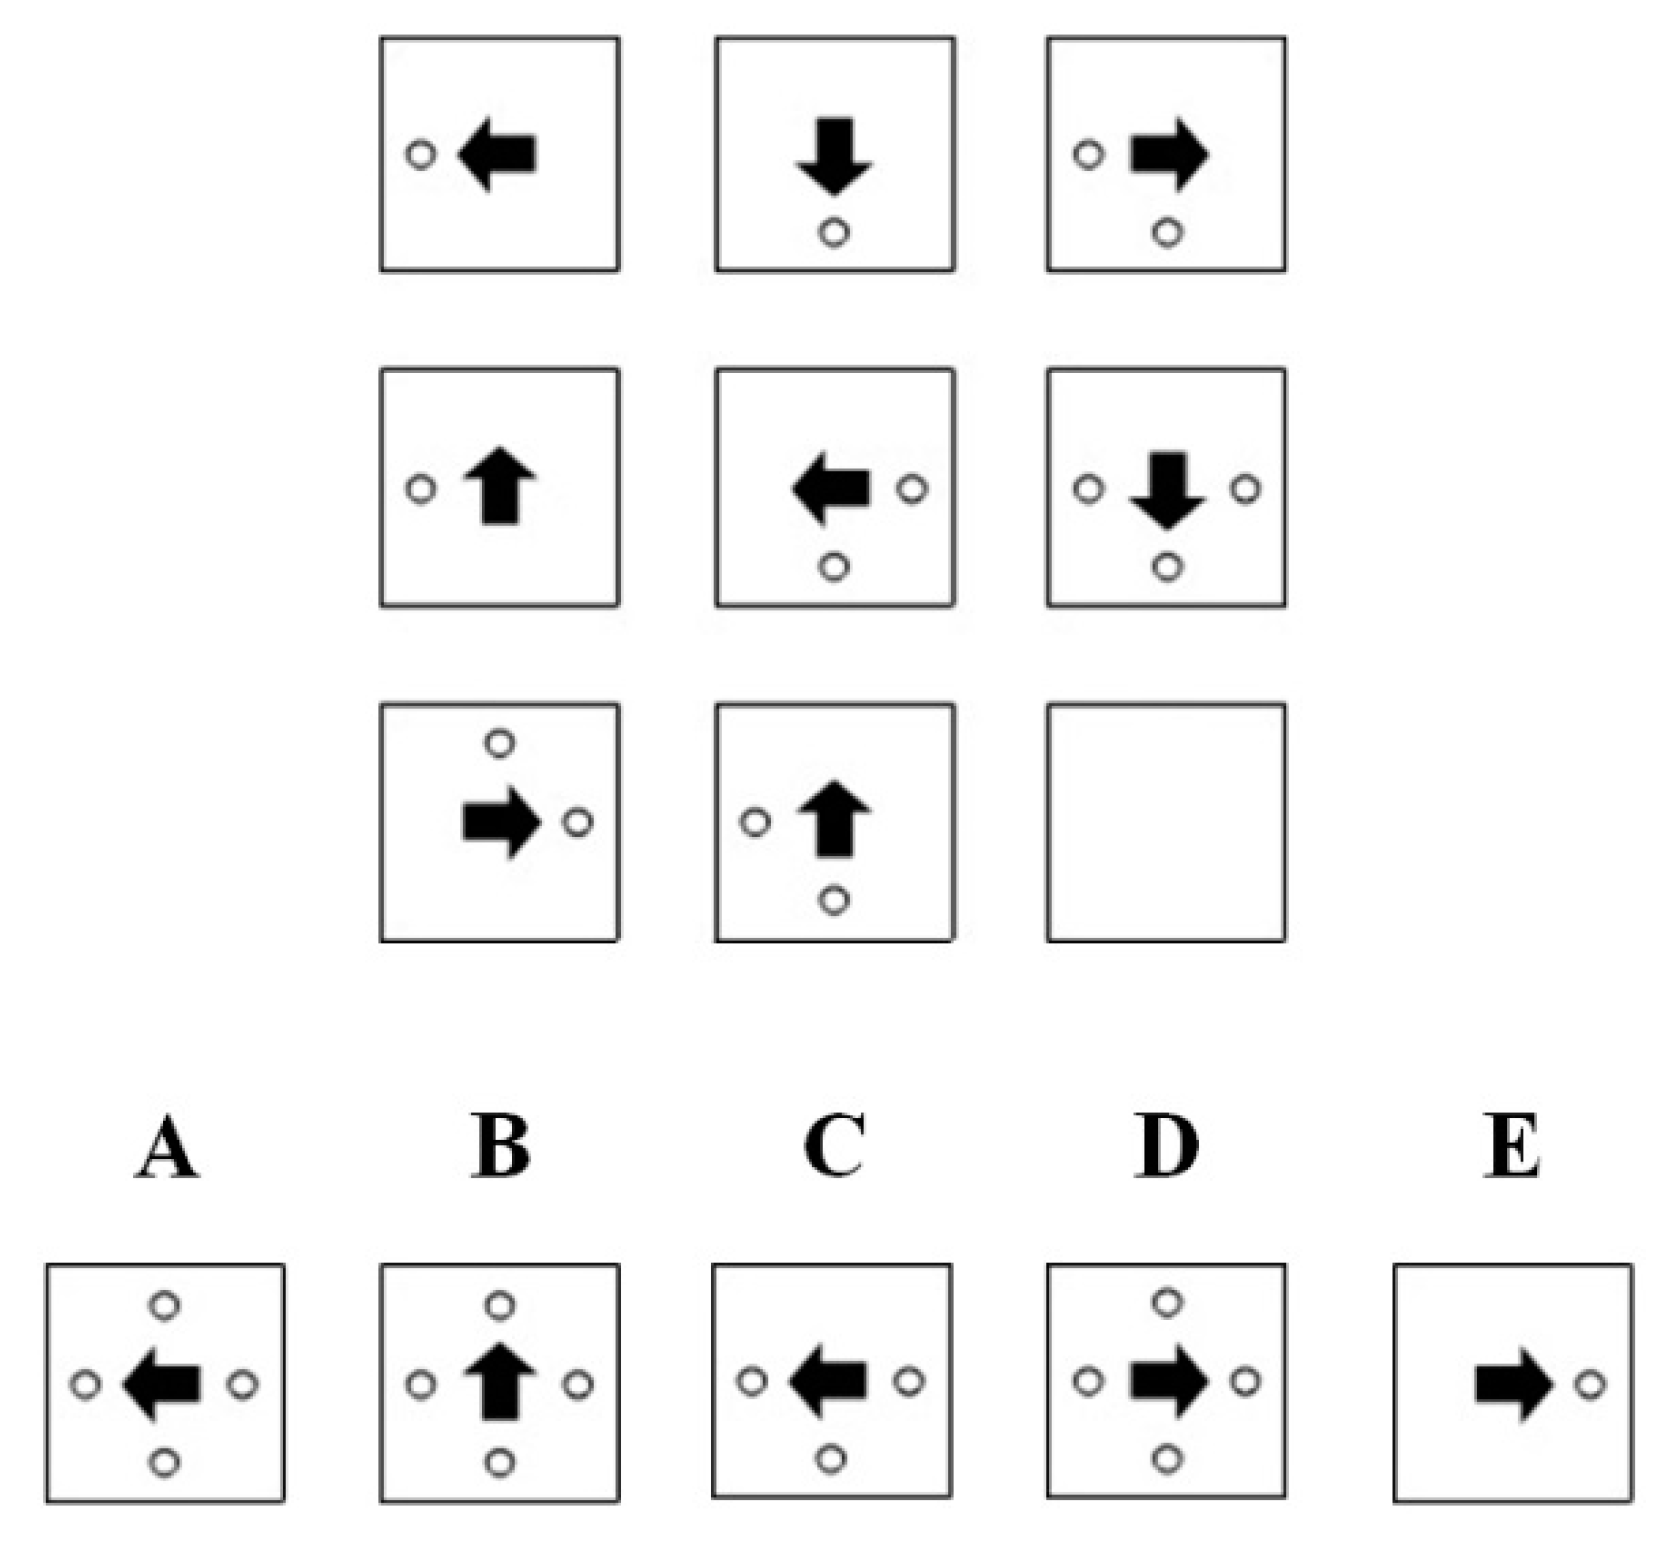
1.1. Components of Figural Matrices

Figure 1 shows an example of a classic figural matrix item. The item stem is found in the upper part of the figure. It consists of a 3 × 3 matrix of cells with geometrical symbols (i.e., figural elements). These elements follow certain design rules. In the example, the arrow is rotated by 90° in a counterclockwise direction across each row of the matrix. The circles follow an addition rule across the rows, i.e., the circles that appear in the first and second cells of a row are summed in the third cell. The last cell (solution cell) of the item stem is left empty.
Figure 1. Classic figural matrix item.
Jintelligence 04 00002 g001
In the lower part of Figure 1, the response format can be found. It consists of the correct solution (attractor), which logically completes the matrix according to the rules in the item stem. In Figure 1, the attractor is response option A. The other response options are called distractors and do not complete the item stem according to the rules employed in the item stem. The task of the respondent is to determine which of the response options represents the attractor.

1.2. Models of the Solution Process for Figural Matrices

The most influential model of the solution process was developed by Carpenter, Just, and Shell [1] by means of eye-tracking analyses, verbal reports, and computer simulations. The model considers three consecutive steps comprising the solution process: (1) Perceptual analysis: Perceptual elements of the item stem are encoded and checked for correspondence; (2) Conceptual analysis: The logical principles (i.e., rules) that affect corresponding elements are analyzed; (3) Generalization and response generation: The identified rules are applied to the entire matrix in order to generate the response. The response option that matches the generated response (best) is selected. Two aspects are regarded as crucial for respondents’ success in solving the items. General mental ability (g) enables respondents to infer the rules employed in the matrices. Working memory capacity enables the respondents to pursue goal monitoring, i.e., to keep track of the solution process.
Although Carpenter et al.’s [1] model provides a good description of the early steps of the solution process, other studies have questioned the last step and have suggested two different strategies that can be applied to select the response [2,3,4,5,6]: (1) Constructive matching is what is described in Carpenter et al.’s [1] model and can be regarded as a top-down strategy. Respondents actively try to construct the correct solution for the item by analyzing the rules and applying them to the entire matrix; (2) Response elimination poses an alternative strategy, which consists of comparing the response options with the item stem in order to eliminate as many distractors as possible and choosing one of the remaining ones. It can therefore be regarded as a bottom-up strategy.
Mitchum and Kelley’s [7] results indicate qualitative differences between respondents’ solution strategies, i.e., some respondents solve the items by applying constructive matching and some by response elimination. Mixed types were found to be rather unusual. It has been demonstrated that the respondents’ choice of solution strategies is influenced by individual differences in general mental ability and working memory capacity [2,3,4,5,6,7,8]. Respondents with low general mental ability and working memory capacity show a greater tendency to engage in response elimination, whereas respondents with high general mental ability and working memory capacity are more likely to engage in constructive matching. Therefore, response elimination is viewed as a fallback strategy that is used when the processing exceeds the respondents’ capacity limits [2,9].
A perspective that has currently not received much attention is that the differences in solution strategies can easily be linked to the ideas of cognitive load theory (e.g., [10,11,12]). Cognitive load is understood to result from the elements that have to be considered when solving a problem. Problems with many elements and a high degree of interactivity cause a high cognitive load. If there are only a few elements or little interactivity, there is less cognitive load. The amount of cognitive load that a respondent is able to process is determined by the respondent’s working memory capacity and general mental ability. Keeping this in mind, response elimination can be understood as a means for reducing cognitive load when solving figural matrices. Solving an item by applying constructive matching causes a higher cognitive load because all of the figural elements and all of the rules that interact with the figural elements have to be considered. When applying the response elimination strategy, not all of the elements and rules of the items have to be considered because a distractor can be excluded when one element has been identified as wrong. Therefore, respondents can be expected to switch their strategy when an item’s cognitive load overextends their working memory capacity or general mental ability.

1.3. Differences in Solution Strategy Outcomes

The results of studies analyzing verbal reports and eye-tracking data have clearly indicated behavioral differences between respondents who use different strategies [2,3,4,5,6,7]. Respondents employing constructive matching have been found to spend proportionally more time inspecting the item stem before taking into account the response options and tend to toggle less between the item stem and the response options. In comparison, those using the response elimination strategy have been found to spend proportionally more time focusing on the response options and tend to demonstrate a higher rate of toggling between the item stem and the distractors.
Conceptual analysis and goal monitoring, which are closely related to general mental ability and working memory capacity, are regarded as crucial elements of the solution process [1,13,14]. It has been hypothesized that these components are less relevant for response elimination than for constructive matching [8,9]. Therefore, differences in the solution strategies should lead to differences in the convergent validity of the results of respondents who use different solution strategies. Arendasy and Sommer [9] investigated this question by constructing distractors that either (a) allowed both solution strategies or (b) forced constructive matching and prevented response elimination. The results of their study showed that the correlation between the test score and general mental ability was lower for matrices tests that allowed both strategies than for matrices tests that forced constructive matching. Apparently, the convergent validity of matrices tests can be enhanced by preventing response elimination. Regarding solution strategies, this can be explained by the compensatory effect of the response elimination strategy. Respondents with lower general mental ability and working memory capacity employ response elimination when the items are too difficult and are more likely to respond correctly when they use this strategy. Therefore, their performance might resemble that of respondents with higher general mental ability and working memory capacity when response elimination is allowed.

1.4. Response Format Design

Arendasy and Sommer’s [9] results clearly showed that the design of the distractors employed in the response format can influence the respondents’ choice of solution strategy and therefore influence the convergent validity of matrices tests. In the following sections, we describe strategies that can be used to construct the distractors. Furthermore, we present the so-called construction task—a response format that works without distractors.

1.4.1. Response Formats that Use Distractors

Two strategies that can be used to construct distractors can be distinguished: conceptual and perceptual strategies. Conceptual strategies target the rules that are employed in the item stems and systematically violate them in the distractors. Thus, the logic that leads to the choice of this distractor is very similar to the choice of the correct solution although they might look different. Arendasy and Sommer [9] identified three distractor-construction strategies that we describe as conceptual: (1) Incomplete solution distractor: Rules that are realized in the item stem are omitted [4,15,16]; (2) Arbitrary line of reasoning distractor: One rule that pertains to the item stem is replaced by a different rule [1,2,3,5,15,16]; (3) Mishandled rule-direction distractor: A correct rule is applied in a different direction (e.g., symbols add up horizontally in the item stem but add up vertically in the distractor) [17]. Perceptual strategies are aimed at constructing distractors that look very similar to the correct response option. Arendasy and Sommer [9] referred to two construction strategies that fit into this category: (1) Overdetermined choice distractor: Many elements of the item are used [15,16]; (2) Repetition distractor: The cells in the item stem are simply replicated [15,16]. A strategy that has not received much attention was proposed by Guttmann and Schlesinger [18]. It consists third conceptual of producing all possible permutations of the perceptual elements (symbols) from the item stem.

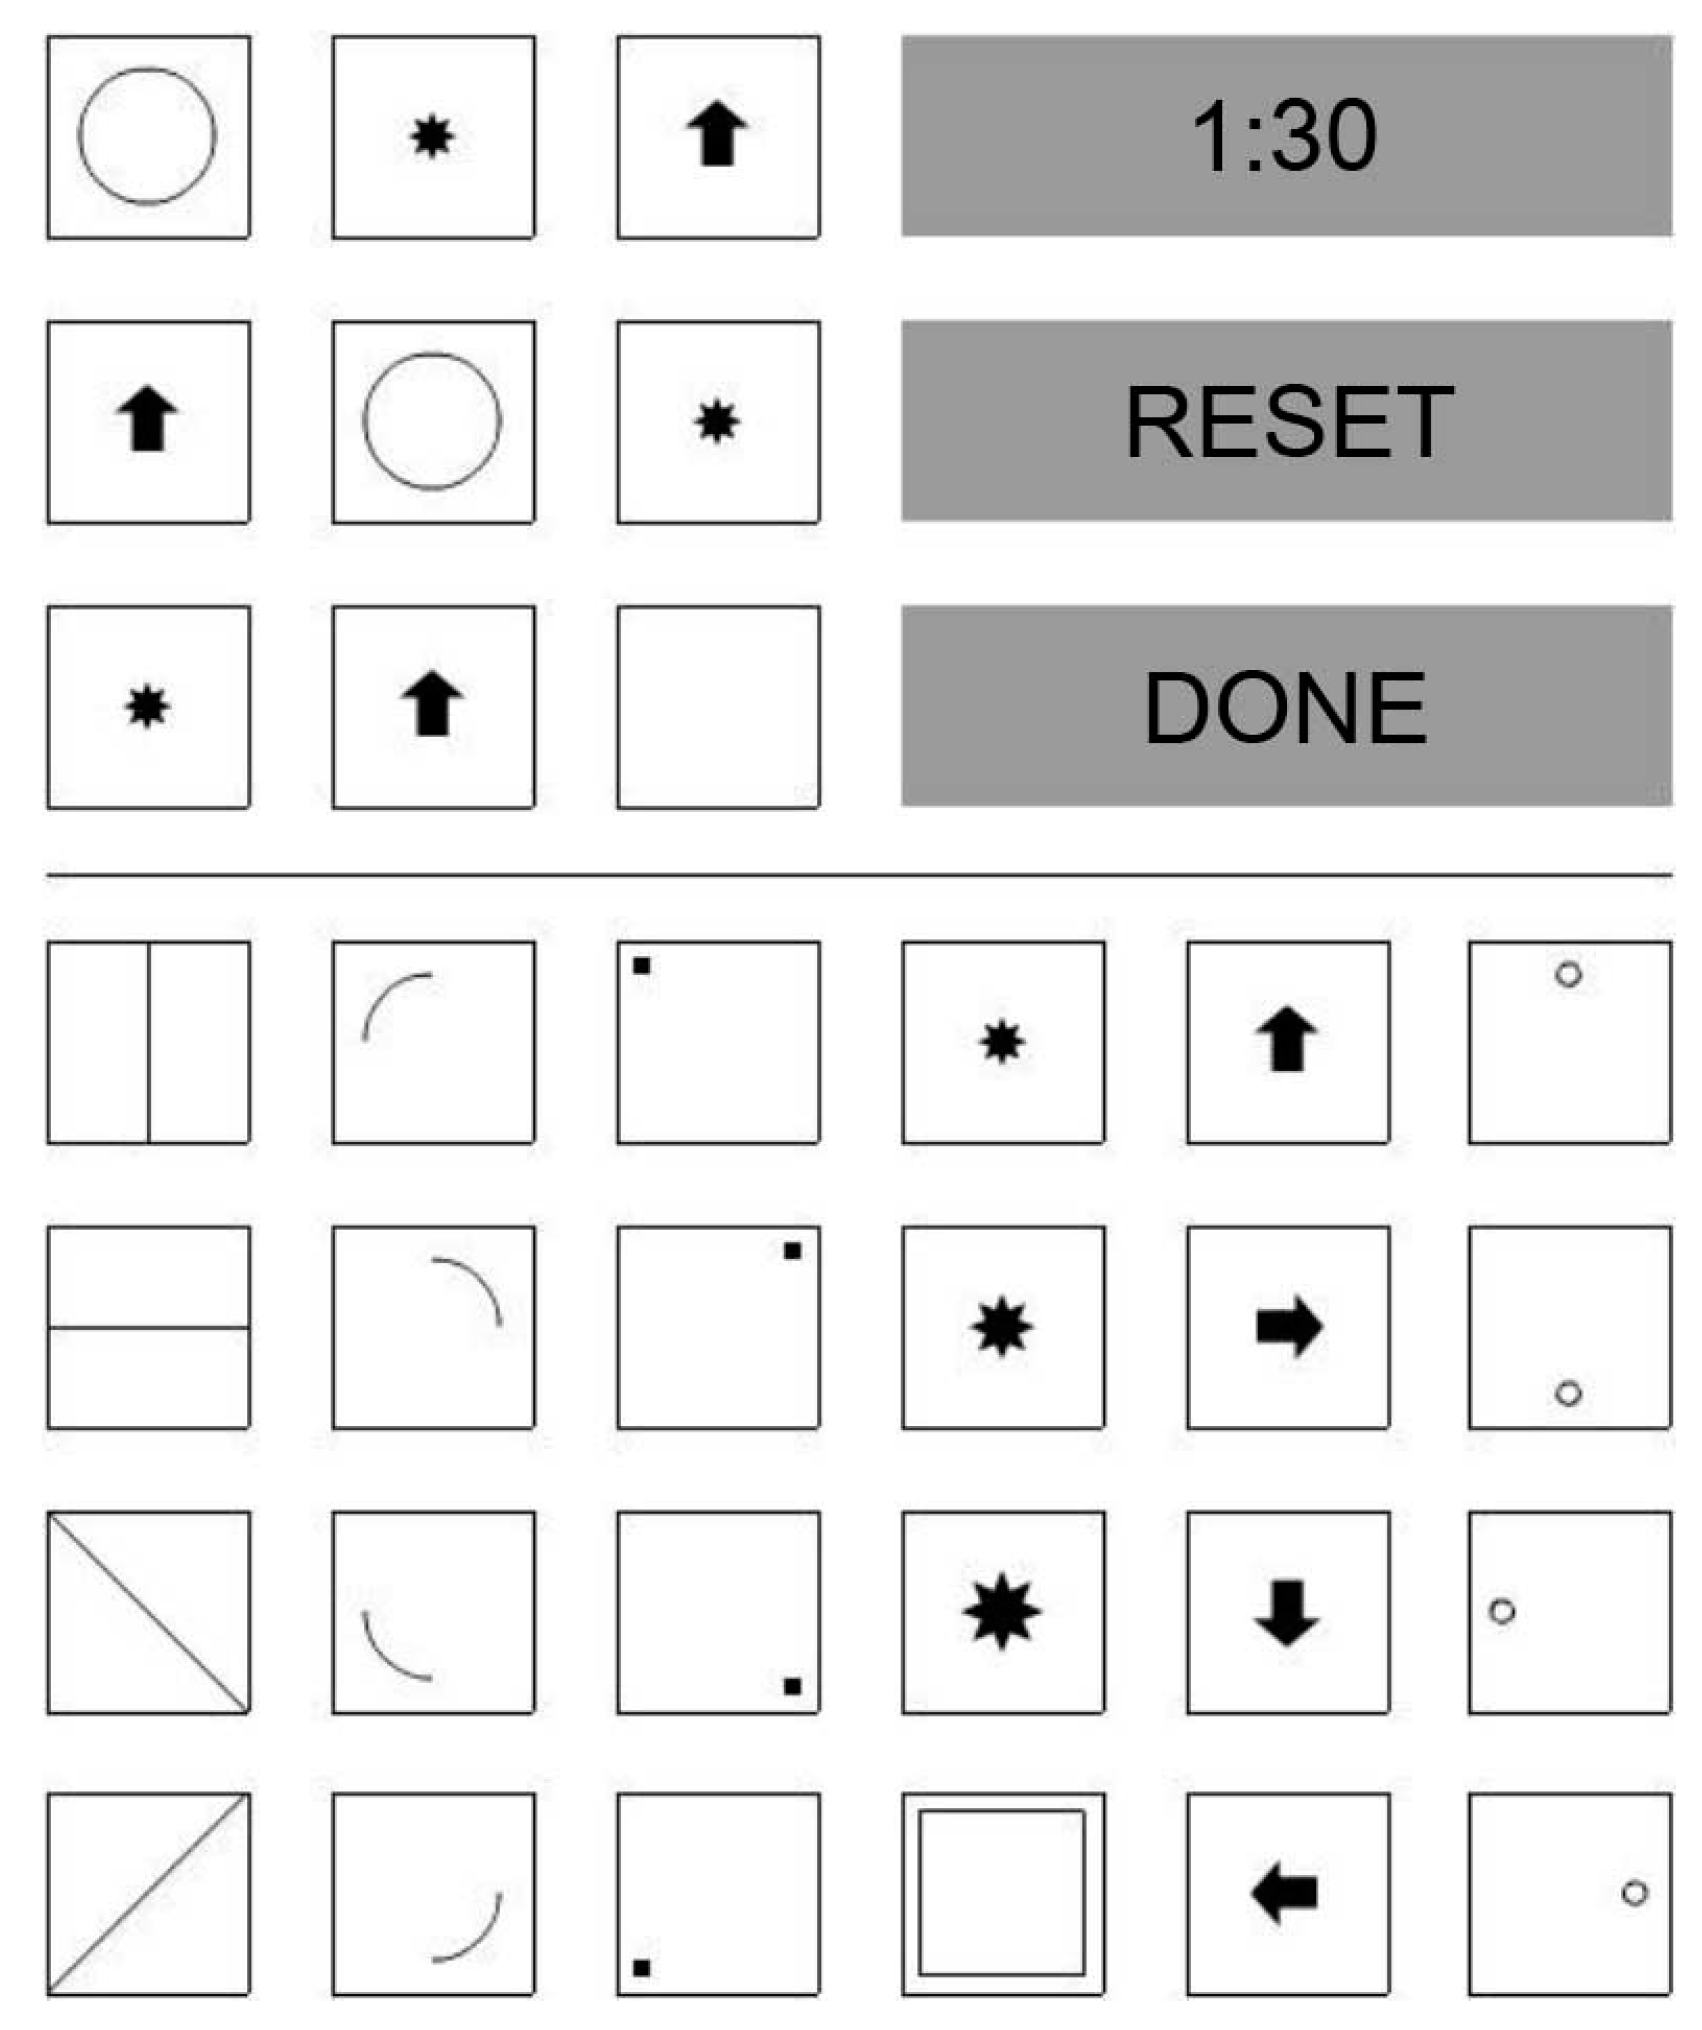
1.4.2. Item Formats that Work without Distractors

Item formats that work without distractors have a long history [19]. However, these formats have rarely been applied to figural matrices. Putz-Osterloh [5] as well as Mitchum and Kelley [7] employed a strategy by which the testees had to draw the correct solution by hand. This in an interesting approach because response elimination can take place only if response options are presented. Nevertheless, a crucial disadvantage of this strategy is that it is more costly to score these responses and sometimes even impossible to score them objectively if the sketch of the response is ambiguous. However, these problems can be avoided if response construction can take place in a computerized testing environment. Stevenson, Hickendorff, Resing, Heiser, and de Boeck [20], as well as Piskernik and Debelak [21], developed computerized matrix-like reasoning tasks for which the response has to be constructed. In a recent study involving figural matrices, we too developed an item format that works without distractors and offers an objective way to obtain and score the testees’ responses [22]. The format, which we call the construction task, is presented in Figure 2.
Figure 2. Construction task.
Jintelligence 04 00002 g002
The item stem is presented above the horizontal line in the middle of the figure. The last cell is left empty and has to be filled in by the testee. The response format can be found below the horizontal line. It consists of 24 cells with geometric symbols that were used to construct the item stems. When the testee clicks on one of the cells in the response format, the symbol appears in the empty cell of the item stem. When the cell is clicked again, the symbol disappears. Consequently, testees can build a solution to the matrix problem by clicking on the appropriate cell. The three grey buttons above the horizontal line indicate the operation to be applied to the test or the time remaining (all labels were translated into English for clarity). The top button shows the time remaining for the item. Pushing the “RESET” button clears the last cell of the item stem. Pushing the “DONE” button confirms the current solution. After the processing time expires, the solution currently contained in the solution cell is recorded as the solution to the matrix.

1.5. Goals

The goals of this study were to compare the three strategies that were used to present the response formats (distractor free, conceptual strategy, perceptual strategy) on the two following aspects:
(1) Difficulty: In accordance with Arendasy and Sommer [9], we believe that response elimination strategies can be reduced by applying a theory-driven distractor-construction strategy. Nevertheless, we think that response elimination strategies cannot be completely prevented when multiple-choice items that include distractors and the attractor are used because the correct option (i.e., attractor) is still displayed in the response format and therefore provides information about the solution to the item. Therefore, we expected the items to be more difficult when a construction task was used than when distractor-based response formats were used.
(2) Convergent validity: In accordance with Arendasy and Sommer [9], we expected the convergent validity of matrices tests concerning g to be higher when response elimination strategies were reduced. We additionally predicted a higher convergent validity concerning working memory capacity when response elimination strategies were prevented because goal monitoring can be expected to be more relevant when only a constructive matching strategy can be employed. Therefore, we predicted that respondents’ scores on matrices tests that were realized as construction tasks would exhibit higher correlations with g and measures of working memory capacity than their scores on matrices tests employing distractors. Differences in the convergent validity between perceptual and conceptual distractors were analyzed in an exploratory fashion.

2. Experimental Section

2.1. Sample

The sample consisted of 151 university students who took part in an introductory psychology course (M(age) = 22.29; SD(age) = 3.08; 71.3% female). The participants received extra credit for participating in the experiment.

2.2. Procedure

The tests were completed on a computer in a laboratory setting. The testing took place in small groups of no more than 10 participants. Before being tested, participants filled out a demographic questionnaire. The participants were randomly assigned to one of the matrices tests (distractor free: 56 participants; conceptual distractors: 50 participants; perceptual distractors: 45 participants). Half of the participants completed the matrices test (see Section 2.3.1) first, and half completed the working memory battery (see Section 2.3.2) first. A subsample of 96 participants (64%) additionally completed an intelligence test (see Section 2.3.3) in a separate session.

2.3. Test Methods

2.3.1. Matrices Tests

We used the item stems from version A of the DESIGMA [23] for this study. The DESIGMA is a distractor-free matrices test. Version A consists of 38 items. The items were constructed by applying six different rules: (1) Addition: Elements in the first and second cell are summed in the third cell; (2) Subtraction: The elements in the second cell are subtracted from the elements in the first cell. The remaining elements are presented in the third cell; (3) Single element addition: Only elements that appear in either the first or second cell are presented in the third cell. Elements that appear in both the first and second cells are not presented; (4) Intersection: Only elements that appear in both the first and second cells are presented in the third cell; (5) Rotation: Elements are rotated across the cells; (6) Completeness: The same set of elements is presented in every row of the matrix. Combinations of one to five rules were realized in the items (1 rule: items 1 to 6; 2 rules: items 7 to 21; 3 rules: items 22 to 31; 4 rules: items 32 to 36; 5 rules: items 37 to 38). The reliability and validity of the test were determined in a validation study and proved to be good (α = 0.96, factorial validity was based on the results of confirmatory factor analyses, criterion validity was based on substantial correlations with age and educational achievement; see [23] for details). The same item stems were used in all of the three variations. The versions differed only in the manner in which the distractors were presented. The matrices tests were conceived as power tests. Nevertheless, a time limit of 90 s per item was implemented to ensure time economy and to guarantee that every respondent had the opportunity to work on every item. The time limit was determined on the basis of the response times observed in one of our previous studies [22]. In that study, the vast majority of participants responded well below 90 s, even when no time limit was given.

2.3.2. Distractor-Free Version

The distractor-free version is the standard format for presenting the DESIGMA. The items are presented in the distractor-free form as we described in the introduction (see Section 1.4.2). It has to be noted that except for two rather easy items (items 2 and 4), the correct solution is comprised of a combination of at least two elements from the response format. Therefore, the correct solution is not part of the response format for the vast majority of the items.

2.3.3. Conceptual Distractor Version

In this version, the conceptual strategies were applied to construct the distractors. Figure 3 provides an example of an item employed in the current study.
Figure 3. Item stem with conceptual distractors (CD) and perceptual distractors (PD).
Jintelligence 04 00002 g003
The squares follow a horizontal addition rule, i.e., squares presented in the first and second cells of a row are summed in the third cell. A horizontal subtraction rule applies for the circle segments, i.e., the segments in the second cell of a row are subtracted from the segments in the first cell, and the remaining segments are presented in the third cell. The response options for the version with conceptual distractors are presented in the row labeled “CD”. Option A is the correct solution. Options B and C represent incomplete solution distractors. In option B, the squares were omitted, and in option C, the circle segments were omitted. Options D and E are arbitrary line-of-reasoning distractors. In option D, the square was rotated 90° in a counterclockwise direction from the second cell of the row, and it would be a correct solution if only the last row of the matrix were to be taken into account. For option E, the horizontal subtraction rule for the circle segments was replaced with a horizontal addition rule. Therefore, a full circle is displayed, and this would be the overlay of the segments in the two preceding cells of the row. Options F to H are mishandled rule-direction distractors. For option F, the horizontal addition rule was replaced with a vertical addition rule. Therefore, four squares were used, and these represented the overlay of the two cells above. The horizontal addition rule for the squares was replaced with a diagonal addition rule in option G. A mixture between the arbitrary line of reasoning and mishandled rule-direction strategy was realized in option H, where a vertical addition rule was employed for the circle segments instead of the horizontal subtraction rule. In accordance with Arendasy [17] (see also [9,24,25]), we employed option I (“all wrong”) for every item since it had been suggested that this might reduce the use of response elimination strategies because respondents would have to evaluate the correctness of each item against the possibility that no correct answer is presented.

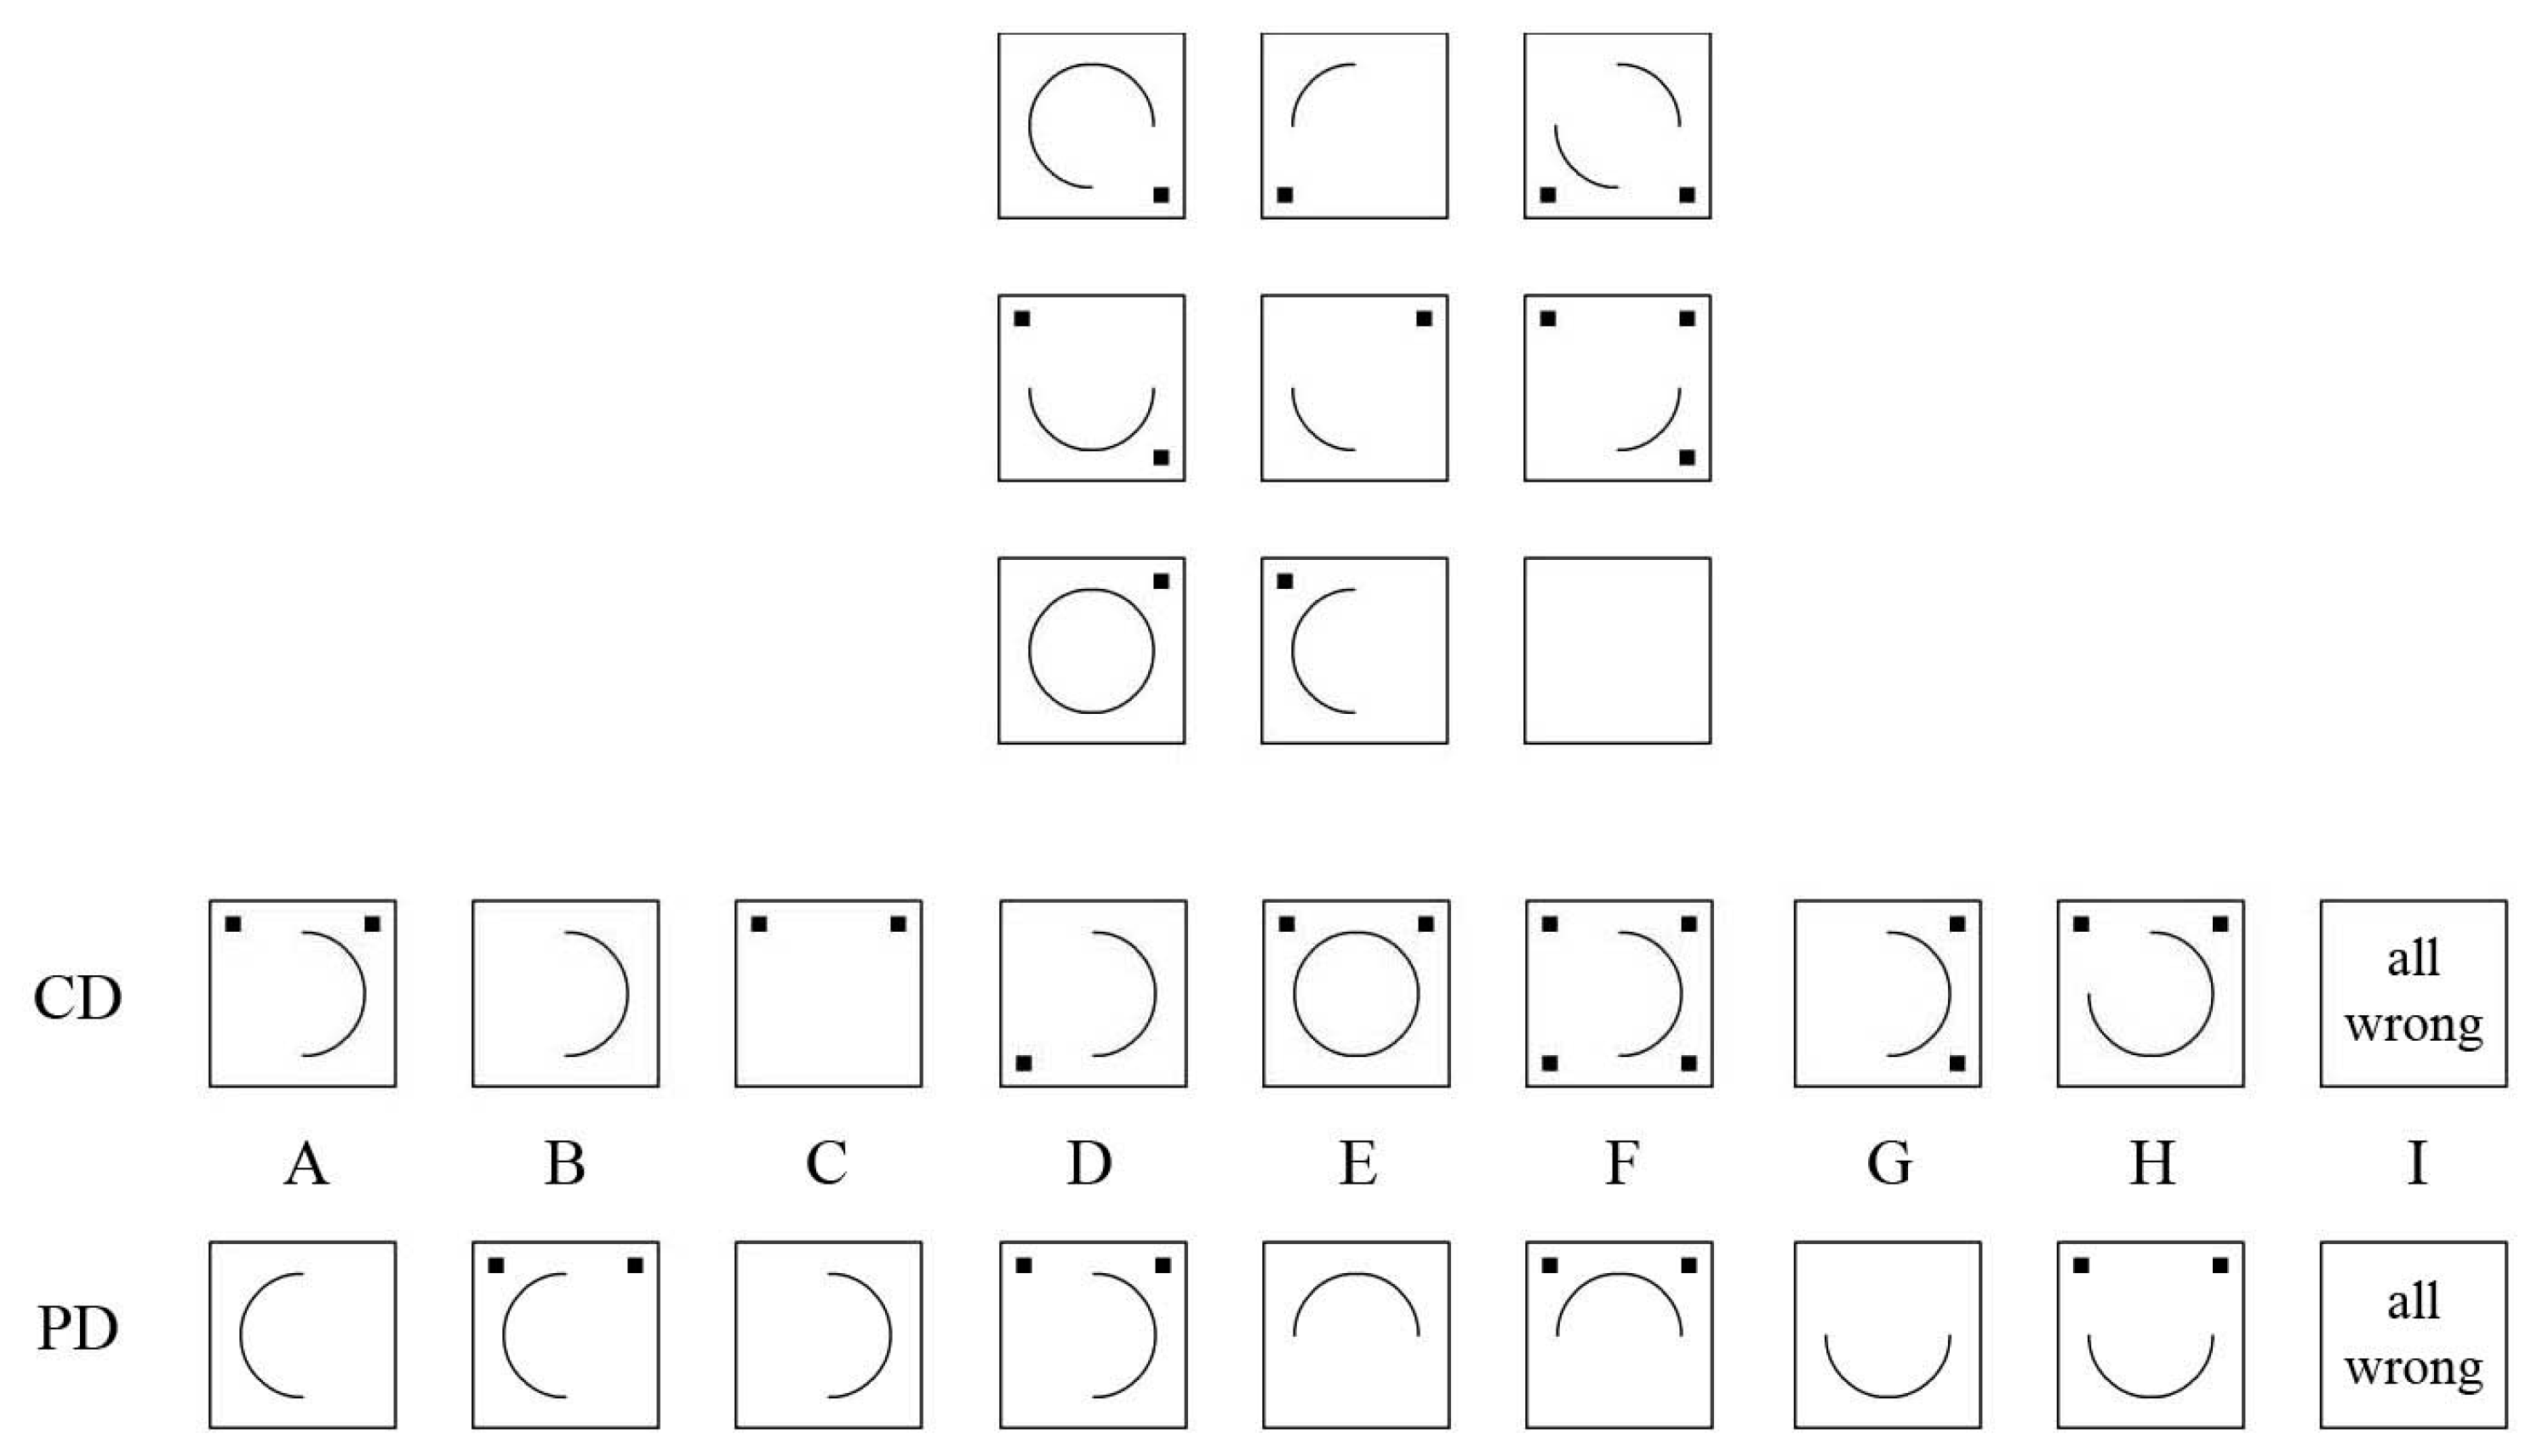
2.3.4. Perceptual Distractor Version

The perceptual distractors for the example that was just mentioned are presented in the row labeled “PD” in Figure 3. In accordance with Guttmann and Schlesinger [18], we systematically varied the perceptual elements of the correct solution. In doing so, we employed all possible rotations of the semicircle that is contained in the correct solution (options A, B: opening to the right; options C, D: opening to the left; options E, F: opening downwards; options G, H: opening upwards). The two squares contained in the correct solution were either displayed in the distractors or omitted (options A, C, E, and G: displayed; options B, D, F, and H: omitted).

2.3.5. Working Memory Battery

Working memory capacity (WMC) was assessed with Recall-1-Back tasks [26], which allow stimulus-location bindings to be continuously updated. Three analogous tasks were presented, one with letters, one with numbers, and a third one with figures as the stimuli. In the number and letter versions, one to four boxes were shown in a row for the entire duration of one trial. The stimuli appeared one after the other in one of the boxes for 3000 ms. Then they were deleted, and the next stimulus appeared in one of the boxes after an interval of 500 ms. Upon being presented with a stimulus, participants had to use the keyboard to enter the previous stimulus that was shown in the respective box, and responses were accepted as long as the actual stimulus was visible. There were trials with 6, 9, and 12 stimulus updates, and participants could not predict which box the next stimulus would appear in. In the task version with figural stimuli, a 3 × 3 grid was shown on the screen, and abstract forms appeared one after another in one of the cells (again for 3000 ms with intervening intervals of 500 ms). Participants were instructed to indicate the cell in which the actual stimulus was shown the last time by clicking the mouse. All tasks began with a training phase comprised of four trials with an increasing stimulus load (one to four stimuli to remember), and feedback was given after each response. After a short pause, the test phase was initiated. Participants were informed that the task would remain the same but that trials of differing complexity would be presented and that feedback would no longer be supplied. Working memory load (i.e., 1, 2, 3, or 4 stimuli per trial) and updating requirements (i.e., 6, 9, or 12 updates per trial) were orthogonally combined in the 12 trials of the test phase. Performance in each task was determined by means of a partial credit score [27] that aggregated all correct responses into a count score relative to the total number of updates required.

2.3.6. Intelligence Test

The I-S-T 2000 R (IST [28]) is a well-established German intelligence test covering a broad range of abilities that are commonly used in the assessment of general intelligence. It consists of three subtests (verbal, numerical, figural), each comprising three item groups made up of 20 items (e.g., verbal analogies for the verbal subtest, numerical series for the numerical subtest, cube rotation tasks for the figural subtest). The test has demonstrated good reliability (0.87 < α < 0.97), factorial validity from a confirmatory factor analysis, convergent validity concerning other intelligence tests, and criterion validity concerning school grades.

2.4. Statistical Procedure

We computed Cronbach’s alpha (α) for each of the three test versions to determine whether the internal consistencies would differ from one another.
In order to test the influence of the response format on the item difficulties, we computed a univariate ANOVA with repeated measures and inspected the results of the omnibus test and planned contrasts on the item level. Furthermore, the stability of the rankings of the item difficulties were compared between the three test forms by computing Pearson correlations between the difficulties of the items. In addition, we computed Pearson correlations between the item difficulty and the number of rules that were employed to test whether the items with more rules were harder to solve. Differences between the correlations were analyzed with the significance test provided by Millsap, Zalkind, and Xenos [29].
A rather simple way to test the convergent validity of the results of the matrices tests with working memory and general intelligence was realized by computing the correlations of the matrices test scores with the results of the working memory battery and the IST. This was done on the subtest level as well as for the total score. We also compared the correlations of the difficulties of the three versions of the DESIGMA with each other by using the aforementioned significance test [29].
A comparison of the raw correlations between different constructs is appropriate only when the structure of the underlying factors is equivalent [30]. To ensure that differences between the construct validities of the different versions of the test were not due to differences in the factor structure, we additionally estimated measurement invariance by computing multigroup confirmatory factor analyses. In these analyses, we computed a series of confirmatory factor analyses (CFAs) in which several aspects of the factor models were constrained to be equal across the three versions of the test in a stepwise fashion. We computed: (1) a configural model in which the number of latent variables and the loadings of the latent variables on the indicators were similar across groups; (2) a weak invariance model in which the magnitudes of the loadings were similar across groups; (3) a strong invariance model in which the loadings and intercepts were similar across groups; and (4) a strict invariance model in which the loadings, intercepts, and residual variances were similar across groups [31]. Strong invariance is particularly important when latent correlations are being compared between groups [32]. The fit of the models was determined by inspecting the χ2 test of model fit, the comparative fit indices (CFI) and root mean square error of approximation (RMSEA), as well as the χ2 difference test between the different models.
To conduct the multiple-group analyses, the items from the different DESIGMA versions were summed into three parcels with comparable mean factor loadings that were based on the results of an exploratory factor analysis. In the first analysis, a matrices factor was estimated on the basis of the three DESIGMA parcels and correlated with a factor that was estimated on the basis of the three tasks from the working memory battery. In the second analysis, the matrices factor was correlated with a factor that was based on the three subtests from the IST. In a third analysis, we modeled correlations between all three factors.

2.5. Software

All statistical analyses were computed with R [33]. For the multigroup confirmatory factor analyses, we used the packages “lavaan” [34] and “semTools” [35].

3. Results

3.1. Internal Consistency

The three test versions demonstrated high internal consistencies (distractor-free version: α = 0.93; conceptual distractor version: α = 0.91; perceptual distractor version: α = 0.89).

3.2. Item Difficulties

Table 1 shows the difficulties of the 38 items on the three different variations of the DESIGMA. The results showed that the items from the distractor-free version (M(pDF) = 0.44) were more difficult than the items from the distractor versions (M(pCD) = 0.54; M(pPD) = 0.58). The results of the ANOVA showed a significant overall effect (F(2, 36) = 19.68; p < 0.01). The results of the contrast analyses showed that the difference between the difficulties of the three test versions were all significant (p < 0.02). Nevertheless, the correlations between the difficulties from the distractor-free version and both distractor versions (r(pDF, pCD) = 0.87, p < 0.01; r(pDF, pPD) = 0.83, p < 0.01) as well as between the two distractor versions (r(pCD, pPD) = 0.84, p < 0.01) were high, indicating similar difficulty rankings across the three versions. There were significant correlations between the number of rules and the difficulty of the items from the distractor-free version (r = −0.49; p < 0.01) and the conceptual distractor version (r = −0.35; p = 0.03). For the perceptual distractor version, the correlation between the number of rules and the difficulty was not significant (r = −0.15; p = 0.37). The correlation for the distractor-free version was marginally significantly higher than the correlation for the perceptual distractor version (z = 1.61; p = 0.054). The other correlations did not differ significantly between the versions (DF vs. CD: z = 0.71; p = 0.24; CD vs. PD: z = 0.90; p = 0.18).
Table 1. Item difficulties using the distractor-free (DF), the conceptual distractor (CD), and the perceptual distractor (PD) response formats.
ItemRulesp(DF)p(CD)p(PD)
110.750.800.76
210.910.880.89
311.001.000.96
410.860.800.82
510.160.140.22
610.140.120.22
720.410.540.47
820.700.580.71
920.700.640.76
1020.730.580.76
1120.160.260.29
1220.450.460.53
1320.300.680.62
1420.480.660.53
1520.380.500.51
1620.140.440.27
1720.140.280.38
1820.550.680.71
1920.770.780.76
2020.660.780.87
2120.540.460.53
2230.410.520.58
2330.130.380.31
2430.540.620.69
2530.340.600.67
2630.480.640.60
2730.440.620.76
2830.290.440.44
2930.380.580.44
3030.390.620.56
3130.700.680.69
3240.070.400.62
3340.250.300.67
3440.390.500.58
3540.230.380.33
3640.270.320.38
3750.230.360.56
3850.210.380.58
M(p)0.440.540.58
SD(p)0.250.200.19
p = Item difficulty; DF = Distractor-free version; CD = Conceptual distractor version; PD = Perceptual distractor version; M = Mean; SD = Standard deviation.

3.3. Correlations with Intelligence and Working Memory Capacity

Table 2 presents results showing the degree to which the scores on the three variations of the DESIGMA were correlated with the IST subtest scores and the working memory tasks. Except for the numerical IST subtest (ISTN), the correlations with the distractor-free version, as initially hypothesized, were highest, followed by the correlations with the perceptual distractor version and the correlations with the conceptual distractor version. This also applied to the means of the correlations calculated by Fisher’s-Z transformation on the IST subtests (M(rDF) = 0.54, M(rCD) = 0.12, M(rPD) = 0.38) and the working memory task (M(rDF) = 0.45, M(rCD) = 0.21, M(rPD) = 0.28). The correlations for the global IST score and the global working memory task with the different variations of the DESIGMA were also highest for the distractor-free version, followed by the conceptual distractor version and the perceptual distractor version. The significance tests revealed that a substantial number of the correlations differed significantly between the three versions.
Table 2. Correlations for intelligence and working memory capacity with matrices test performance.
TestDFCDPDDF vs. CDDF vs. PDCD vs. PD
ISTVr = 0.64 **r = 0.34 *r = 0.30z = 1.57z = 1.63 *z = 0.17
ISTNr = 0.46 **r = 0.15r = 0.63 **z = 1.34z = 0.89z = 2.27 **
ISTFr = 0.53 **r = −0.14r = 0.12z = 2.84 **z = 1.71 *z = 1
ISTGr = 0.61 **r = 0.12r = 0.53 **z = 2.28 **z = 0.43z = 1.8 *
WMVr = 0.45 **r = 0.20r = 0.30 *z = 1.41z = 0.85z = 0.5
WMNr = 0.48 **r = 0.18r = 0.32 *z = 1.7 *z = 0.93z = 0.7
WMFr = 0.44 **r = 0.26r = 0.20z = 1.03z = 1.3 **z = 0.3
WMGr = 0.54 **r = 0.25r = 0.35 *z = 1.74 *z = 1.16z = 0.52
DF = Distractor-free version; CD = Conceptual distractor version; PD = Perceptual distractor version; ISTV = Verbal subtest from the IST; ISTN = Numerical subtest from the IST; ISTF = Figural subtest from the IST; ISTG = General score on the IST; WMV = Verbal working memory task; WMN = Numerical working memory task; WMF = Figural working memory task; WMV = General working memory task score; r = Pearson correlation; z = z-score for the difference between correlations; * p < 0.05; ** p < 0.01.

3.4. Multiple-Group Comparisons

Table 3 shows the results of the multigroup comparisons for the three test versions. The model in which only the correlations between the latent factors from the matrices test and the working memory task were analyzed demonstrated strict measurement invariance. The χ2 test for the strict model (χ2(52) = 55.89, p = 0.33) and the χ2 difference test between the strong and strict models (χ2(12) = 8.12, p = 0.78) were not significant. Furthermore, the strict model showed good fit indices (CFI = 0.99, RMSEA = 0.04). The standardized latent correlations between the latent factors from the matrices test and the working memory task were substantially higher for the distractor-free matrices (r = 0.59) than for the version with perceptual distractors (r = 0.47) and for the version with conceptual distractors (r = 0.27). The model in which the correlations between the latent factors from the matrices test and the IST were analyzed did not demonstrate configural invariance since the χ2 test was significant (χ2(24) = 38.37, p = 0.03) and the fit indices did not meet the usual cut-off criteria (CFI = 0.95; RMSEA = 0.14). Thus, measurement invariance could not be established for this model. For the model employing latent factors for the matrices test, the working memory task, and the IST, again, measurement invariance did not hold. The configural model did not converge after 100,000 iterations and was therefore omitted from Table 3.
Table 3. Tests of measurement invariance.
Matrices + Working Memory
Modelχ2dfp(χ2)CFIRMSEAΔχ2Δdfp(Δχ2)
Configural32.81240.110.980.09
Weak37.00320.250.990.064.1980.84
Strong47.86400.180.980.0610.8680.21
Strict55.98520.330.990.048.12120.78
Matrices + Intelligence
Modelχ2dfp(χ2)CFIRMSEAΔχ2Δdfp(Δχ2)
Configural38.37240.030.950.14
Weak62.0732<0.010.900.1723.718<0.01
Strong86.3940<0.010.840.1924.328<0.01
Strict108.8352<0.010.810.1922.44120.03
χ2 = χ2 value from the test for model fit; df = Degrees of freedom; p2) = Significance of the χ2 value from the test for model fit; CFI = Comparative fit index; RMSEA = Root mean square error of approximation; Δχ2 = Difference in χ2 values between the model and the previous model; Δdf = Difference in degrees of freedom between the model and the previous model; p(Δχ2) = Significance of the difference in χ2 values between the model and the previous model.

4. Discussion

The results of our study clearly show that the response format used in figural matrices has an influence on important psychometric properties of the items and the test. Although the same item stems were used, the item difficulties and the convergent validities differed substantially between the three test versions. In the following, we will discuss both aspects.
There were significant differences in the item difficulties between the three versions of the test. Overall, the items in the distractor-free version proved to be more difficult than the items in the versions employing distractors. This finding is very much in line with the position of many authors [2,3,4,5,6,7,9] who differentiate between constructive matching and response elimination and propose that response elimination constitutes a fallback strategy that is used when respondents are unable to solve the items via constructive matching. As it is impossible to employ response elimination in a distractor-free version, respondents are unable to solve the items by response elimination and fail when they are unable to solve the items via constructive matching. The findings can also be reconciled with cognitive load theory. In the distractor-based versions, respondents can switch from constructive matching to response elimination in order to reduce cognitive load when the item overextends their working memory capacity and general mental ability. In the distractor-free version, it is not possible to switch strategies. Therefore, respondents cannot compensate for the overextension of working memory capacity and their general mental ability, and they make more errors, which leads to a higher difficulty level in the distractor-free version. The difficulties of the items in the version with conceptual distractors were significantly higher than the difficulties of the perceptual distractor items. Nevertheless, the mean difference can be regarded as rather small (M(pCD) = 0.54 vs. M(pPD) = 0.58). Therefore, we would not conclude that the ways in which respondents employ solution strategies differ between the two distractor versions. A closer look at the difficulties of the single items reveals that they were not always the highest in the distractor-free version. In fact, in some cases, the items in the distractor-free version were the easiest (e.g., item 2: p(DF) = 0.91; p(CD) = 0.88; p(PD) = 0.89). Although these differences were smaller than the cases in which the difficulty of the distractor-free version was higher (e.g., item 32: p(DF) = 0.07; p(CD) = 0.40; p(PD) = 0.62), this finding still runs counter to the idea that the items become more difficult because response elimination strategies are prevented. An explanation for this finding might be that the construction of “good” distractors (i.e., distractors that prevent response elimination) is more difficult when many rules are employed in the items. As described in the introduction, the conceptual strategy for constructing distractors aims to violate matrix rules in the distractors. When there are many rules, it becomes impossible to violate all of the rules in all of the distractors because then the correct answer would become too obvious. If not all of the rules are violated, the distractors provide information about the correct answer because they correctly follow the matrix rules. A similar problem applies to the perceptual strategy for the construction of distractors. When many rules are used, many symbols have to be used, and these are affected by the rules. Therefore, it is not possible to produce all possible permutations of the symbols. Rather, it is possible only to produce a smaller subset that contains symbols that follow the matrix rules. In accordance with this idea, the distractors should work better (i.e., produce difficulties that are more similar to the difficulties of distractor-free items) when only a few rules are realized in the matrix.
We explored this idea by additionally inspecting the mean difficulties of the items that had the same numbers of rules across the three test versions. Table 4 shows that the mean difficulties of the three versions did not differ substantially from one another for items employing only one rule. The greater the number of rules employed in the items, the more the difficulties differed between the distractor-free version and the distractor versions. Therefore, these results provide support for the hypothesis that the distractors work better when only a few rules are realized in the item stem. It has to be noted that these results are still descriptive because the number of items in some of the rule groups was too small to compute an ANOVA. A future study using more items that are evenly distributed across the rule groups could provide an additional test of this hypothesis.
Table 4. Item difficulty split by the number of rules.
RulesDFCDPD
1M(p) = 0.64M(p) = 0.62M(p) = 0.65
SD(p) = 0.39SD(p) = 0.39SD(p) = 0.34
2M(p) = 0.47M(p) = 0.55M(p) = 0.58
SD(p) = 0.22SD(p) = 0.16SD(p) = 0.18
3M(p) = 0.41M(p) = 0.57M(p) = 0.57
SD(p) = 0.15SD(p) = 0.09SD(p) = 0.14
4M(p) = 0.24M(p) = 0.38M(p) = 0.52
SD(p) = 0.11SD(p) = 0.08SD(p) = 0.15
5M(p) = 0.22M(p) = 0.37M(p) = 0.57
SD(p) = 0.01SD(p) = 0.01SD(p) = 0.01
DF = Distractor-free version; CD = Conceptual distractor version; PD = Perceptual distractor version; M(p) = Mean item difficulty; SD(p) = Standard deviation of item difficulties.
The finding that items with a distractor-free response format are harder to solve than items that involve distractors has practical implications because it provides an opportunity to construct items with a high statistical difficulty. Such items are useful for the differentiated assessment of intellectual giftedness [24,36].
The correlations for the results of the three versions of the matrices test with the subtests and general scores from the IST and the working memory battery indicate that the convergent validity of the distractor-free version is substantially higher than the convergent validity of both other versions involving conceptual and perceptual distractors. As the item stems used in the three versions were exactly the same, this effect can be completely attributed to the response format. These results are in line with Arendasy and Sommer [9] who argued that the prevention of response elimination strategies leads to a solution process that has a stronger relation to general intelligence. Furthermore, our results extend this effect to working memory capacity, which is strongly related to intelligence [37]. This extension to working memory capacity makes sense given that the construction strategy requires the respondent to keep track of the solution process and thus requires working memory capacity. In line with cognitive load theory as well, working memory capacity and general mental ability can be predicted to be more relevant in the distractor-free version because respondents cannot reduce their mental load by applying response elimination strategies. This prediction was supported for working memory capacity in the multigroup confirmatory factor analyses. As strict measurement invariance was found to hold, the three matrices tests can be said to possess equivalent factor structures, but the latent correlation with the intelligence factor was found to be substantially higher for the distractor-free version than for the distractor versions. However, in the absence of measurement invariance, differences in the relationships of latent factors are ambiguous. At any rate, the misfit of the model could be attributed to the IST because the other multigroup models showed good fit.

5. Limitations

One limitation of the current study is that the assumption that response elimination strategies can be completely ruled out by employing a distractor-free format could not be tested directly. Although it is obvious that the constructive matching strategy is a more efficient strategy for the distractor-free version, there are still quite a few response alternatives that the respondent must review. The extent to which response elimination could be reduced by using the distractor-free format can be more directly investigated by assessing qualitative aspects of the solution process via eye-tracking or verbal reports (e.g., as in Carpenter et al.’s [1] study). This would be a valuable perspective for further research.
Another limitation is that the probability of guessing the correct answer differed between the three test versions. While the guessing probability for the distractor free version (1/224) tended toward zero, the guessing probability for the distractor-based version was 1/9 = 0.11. Therefore, a potential alternative explanation for the differences in construct validity between the three versions is that guessing deflated the correlations between the test results and the criteria. Although we were not able to assess guessing directly, three arguments run counter to this idea: (1) Previous studies [38,39] applying item response theory (IRT) models on matrices tests with 10 response options showed that a two parameter logistic (2PL) model (comprising no guessing parameter) was superior to a 3PL model (comprising a guessing parameter) in terms of information criteria. These results suggest that the influence of guessing on the test results was negligible; (2) Although the guessing probability for the conceptual and the perceptual distractor versions was the same, the construct validities of the two versions differed. Taking this finding into account, guessing cannot be the only cause of differences in construct validity between the distractor-based and distractor-free versions; (3) The difficulty of most of the items in the two distractor versions was substantially higher than the guessing probability. Therefore, it is unlikely that a substantial number of the participants used guessing. Verbal protocols could be applied in follow-up studies, as they might allow more direct inferences to be made about participants’ response strategies.

6. Conclusions

The results of our study indicate that the response formats used in figural matrices play an important role in determining both the difficulties of the items and the convergent validities of the matrices tests. We demonstrated that items employing the same item stem had higher difficulties when no distractors were used. Furthermore, the convergent validity of matrices tests without distractors with respect to intelligence and working memory capacity was higher than for tests that employed distractors. Therefore, this variant provides an appealing alternative for computerized testing. Nevertheless, classic matrices tests will retain their importance when comparability with previous research is necessary and because they can be practically administered in a pen and paper format.
The results obtained here should also provide a warning to test developers to pay greater attention to the distractors that are employed on tests. Except for Arendasy and Sommer [9], no other study has investigated the influence of the strategy employed for constructing the distractors on the psychometric properties of figural matrices tests. Therefore, we would like to stress the importance of developing new ideas for constructing distractors and perhaps comparing them with distractor-free test versions as a baseline.

Acknowledgments

The authors thank Jane Zagorski for the great job she did in proofreading the manuscript.

Author Contributions

Nicolas Becker: Conceptualized the study, conducted the statistical analyses, and wrote the manuscript; Florian Schmitz: Designed the working memory tasks; Anke M. Falk, Jasmin Feldbrügge, and Daniel R. Recktenwald: Designed the distractors and collected the data; Oliver Wilhelm, Franzis Preckel, and Frank M. Spinath: Edited and approved the manuscript.

Conflict of Interest

The authors declare no conflict of interest.

References

  1. Carpenter, P.A.; Just, M.A.; Shell, P. What one intelligence test measures: A theoretical account of the processing in the Raven Progressive Matrices Test. Psychol. Rev. 1990, 97, 404–431. [Google Scholar] [CrossRef] [PubMed]
  2. Bethell-Fox, C.E.; Lohman, D.F.; Snow, R.E. Adaptive reasoning: Componential and eye movement analysis of geometric analogy performance. Intelligence 1984, 8, 205–238. [Google Scholar] [CrossRef]
  3. Hayes, T.R.; Petrov, A.A.; Sederberg, P.B. A novel method for analyzing sequential eye movements reveals strategic influence on Raven’s Advanced Progressive Matrices. J. Vis. 2011, 11, 10. [Google Scholar] [CrossRef] [PubMed]
  4. Jarosz, A.F.; Wiley, J. Why does working memory capacity predict RAPM performance? A possible role of distraction. Intelligence 2012, 40, 427–438. [Google Scholar] [CrossRef]
  5. Putz-Osterloh, W. Problemlöseprozesse und Intelligenztestleistung; Huber: Bern, Switzerland, 1981. (In German) [Google Scholar]
  6. Vigneau, F.; Caissie, A.F.; Bors, D.A. Eye-movement analysis demonstrates strategic influences on intelligence. Intelligence 2006, 34, 261–272. [Google Scholar] [CrossRef]
  7. Mitchum, A.L.; Kelley, C.M. Solve the problem first: Constructive solution strategies can influence the accuracy of retrospective confidence judgments. J. Exp. Psychol. Learn. Mem. Cogn. 2010, 36, 699–710. [Google Scholar] [CrossRef] [PubMed]
  8. Primi, R. Complexity of geometric inductive reasoning tasks. Intelligence 2002, 30, 41–70. [Google Scholar] [CrossRef]
  9. Arendasy, M.E.; Sommer, M. Reducing response elimination strategies enhances the construct validity of figural matrices. Intelligence 2013, 41, 234–243. [Google Scholar] [CrossRef]
  10. Sweller, J. Cognitive load theory, learning difficulty, and instructional design. Learn. Instr. 1994, 4, 295–312. [Google Scholar] [CrossRef]
  11. Paas, F.; Renkl, A.; Sweller, J. Cognitive load theory: Instructional implications of the interaction between information structures and cognitive architecture. Instr. Sci. 2004, 32, 1–8. [Google Scholar] [CrossRef]
  12. Sweller, J. Cognitive load theory. Psychol. Learn. Motiv. Cogn. Educ. 2011, 55, 37–76. [Google Scholar]
  13. Embretson, S.E. The role of working memory capacity and general control processes in intelligence. Intelligence 1995, 20, 169–189. [Google Scholar] [CrossRef]
  14. Rasmussen, D.; Eliasmith, C. A Neural Model of Rule Generation in Inductive Reasoning. Top. Cogn. Sci. 2011, 3, 140–153. [Google Scholar] [CrossRef] [PubMed]
  15. Babcock, R.L. Analysis of age differences in types of errors on the Raven’s Advanced Progressive Matrices. Intelligence 2002, 30, 485–503. [Google Scholar] [CrossRef]
  16. Raven, J.; Raven, J.C.; Court, J.H. Manual for Raven’s Progressive Matrices and Vocabulary Scales; Harcourt Assessment: San Antonio, TX, USA, 1998. [Google Scholar]
  17. Arendasy, M.E. Automatisierte Itemgenerierung und Psychometrische Qualitätssicherung am Beispiel des Matrizentests GEOM; Universität Wien: Wien, Austria, 2004. (In German) [Google Scholar]
  18. Guttman, L.; Schlesinger, I.M. Systematic Construction of Distractors for Ability and Achievement Test Items. Educ. Psychol. Meas. 1967, 27, 569–580. [Google Scholar] [CrossRef]
  19. Ward, W.C.; Bennett, R.E. Construction Versus Choice in Cognitive Measurement: Issues in Constructed Response, Performance Testing, and Portfolio Assessment; Lawrence Earlbaum Associates: Hillsdale, MI, USA, 1993. [Google Scholar]
  20. Stevenson, C.E.; Hickendorff, M.; Resing, W.C.M.; Heiser, W.J.; de Boeck, P.A.L. Explanatory item response modeling of children’s change on a dynamic test of analogical reasoning. Intelligence 2013, 41, 157–168. [Google Scholar] [CrossRef]
  21. Piskernik, B.; Debelak, R. Free Response Matrices; Schuhfried: Mödling, Austria, 2013. [Google Scholar]
  22. Becker, N.; Preckel, F.; Karbach, J.; Raffel, N.; Spinath, F.M. Die Matrizenkonstruktionsaufgabe: Validierung eines distraktorfreien Aufgabenformats zur Vorgabe figuraler Matrizen. Diagnostica 2015, 61, 22–33. (In German) [Google Scholar] [CrossRef]
  23. Becker, N.; Spinath, F.M. Design a Matrix Test. Ein Distraktorfreier Matrizentest zur Erfassung der Allgemeinen Intelligenz (DESIGMA); Hogrefe: Göttingen, Germany, 2014. [Google Scholar]
  24. Preckel, F. Diagnostik Intellektueller Hochbegabung. Testentwicklung zur Erfassung der Fluiden Intelligenz; Hogrefe: Göttingen, Germany, 2003. (In German) [Google Scholar]
  25. Gittler, G. Dreidimensionaler Würfeltest (3DW); Beltz: Weinheim, Germany, 1990. (In German) [Google Scholar]
  26. Wilhelm, O.; Hildebrandt, A.; Oberauer, K. What is working memory capacity, and how can we measure it? Front. Psychol. 2013, 4. [Google Scholar] [CrossRef] [PubMed]
  27. Conway, A.R.A.; Kane, M.J.; Bunting, M.F.; Hambrick, D.Z.; Wilhelm, O.; Engle, R.W. Working memory span tasks: A methodological review and user’s guide. Psychon. Bull. Rev. 2005, 12, 769–786. [Google Scholar] [CrossRef] [PubMed]
  28. Liepmann, D.; Beauducel, A.; Brocke, R.; Amthauer, R. Intelligenz-Struktur-Test 2000 R (I-S-T 2000 R); Hogrefe: Göttingen, Germany, 2007. (In German) [Google Scholar]
  29. Millsap, R.E.; Zalkind, S.S.; Xenos, T. Quick-Reference Tables to Determine the Significance of the Difference between Two Correlation Coefficients from Two Independent Samples. Educ. Psychol. Meas. 1990, 50, 297–307. [Google Scholar] [CrossRef]
  30. Brown, T.A. Confirmatory Factor Analysis for Applied Research; Guilford Press: New York, NY, USA, 2006. [Google Scholar]
  31. Hirschfeld, G.; von Brachel, R. Multiple-Group confirmatory factor analysis in R–A tutorial in measurement invariance with continuous and ordinal indicators. Pract. Assess. Res. Eval. 2014, 19, No. 7. [Google Scholar]
  32. Chen, F.F. What happens if we compare chopsticks with forks? The impact of making inappropriate comparisons in cross-cultural research. J. Personal. Soc. Psychol. 2008, 95, 1005–1018. [Google Scholar] [CrossRef] [PubMed]
  33. R Core Team. R: A Language and Environment for Statistical Computing; R Foundation for Statistical Computing: Wien, Austria, 2015. [Google Scholar]
  34. Rosseel, Y. Lavaan: An R package for structural equation modeling. J. Stat. Softw. 2012, 48, 1–36. [Google Scholar] [CrossRef]
  35. Pornprasertmanit, S.; Miller, P.; Schoemann, A.; Rosseel, Y.; Quick, C.; Garnier-Villarreal, M.; Selig, J.; Boulton, A.; Preacher, K.; Coffman, D.; et al. semTools: Useful Tools for Structural Equation Modeling; R Foundation for Statistical Computing: Wien, Austria, 2015. [Google Scholar]
  36. Robinson, N.M.; Janos, P.M. The contribution of intelligence tests to the understanding of special children. In Intelligence and Exceptionality: New Directions for Theory, Assessment, and Instructional Practices; Day, J.D., Borkowski, J.G., Eds.; Ablex Publishing: Westport, CT, USA, 1987; pp. 21–55. [Google Scholar]
  37. Ackerman, P.L.; Beier, M.E.; Boyle, M.D. Individual differences in working memory within a nomological network of cognitive and perceptual speed abilities. J. Exp. Psychol. Gen. 2002, 131, 567–589. [Google Scholar] [CrossRef] [PubMed]
  38. Preckel, F.; Thiemann, H. Online- versus paper-pencil-version of a high potential intelligence test. Swiss J. Psychol. 2003, 62, 131–138. [Google Scholar] [CrossRef]
  39. Preckel, F.; Freund, P.A. Accuracy, latency, and confidence in abstract reasoning: The influence of fear of failure and gender. Psychol. Sci. 2005, 47, 230–245. [Google Scholar]

