Using IRTree Models to Promote Selection Validity in the Presence of Extreme Response Styles


Abstract
:1. Introduction
2. Models
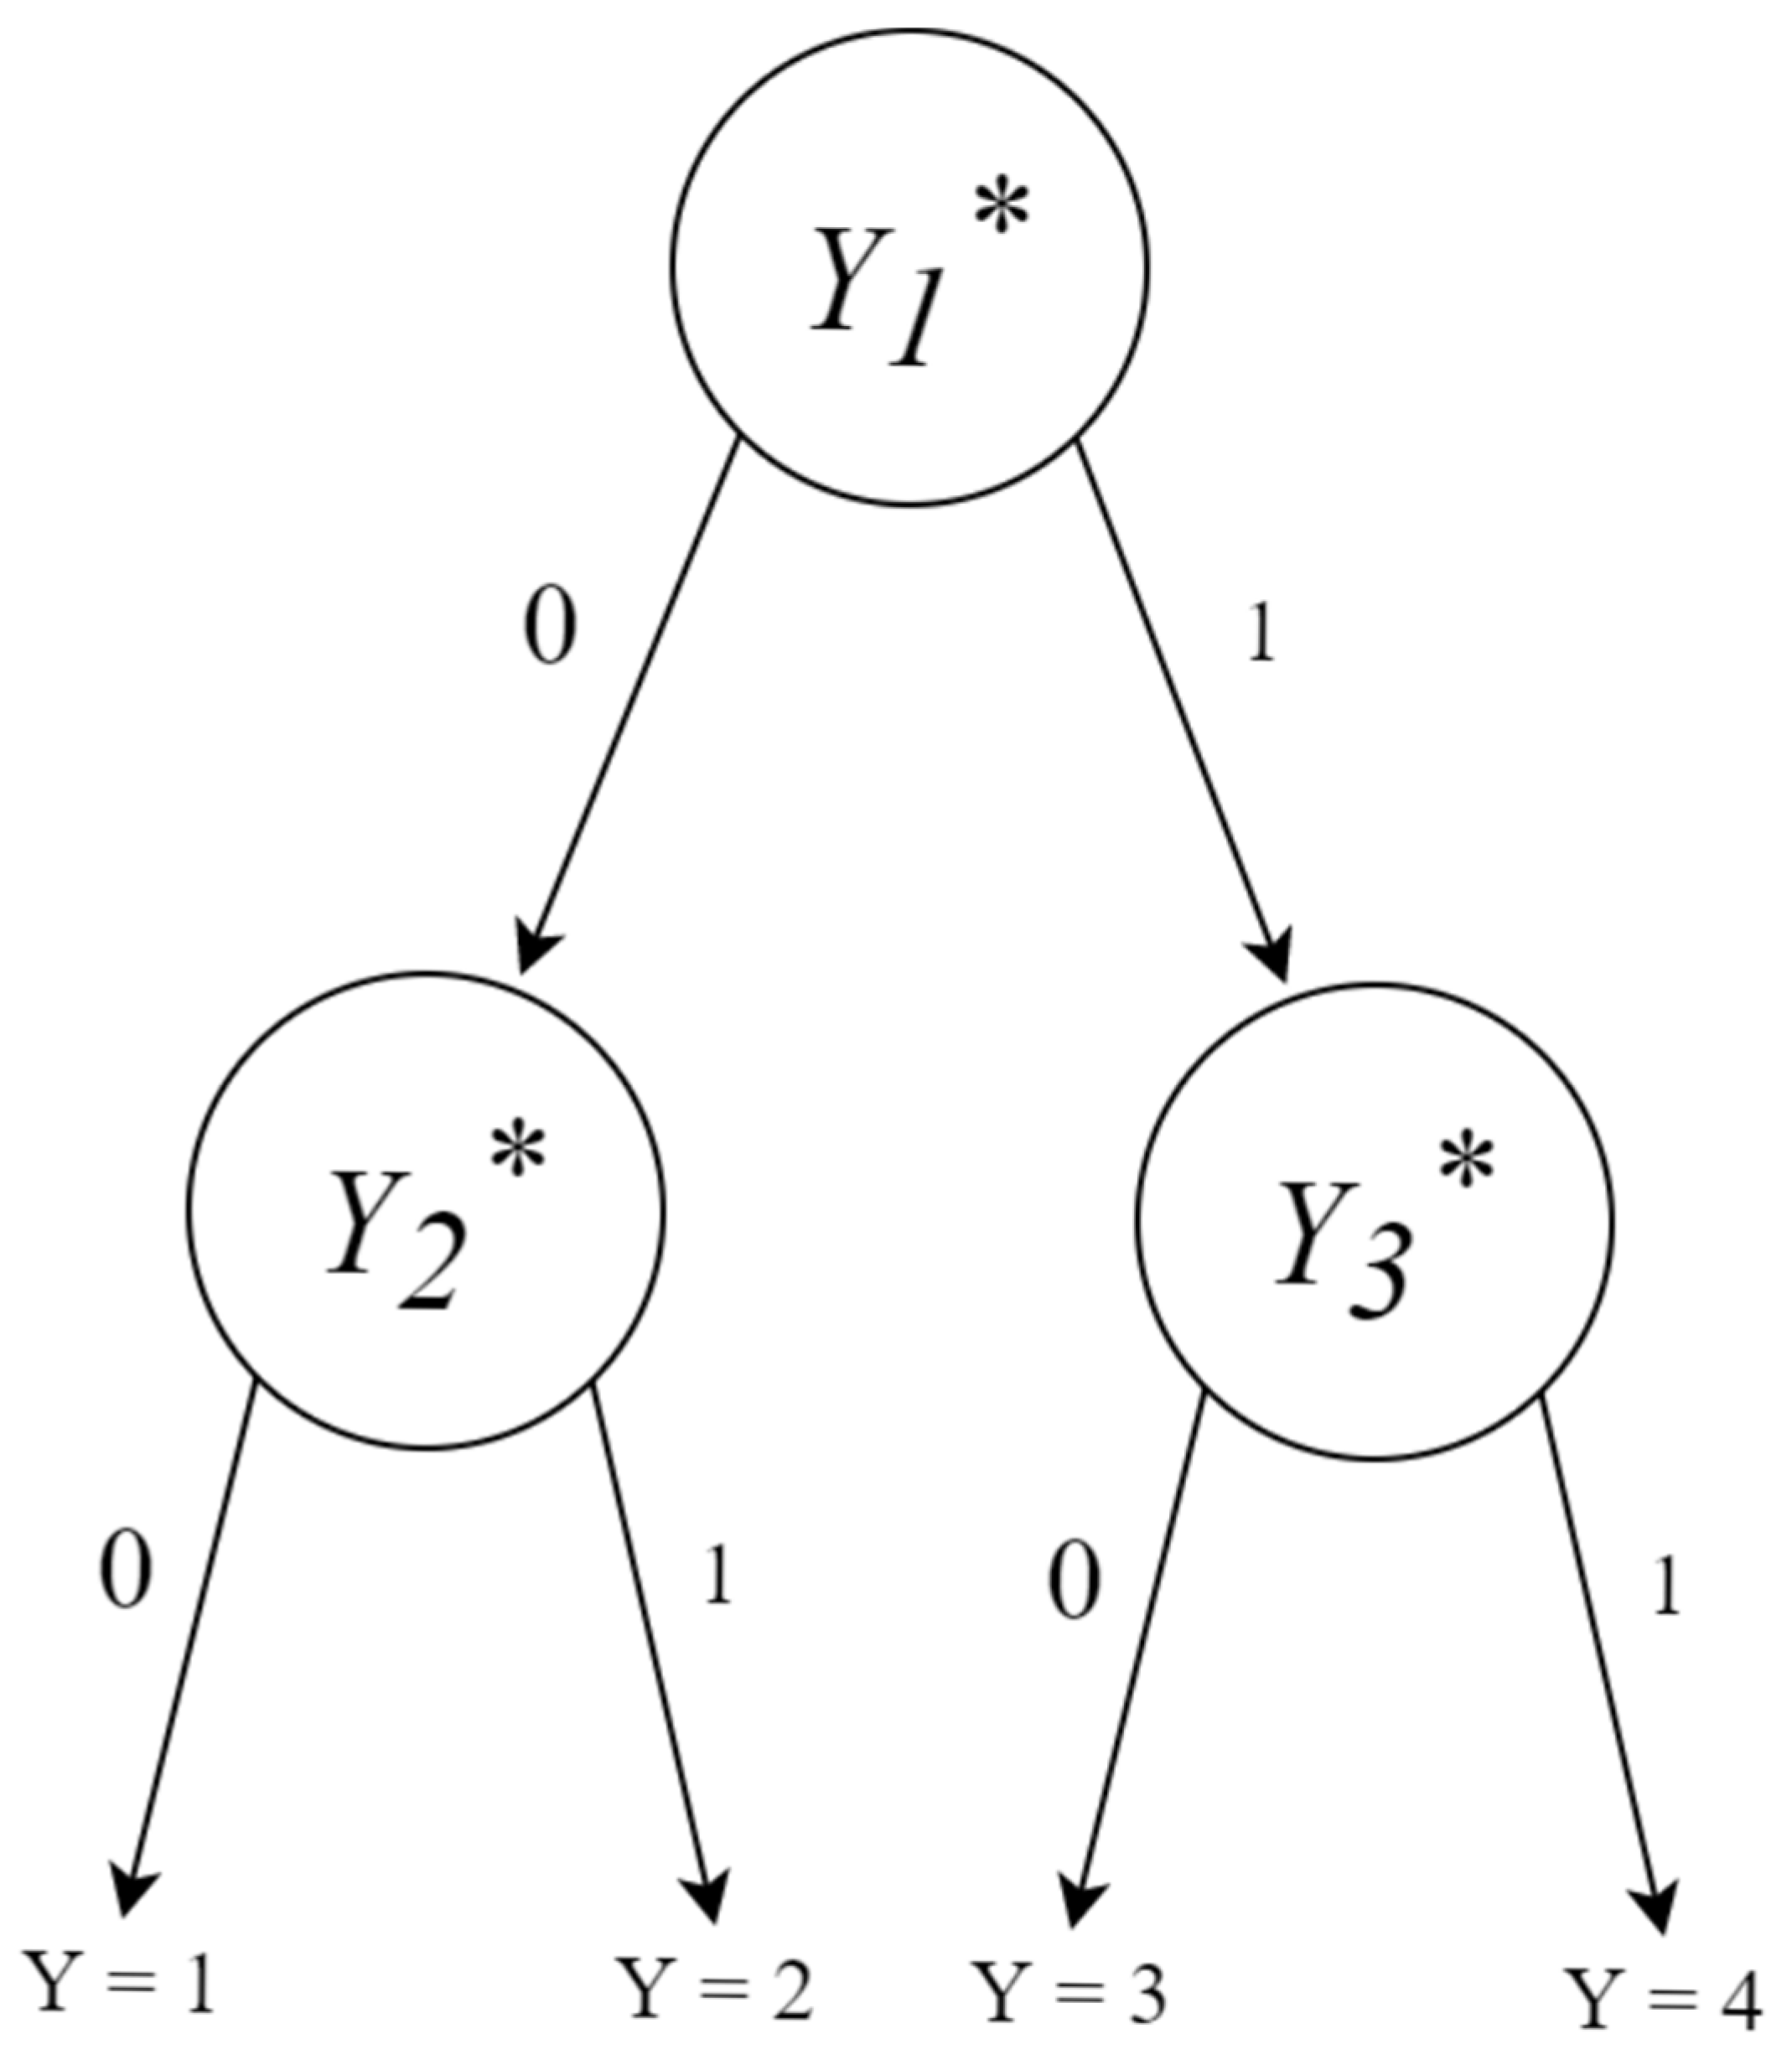
2.1. IRTree Model
2.2. Generalized Partial Credit Model (GPCM)
3. Simulation Study
3.1. Methods
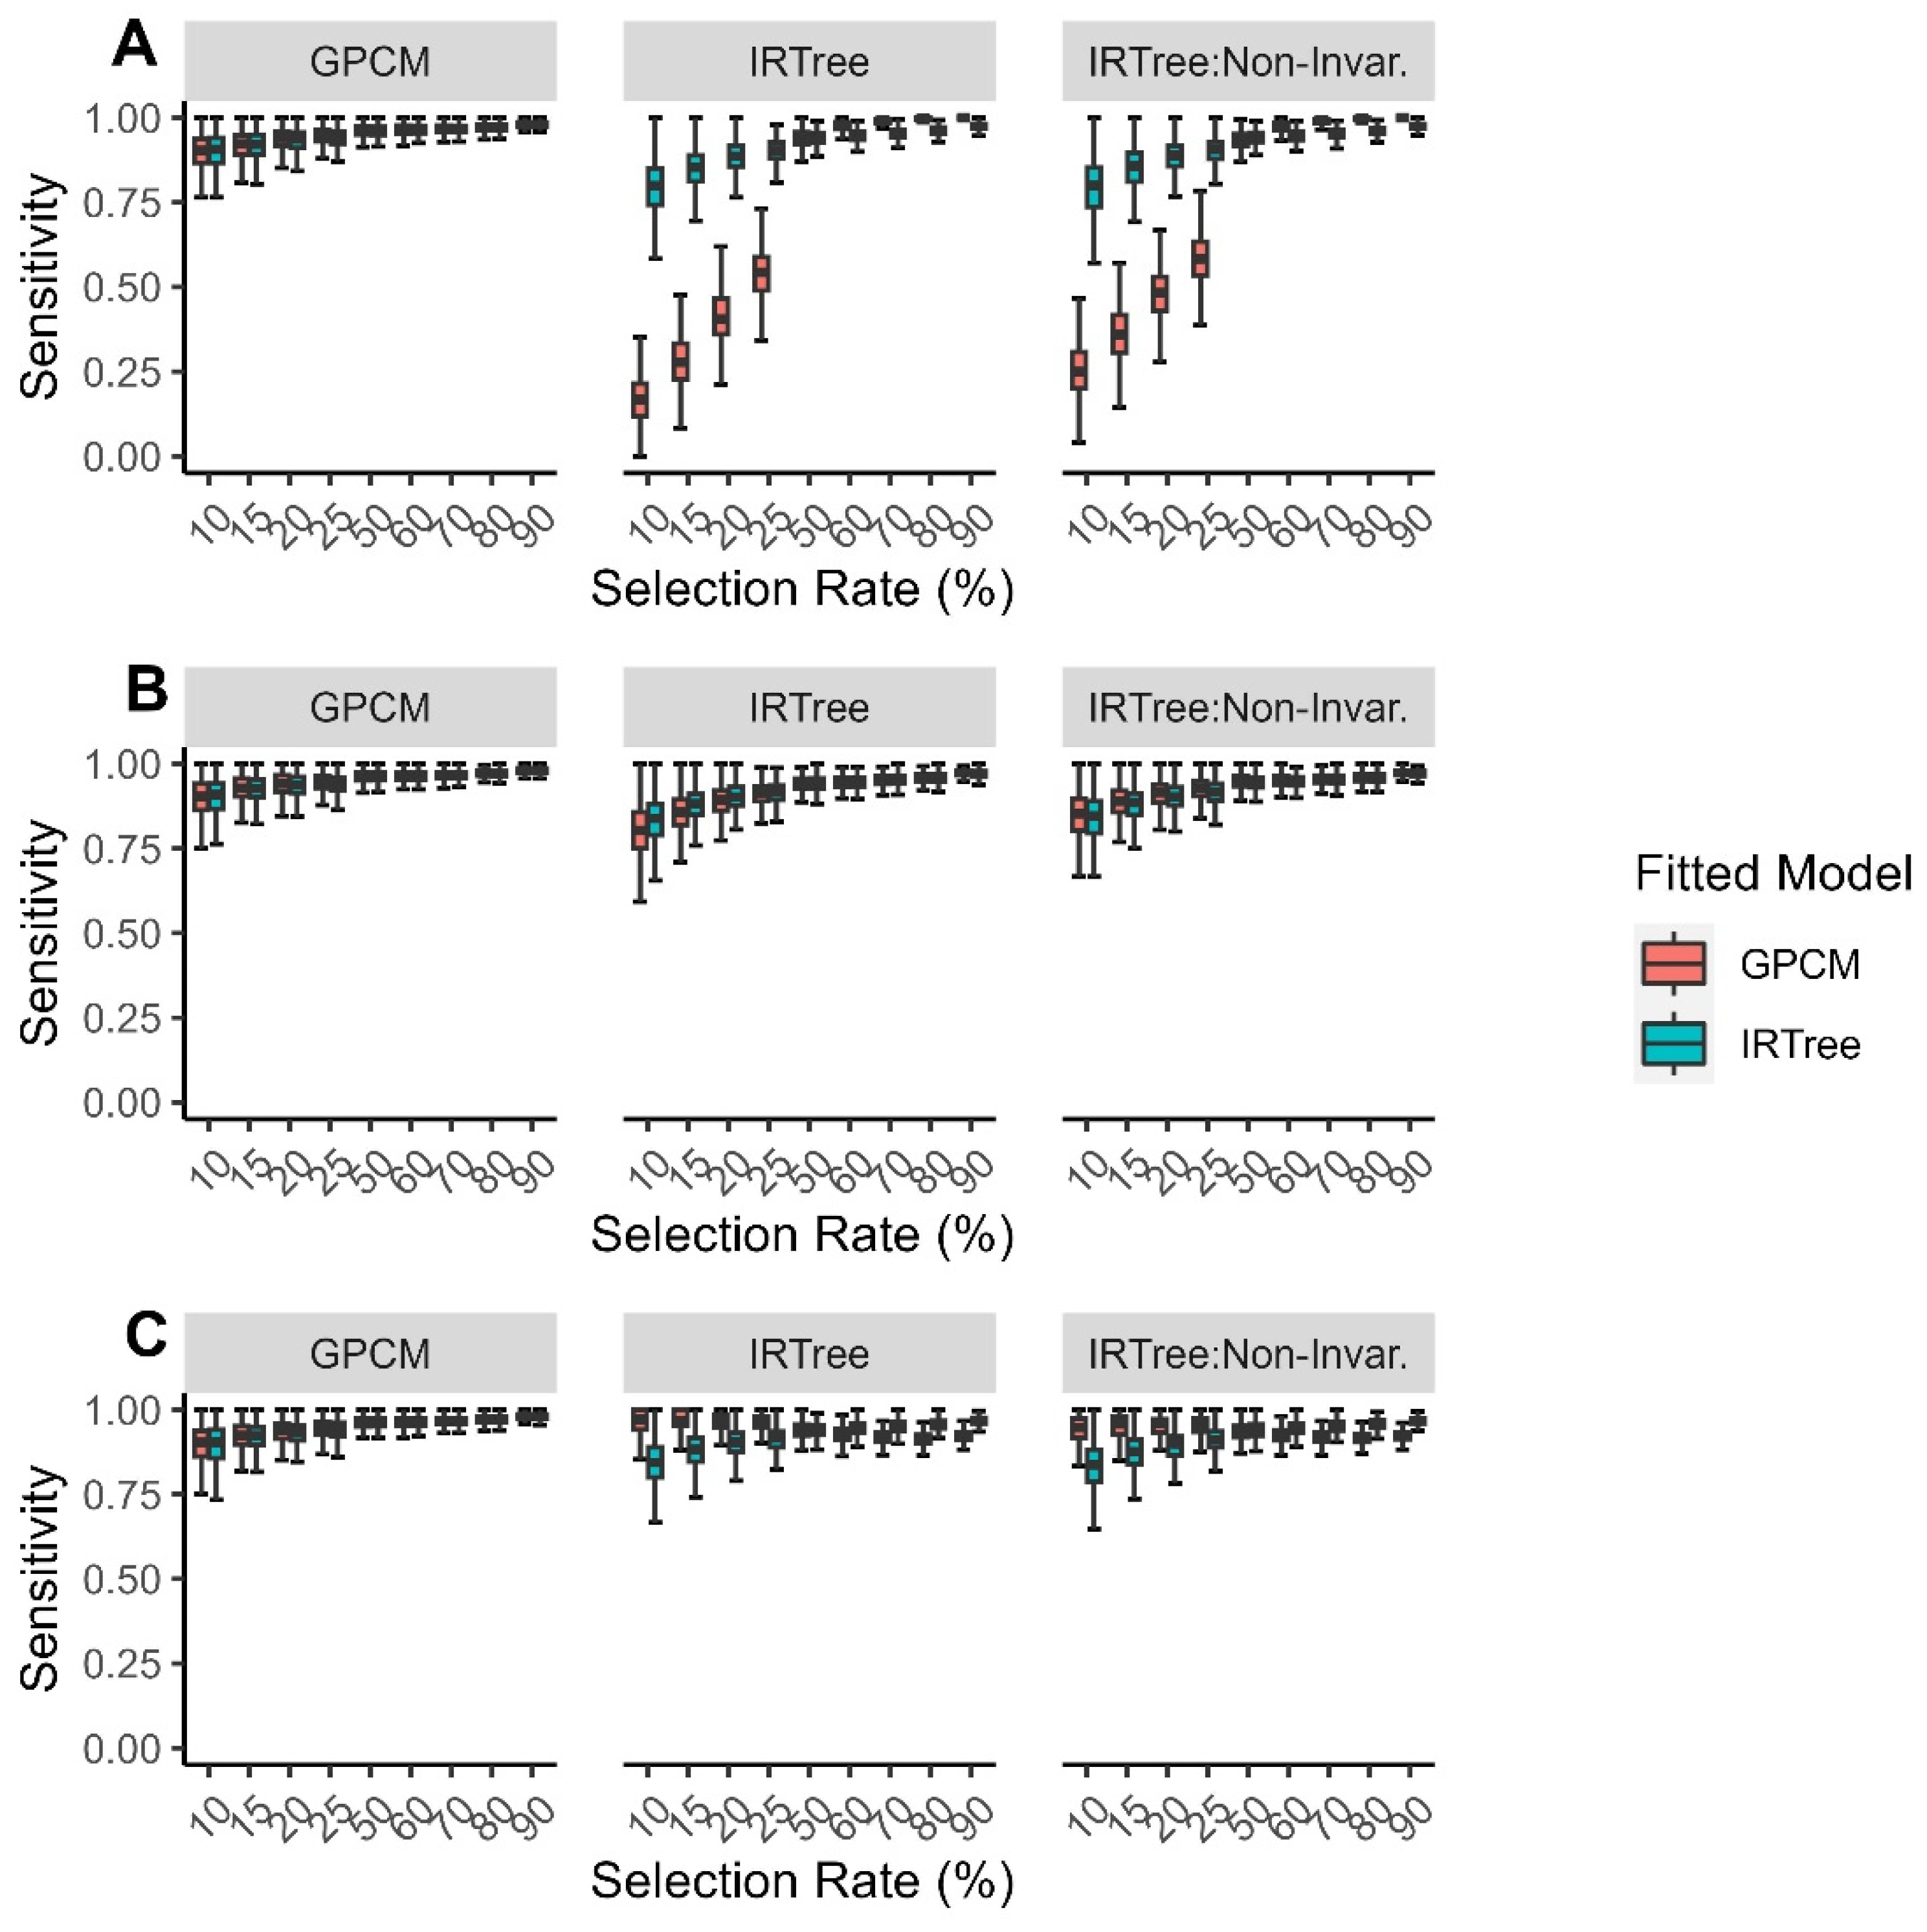
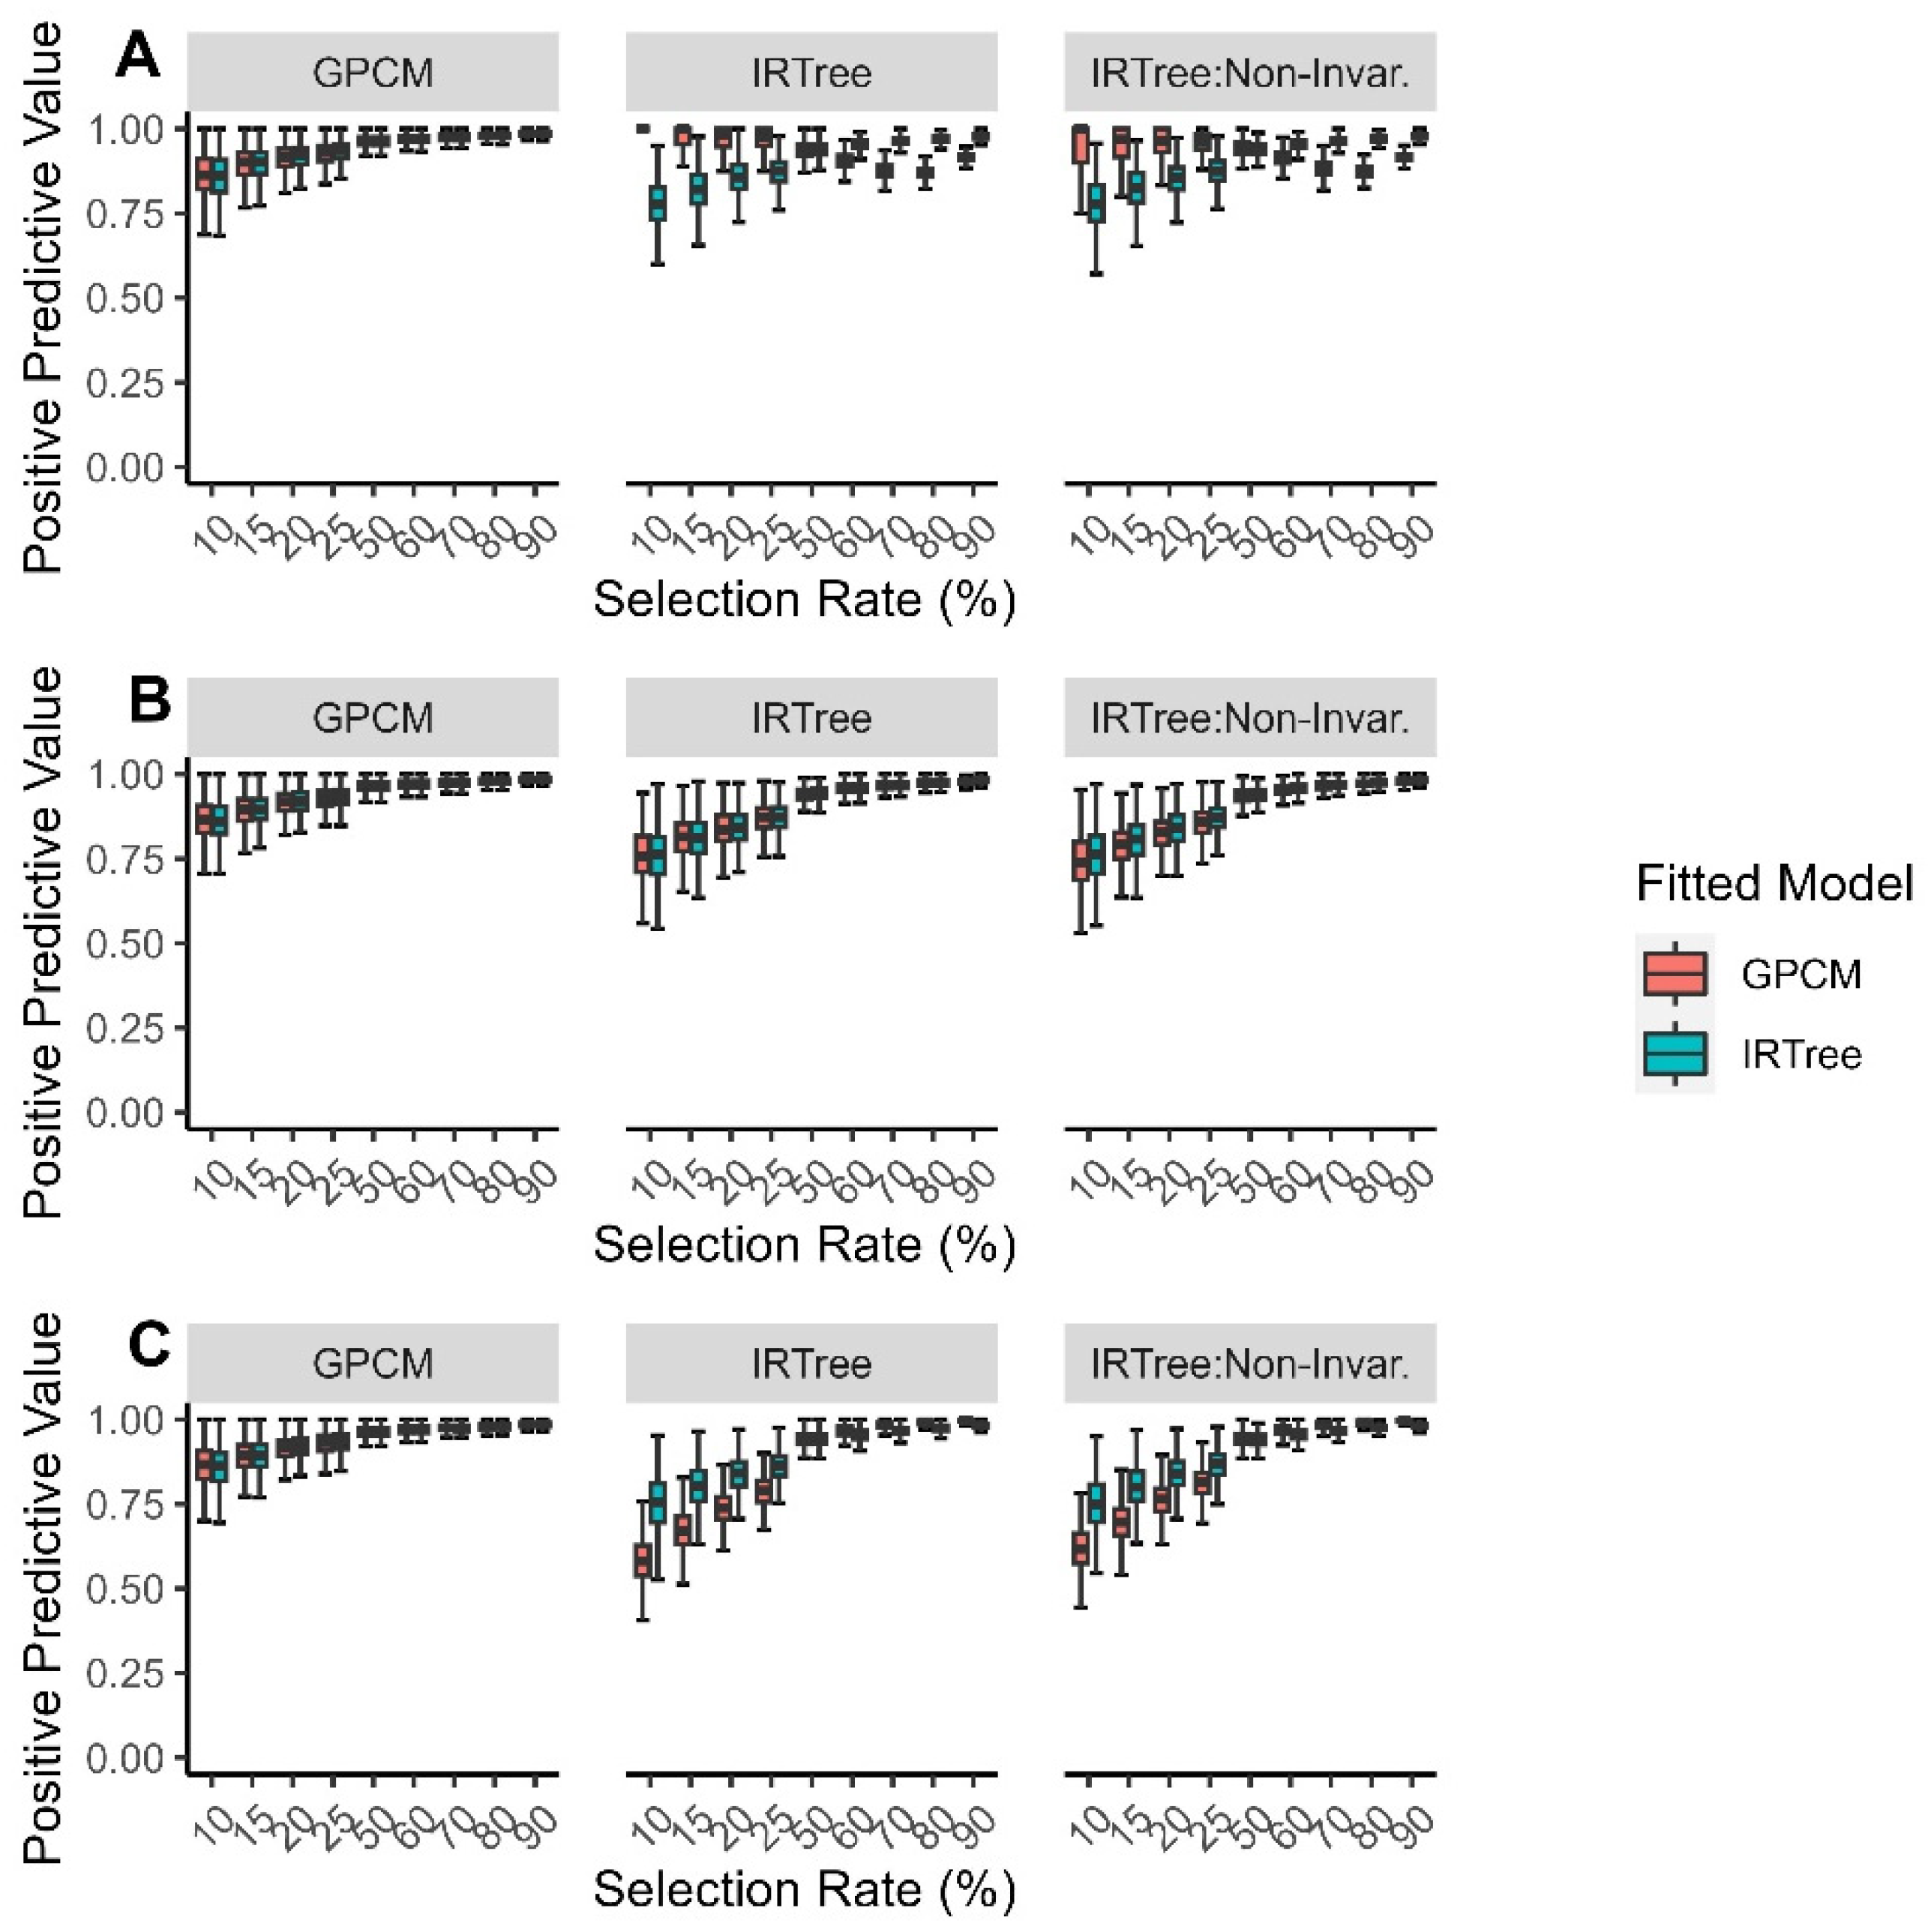
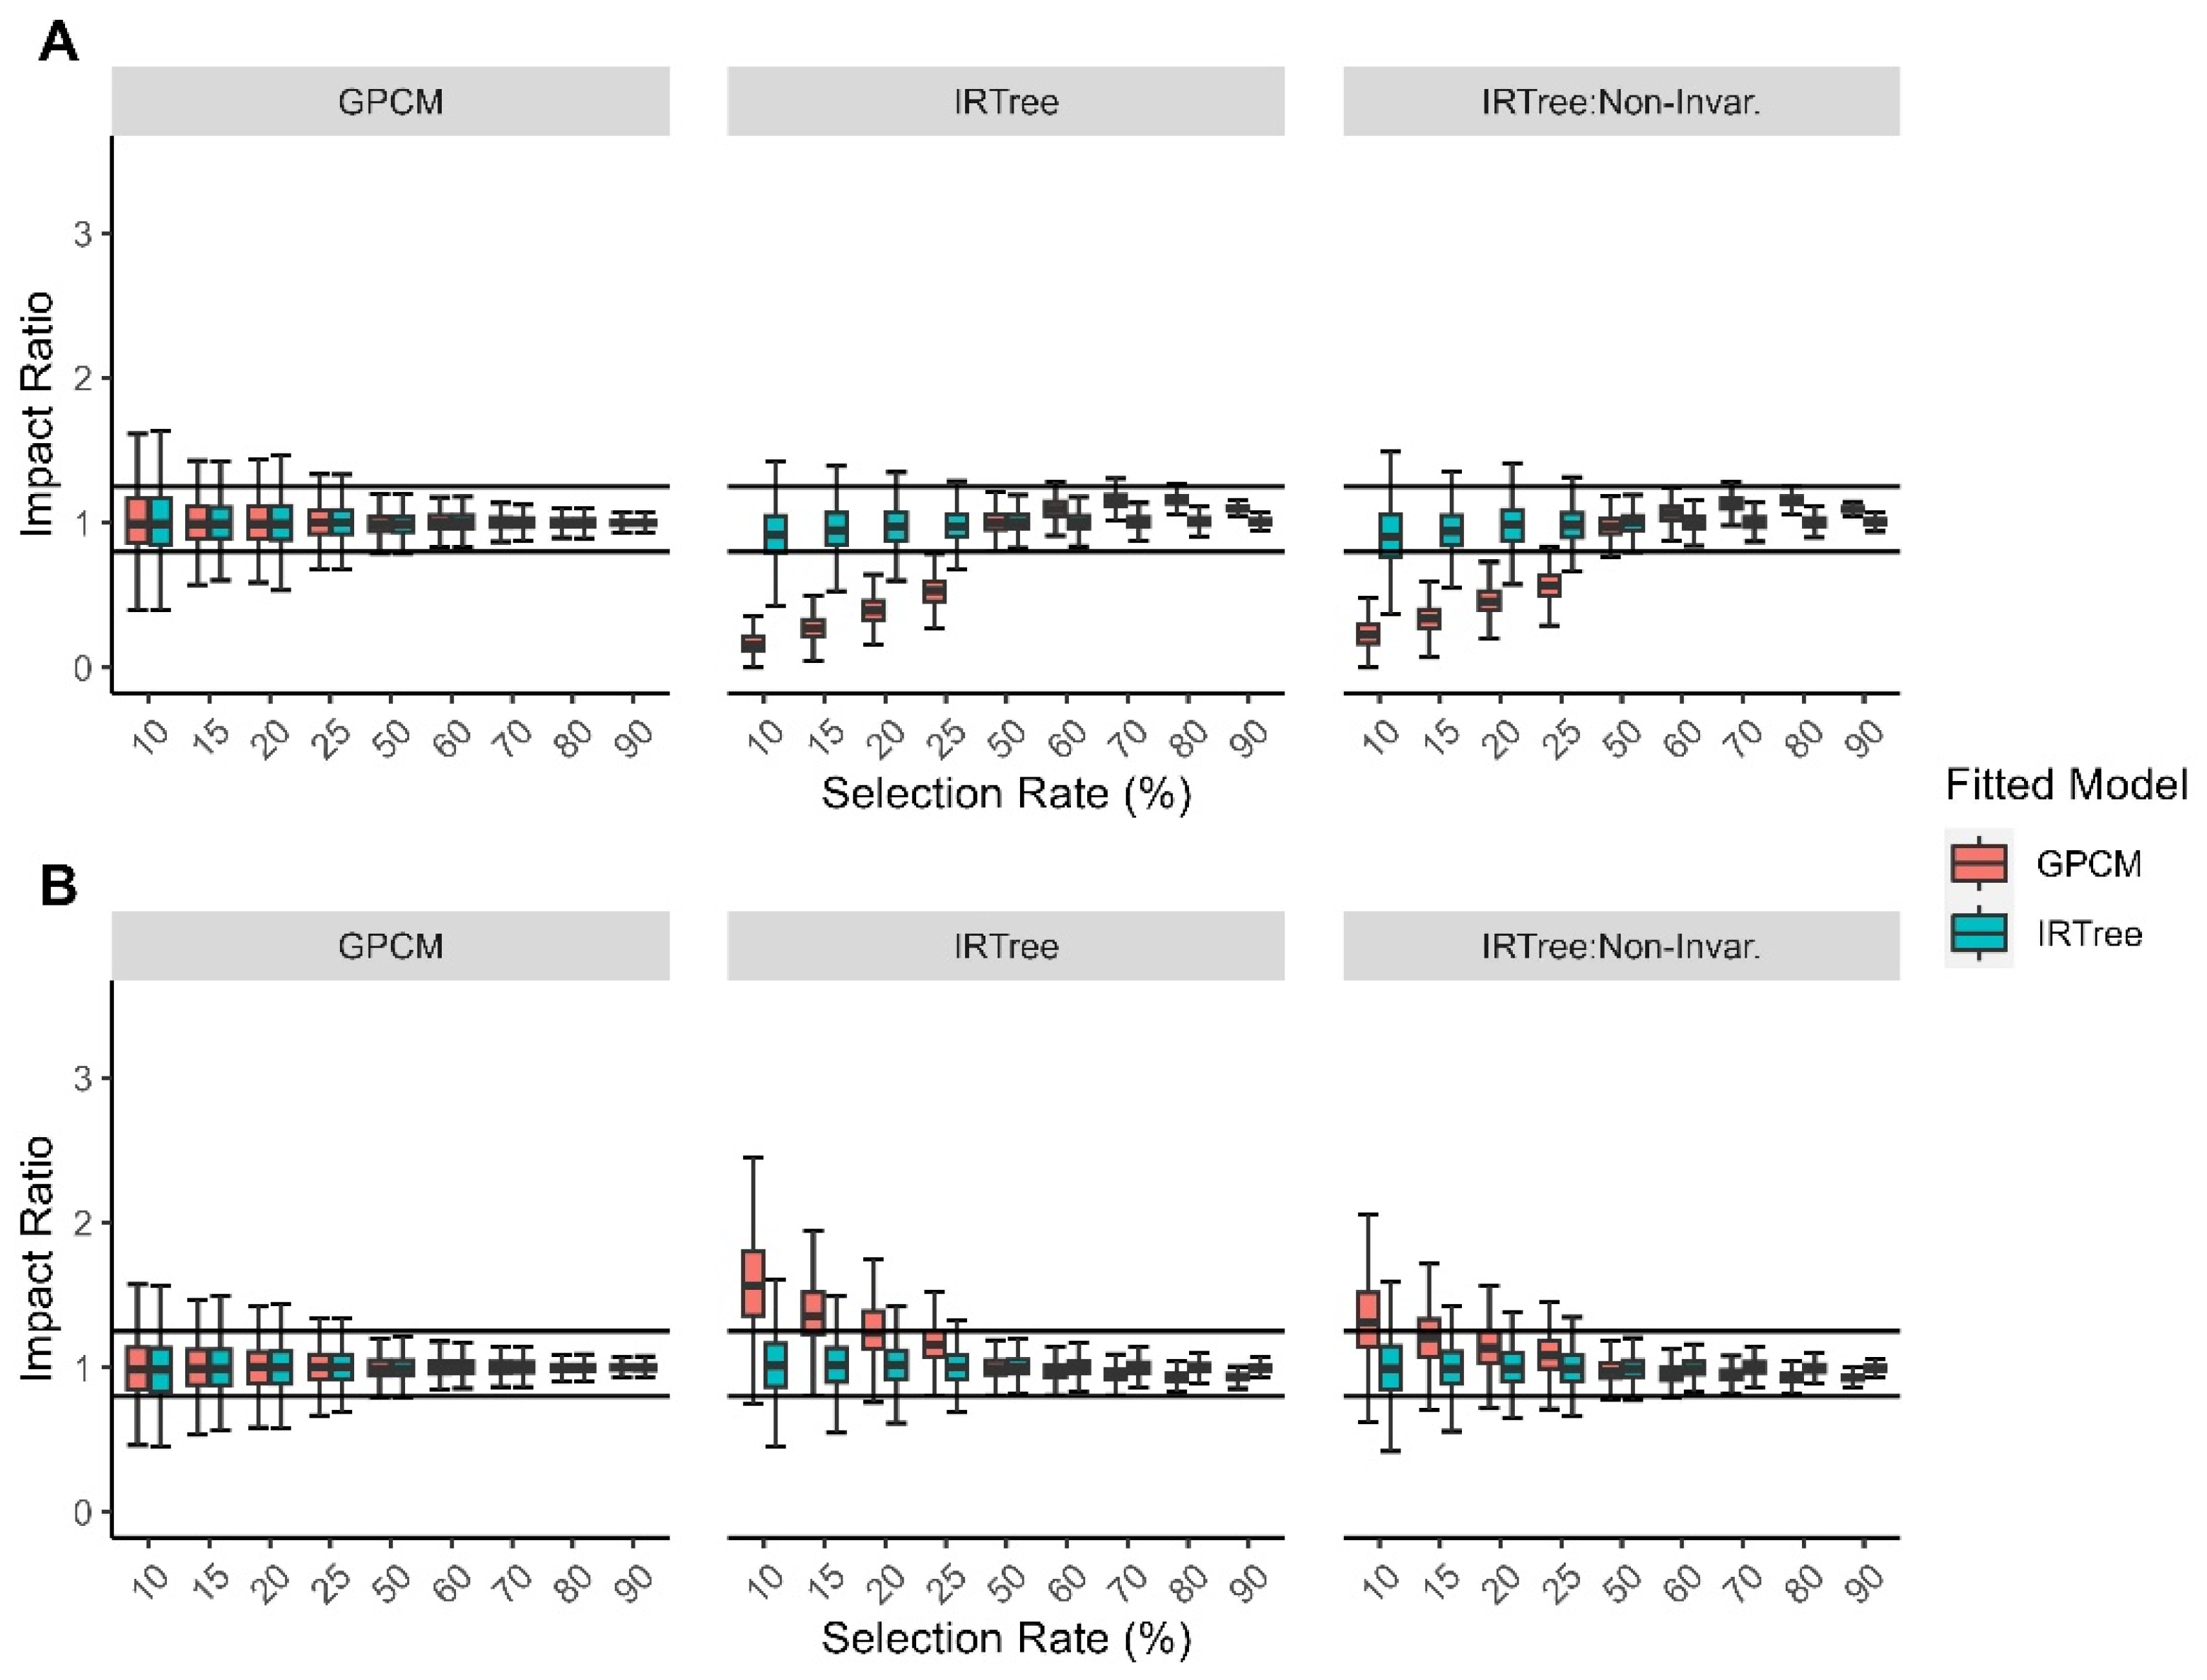
3.2. Results
3.2.1. Overall Findings
3.2.2. By Level of Extreme Response Style
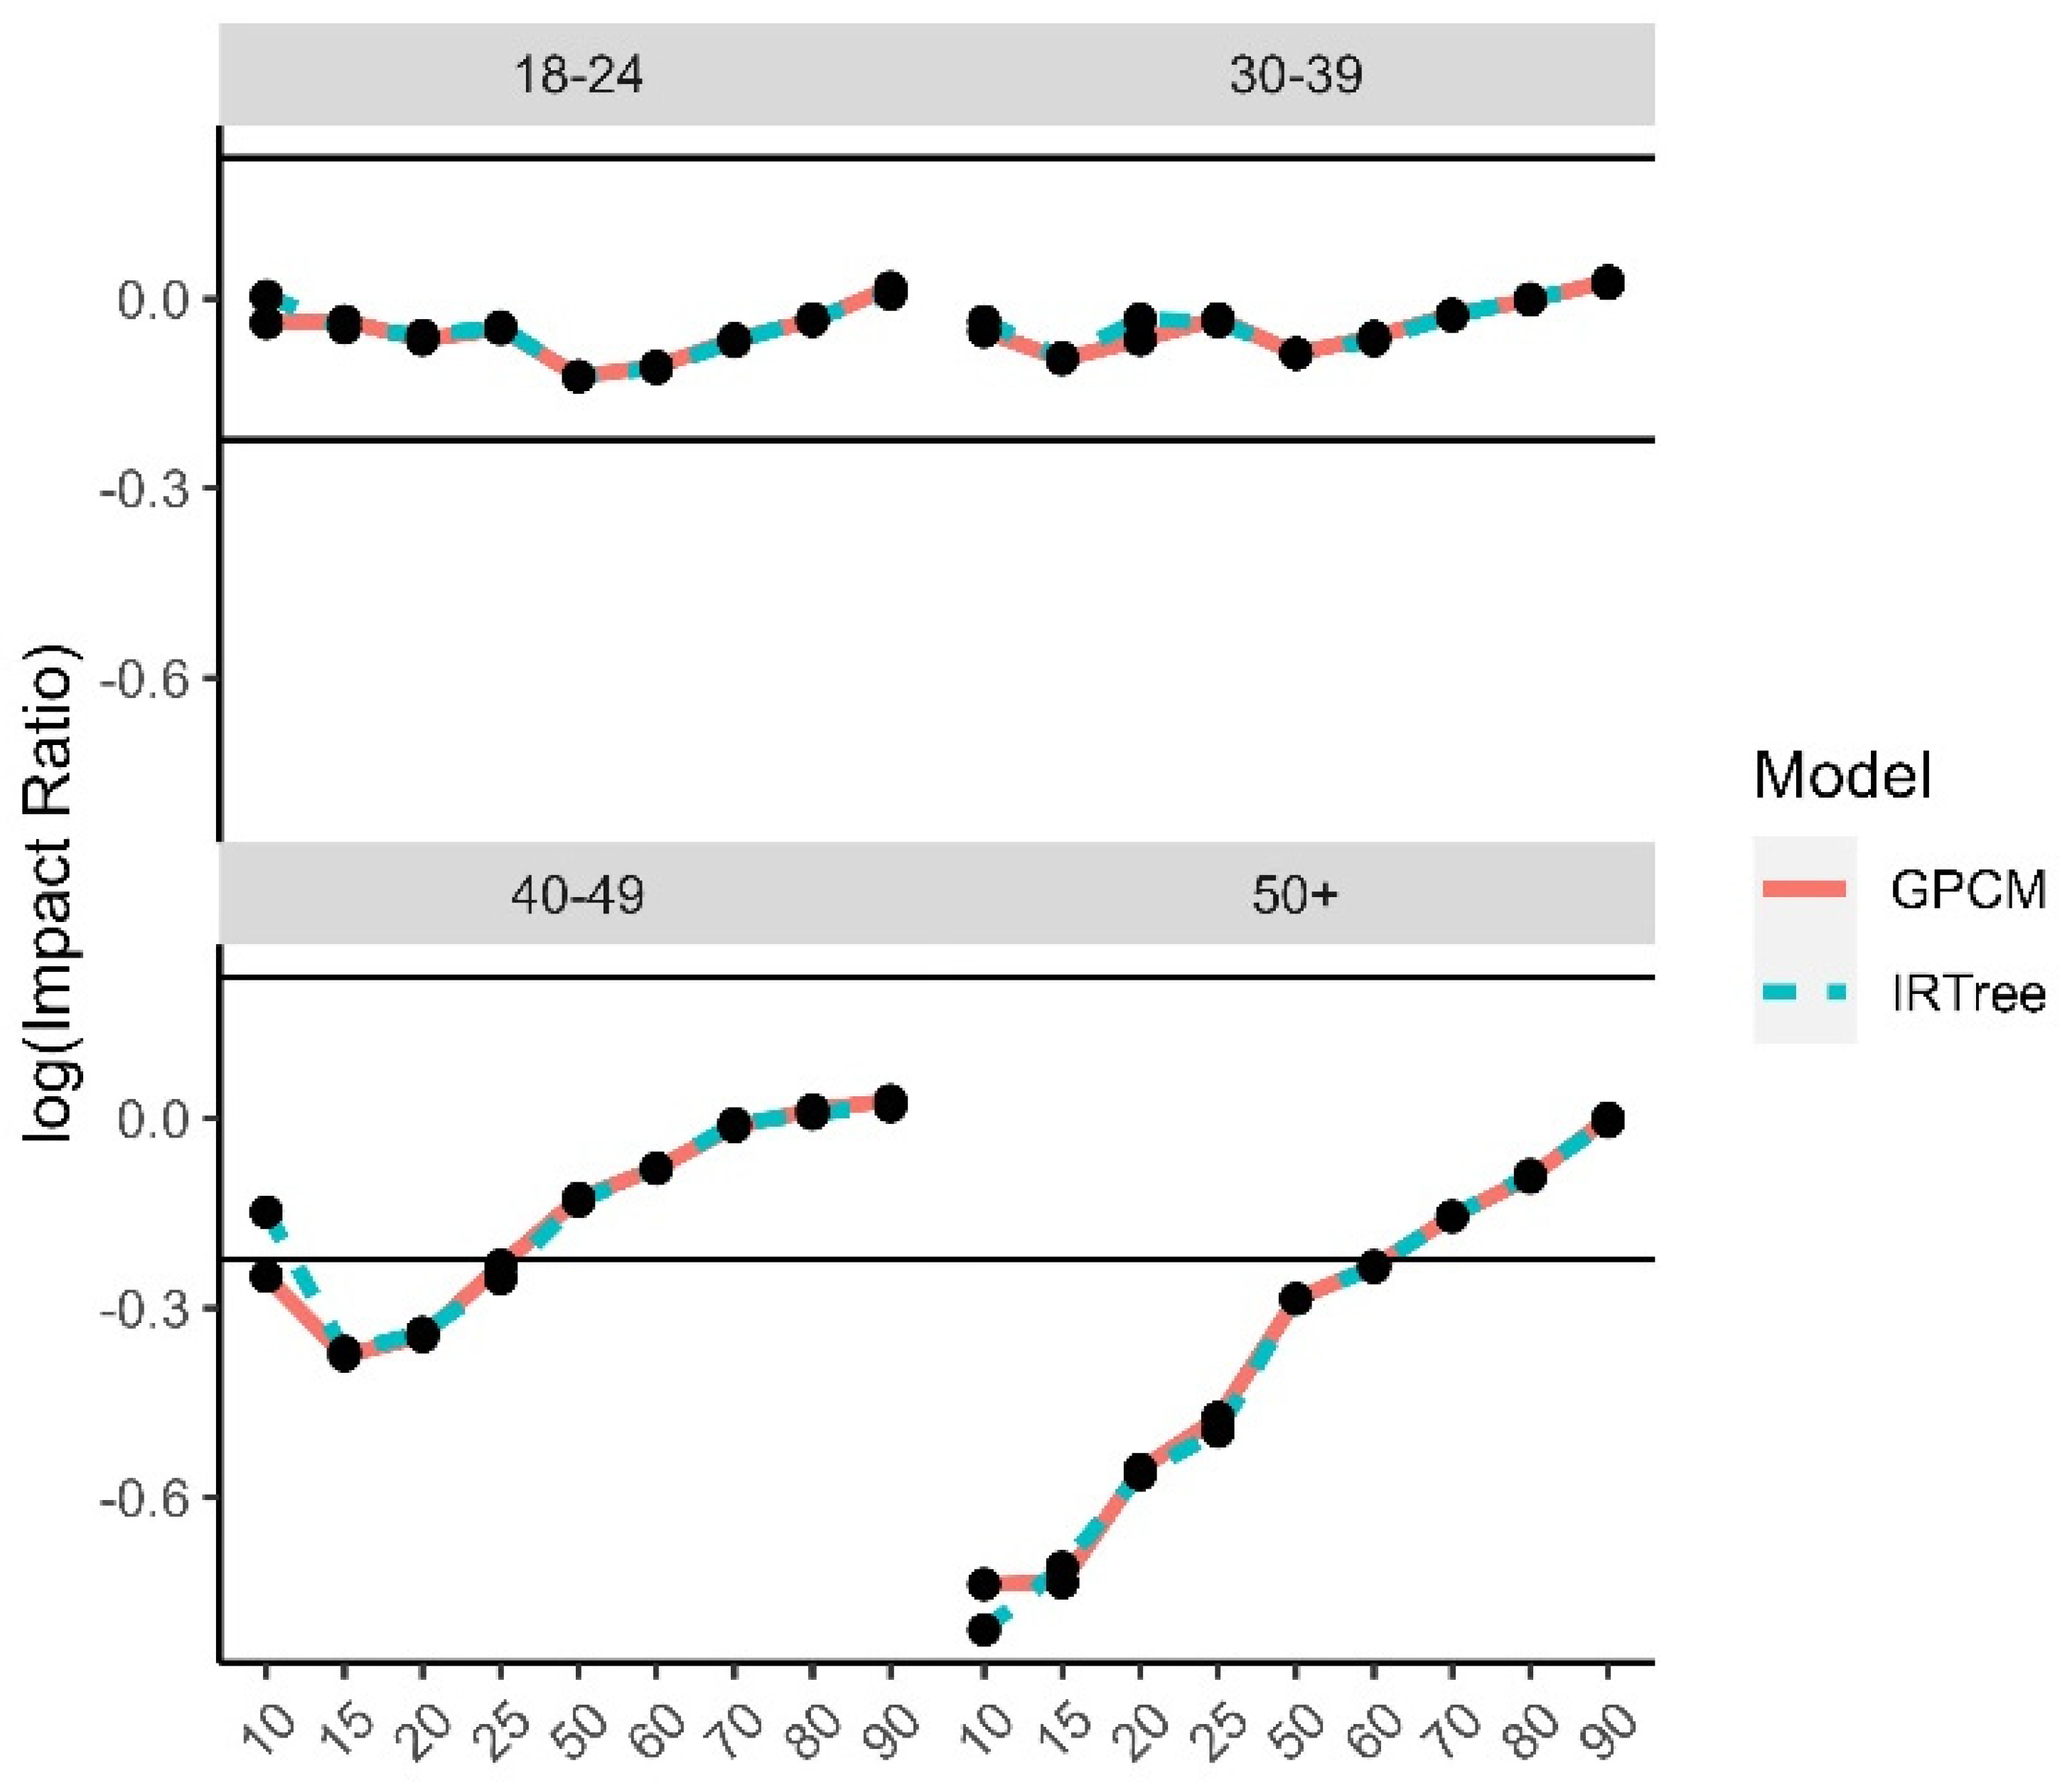
4. Application
4.1. Design
4.2. Results
4.2.1. Correlations
4.2.2. Model Fit and Scoring Comparison
4.2.3. Analysis of Variance
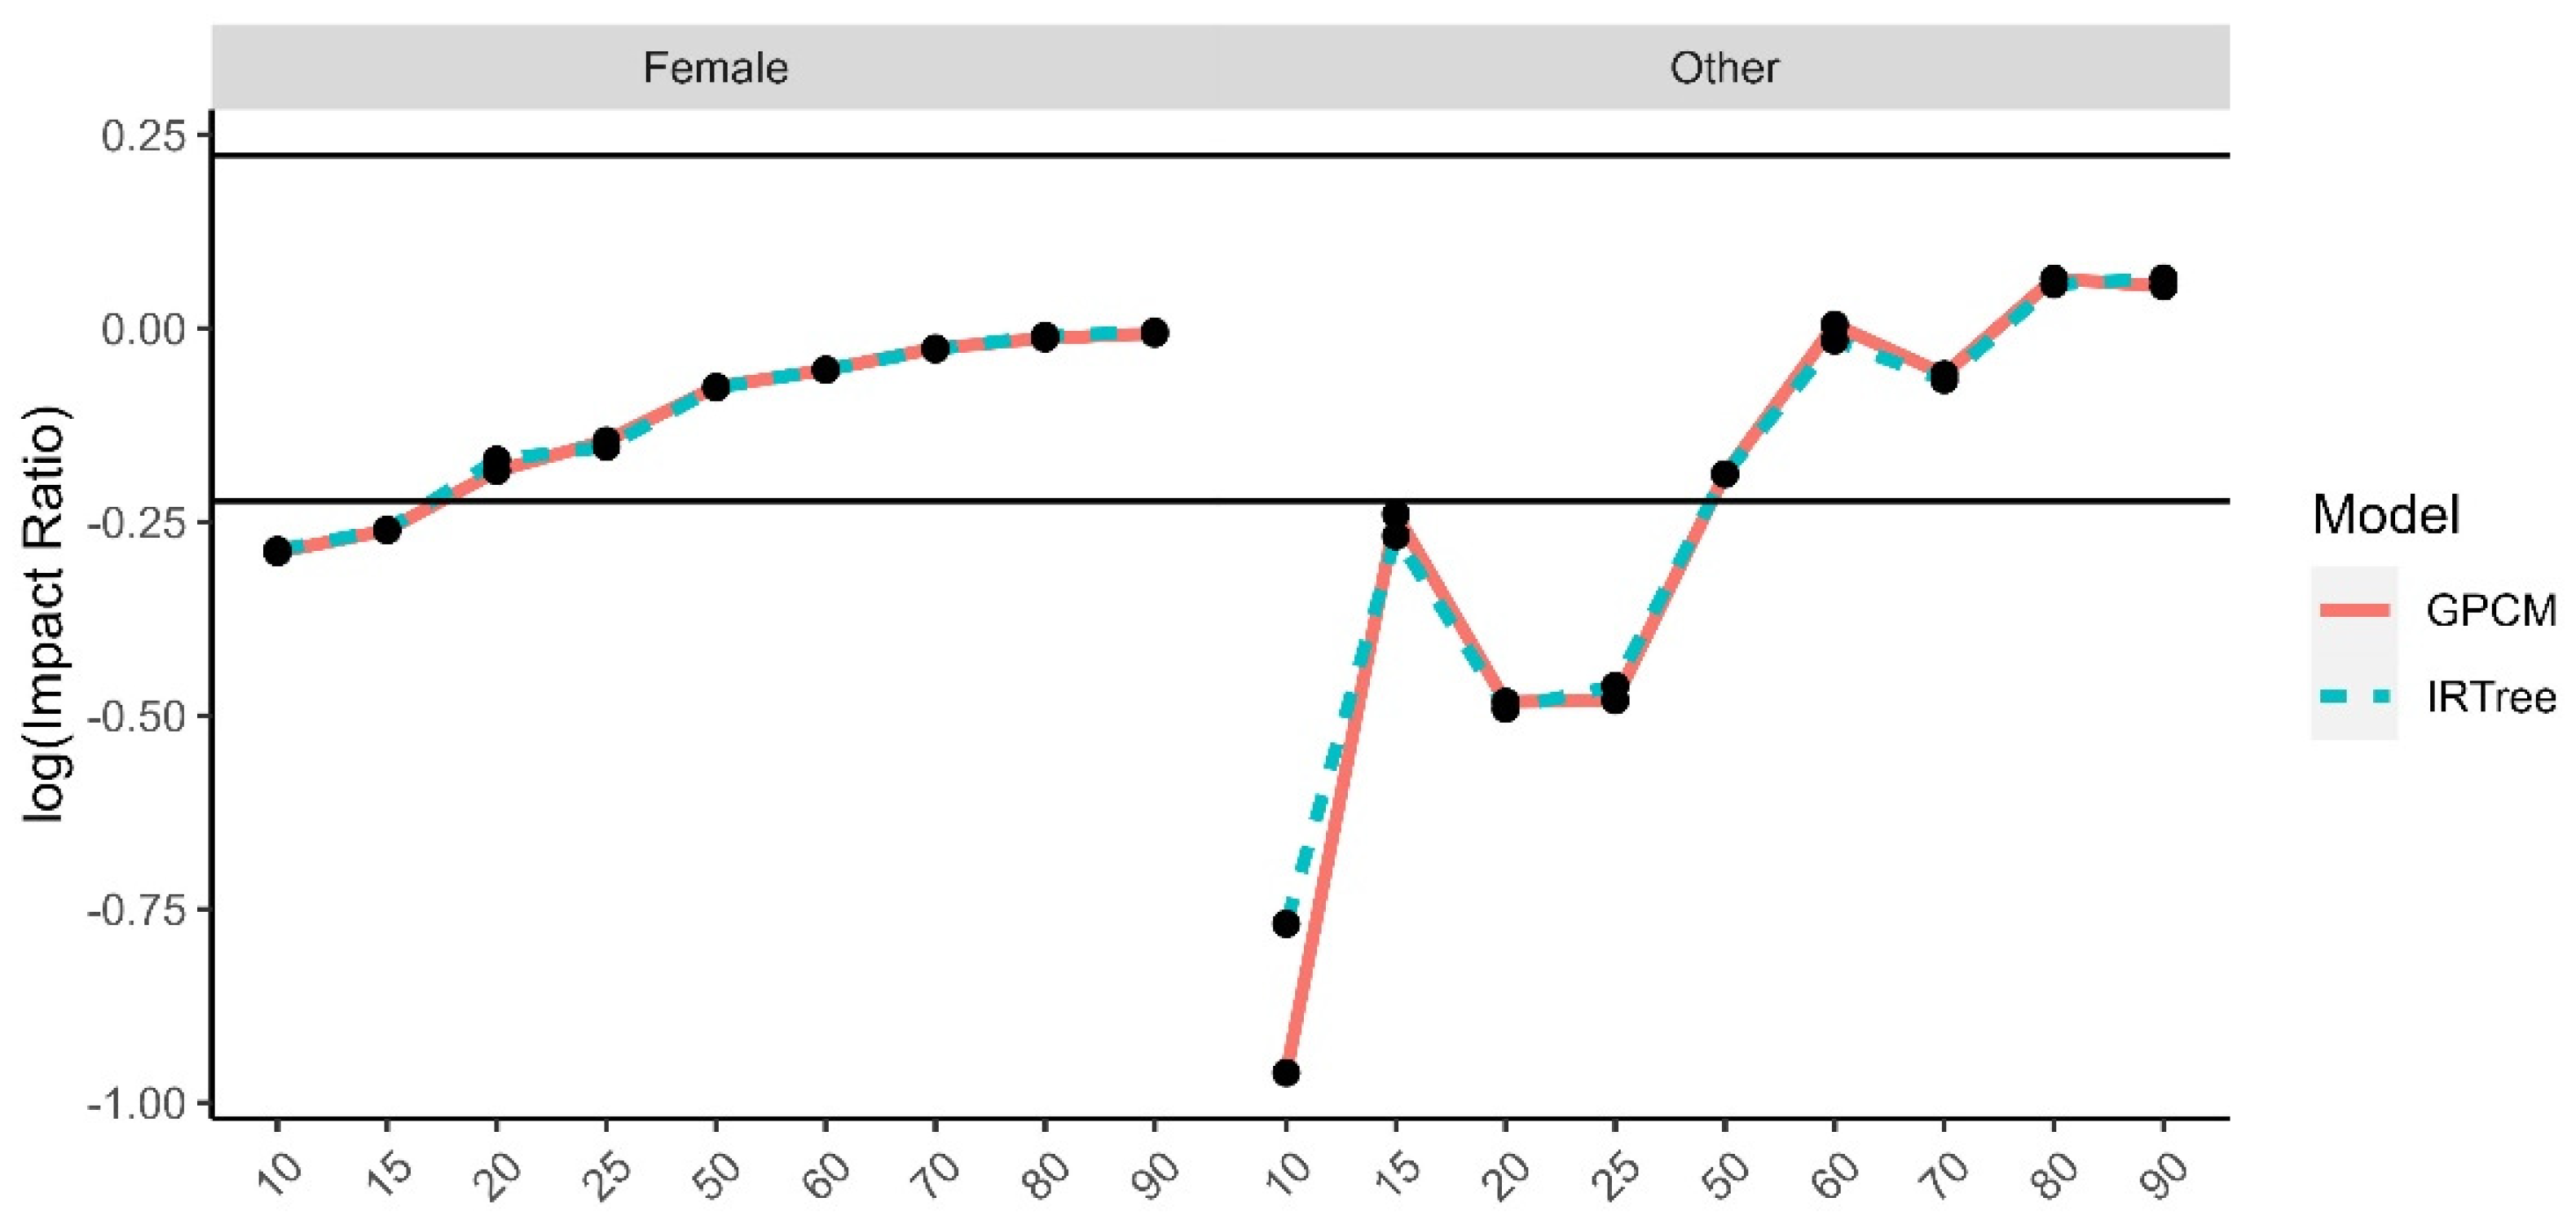
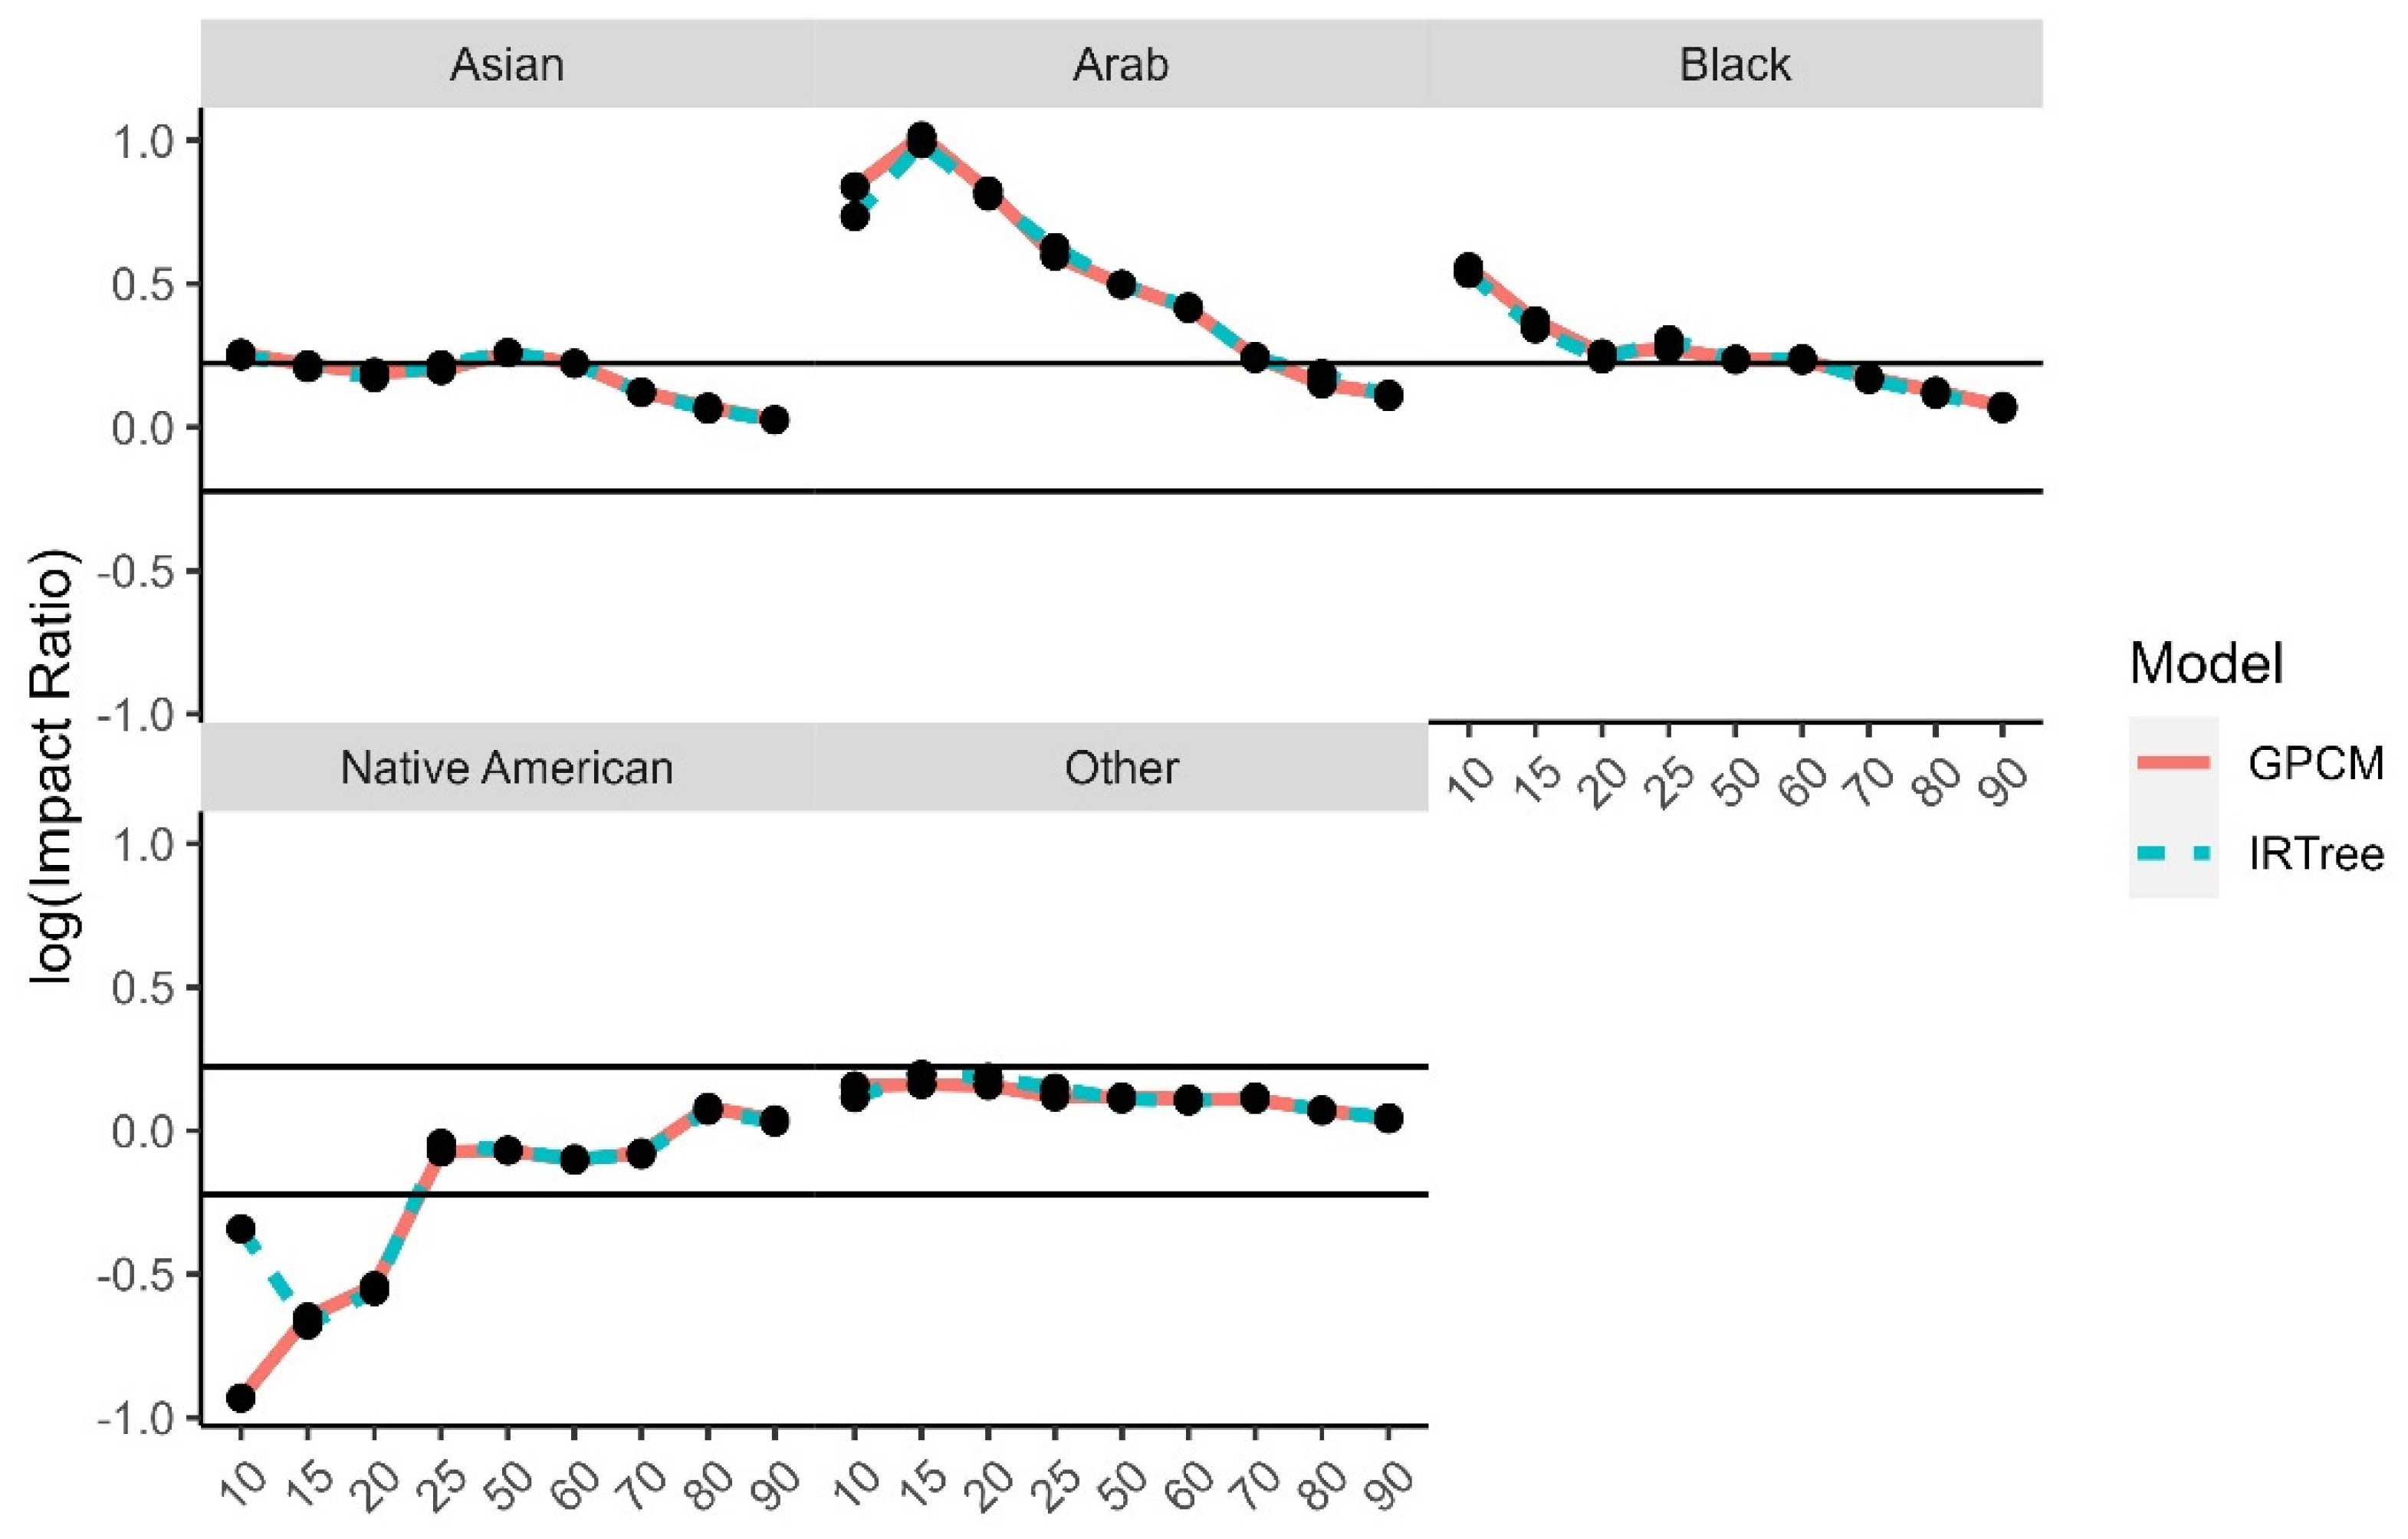
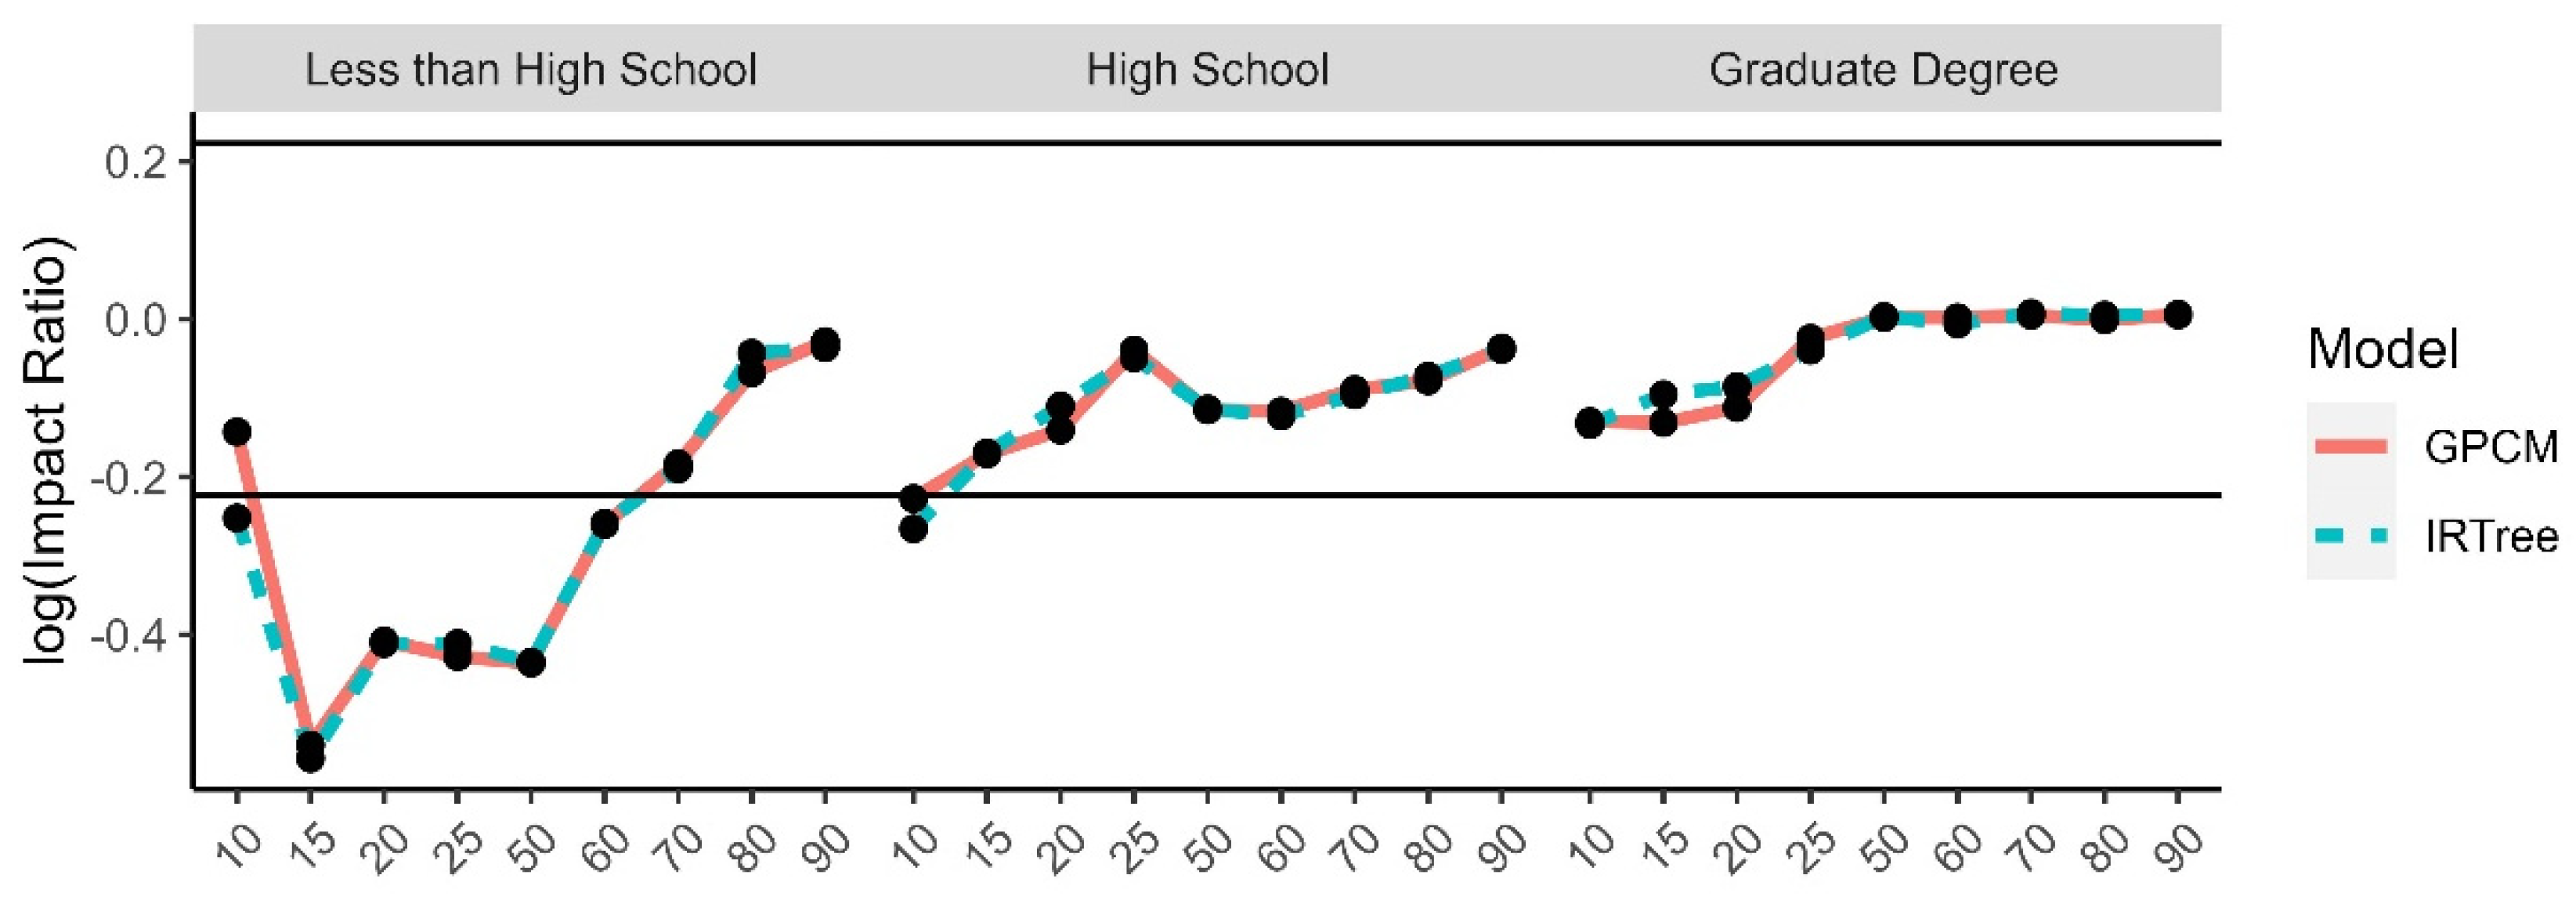
4.2.4. Adverse Impact
5. Discussion
5.1. Contributions
5.2. Limitations and Future Directions
6. Conclusions
Supplementary Materials
Author Contributions
Funding
Institutional Review Board Statement
Informed Consent Statement
Data Availability Statement
Conflicts of Interest
References
- Bachman, Jerald G., and Patrick M. O’Malley. 1984. Yea-saying, nay-saying, and going to extremes: Black-white differences in response styles. Public Opinion Quarterly 48: 491–509. [Google Scholar] [CrossRef]
- Barrick, Murray R., and Michael K. Mount. 1991. The big five personality dimensions and job performance: A meta-analysis. Personnel Psychology 44: 1–26. [Google Scholar] [CrossRef]
- Batchelor, John H., and Chao Miao. 2016. Extreme response styles: A meta-analysis. Journal of Organizational Psychology 16: 51–62. [Google Scholar]
- Battauz, Michela. 2019. On Wald tests for differential item functioning detection. Statistical Methods & Applications 28: 103–18. [Google Scholar] [CrossRef]
- Baumgartner, Hans, and Jan-Benedict E. M. Steenkamp. 2001. Response Styles in Marketing Research: A Cross-National Investigation. Journal of Marketing Research 38: 143–56. [Google Scholar] [CrossRef]
- Beaus, Jeremy M., Lindsay Y. Dhanani, and Mallory A. McCord. 2015. A meta-analysis of personality and workplace safety: Addressing unanswered questions. Journal of Applied Psychology 100: 481–98. [Google Scholar] [CrossRef]
- Böckenholt, Ulf. 2012. Modeling multiple response processes in judgment and choice. Psychological Methods 17: 665–78. [Google Scholar] [CrossRef]
- Böckenholt, Ulf. 2017. Measuring response styles in Likert items. Psychological Methods 22: 69–83. [Google Scholar] [CrossRef]
- Böckenholt, Ulf, and Thorsten Meiser. 2017. Response style analysis with threshold and multi-process IRT models: A review and tutorial. British Journal of Mathematical and Statistical Psychology 70: 159–81. [Google Scholar] [CrossRef]
- Chalmers, R. Philip. 2012. mirt: A Multidimensional Item Response Theory Package for the R Environment. Journal of Statistical Software 48: 1–29. [Google Scholar] [CrossRef]
- Civil Rights Act of 1964 § 7, 42 U.S.C. § 2000e et seq. 1964. Available online: https://www.dol.gov/agencies/oasam/centers-offices/civil-rights-center/statutes/title-vii-civil-rights-act-of-1964 (accessed on 4 August 2022).
- Cohen, Jacob. 1988. The analysis of variance and covariance. In Statistical Power Analysis for the Behavioral Sciences. New York: Routledge Academic, Chapter 8. pp. 273–406. [Google Scholar]
- Cronbach, Lee J. 1946. Response Sets and Test Validity. Educational and Psychological Measurement 6: 475–94. [Google Scholar] [CrossRef]
- Cronbach, Lee J. 1950. Further Evidence on Response Sets and Test Design. Educational and Psychological Measurement 10: 3–31. [Google Scholar] [CrossRef]
- De Boeck, Paul, and Ivailo Partchev. 2012. IRTrees: Tree-Based Item Response Models of the GLMM Family. Journal of Statistical Software 48: 1–28. [Google Scholar] [CrossRef]
- De Jong, Martijn G., Jan-Benedict E. M. Steenkamp, Jean-Paul Fox, and Hans Baumgartner. 2008. Using Item Response Theory to Measure Extreme Response Style in Marketing Research: A Global Investigation. Journal of Marketing Research 45: 104–15. [Google Scholar] [CrossRef]
- Equal Employment Opportunity Commission. 1979. Questions and answers to clarify and provide a common interpretation of the uniform guidelines on employee selection procedures. Federal Register 44: 43. [Google Scholar]
- Farrukh, Muhammad, Chong Wei Ying, and Shaheen Mansori. 2017. Organizational commitment: An empirical analysis of personality traits. Journal of Work-Applied Management 9: 18–34. [Google Scholar] [CrossRef]
- Finch, W. Holmes. 2022. The Impact and Detection of Uniform Differential Item Functioning for Continuous Item Response Models. Educational and Psychological Measurement 83: 929–52. [Google Scholar] [CrossRef] [PubMed]
- Fisher, Helen E., Jonathan Rich, Heide D. Island, and Daniel Marchalik. 2010. The second to fourth digit ratio: A measure of two hormonally-based temperament dimensions. Personality and Individual Differences 49: 773–77. [Google Scholar] [CrossRef]
- Fisher, Helen E., Heide D. Island, Jonathan Rich, Daniel Marchalik, and Lucy L. Brown. 2015. Four broad temperament dimensions: Description, convergent validation correlations, and comparison with the Big Five. Frontiers in Psychology 6: 1098. [Google Scholar] [CrossRef]
- Huang, Hung-Yu. 2016. Mixture Random-Effect IRT Models for Controlling Extreme Response Style on Rating Scales. Frontiers in Psychology 7: 1706. [Google Scholar] [CrossRef]
- Jeon, Minjeong, and Paul De Boeck. 2016. A generalized item response tree model for psychological assessments. Behavior Research Methods 48: 1070–85. [Google Scholar] [CrossRef]
- Jeon, Minjeong, and Paul De Boeck. 2019. Evaluation on types of invariance in studying extreme response bias with an IRTree approach. British Journal of Mathematical and Statistical Psychology 72: 517–37. [Google Scholar] [CrossRef] [PubMed]
- Jin, Kuan-Yu, and Wen-Chung Wang. 2014. Generalized IRT Models for Extreme Response Style. Educational and Psychological Measurement 74: 116–38. [Google Scholar] [CrossRef]
- Khorramdel, Lale, and Matthias von Davier. 2014. Measuring response styles across the big five: A multiscale extension of an approach using multinomial processing trees. Multivariate Behavioral Research 49: 161–77. [Google Scholar] [CrossRef]
- Khorramdel, Lale, Matthias von Davier, and Artur Pokropek. 2019. Combining mixture distribution and multidimensional IRTree models for the measurement of extreme response styles. British Journal of Mathematical and Statistical Psychology 72: 538–59. [Google Scholar] [CrossRef] [PubMed]
- Kim, Nana, and Daniel M. Bolt. 2021. A Mixture IRTree Model for Extreme Response Style: Accounting for Response Process Uncertainty. Educational and Psychological Measurement 81: 131–54. [Google Scholar] [CrossRef] [PubMed]
- Leventhal, Brian C. 2019. Extreme Response Style: A Simulation Study Comparison of Three Multidimensional Item Response Models. Applied Psychological Measurement 43: 322–35. [Google Scholar] [CrossRef]
- Likert, Rensis. 1932. A technique for the measurement of attitudes. Archives of Psychology 22: 55. [Google Scholar]
- Meiser, Thorsten, Hansjörg Plieninger, and Mirka Henninger. 2019. IRTree models with ordinal and multidimensional decision nodes for response styles and trait-based rating responses. British Journal of Mathematical and Statistical Psychology 72: 501–16. [Google Scholar] [CrossRef]
- Mueller-Hanson, Rose, Eric D. Heggestad, and George C. Thornton III. 2003. Faking and selection: Considering the use of personality from select-in and select-out perspectives. Journal of Applied Psychology 88: 348–55. [Google Scholar] [CrossRef]
- Muraki, Eiji. 1992. A generalized partial credit model: Application of an EM algorithm. ETS Research Report Series 16: 159–76. [Google Scholar]
- Ng, Eddy S.W., and Greg J. Sears. 2010. The effect of adverse impact in selection practices on organizational diversity: A field study. The International Journal of Human Resource Management 21: 1454–71. [Google Scholar] [CrossRef]
- Park, Minjeong, and Amery D. Wu. 2019. Item Response Tree Models to Investigate Acquiescence and Extreme Response Styles in Likert-Type Rating Scales. Educational and Psychological Measurement 79: 911–30. [Google Scholar] [CrossRef] [PubMed]
- Plieninger, Hansjörg. 2017. Mountain or Molehill? A Simulation Study on the Impact of Response Styles. Educational and Psychological Measurement 77: 32–53. [Google Scholar] [CrossRef] [PubMed]
- Schimmack, Ulrich, Ulf Böckenholt, and Rainer Reisenzein. 2002. Response Styles in Affect Ratings: Making a Mountain Out of a Molehill. Journal of Personality Assessment 78: 461–83. [Google Scholar] [CrossRef] [PubMed]
- Tijmstra, Jesper, Maria Bolsinova, and Minjeong Jeon. 2018. General mixture item response models with different item response structures: Exposition with an application to Likert scales. Behavior Research Methods 50: 2325–44. [Google Scholar] [CrossRef]
- Uniform Guidelines on Employee Selection Procedures, 29 C.F.R. § 1607. 1978. Available online: https://www.govinfo.gov/content/pkg/CFR-2011-title29-vol4/xml/CFR-2011-title29-vol4-part1607.xml (accessed on 4 August 2022).


| Node Response | |||
|---|---|---|---|
| Selected Response | |||
| Selected | Not Selected | |
|---|---|---|
| Focal Group | ||
| Reference Group |
| Age | ||||
|---|---|---|---|---|
| -- | ||||
| .98 | -- | |||
| .15 | .05 | -- | ||
| Age | −.06 | −.05 | −.16 | -- |
| AIC | BIC | |
|---|---|---|
| IRTree | ||
| GPCM |
Disclaimer/Publisher’s Note: The statements, opinions and data contained in all publications are solely those of the individual author(s) and contributor(s) and not of MDPI and/or the editor(s). MDPI and/or the editor(s) disclaim responsibility for any injury to people or property resulting from any ideas, methods, instructions or products referred to in the content. |
© 2023 by the authors. Licensee MDPI, Basel, Switzerland. This article is an open access article distributed under the terms and conditions of the Creative Commons Attribution (CC BY) license (https://creativecommons.org/licenses/by/4.0/).
Share and Cite
Quirk, V.L.; Kern, J.L. Using IRTree Models to Promote Selection Validity in the Presence of Extreme Response Styles. J. Intell. 2023, 11, 216. https://doi.org/10.3390/jintelligence11110216
Quirk VL, Kern JL. Using IRTree Models to Promote Selection Validity in the Presence of Extreme Response Styles. Journal of Intelligence. 2023; 11(11):216. https://doi.org/10.3390/jintelligence11110216
Chicago/Turabian StyleQuirk, Victoria L., and Justin L. Kern. 2023. "Using IRTree Models to Promote Selection Validity in the Presence of Extreme Response Styles" Journal of Intelligence 11, no. 11: 216. https://doi.org/10.3390/jintelligence11110216
APA StyleQuirk, V. L., & Kern, J. L. (2023). Using IRTree Models to Promote Selection Validity in the Presence of Extreme Response Styles. Journal of Intelligence, 11(11), 216. https://doi.org/10.3390/jintelligence11110216