Article

Spatial and Temporal Validation of a CFD Model Using Residence Time Distribution Test in a Tubular Reactor

by
José Rivas
1,
M. Constanza Sadino-Riquelme
2,
Ignacio Garcés
1,
Andrea Carvajal
1 and
Andrés Donoso-Bravo
1,3,*
1
Departamento de Ingeniería Química y Ambiental, Universidad Técnica Federico Santa María, Santiago 8940833, Chile
2
Department of Chemical and Materials Engineering, University of Alberta, Edmonton, AB T6G 2R3, Canada
3
CETAQUA, Las Condes, Santiago 7570898, Chile
*
Author to whom correspondence should be addressed.
Computation 2020, 8(4), 94; https://doi.org/10.3390/computation8040094
Submission received: 29 October 2020 / Accepted: 2 November 2020 / Published: 6 November 2020
(This article belongs to the Section Computational Chemistry)

Abstract

:
Computational fluid dynamic (CFD) has been increasingly exploited for the design and optimization of (bio)chemical processes. Validation is a crucial part of any modeling application. In CFD, when validation is done, complex and expensive techniques are normally employed. The aim of this study was to test the capability of the CFD model to represent a residence time distribution (RTD) test in a temporal and spatial fashion inside a reactor. The RTD tests were carried out in a tubular reactor operated in continuous mode, with and without the presence of artificial biomass. Two hydraulic retention times of 7.2 and 13 h and superficial velocities 0.65, 0.6, 1.3, and 1.1 m h−1 were evaluated. As a tracer, an aqueous solution of methylene blue was used. The CFD model was implemented in ANSYS Fluent, and to solve the equations system, the SIMPLE scheme and second-order discretization methods were selected. The proposed CFD model that represents the reactor was able to predict the spatial and temporal distribution of the tracer injected in the reactor. The main disagreements between the simulations and the experimental results were observed, especially in the first 50 min of the RTD, caused by the different error sources, associated to the manual execution of the triplicates, as well as some channeling or tracer by-pass that cannot be predicted by the CFD model. The CFD model performed better as the time of the experiment elapsed for all the sampling ports. A validation methodology based on an RTD by sampling at different reactor positions can be employed as a simple way to validate CFD models.

1. Introduction

Computational fluid dynamic (CFD) has been increasingly employed to describe all the phenomena that takes place in a (bio)chemical reactor. The three-dimensional (3D) representation of a reactor involves the mathematical representation of mass, heat, and momentum phenomena that results in a set of coupled non-linear partial differential equations (PDEs) to be solved. CFD can be considered as a combination of conservation laws, advanced mathematics, and computer science. In process engineering, CFD is being currently used mainly to reactor design optimization and to improve the mixing.
Model validations against experimental data are key steps in the process of making a model reliable so that it can be used in a full-scale application [1]. One of the main challenges facing CFD modeling validation is to count with a proper, affordable, and reliable procedure. In (bio)chemical process, methods such as radioactive particle tracking (RPT) [2], particle image velocimetry (PIV) by fluorescence [3,4], particle image velocimetry by laser [5,6], online photometry of the reactor media [7], and electrical resistance tomography [8,9,10] have been reported. The PIV methodologies, which are one of the most used, yield online results in 2D from the reactor/domain. PIV allows us to measure the velocity field at a specific plane in time; thus, the CFD model is validated by comparing the steady-state contour velocities, obtained from the simulations, with the time-averaged experimental results for the same plane. Similar validation methodology is used for the electrical resistance tomography, but, in this case, 3D fields are compared. In the case of the online photometry, an online probe measures the opacity between of the fluid between a light emitter and a sensor, obtaining a mixing curve. This curve is compared with a mixing curve obtained from the CFD model. In most of these techniques, complex lab-schemes, expensive reagents, sensors, and transparent vessels are required, making these techniques impractical to be implemented in real applications.
Residence time distribution (RTD) test is a well-known methodology employed to characterize experimentally the fluid dynamic of a reactor. In the context of water and wastewater treatment, it is estimated that around 4% of the validation of CFD model is carried out by RTD collection data [11,12]. More specifically, it has been used for solid–liquid phase reactor, such as trickle bed reactor [13] or fluidized reactor [14], as well as wastewater treatment systems, such as pond lagoon [15] and activated sludge systems [16]. In all cases, the CFD simulation of the outlet tracer concentration is compared to the experimental measured values [17]. In the traditional analysis, the theory of this methodology is based on the probability distribution of the concentration of the tracer quantified in the outlet. By analyzing the shape of the distribution curve, some non-ideal mixing, such as dead zones and bypassing paths, may be inferred. RTD is a simple, economic, and reliable experimental methodology that does not require transparent vessels. Nevertheless, the outcome of the experiment does not yield insight into the flow field and its spatial distribution. Having information regarding the flow field inside the reactor gives us insight about the properties of the mixing of a reactor. The aim of the study is to evaluate the capability of a CFD model in reproducing the spatial and temporal trajectory of a tracer in an RTD test in a tubular reactor with and without a packed bed (mimicking the presence of artificial biomass). This type of reactor and its variations are widely used in wastewater treatment, namely UASB, filter and plug-flow reactors in anaerobic digestion, biotrickling, and packed bed reactor in aerobic and nitrification/denitrification process.

2. Materials and Methods

2.1. Reactor Setup and Experimental Design

A Plexiglas tubular reactor with a total height of 0.961 m and a thickness of 3 mm, with a working volume of 2.02 L of water, was used (Figure 1a). The reactor has a cylindrical region in the lower part, with a ratio HL/DL (height and diameter) equivalent to 19.8 (HL = 0.8697 m), and its upper part consists of a widening of the cylinder with a proportion Hu/Du equal to 0.67 (Hu = 0.07 m). A recirculation line is placed at the upper part of the cylinder, at the same height of the effluent outlet (SP4). The liquid that is recirculated is mixed with the feed flow, and the resulting mixture inlets to the reactor though the side ports place at its bottom (side ports diameter 0.008 m). The recirculation has a length of approximately 1.2 m, providing inside a volume of 0.06 L. The reactor was designed with 4 sampling points along the height (at 0.26, 0.46, 0.67, and 0.915 m, named SP1, SP2, SP3 and SP4, respectively), in which a needle was adapted to take the samples from the center of the reactor. Spheres with a diameter of 6 mm were fixed in the lower part of the reactor, to provide a homogeneous mixing of the fluid, and to create channels that help to enhance the homogeneous mixing of the fluid. The spheres fill an approximate height of 5 × 10⁻² m and remain fixed based on their weight.
In order to emulate the presence of biomass (called A-biomass hereafter), solid rectangular silicone pieces (density 1030 kg m−3 and De Brouckere mean diameter of 2.5 × 10⁻³ m). Initially, the pieces were set as a particle bed of 0.15 m height, behaving like a fluidized bed within the same designated region. The reactor was operated in continuous mode, using distilled water, under the conditions described in Table 1, where the recirculation and inlet from the general boundary conditions correspond to the outlet velocity at the recirculation port (in the upper part of the reactor), and the inlet velocity at the side ports (in the bottom part of the reactor), respectively.
Once three residence times had elapsed, it was considered that the flow inside the reactor was in steady state, and 3 mL of tracer was injected into the feed flow. The tracer injection procedure took around 10 s. Methylene blue, at a concentration of 1000 ppm, was used as tracer. After the injection, samples were taken, manually, at different time intervals during 200 min. During the first 50 min, the samples were taken every 5 min, to be able to capture the first appearance of the tracer. Afterwards, the samples were taken only every 20 min. The samples consisted of 1 mL from each sampling point (including the effluent port, named SP4). The concentration of the tracer was determined indirectly by spectrophotometry with SPECORD 200 Plus Analytik Jena, at a wavelength of 664 nm. Three identical experimental runs at the same operating conditions were carried out in order to consider the results as triplicates. The tracer concentration data was used for the validation of the CFD model.

2.2. CFD Modeling

2.2.1. Geometry and Mesh

The development of the CFD model was carried out with Ansys version R18.2. Design Modeler and Ansys Meshing were used to implement the reactor geometry and mesh, respectively. The simulations were set in Ansys Fluent. The computer used has an intel core i5 (Quad-core/1600 MHz–3400 MHz) processor of 8th generation, 8 GB of RAM, and Windows 10 operating system.
The domain geometry for the reactor consists of a cylinder with a volume of 2.02 L, in which a bed of spheres is incorporated as an additional body in the construction of the geometry, the dimensions were specified in Section 2.1. This geometry was divided into 11 bodies, in order to implement a hybrid mesh. The spheres of bed are placed within the 2.02 L. However, the geometrical domain for the CFD model was split into smaller bodies (one of those, the bed of spheres) to gain control over the mesh. The multi-zone method was used for the definition of the mesh mapping, deploying zones with hexahedral elements in bodies that exhibit cylindrical structures (Figure 1a). For areas with more complex geometries, tetrahedral elements were implemented, such as for the case of the samplers (Figure 1b), wherein a fine mesh was used to obtain a better numerical resolution. In addition, inflation layers were defined next to all the walls, using the smooth transition option, with a maximum number of 5 layers. Mesh refinement was applied to the input and output regions of the domain. Face sizing was used with the proximity and curvature function with local min size 3.5 × 10⁻⁴ m. The mesh independence evaluation was carried out by using meshes with a number of nodes 140,542, 190,922, and 254,807, defined as coarse, medium, and fine meshes, respectively. Refinements were carried out in the inputs and outputs of the domain, obtaining a minimum and maximum mesh size of 2 × 10⁻⁵ m and 9 × 10⁻¹ m for the coarse mesh. For the medium mesh, element sizes were obtained in the minimum and maximum mesh of 3.38 × 10⁻⁴ m and 6.75 × 10⁻² m, and for the fine mesh values of 3.11 × 10⁻⁴ m and 6.23 × 10⁻² m were obtained.

2.2.2. The Model

In this study, the multiphase Eulerian model was set to represent the fluid and the A-biomass inside the acrylic reactor. Additionally, the transport species model was enabled to simulate the tracer diffusion. Thus, the continuous phase (phase 1) incorporated two fluids, the water and the tracer with a density of 1757 kg m−3; while the dispersed phase (phase 2), which was set as a granular phase, included the artificial A-biomass represented by solid silicone with an equivalent diameter of 2.5 × 10⁻³ m, which is described in the Section 2.1. The Gidaspow drag model was used to describe the phases’ interaction, and a laminar model was set to describe the flow regime (Re = 6.93). This drag model is used to better represent the fluidized behavior of the dispersed phase.

2.2.3. Solver, Boundary, and Initial Conditions

For the initial condition, it was considered that the reactor was filled with water, and the velocities (in all the directions) were set at 0 m s−1. That condition was patched to include the A-biomass. For that, first, a cylindrical region was delimited in the upper part of the fixed bed described in Section 2.1, with a height of 1.5 × 10⁻¹ m and a diameter of 4 × 10⁻² m. Then, a patch was applied in that region, to add phase 2 with a volumetric fraction 1 as a representation of A-biomass, behaving like a fluidized bed in the designated region [18]. The boundary conditions were set as velocity inlet for each inlet in the lower part of the reactor. In the upper part of the reactor, a pressure output and a recirculation outlet flow were defined (experimentally, it is done through a peristaltic pump). See details in Table 1. For all the other walls, a no-slip condition was set.
The problem was solved in transient state, with acceleration of gravity of −9.81 m s−2. To solve the system of equations, the SIMPLE scheme was selected, using a cell-based least squares method for the gradient and a second-order scheme for pressure. To solve the momentum equation and the transient formulation, the second order upwind and the second order implicit schemes were selected, respectively.
In the first instance, the simulations were solved with only water to obtain the velocity fields within the studied domain. For that, 400 time-steps of 30 s were run. The convergence criteria for each time-step that were considered are as follows: the residual values below 1 × 10⁻³ and the stability of the velocities inside the reactor. Subsequently, the Courant number was verified, presenting allowed values lower than 40, considering an implicit formulation based on pressure that is unconditionally stable. Afterwards, the tracer was injected as described in Section 2.2.4.

2.2.4. Tracer Injection Simulation

Methylene blue was added as a new fluid to the Fluent library (Ansys R18.2), with a molecular weight of 319.85 g mol−1 and a mass diffusion constant of 4 × 10⁻¹⁰ m2 s−1 [19]. The injection of the tracer was simulated taken into consideration how much mass of methylene blue was added to the feed flow and for how long the injection was done. In the simulations carried out with A-biomass, the absorption of a tracer fraction was considered; this consideration was established through the experimental work carried out. In the case of simulations with A-biomass a certain fraction of the tracer was assumed to be absorbed onto the A-biomass, which is related to contact time between them. Using as initial condition the results of the simulation with only water, a 10 s pulse was simulated with a total volume of 3 mL of tracer. The mole fraction of the tracer incorporated in the feed stream is described in Table 1. To simulate the 10 s injection, a 0.1 s time-step is first used (100 times steps were run, with 50 iterations each time-step). Then, the tracer mole fraction was changed to 0, and the boundary conditions were re-established at the values defined in Section 2.2.3, to simulate the diffusion of the tracer within the reactor. For this simulation stage, a time-step size of 30 s was selected (60 times-steps were run, with 50 iterations each time-step).

2.2.5. Tracer Recirculation

The tracer profile diffusing through the recirculation nozzle was determined. This allowed us to establish the tracer fraction that is recirculated to the lower part of the studied system. Time ranges of 10 min were established in the simulations, in order to make a change in the boundary conditions at the bottom of the system, such that an adequate representation the recirculation process can be implemented.

2.3. Validation Technique

A monitoring technique that detects the presence of the tracer within a volume of 1 mL in the samplers and the effluent (Figure 1) was used. This method yields a certain concentration in the volume average so that it can be compared with the experimental results. After this, the in silico and experimental results were evaluated by their coefficient of determination.

3. Results and Discussion

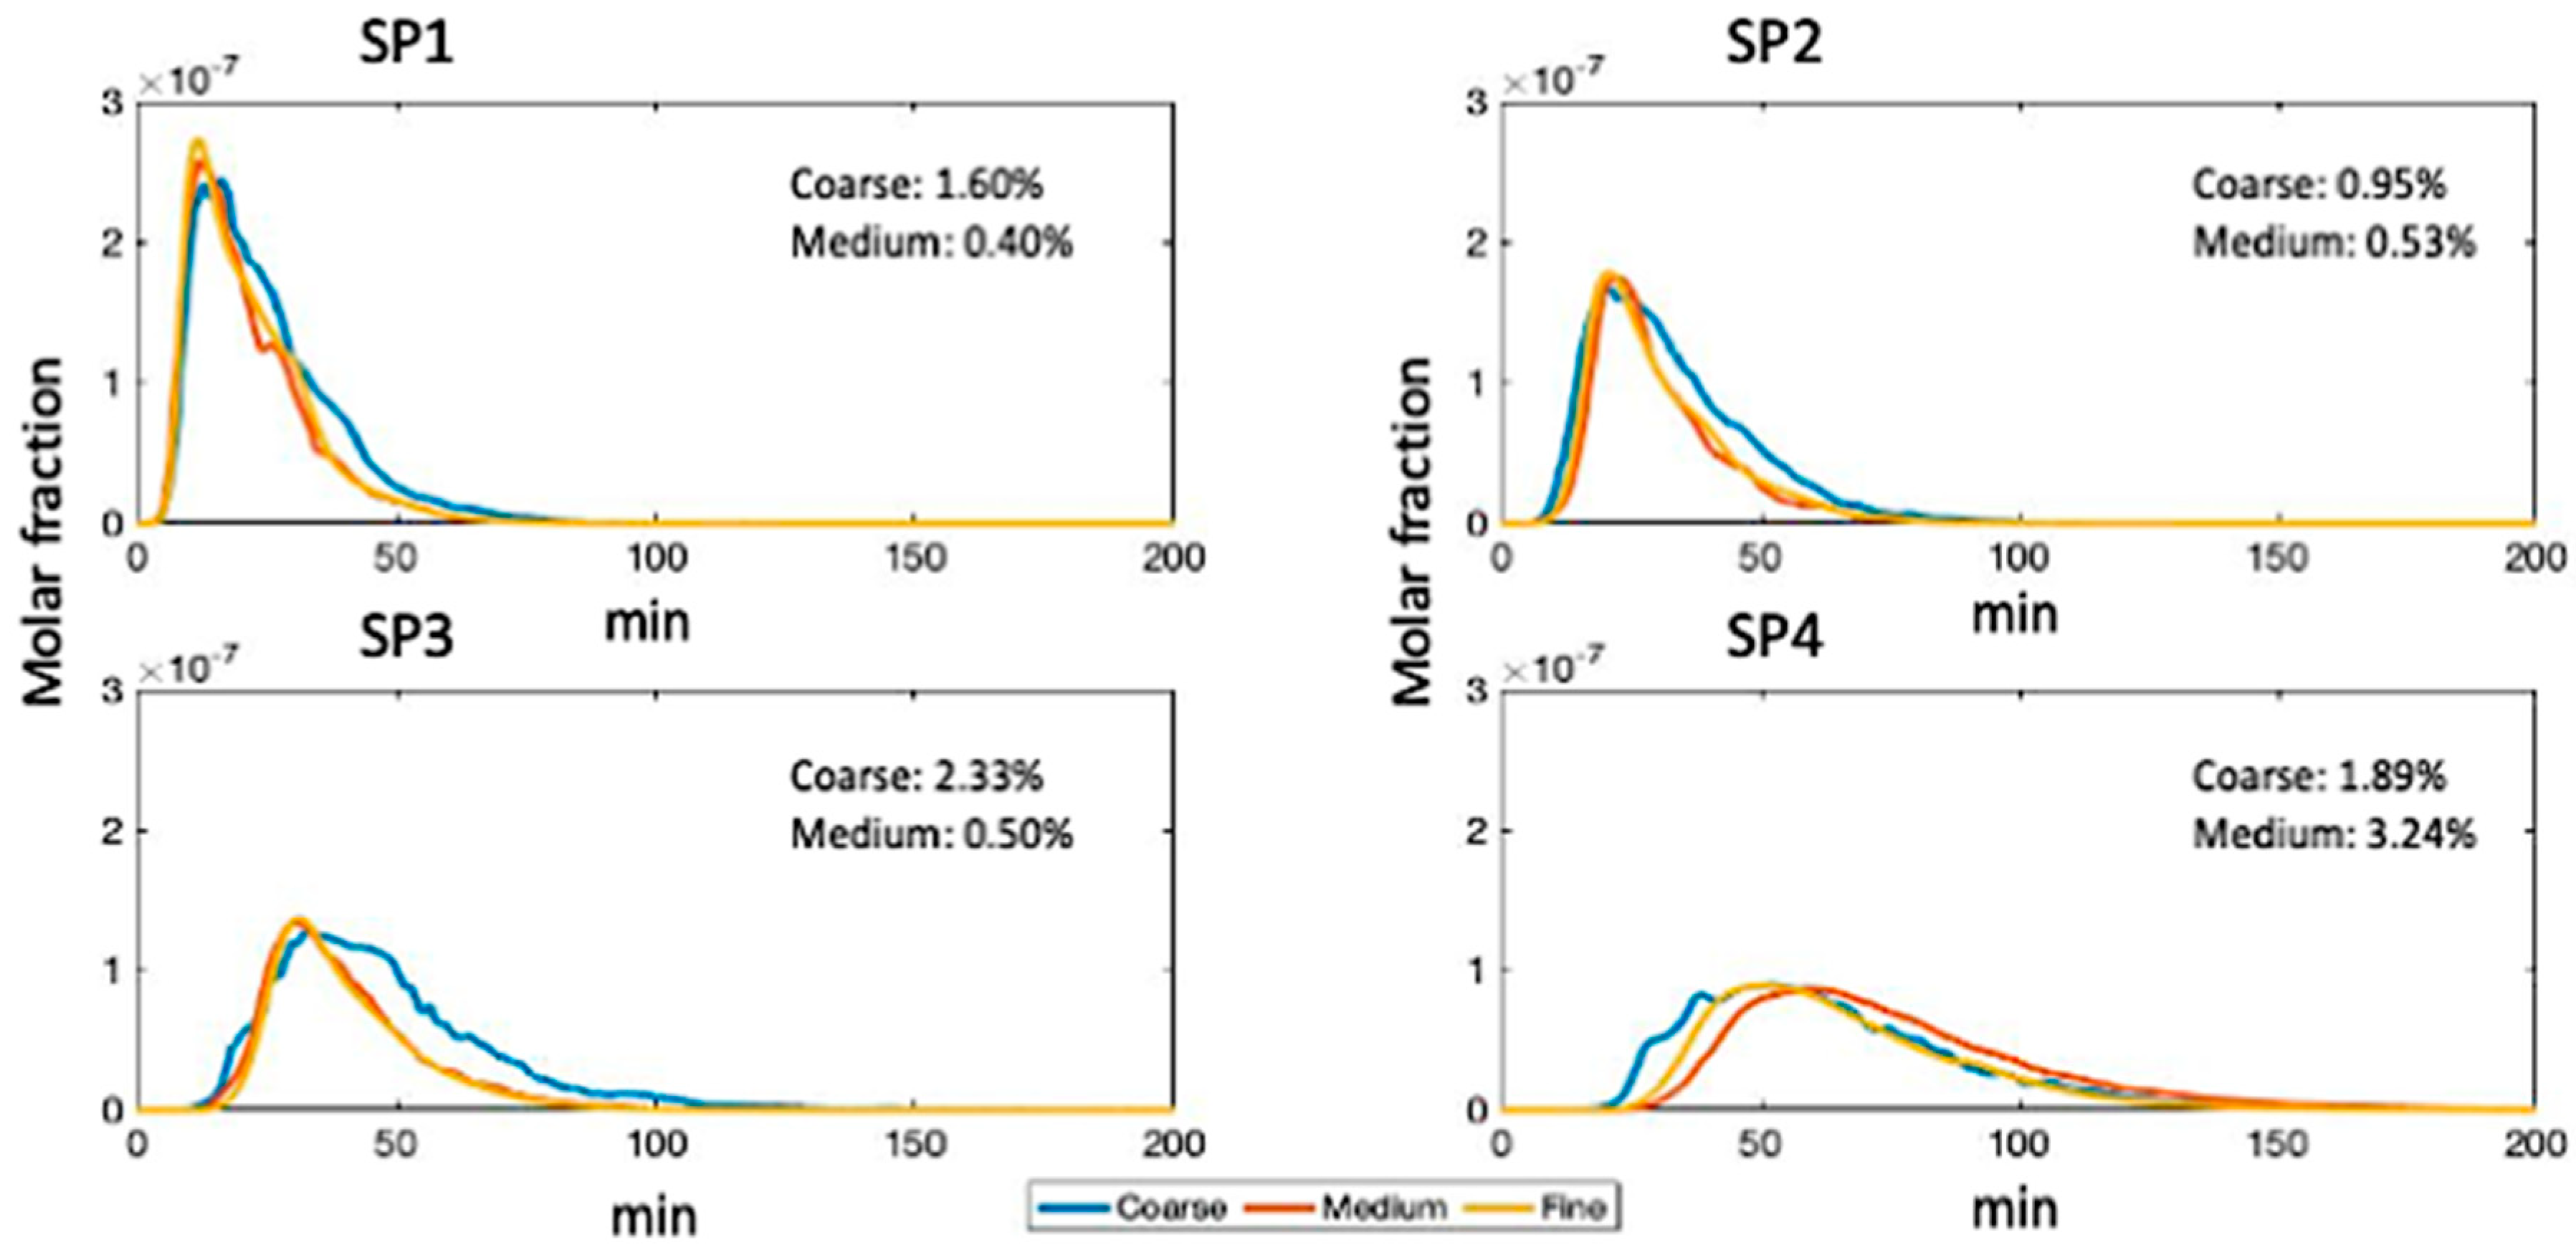
3.1. Mesh Quality and Independence

Assessing the quality of the mesh is a relevant factor to ensure the precision and stability of the numerical resolution. Therefore, some indicators were conceptualized to measure the quality of the mesh, such as aspect ratio, skewness, and orthogonal quality [20]. In the case of orthogonal quality, a mesh with a good quality would have an average close to 1. The skewness indicator indicates that cells that have inclined cuts can decrease accuracy and destabilize the iterative process. For this indicator, the average should be close to 0 for a good quality mesh. The aspect ratio is a measure of cellular stretching [21,22]. These indicators are reported for the three constructed meshes.
In this case, average values of 2.853 were obtained for the aspect ratio and orthogonal quality values of 0.78 with the coarse mesh (Table 2). Regarding the aspect ratio, relatively high maximums were obtained, being 86.512, 60.897, and 55.129 metric elements. These values could indicate that some convergence problems during the resolution of the CFD model took place. The number of elements was verified, presenting a percentage less than 0.0003% with the number of elements that the coarse mesh. The skewness presented reasonably good averages, indicating a good mesh quality. In this case, elements with values higher than 0.87 were identified, which could affect the convergence of the model, but the number of elements that presented this value is a percentage lower than 0.08%, which is an insignificant value in comparison with the total elements that are contained in the mesh. In fact, there were no divergence problems during the resolution of the model.
For the mesh independence study, three meshes were evaluated, in which an improvement of the quality is evidenced as the refinement increases (Figure 2). The simulations were performed with the different meshes, in which the variability of the simulations with respect to the monitored tracer concentration was evaluated. The simulation showed a similar trend regarding the tracer behavior.
The coarse mesh was selected with respect to the low variability, compared to the fine mesh. A variability between 0.95% and 2.33% between them was observed (Figure 2). This result indicates that the gradual increase in the proportion of nodes does not lead to an increase variability in the numerical resolution due to the presence of new nodes. This allows us to use a mesh that has a smaller number of elements and can offer similar results to those obtained with a fine mesh; thus, we can minimize the computational expense that the resolution of the model can present. Finally, these low percentages of variability allow us to infer the independence of the mesh.

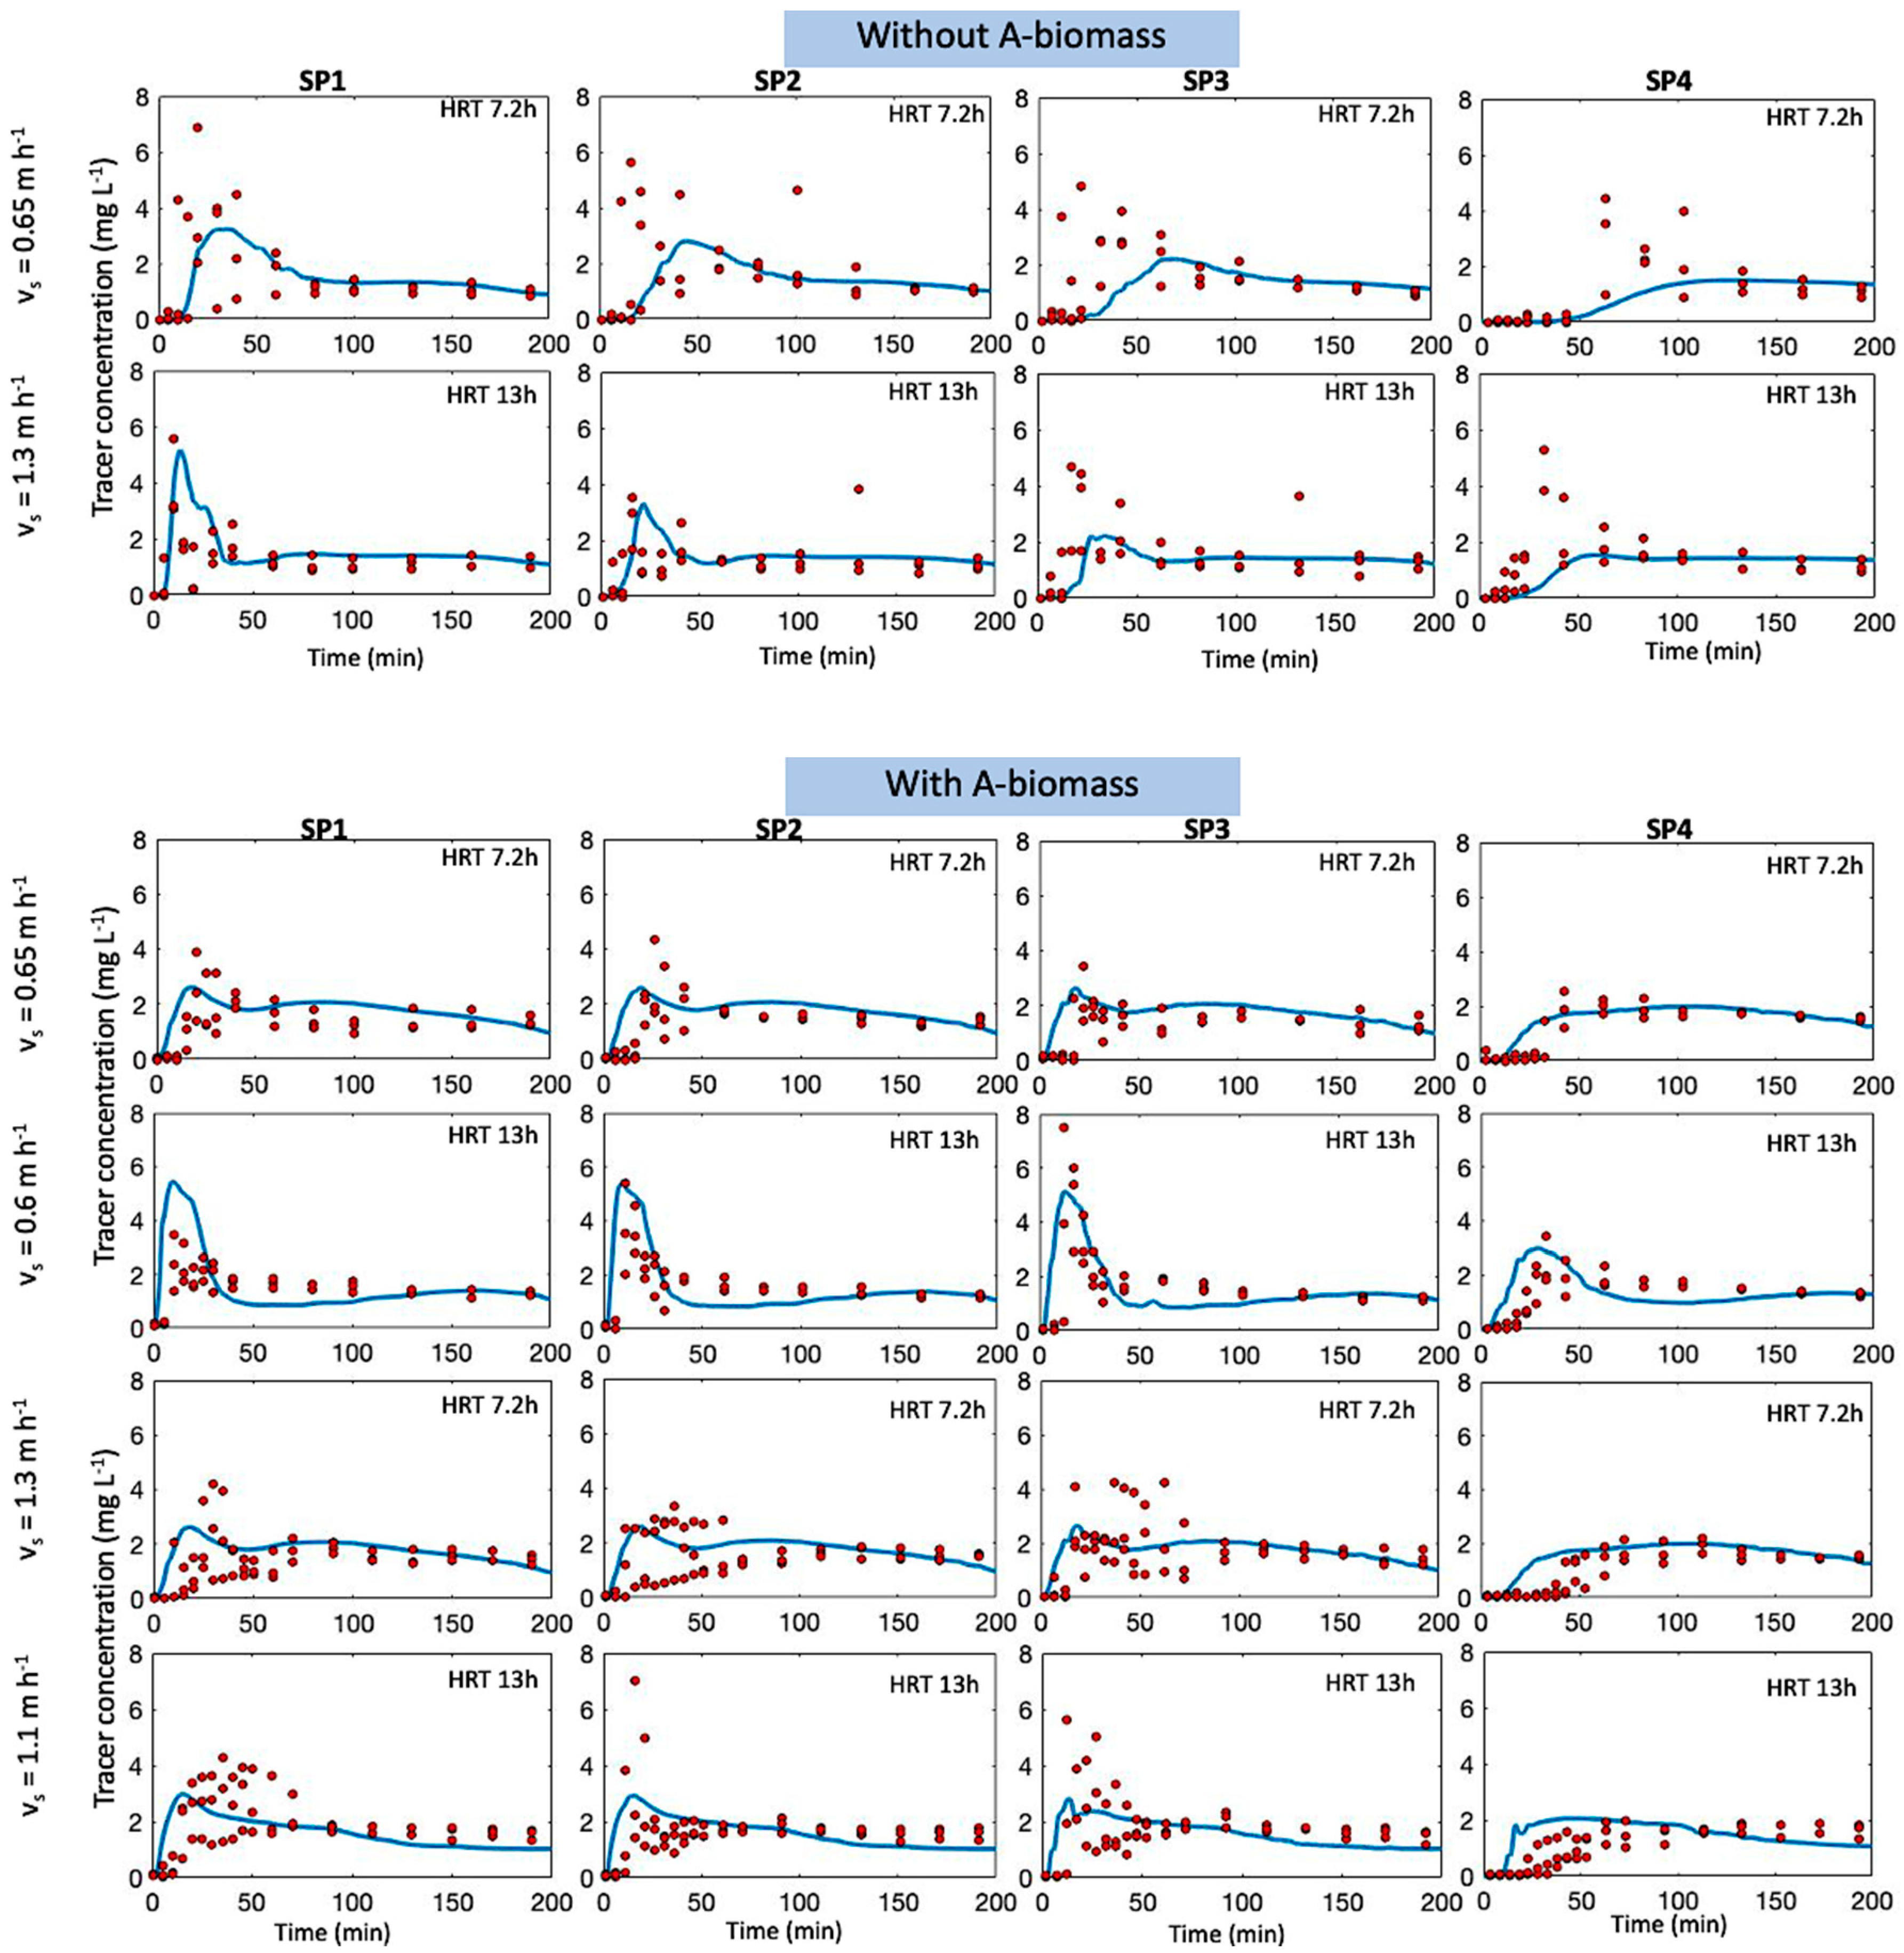
3.2. Model Validation

The experimental results (triplicates) from the tracer injection procedure at the different operational conditions, described in Table 1, in terms of tracer concentration at the four port samples were used to validate the CFD model.
Figure 3 shows the comparison between the simulated tracer trajectory with the experimental measured values for the experiments with and without A-biomass. Due to the variability of the experimental results, an average of the experimental values was not determined, since it is not representative of the sample. The experimental values presented a high variability, due to the physical diffusion phenomena that occur inside, as well as the error associated to the manual injection and sampling included in the experimental procedure. The presence of the A-biomass led to a reduction of the experimental values variability, which can be related to the effect of the presence of the A-biomass bed in reducing the channeling inside the reactor.
In regard to the performance of the model, the determination coefficient (R2) values were close to 0.6 and 0.55 for the validation with the reactor without and with A-biomass, respectively. It is worth noting that the R2 index, which is commonly used, must be carefully interpreted, particularly where the results present a high variability; however, it offers an assessment of the agreement of the general trend of the results [17,23].
The implemented CFD model can describe, reasonably well, the profile of the tracer concentration in the reactor with and without A-biomass. The main disagreement between the simulation and the experimental values occurred in the first 30 min of the experiment for all the evaluated conditions and for each sampling port. This can be explained by the heterogeneous way that occurs the dispersion within the reactor, which indicates that this is an important factor that governs the characteristics of its hydrodynamics. Other connected phenomena and some chaotic behavior might be taking place that are not well represented by the model in this zone of the reactor. Deviation in the vicinity of the inlet of the bioreactor between the experimental results and CFD simulation was also found in a biotrickling reactor validated with the liquid mass flux data [23,24]. However, the simulations predict quite well the behavior of the tracer concentration as the experiments move forward. Therefore, this CFD model is effective in exploring the mixing patterns present within the tubular reactor.
The flow pattern of the reactor presents as a dispersed pattern, with variable mixing levels throughout the reactor; in the lower part of this, it presents a behavior of a plug flow; and in the column and upper part of the reactor, it presents a behavior of a mixed flow reactor. The large number of channels in the reactor column stands out, evidencing the absence of a plug flow in the model.

3.3. Model Simulation

Figure 4 shows the prediction of the spatial distribution of the tracer inside the tubular reactor, without and with A-biomass, at several operation times, across a longitudinal plane placed in the center of the reactor. These planes allow us to appreciate the diffusion of the tracer in the interval of time that it takes to spread the tracer from the lower part of the reactor toward the outlet. The planes 0 and 0.17 min represent the injection of the tracer in the different operating conditions. For the reactor without A-biomass, the tracer takes a longer time to leave the reactor. This can be explained by the fact that the presence of the biomass increases the tracer dispersion through the reactor due to the reduction in the cross-sectional area. Some channeling is observed in the lower part of the reactor, whereas a more distributed tracer concentration is attained in the reactor with A-biomass due to the distribution produced by the biomass.

4. Conclusions

The proposed CFD model that represents the tubular reactor was able to predict the spatial and temporal distribution of the tracer injected in the reactor. The main deviations between the simulation were observed at the beginning of the tracer injection procedure, regardless of the sampling port where the sample was taken. As the experiments elapsed, the simulation results agreed with experimental values for all the evaluated operating conditions. Therefore, a validation methodology based on an RTD procedure that takes into account a spatial along with the temporal distribution, which, to the best to our knowledge, has not been done before, can be useful to validate CFD models.

Author Contributions

J.R. conducted the construction of the model and the simulation; I.G. set up and executed the experimental runs. M.C.S.-R. performed the post-processing and analysis of the results and helped to get the first paper draft; A.C. designed and supervised the experimental work and helped with the paper writing. A.D.-B. supervised the modeling work and led the team and the paper writing. All authors have read and agreed to the published version of the manuscript.

Funding

This research was funded by ANID Chile (FONDECYT n 1180498).

Conflicts of Interest

The authors declare that there is no conflict of interest.

References

  1. Wicklein, E.; Batstone, D.J.; Ducoste, J.; Laurent, J.; Griborio, A.; Wicks, J.; Saunders, S.; Samstag, R.; Potier, O.; Nopens, I. Good modelling practice in applying computational fluid dynamics for WWTP modelling. Water Sci. Technol. 2015, 73, 969–982. [Google Scholar] [CrossRef] [PubMed]
  2. Kiared, K.; Larachi, F.; Guy, C.; Chaouki, J. Trajectory length and residence-time distributions of the solids in three-phase fluidized beds. Chem. Eng. Sci. 1997, 52, 3931–3939. [Google Scholar] [CrossRef]
  3. Arratia, P.E.; Muzzio, F.J. Planar Laser-Induced Fluorescence Method for Analysis of Mixing in Laminar Flows. Ind. Eng. Chem. Res. 2004, 43, 6557–6568. [Google Scholar] [CrossRef]
  4. Delafosse, A.; Calvo, S.; Collignon, M.-L.; Delvigne, F.; Crine, M.; Toye, D. Euler-Lagrange approach to model heterogeneities in stirred tank bioreactors—Comparison to experimental flow characterization and particle tracking. Chem. Eng. Sci. 2015, 134, 457–466. [Google Scholar] [CrossRef]
  5. Odeleye, A.O.O.; Marsh, D.T.J.; Osborne, M.D.; Lye, G.J.; Micheletti, M. On the fluid dynamics of a laboratory scale single-use stirred bioreactor. Chem. Eng. Sci. 2014, 111, 299–312. [Google Scholar] [CrossRef] [Green Version]
  6. Schirmaier, C.; Jossen, V.; Kaiser, S.C.; Jüngerkes, F.; Brill, S.; Safavi-Nab, A.; Siehoff, A.; Bos, C.V.D.; Eibl, D.; Eibl, R. Scale-up of adipose tissue-derived mesenchymal stem cell production in stirred single-use bioreactors under low-serum conditions. Eng. Life Sci. 2014, 14, 292–303. [Google Scholar] [CrossRef]
  7. Rahimi, M.; Parvareh, A. Experimental and CFD investigation on mixing by a jet in a semi-industrial stirred tank. Chem. Eng. J. 2005, 115, 85–92. [Google Scholar] [CrossRef]
  8. Pakzad, L.; Ein-Mozaffari, F.; Upreti, S.R.; Lohi, A. Characterisation of the mixing of non-newtonian fluids with a scaba 6SRGT impeller through ert and CFD. Can. J. Chem. Eng. 2013, 91, 90–100. [Google Scholar] [CrossRef]
  9. Hashemi, N.; Ein-Mozaffari, F.; Upreti, S.R.; Hwang, D.K. Analysis of mixing in an aerated reactor equipped with the coaxial mixer through electrical resistance tomography and response surface method. Chem. Eng. Res. Des. 2016, 109, 734–752. [Google Scholar] [CrossRef]
  10. Kazemzadeh, A.; Elias, C.; Tamer, M.; Ein-Mozaffari, F. Hydrodynamic performance of a single-use aerated stirred bioreactor in animal cell culture: Applications of tomography, dynamic gas disengagement (DGD), and CFD. Bioprocess Biosyst. Eng. 2018, 41, 679–695. [Google Scholar] [CrossRef]
  11. Nopens, I.; Sudrawska, D.; Audenaert, W.; del Pozo, D.F.; Rehman, U. Water and wastewater CFD validation: Are we losing the balance? Water Sci. Technol. 2020, 81, 1636–1645. [Google Scholar] [CrossRef] [Green Version]
  12. Paul, E.L.; Victor, A.; Atiemo, O.; Suzanne, M.K. Handbook of Industrial Mixing; John Wiley & Sons, Inc.: Hoboken, NJ, USA, 2003. [Google Scholar]
  13. Gunjal, P.R.; Ranade, V.V.; Chaudhari, R.V. Liquid Distribution and RTD in Trickle Bed Reactors: Experiments and CFD Simulations. Can. J. Chem. Eng. 2003, 81, 821–830. [Google Scholar] [CrossRef]
  14. Kalaga, D.V.; Reddy, R.K.; Joshi, J.B.; Dalvi, S.V.; Nandkumar, K. Liquid phase axial mixing in solid-liquid circulating multistage fluidized bed: CFD modeling and RTD measurements. Chem. Eng. J. 2012, 191, 475–490. [Google Scholar] [CrossRef]
  15. Alvarado, A.; Vesvikar, M.; Cisneros, J.F.; Maere, T.; Goethals, P.; Nopens, I. CFD study to determine the optimal configuration of aerators in a full-scale waste stabilization pond. Water Res. 2013, 47, 4528–4537. [Google Scholar] [CrossRef]
  16. Manenti, S.; Todeschini, S.; Collivignarelli, M.C.; Abbà, A. Integrated RTD—CFD Hydrodynamic Analysis for Performance Assessment of Activated Sludge Reactors. Environ. Process. 2018, 5, 23–42. [Google Scholar] [CrossRef]
  17. Choi, B.S.; Wan, B.; Philyaw, S.; Dhanasekharan, K.; Ring, T.A. Residence time distributions in a stirred tank: Comparison of CFD predictions with experiment. Ind. Eng. Chem. Res. 2004, 43, 6548–6556. [Google Scholar] [CrossRef]
  18. Ren, T.-T.; Mu, Y.; Ni, B.-J.; Yu, H.-Q. Hydrodynamics of upflow anaerobic sludge blanket reactors. AIChE J. 2009, 55, 516–528. [Google Scholar] [CrossRef]
  19. Rhee, B.K. Enhancement of Mass Transfer Coefficient in Three-Phase Magnetically Stabilized Fluidized Bed. Master’s Thesis, Oregon State University, Corvallis, OR, USA, 1998. [Google Scholar]
  20. Sadino-Riquelme, C.; Hayes, R.E.; Jeison, D.; Donoso-Bravo, A. Computational fluid dynamic (CFD) modelling in anaerobic digestion: General application and recent advances. Crit. Rev. Environ. Sci. Technol. 2018, 48, 39–76. [Google Scholar] [CrossRef]
  21. Kwok, W.; Chen, Z. A Simple and Effective Mesh Quality Metric for Hexahedral and Wedge Elements. In Proceedings of the 9th International Meshing Roundtable, New Orleans, LA, USA, 2–5 October 2000. [Google Scholar]
  22. Parthasarathy, V.N.; Graichen, C.M.; Hathaway, A.F. A comparison of tetrahedron quality measures. Finite Elem. Anal. Des. 1994, 15, 255–261. [Google Scholar] [CrossRef]
  23. Liu, M. Prediction of tracer concentration and mixing in CFSTRs with mean age distribution. Ind. Eng. Chem. Res. 2011, 50, 5838–5851. [Google Scholar] [CrossRef]
  24. Markthaler, S.; Plankenbühler, T.; Weidlich, T.; Neubert, M.; Karl, J. Numerical simulation of trickle bed reactors for biological methanation. Chem. Eng. Sci. 2020, 226, 115847. [Google Scholar] [CrossRef]
Figure 1. (a) Computational fluid meshing and sampling (monitoring point). SP1, SP2 and SP3 are the sampling ports along the reactor height (at 0.26, 0.46, and 0.67 m, respectively), while SP4 is the effluent port (at 0.92 m height). The recirculation port is placed opposite to SP4. SP = sampling point; (b) Zoom on the sampling point.
Computation 08 00094 g001
Figure 2. Mesh independence simulations (sampling ports, SP).
Computation 08 00094 g002
Figure 3. Comparison of the predicted (solid line) and measured concentration (red circles) at various heights (sampling ports, SP) for experiments with and without A-biomass.
Computation 08 00094 g003
Figure 4. Spatial and temporal distribution of the tracer concentration in the tubular reactor with and without A-biomass at a vs of 0.65 m h−1 and at an HRT of 7.2 h.
Computation 08 00094 g004
Table 1. Operating conditions of the tubular reactor.
Without A-BiomassWith A-Biomass
General operational conditions
Hydraulic retention time (h)7.27.213
vs (m h−1)0.651.30.651.30.61.1
Feed flow (mL s−1)0.0780.0780.0780.0780.0430.043
Recirculation flow (mL s−1)0.1970.4710.1970.4710.2110.422
Transport lag time of the recirculation loop (h)0.0850.0360.0850.0360.0790.040
General boundary conditions
Inlet (m s−1)0.00270.00550.00270.00550.00250.0046
Recirculation (m s−1)0.00390.00940.00390.00940.00420.0084
Boundary conditions during tracer injection
Inlet (m s−1)0.005720.00850.005720.00850.00550.0086
Molar fraction2.930 × 10−51.989 × 10−51.831 × 10−64.972 × 10−61.904 × 10−65.514 × 10⁻⁶
Table 2. Mesh quality analysis results.
MeshCoarseMediumFine
Aspect ratio
Min1.15841.15851.0685
Max86.512060.897055.1290
Average2.85382.72022.5419
Skewness
Min1.75 × 10−54.20 × 10−63.27 × 10−6
Max0.97600.97680.9157
Average0.21830.21180.2038
Orthogonal Quality
Min0.02390.02310.0842
Max0.99530.99560.9988
Average0.78030.78670.7986
Publisher’s Note: MDPI stays neutral with regard to jurisdictional claims in published maps and institutional affiliations.

