1. Introduction
In the last few years, renewable sources of energy have been used extensively in many applications, such as power generation. Renewable sources of energy are significantly superior to fossil energy, due to the fact that they are free and abundant and have a low impact on the environment. Specifically, wind energy is becoming more important every year and, therefore, wind power generators have attracted a great deal of attention from research teams in pursuing optimal aerodynamic performance.
The aerodynamic performance of wind turbine blades can be affected by many conditions, such as sand concentration in dry, dusty environments. Although much research has been conducted on the detrimental effects of certain meteorological phenomena, to the authors’ best knowledge, very few publications are available in the literature that discuss the issue of aerodynamic influences due to sand particles in the air.
Nowadays, computational fluid dynamics can solve complex flow problems, such as an air–sand particle two-phase flow problem. Additional transport equations for the secondary phase are solved using the CFD code and the interaction terms by which the mass, momentum, and energy exchanges between the phases can be handled.
For several years, great effort has been devoted to the study of the aerodynamic performance of wind turbine airfoils in air flow. One of the first examples of CFD calculations of the aerodynamic characteristics of an S809 airfoil was presented by Wolfe and Ochs [
1]. In particular, Wolfe and Ochs [
1] studied a steady-state laminar flow over an S809 airfoil using the commercial code CFD-ACE [
2]. By comparing the computed pressure and aerodynamic coefficients with wind tunnel data from Delft University, it was revealed that the transition point from laminar to turbulent flow should be correctly modeled to ensure that the simulations for attached flow are accurate, and that the standard k–ε turbulence model is not suitable at angles of attack with flow separation.
In 2006, Gupta and Gordon Leishman [
3] modified the Leishman–Beddoes dynamic stall model in order to represent the unsteady aerodynamic behavior of the S809 airfoil for wind turbine applications, and they found that there was a good agreement between the predictions and experimental data for various angle of attack time histories. The results obtained suggest that the Leishman–Beddoes model coupled with a lifting-line model is able to predict the unsteady behavior of airfoil sections in attached flow, light stall, and deep dynamic stall, with knowledge of the static stall characteristics.
Qu et al. [
4] have demonstrated that the Reynolds number has a direct impact on the aerodynamic performance of a wind turbine airfoil. More specifically, numerical simulations and experiments were used to predict the two-dimensional flow over an NREL S809 airfoil, and it was observed that, at Reynolds numbers varying from 1.5 × 10
4 to 2 × 10
5, both drag and lift coefficients experience great changes, while at Reynolds numbers from 2 × 10
5 to 5 × 10
6 the changes are smoother and very small.
Later, a numerical simulation of transition effect on the aerodynamic performance of an S809 airfoil was conducted by Zhong et al. [
5]. First, they observed the lift and drag characteristics in multiple turbulence models, paying no attention to transition, and then they simulated the aerodynamic performance of an S809 airfoil in order to investigate the laminar-to-turbulence transition effect on the airfoil’s aerodynamic characteristics and the flow separation near the trailing edge. It was observed that transition significantly influences the lift and drag characteristics, as well as the flow separation near the trailing edge.
In a recent paper Douvi and Margaris [
6] presented a comparison between the aerodynamic performance of NACA 0012 and NREL S809 wind turbine airfoils at various angles of attack and operating at different Reynolds numbers using CFD code. After validating the obtained computational results by comparing them with experimental data, they concluded that the realizable k–ω turbulence model was the most appropriate to describe the aerodynamic performance of both airfoils. It was also found that the S809 airfoil was more advantageous compared to the NACA 0012 airfoil.
Several publications have also appeared in recent years documenting the impact of a two-phase flow over the aerodynamic behavior of airfoils. In 2010, Wan and Pan [
7] investigated the degradation on aerodynamic performance of an airfoil due to heavy rain, using a discrete phase model in order to simulate the two-phase flow. Wan and Chou [
8] reinvestigated the influence of heavy rain on the aerodynamic performance of a high lift airfoil by simulating the rain conditions with a discrete phase model combined with high lift devices’ surface roughness effects. The results obtained by Wan and Pan [
7] as well as by Wan and Chou [
8] suggest that the degradation rate increases with the rain rate.
Next, Douvi and Margaris [
9] utilized a discrete phase model on a CFD code in order to predict not only the aerodynamic characteristics of a NACA 0012 wind turbine airfoil under raining conditions, but also the flow field over the airfoil. The results emerged were compared with reliable experimental data, and after a comparison between simulations in both dry and wet conditions was conducted, it was possible to conclude that rain causes a decrease of the lift coefficient and an increase of the drag.
Another solution is described by Wu and Cao [
10], who numerically simulated the flow over a NACA 0012 airfoil in heavy rain via a two-way coupled Eulerian–Lagrangian development. The predicted aerodynamic force coefficients agree well with the experimental results, and it was found that there was, approximately, a 3° rain-induced increase in stall angle of attack. Wu and Cao [
10] also found that the airfoil aerodynamic efficiency degradation in a heavy rain environment was due to an uneven water film caused by the loss of boundary momentum by raindrop splashback and the effective roughening of the airfoil surface.
In 2014, Ren et al. [
11] published a paper in which they described a numerical study about the influence of rime ice conditions on a NREL S809 airfoil under various temperatures and liquid water contents, operating at a Reynolds number of Re = 1 × 10
6. The numerical calculations accomplished on the transition shear-stress transport (SST) turbulent model using Fluent and Lewice software under the same icing conditions. However, the researchers have arrived at the conclusion that there was not good agreement between the numerical results obtained with Lewice and the experiments.
Recently, Olivieri et al. [
12] studied the behavior of small particles affected by the Basset history term force in an isotropic and homogeneous turbulent flow, utilizing an Eulerian-Lagrangian approach. It was shown that the small-scale clustering of inertial particles is reduced by the Basset history term, as well as that by consideration of the Basset history at a low Reynolds numbers there are significant changes on the balance of forces, which determine the instantaneous acceleration of the particles.
In a paper by Sardina et al. [
13], a stochastic model was proposed, and direct numerical simulation and large eddy simulations (LES) were used, in order to study the constant growth of cloud droplets because of their condensation in turbulent clouds in a homogeneous isotropic turbulent flow. It was concluded that the size of the droplet distribution increases with time and also that, given enough time, every warm cloud would precipitate.
Next, the focus of De Marchis et al. [
14] has been on the effect of the wall roughness on dilute wall-bounded turbulent flows, because of the interaction between inertial particles that influence the macroscopic behavior of such two-phase systems, and coherent turbulent structures characteristic of the wall region. They used DNS at friction Reynolds number Re
τ = 180 combined with Lagrangian heavy particle tracking in a turbulent channel flow in order to characterize the effect of inertia on particle preferential accumulation.
However, to the authors’ best knowledge, very few publications are available in the literature that discuss the issue of the impact of an air-sand particle two-phase flow on the aerodynamic performance of an airfoil. An interesting approach to this issue has been proposed by Khakpour et al. [
15] in 2007, who studied the effect of sand particles on the flow over a S819 wind turbine airfoil and found that a greater particles mass flow rate results in a decrease of the pressure coefficient.
In 2009 Knopp et al. [
16] presented an extension for k–ω turbulence models, based on the equivalent sand grain approach, to account for wall roughness. Briefly, the grid requirements are the same for simulation of flows over both rough surfaces and smooth walls, the skin friction for transitional roughness Reynolds numbers prediction is improved and there is no need to modify the SST k–ω model. Knopp et al. [
16] indicate that this new method can be utilized to predict the aerodynamic effects of surface roughness on the flow past an airfoil in high lift conditions.
Salem et al. [
17] have proposed a computational fluid dynamics (CFD) model coupled with a deposition model using the full two-dimensional Navier–Stokes equations and the SST k–ω turbulence model in order to assess the performance degradation of wind turbine NACA 63-215 airfoil operating in dusty regions. The developed model predictions were validated by being compared with existing experimental data and the flow separation was identified by the numerical results.
However, studies on the aerodynamic performance of a NREL S809 wind turbine airfoil in an air-sand particle two-phase flow are still lacking. Therefore, the aim of the present paper is to investigate the air-sand particle steady incompressible two-phase flow over a NREL S809 wind turbine airfoil at various angles of attack and operating at Reynolds numbers of Re = 1 × 10⁶ and Re = 2 × 10⁶, using CFD code. The computational results are compared with reliable existing experimental data on air flow over an S809 airfoil, in order to find the impact of sand particles on lift and drag coefficients and, consequently, the aerodynamic performance of the airfoil.
2. Discrete Two-Phase Flow over an Airfoil
Air-sand particle two-phase flow can be characterized as a discrete phase flow, which can be investigated computationally by the help of the Euler-Lagrange approach. The continuum air phase interacts with the dispersed phase, which consists of sand particles, and mass, energy, and momentum of the dispersed phase are exchanged with the air phase. Especially for air-sand particle two-phase flow, there is only momentum transfer from the air to the particles.
Regarding the discrete air-sand particle two-phase flow over an airfoil, sand particles influence plenty of characteristics, such as the shear stress factor, the pressure gradient, and the boundary layer and, as a result, the aerodynamic performance of the airfoil. More specifically, the lift force, in other words the component of the net affecting force on the airfoil acting normal to the incoming flow stream decreases, while the drag force, which is the component of the net force acting parallel to the incoming flow stream, increases due to the change in momentum caused by the reflected particles, as they impact the airfoil.
4. Results and Discussion
Numerical simulations were conducted at various angles of attack and at Reynolds numbers of Re = 1 × 10
6 and Re = 2 × 10
6. The component of the net affecting force on the airfoil acting normal to the incoming flow stream is known as the lift force, while the component of the net force acting parallel to the incoming flow stream is known as the drag force. The lift and drag coefficients were possible to be predicted by means of the realizable k–ε and SST k–ω turbulence models, and then to be examined and compared with reliable experimental data regarding the one-phase air flow over the S809 airfoil by Somers [
18].
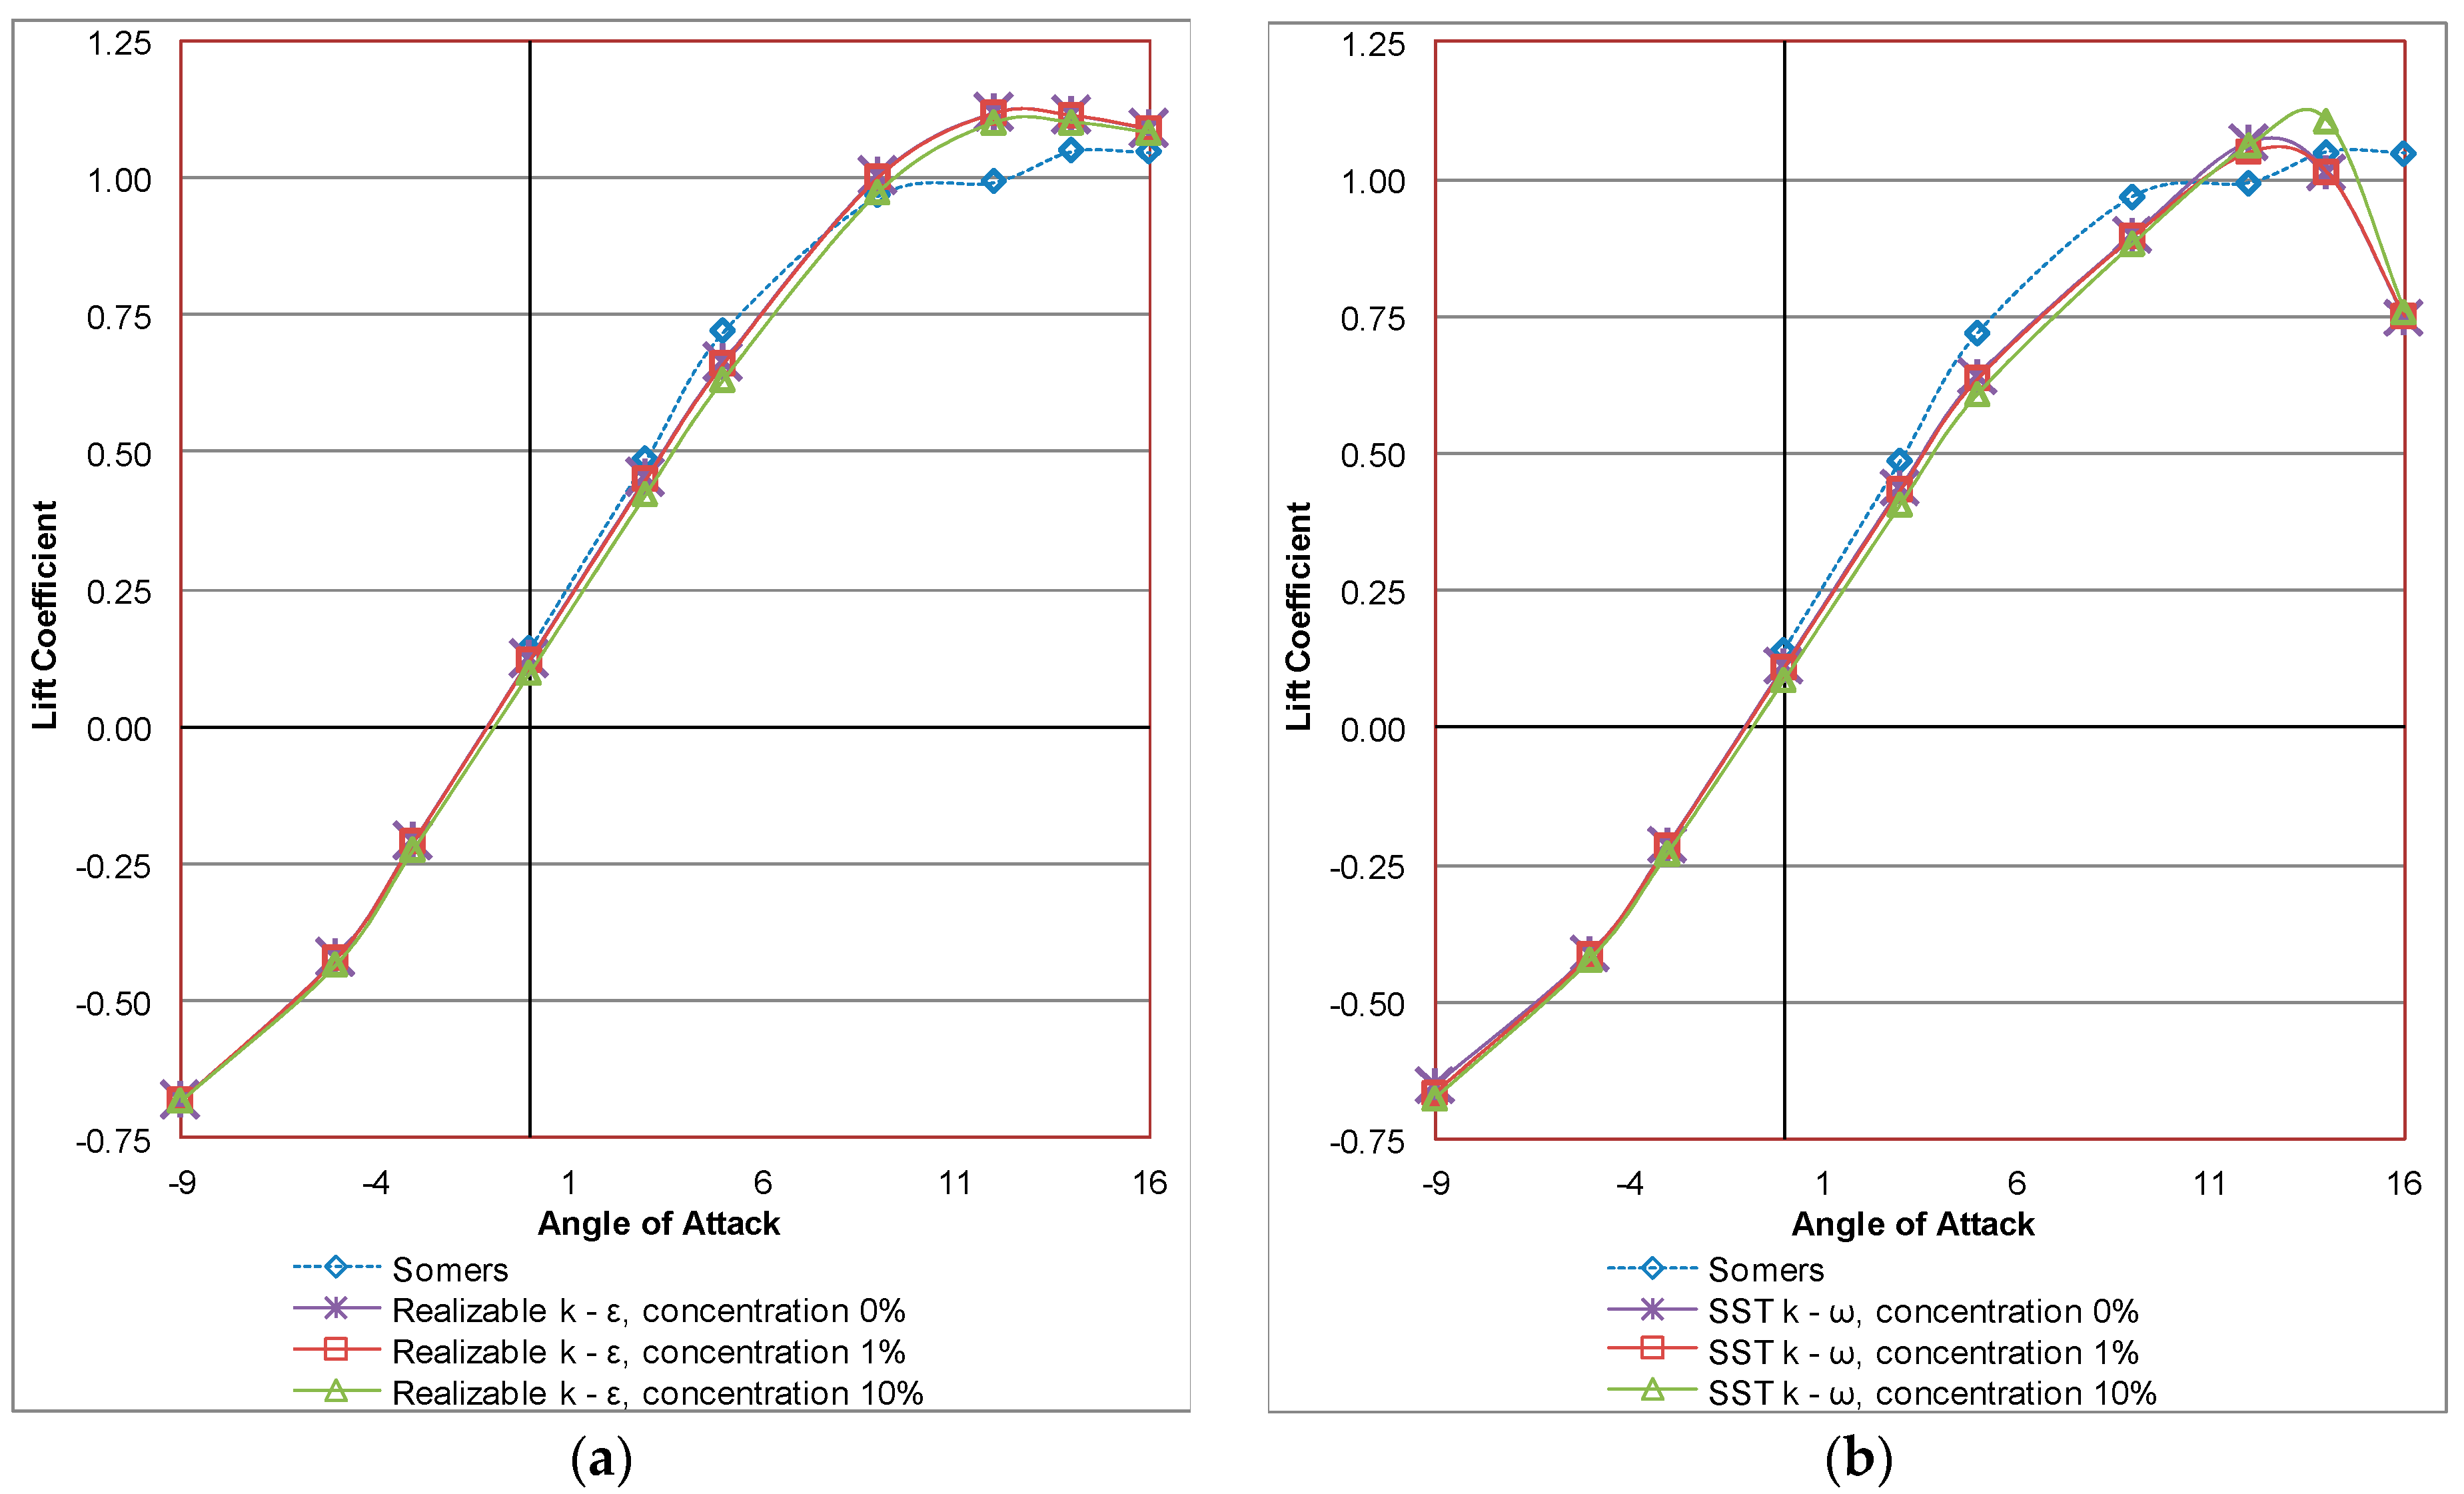
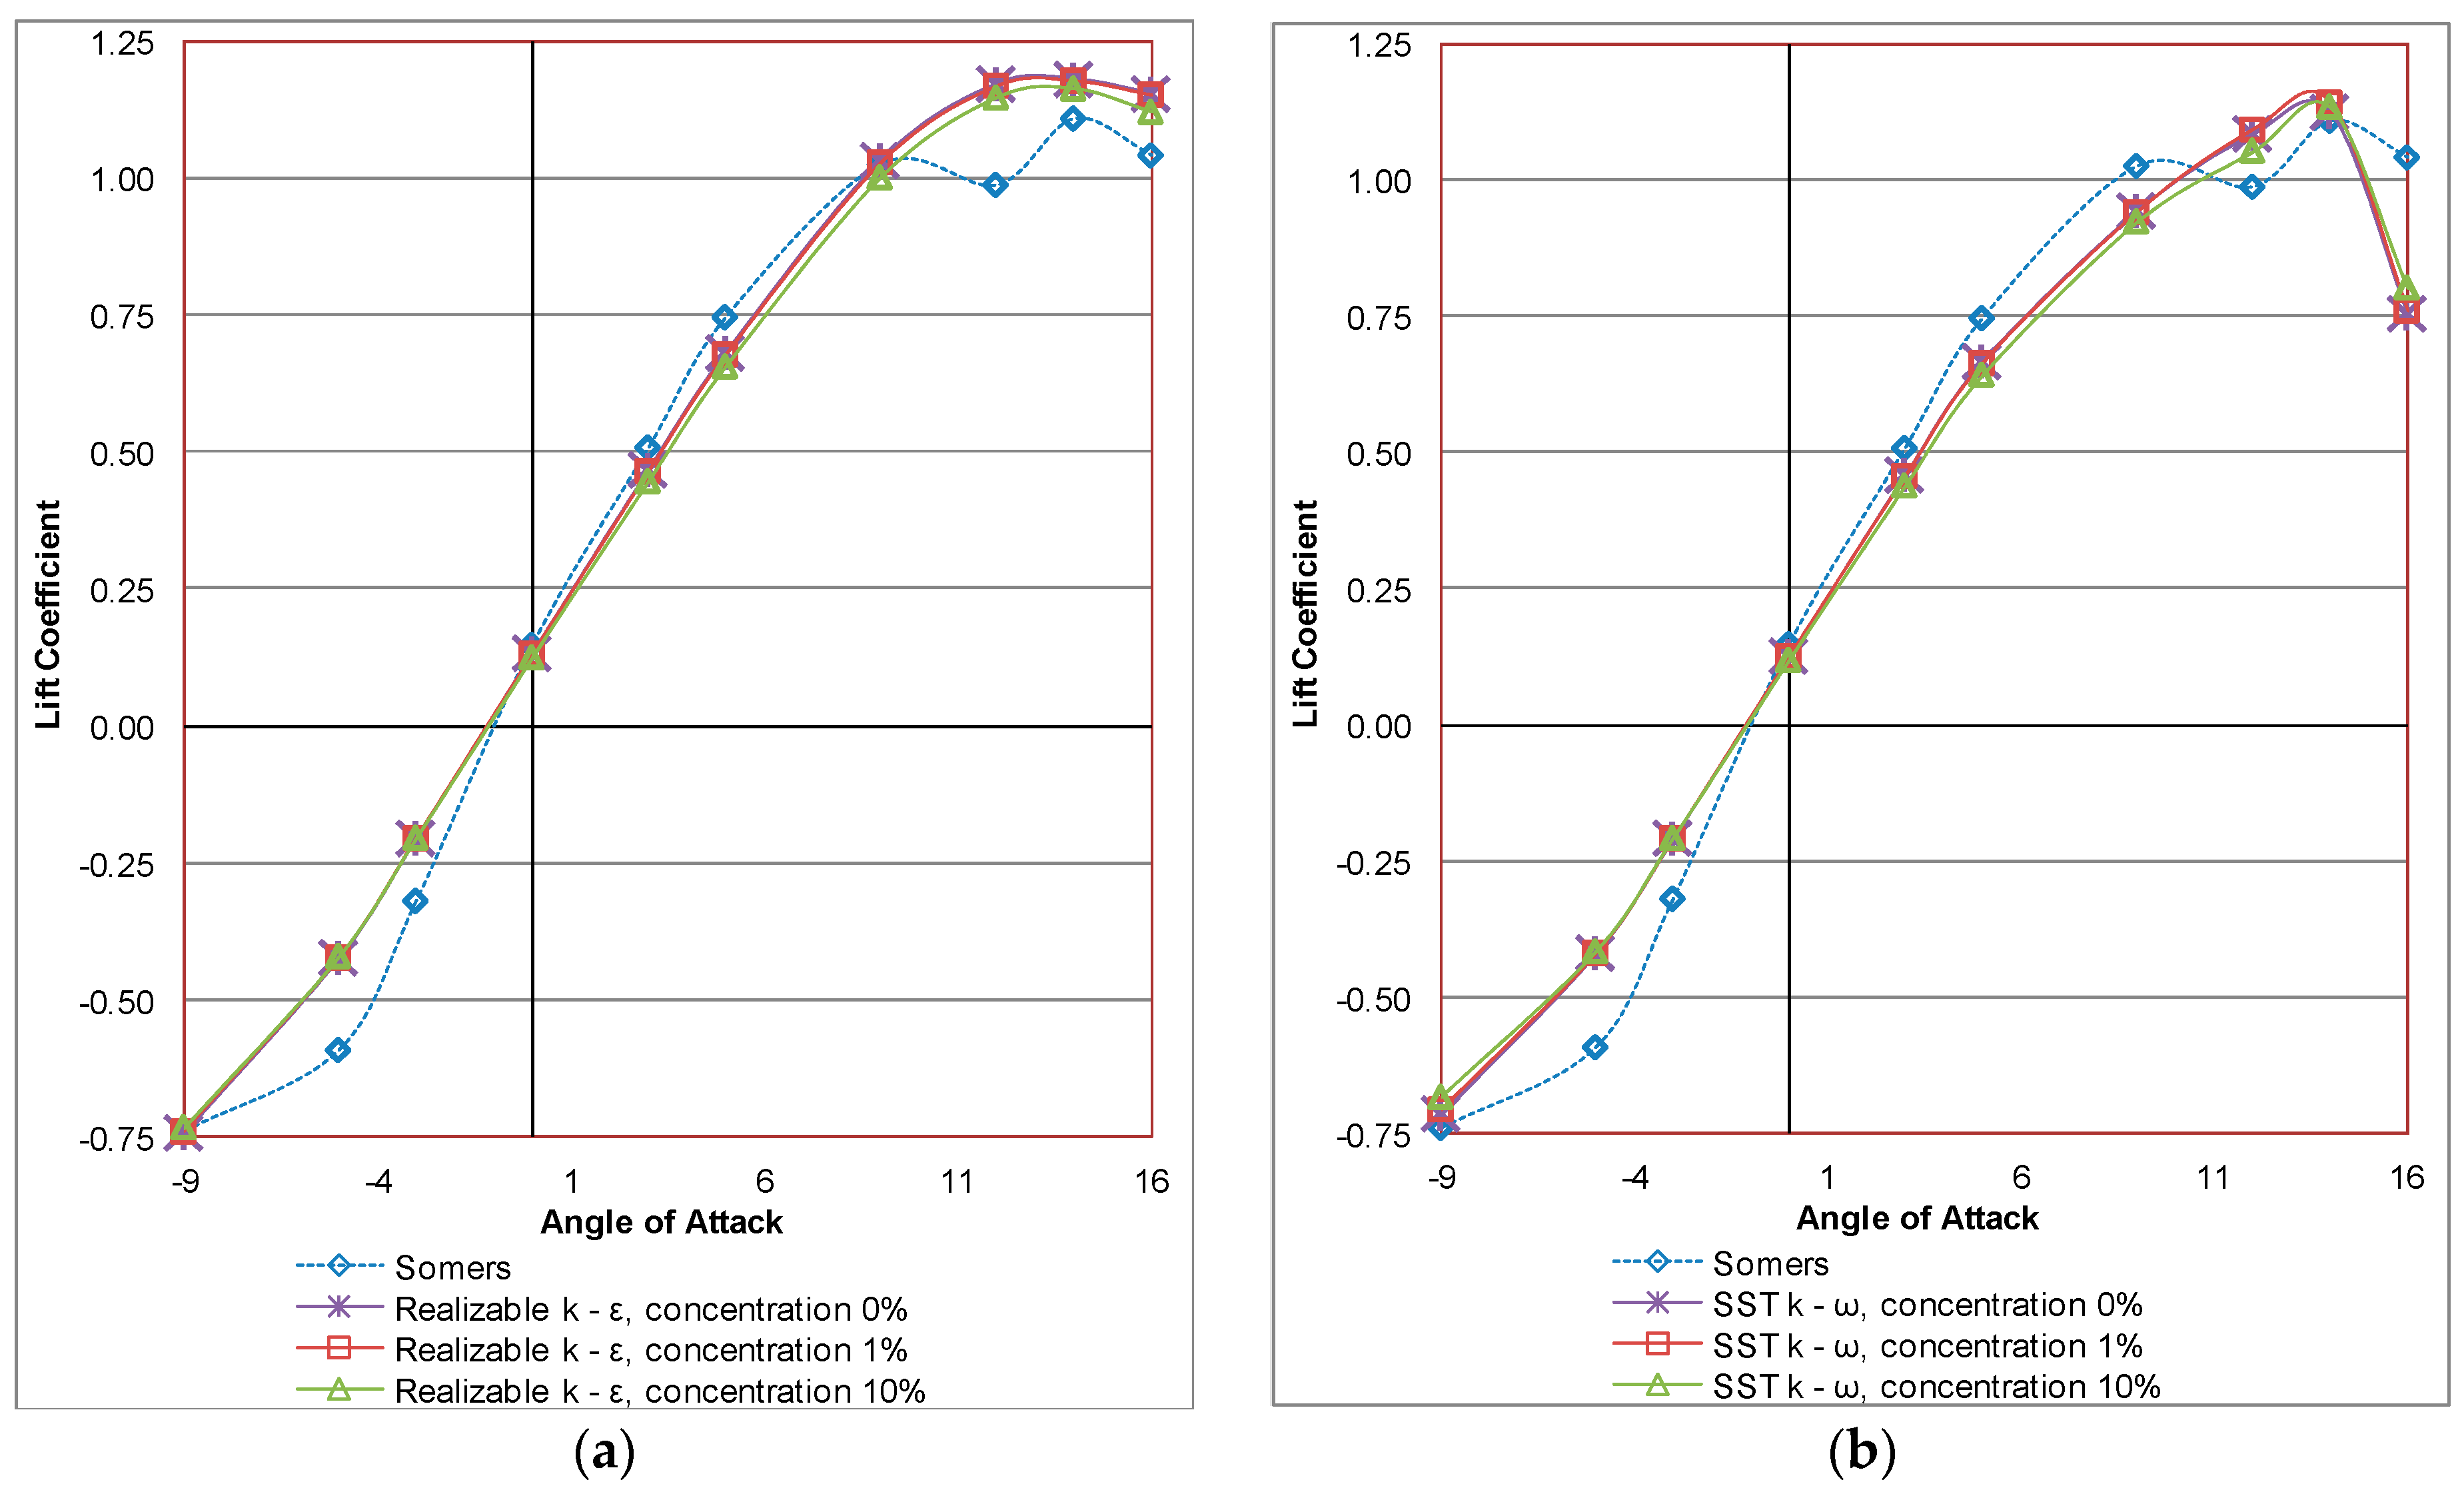
Figure 3 and
Figure 4 illustrate the simulation results of the lift coefficient for the S809 airfoil versus the angle of attack at Reynolds numbers of Re = 1 × 10
6 and Re = 2 × 10
6, respectively, for one-phase flow and two-phase flows of two different concentrations of sand particles in the air. Regarding the numerical results for the one phase air flow, it is obvious that the lift coefficient increases linearly with the angle of attack in the range of −9° to 9°. The turbulence models are shown to have the same behavior and good agreement with the experimental data. Nevertheless, for angles of attack higher than 12°, there is a disagreement between the experimental data and the computational results. Furthermore, it can be observed that sand concentration affects the lift coefficients. More specifically, there is a downward translation of the lift coefficient curve as the concentrations of sand particles increase, which has, as a result, a degradation of the aerodynamic performance. This degradation increases as the angle of attack and the concentration of sand particles increase.
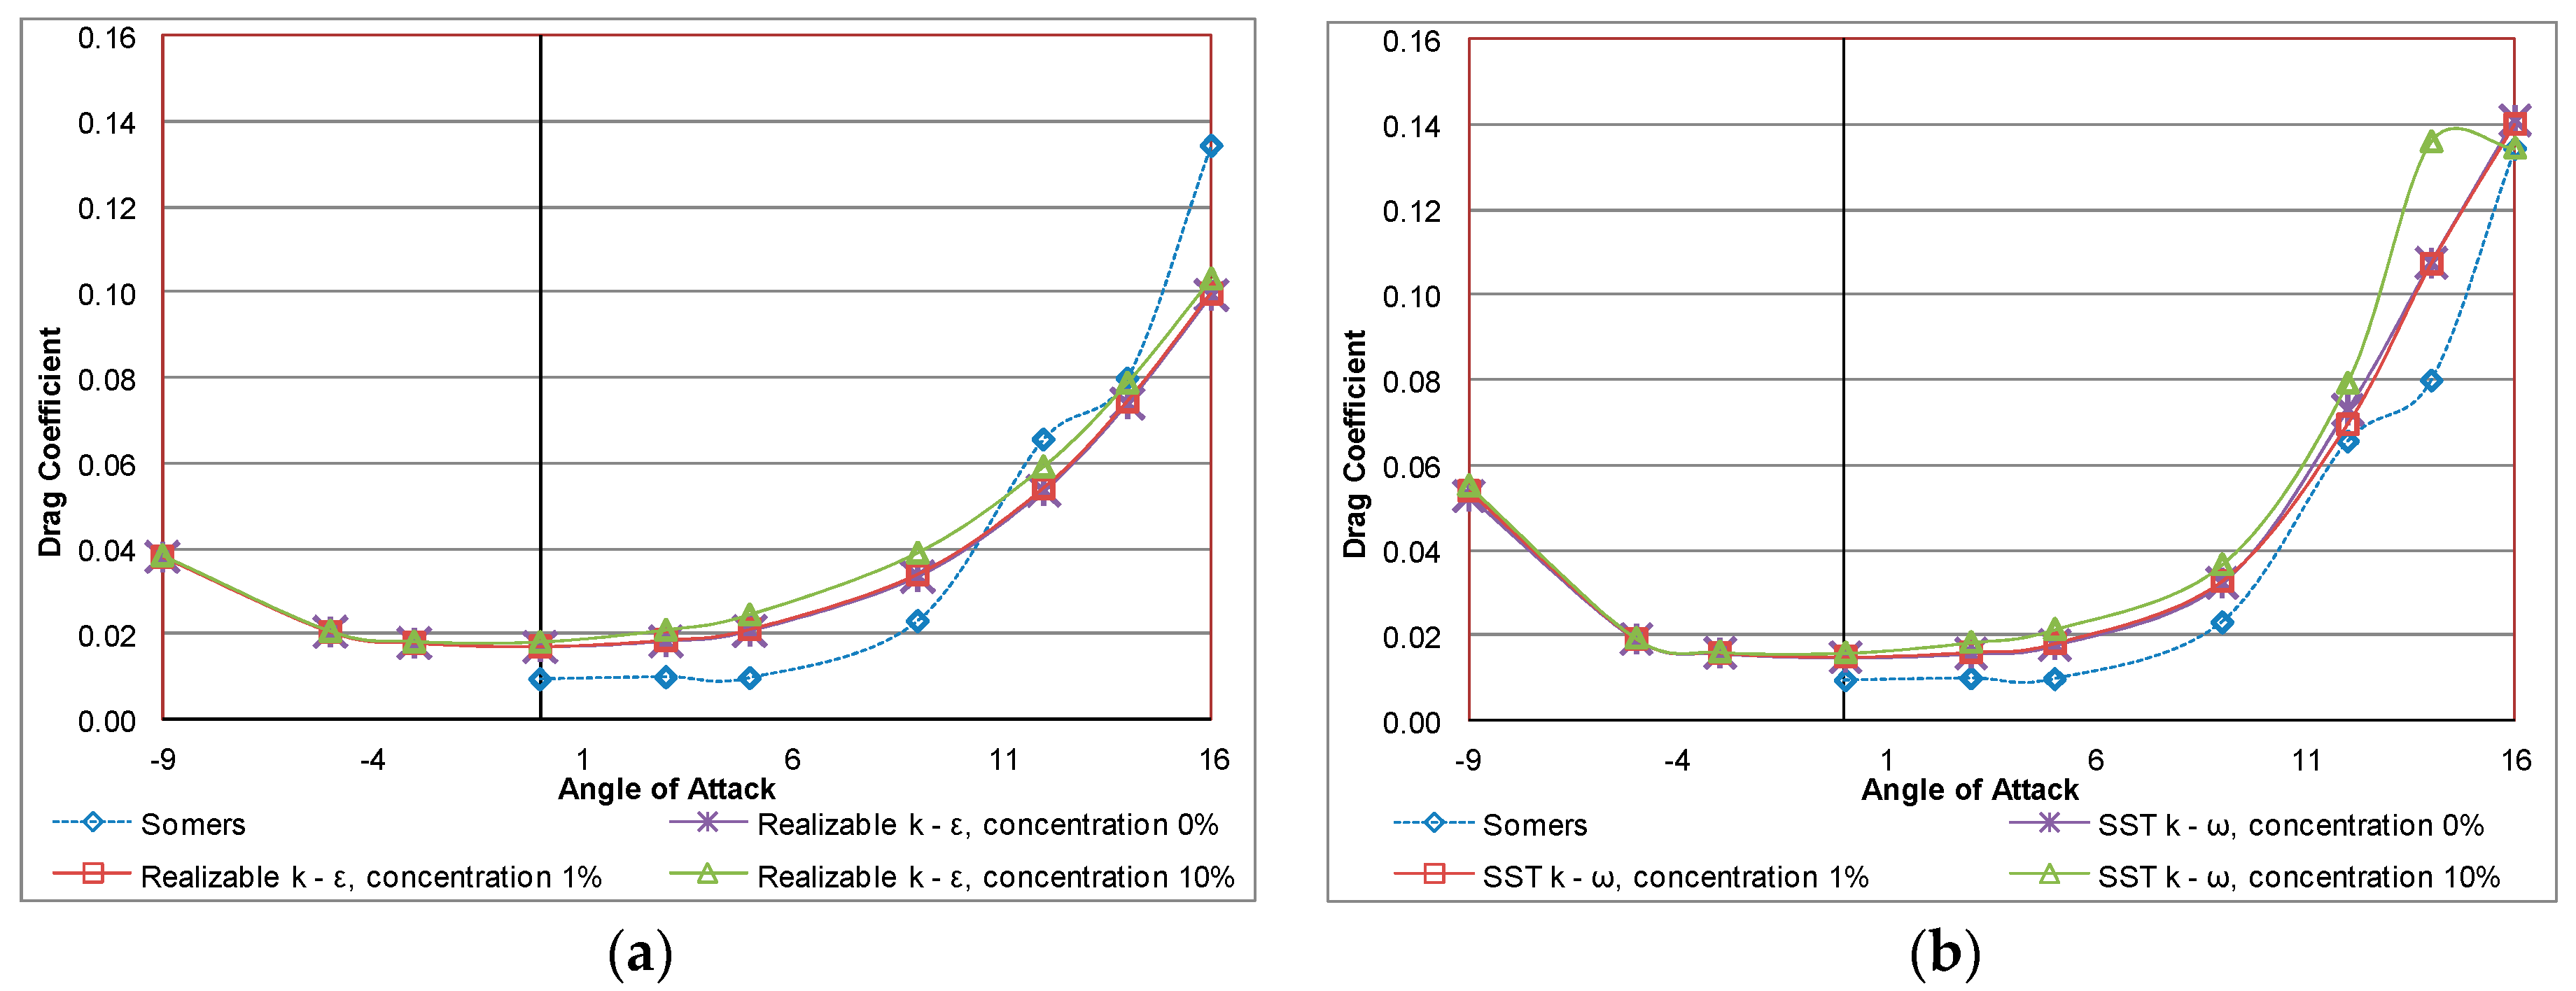
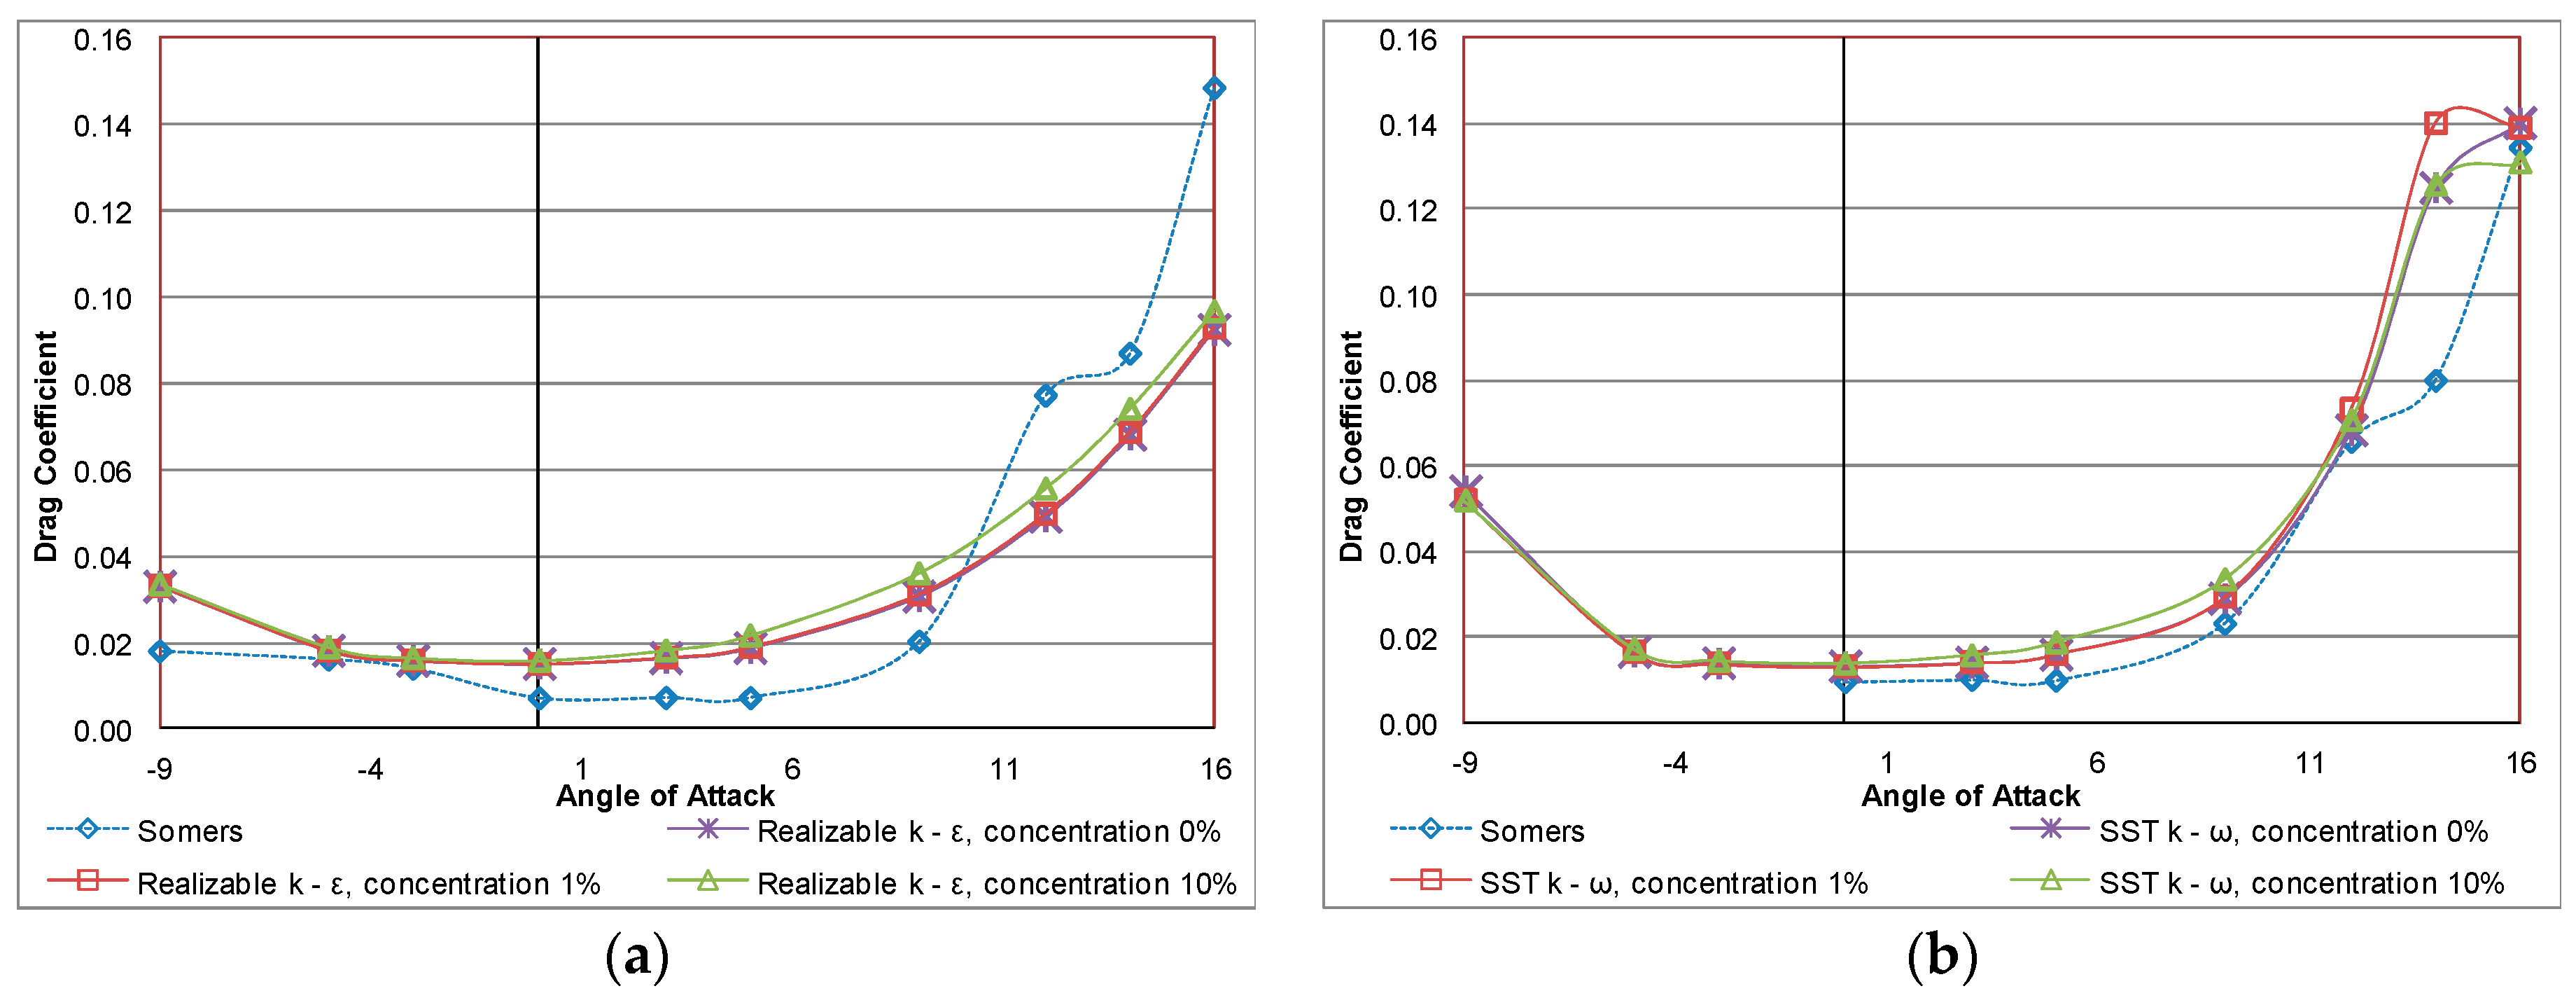
Figure 5 and
Figure 6 depict the simulation results of the drag coefficient for the S809 airfoil versus the angle of attack at Re = 1 × 10
6 and Re = 2 × 10
6, respectively. For both Reynolds numbers the predicted drag coefficient increases as the angle of attack and the concentrations of sand particles in the air increase. This increase is much more obvious for 10% concentration of sand particles in the air flow. The larger total drag is caused by the mixture of air and sand particles, which results in larger skin frictional drag. Despite that there is a significant difference between experimental data and numerical results.
As follows from the figures shown above, it can be concluded that the realizable k–ε turbulence model seems to be more appropriate than SST k–ω model to describe the two-phase flow over the S809 airfoil since the effect of sand concentration on the aerodynamic performance of the airfoil is more obvious for a wider range of angles of attack.
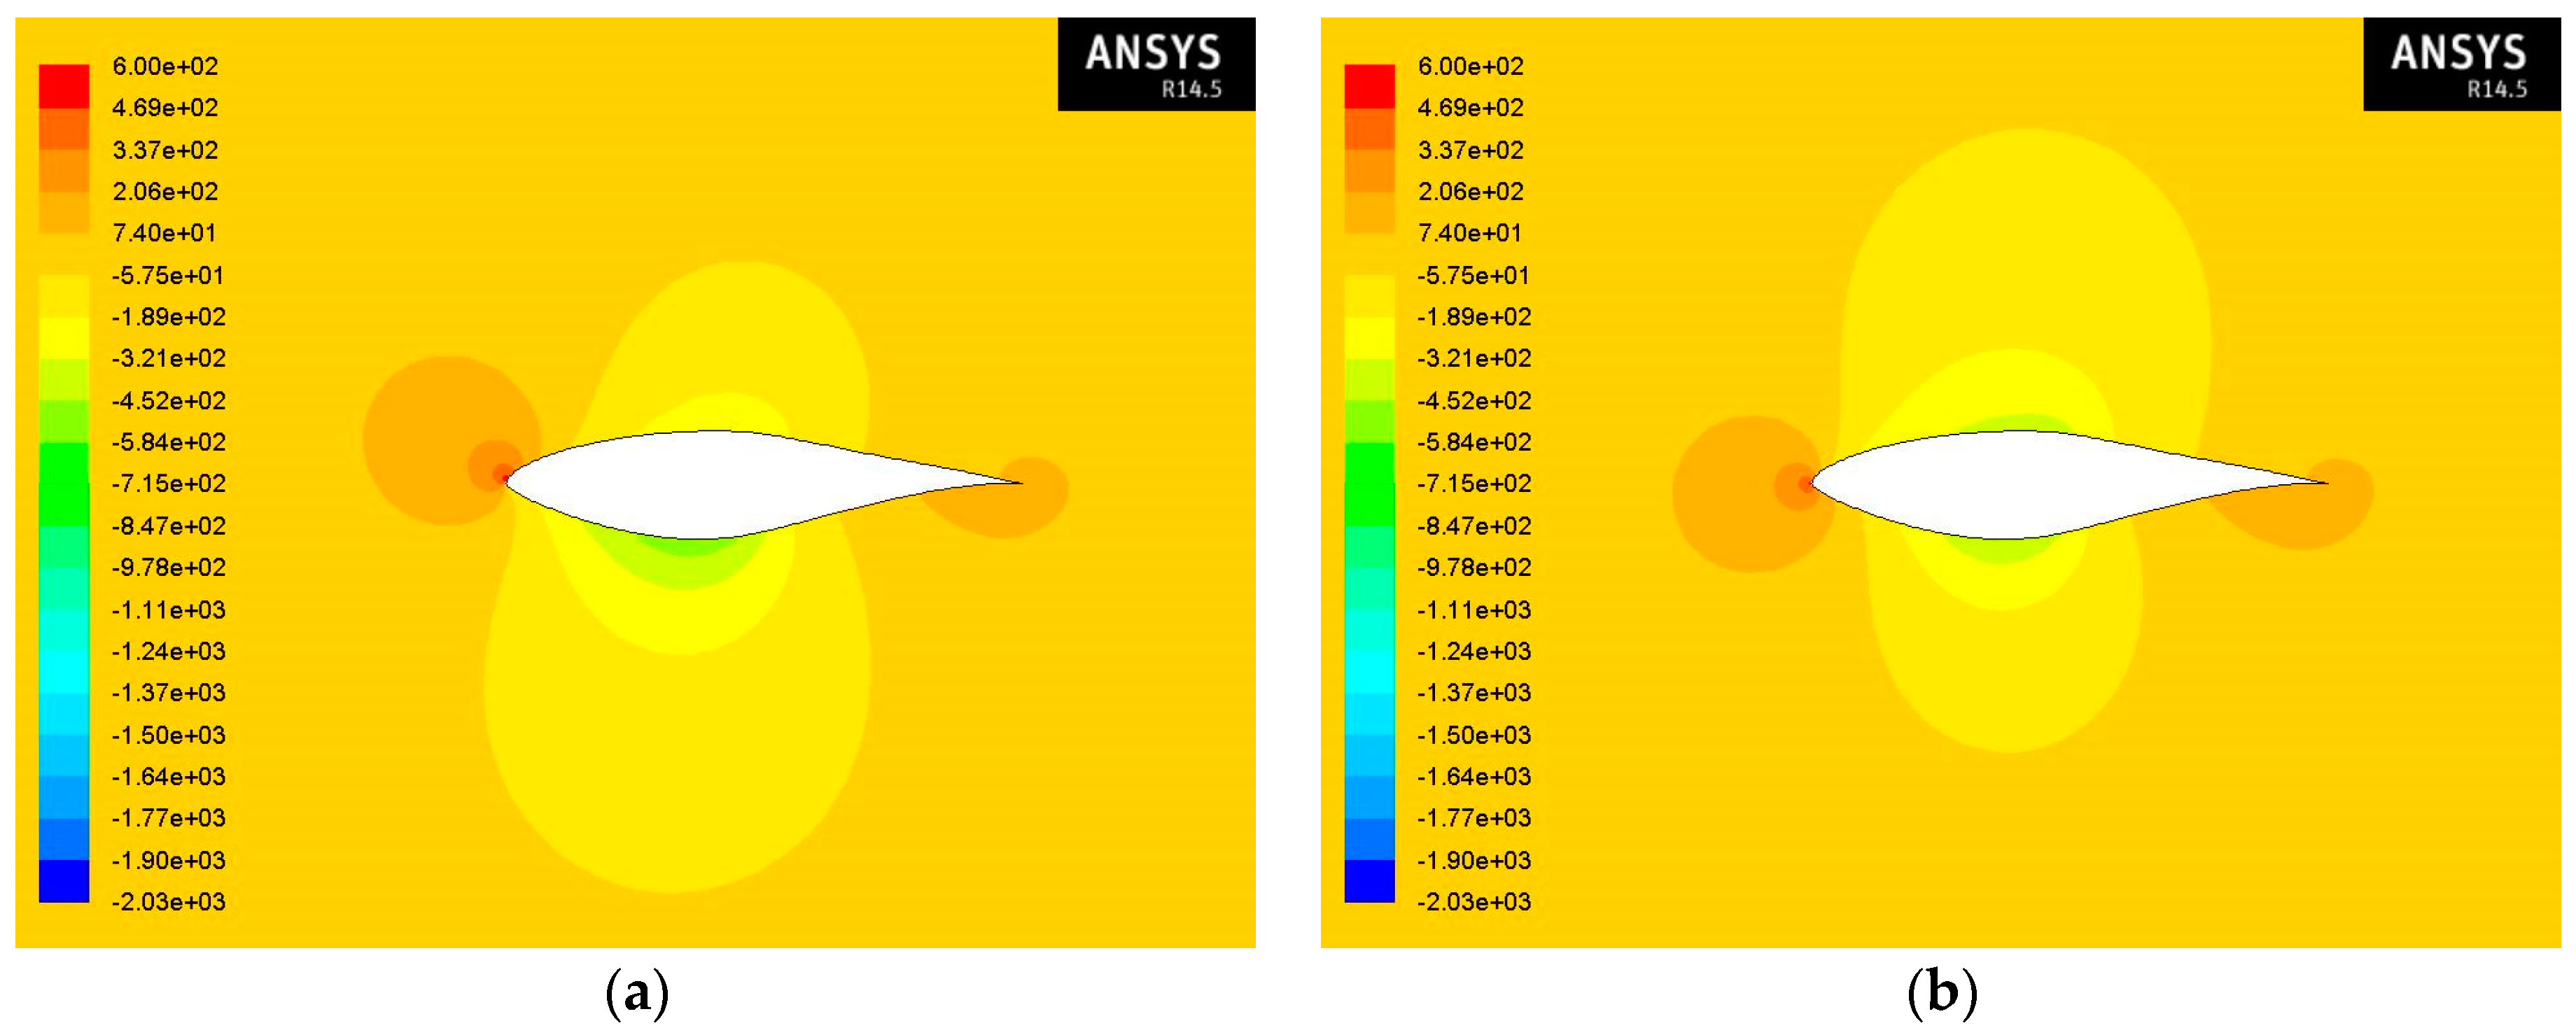
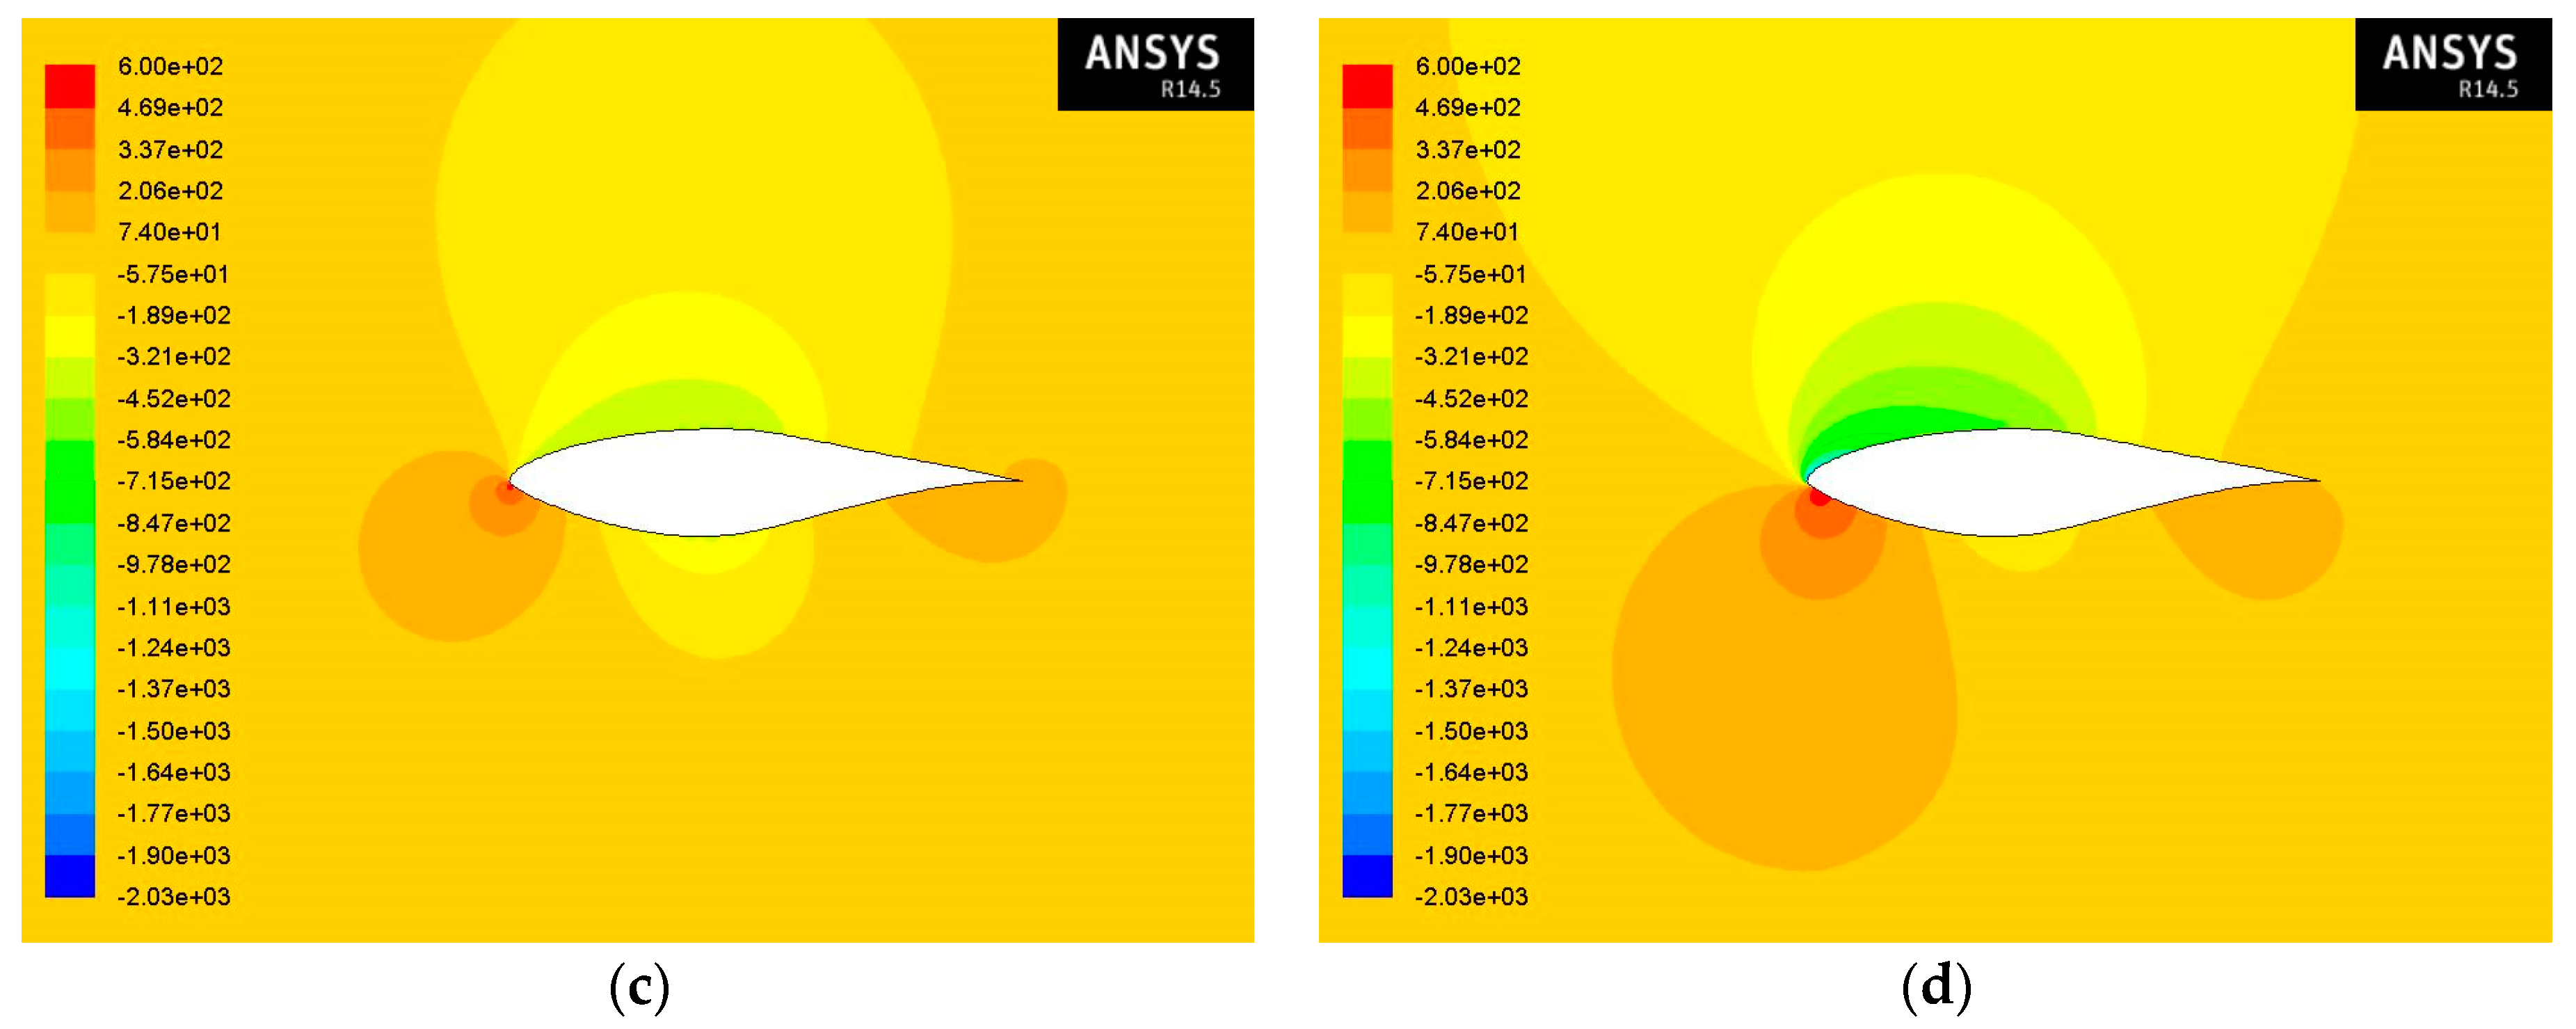
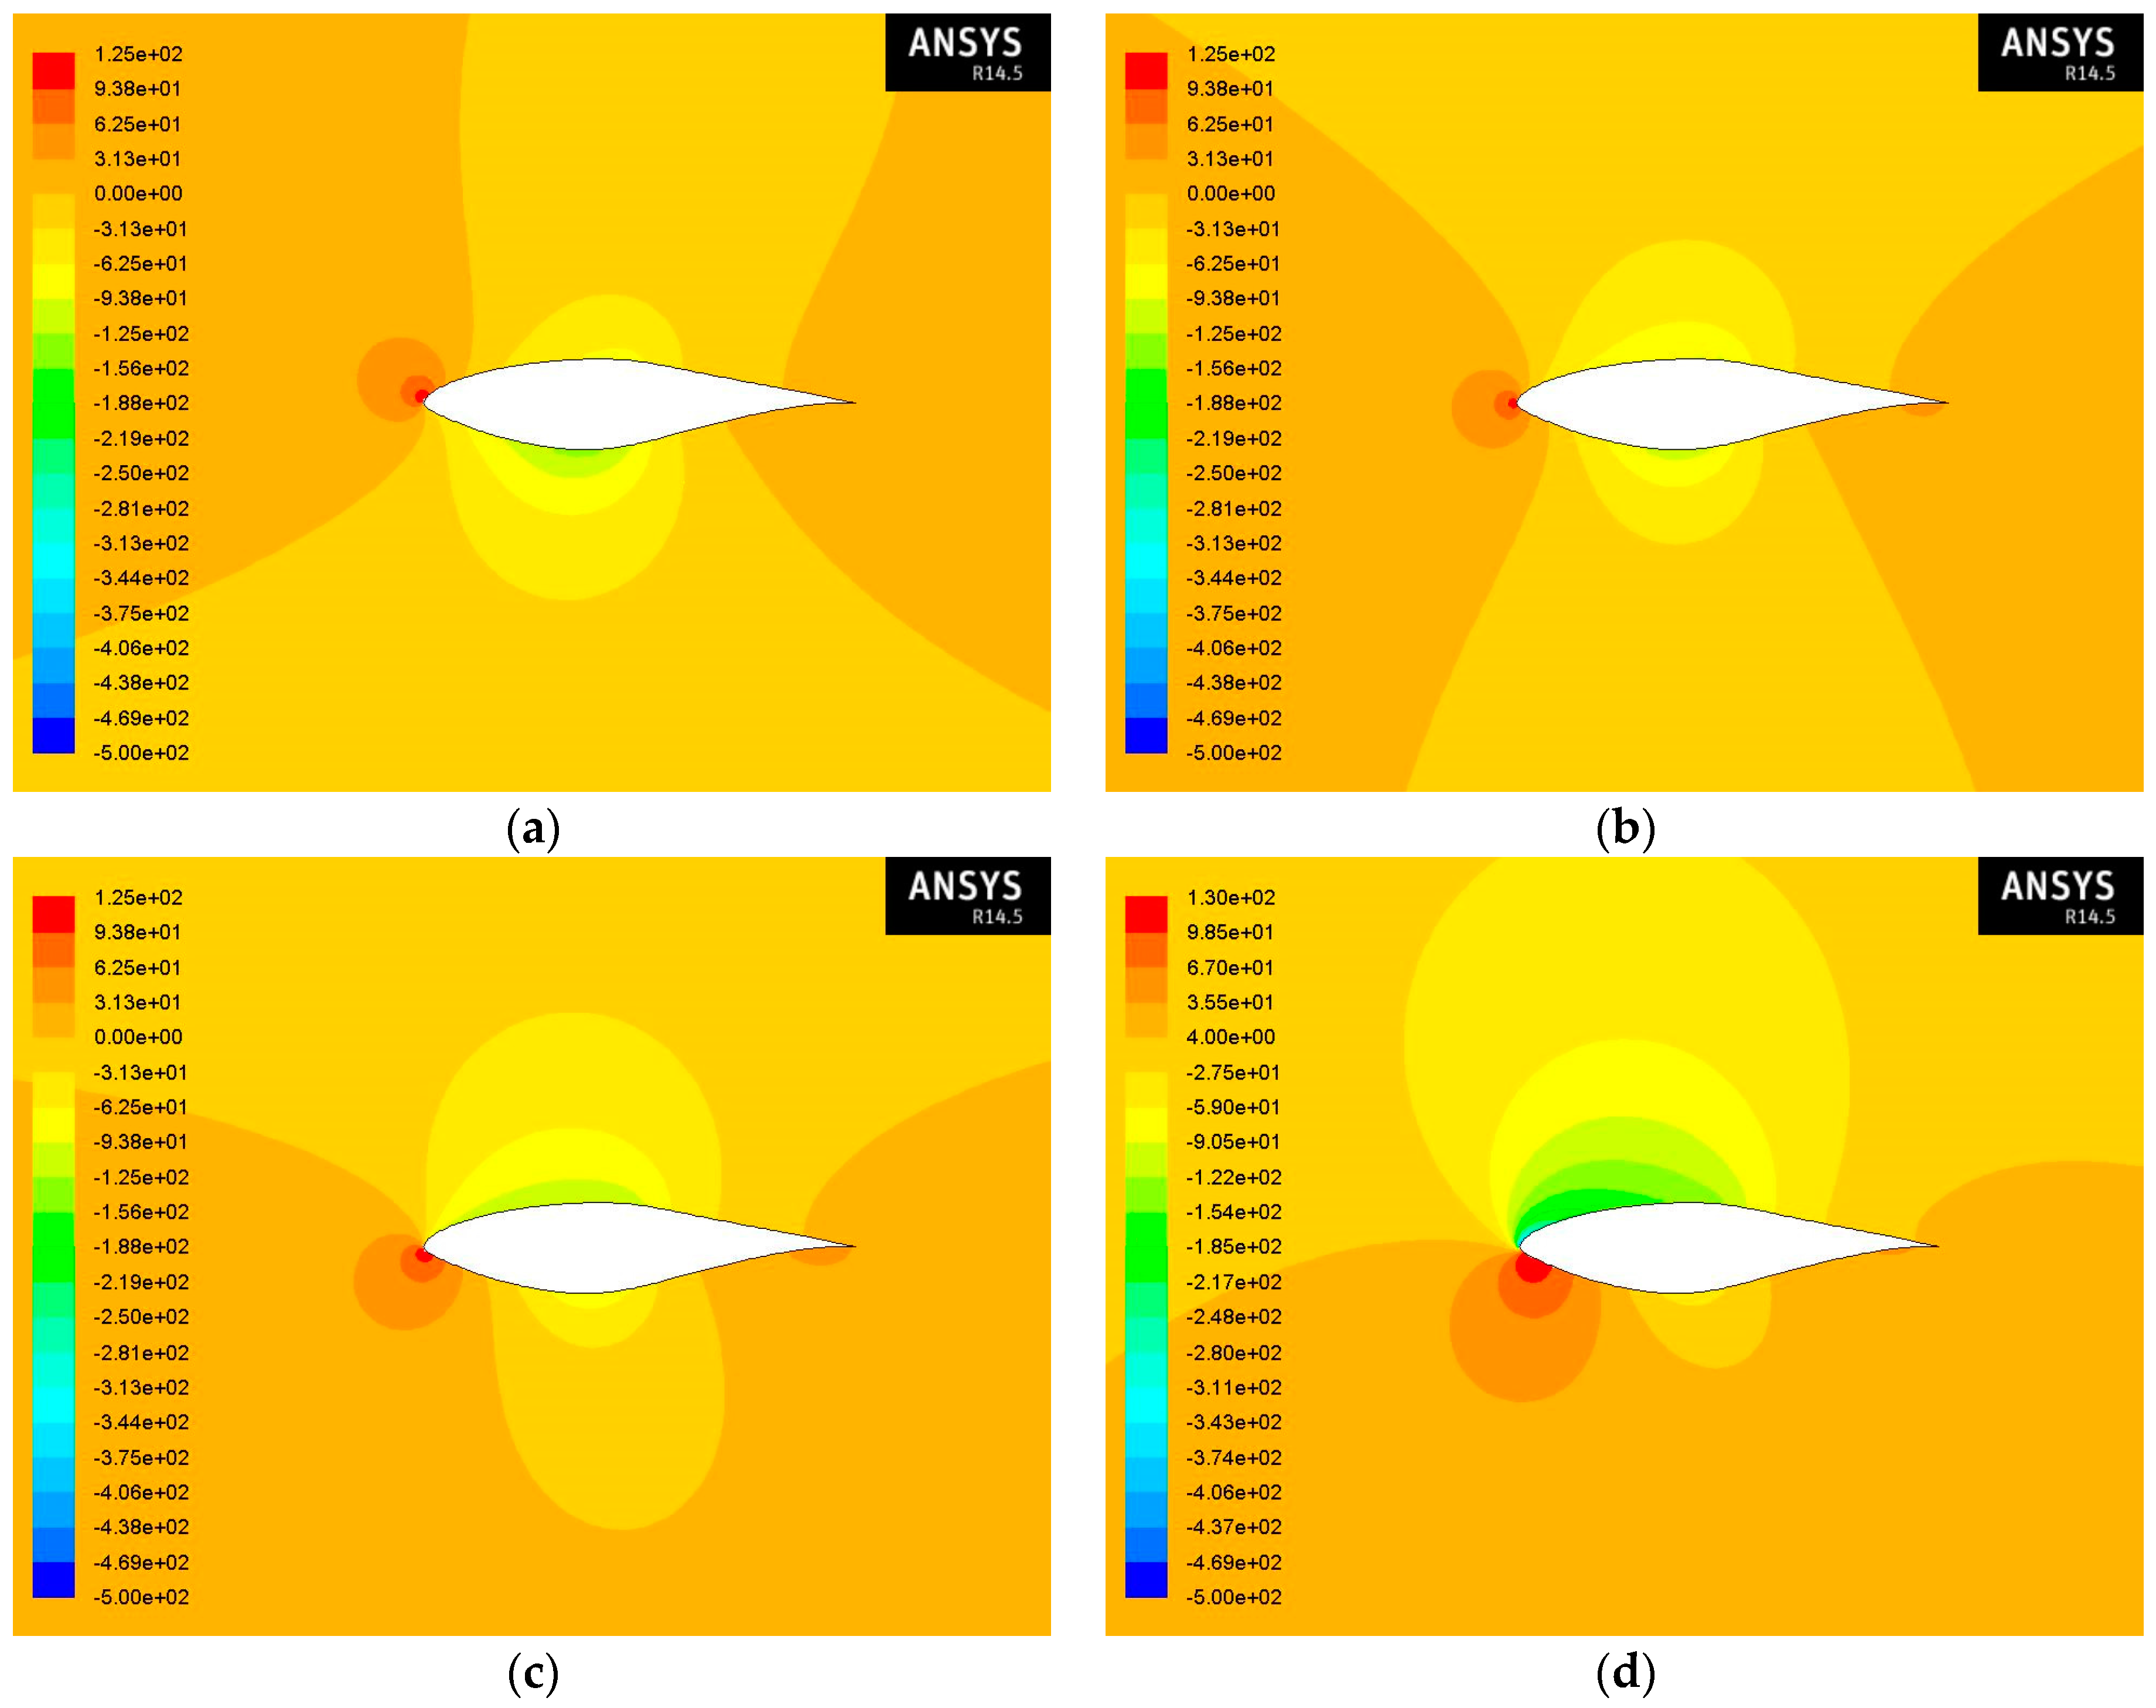
Next,
Figure 7,
Figure 8,
Figure 9,
Figure 10,
Figure 11 and
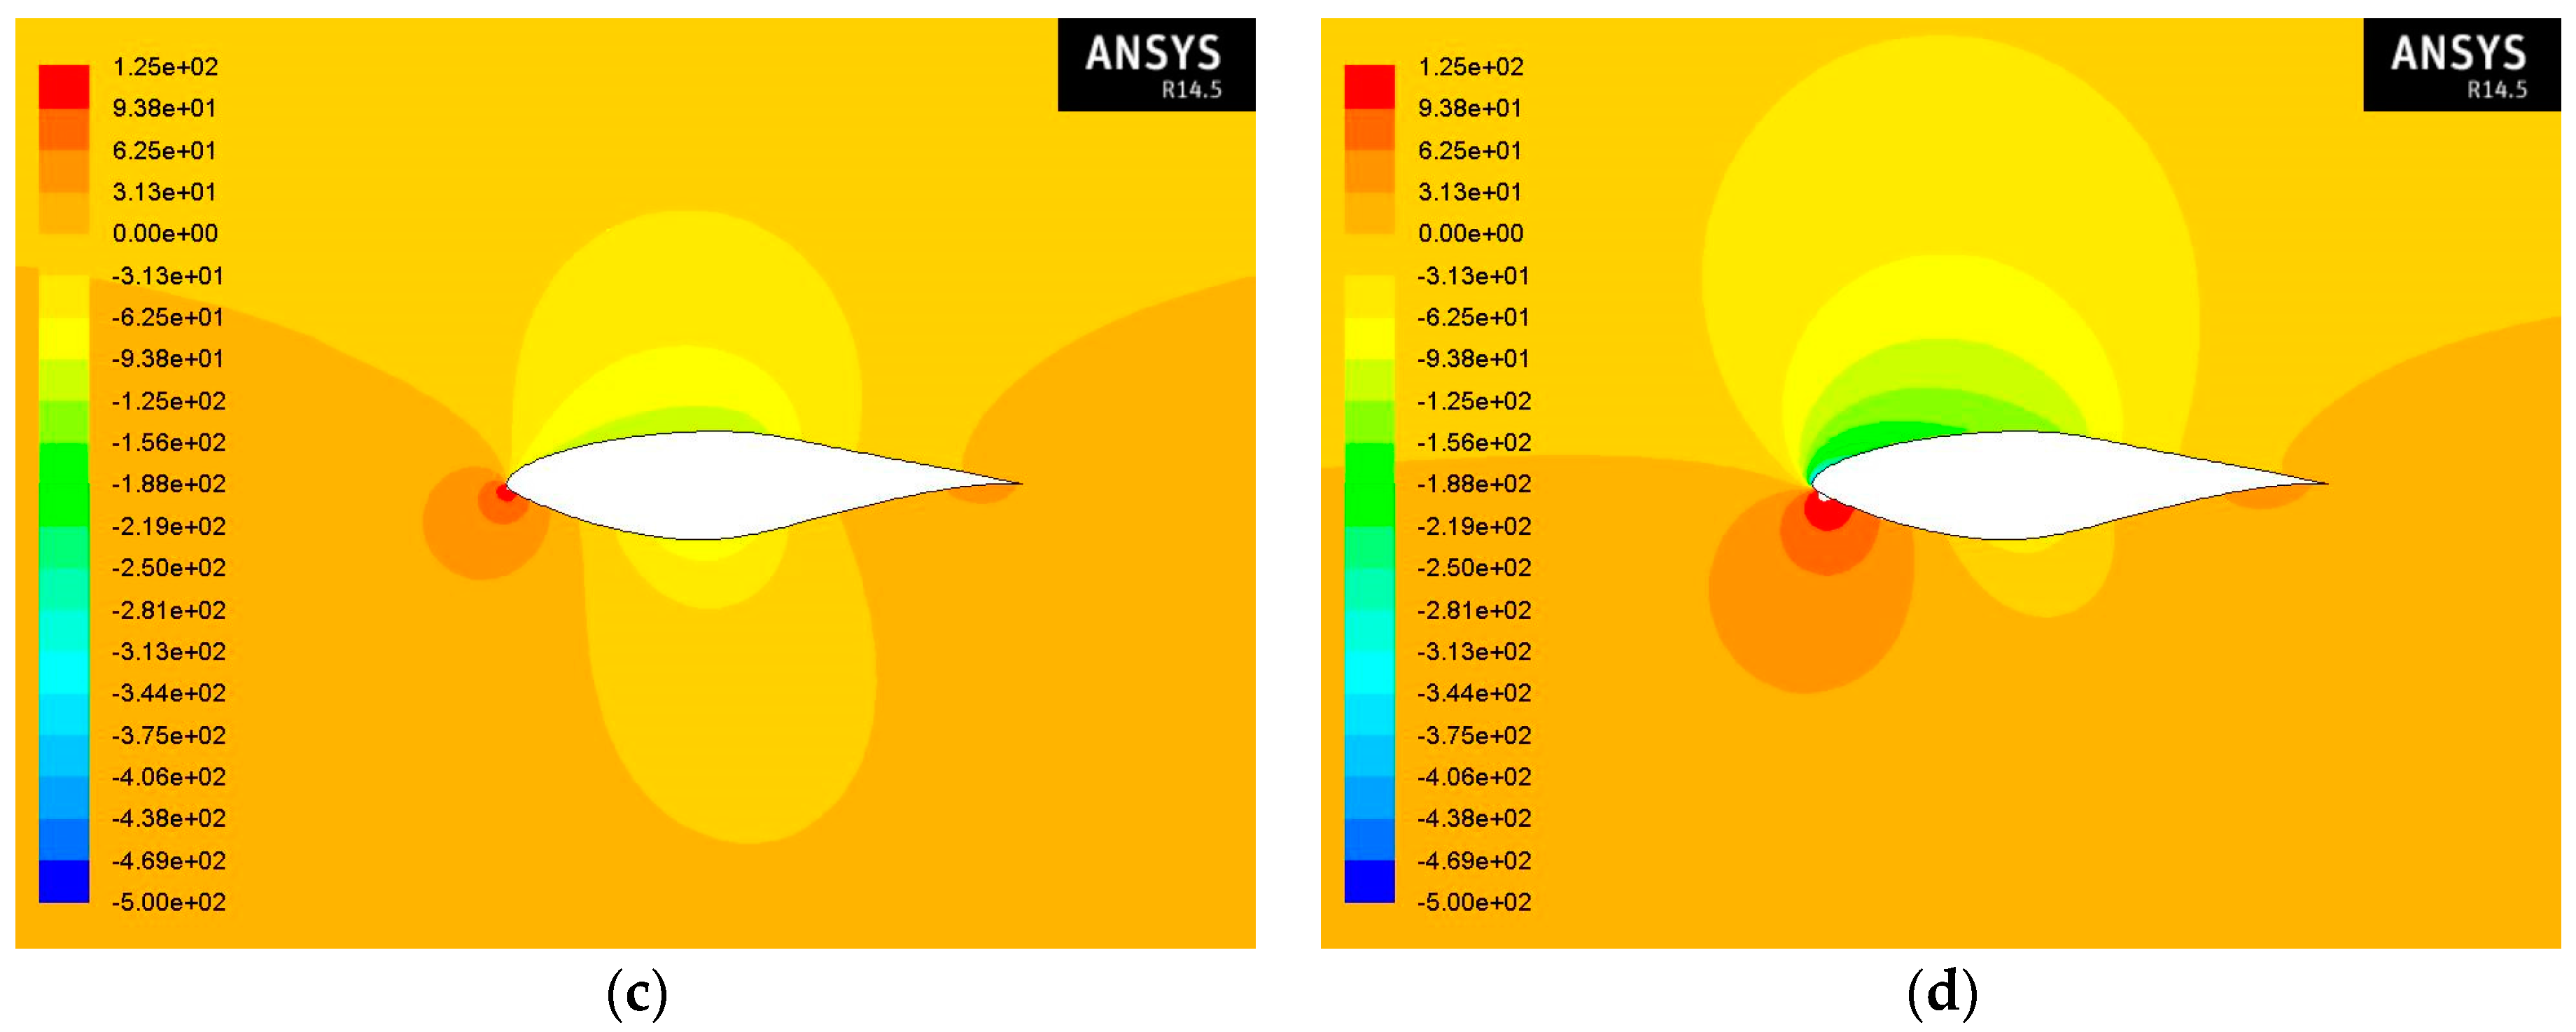
Figure 12 present the region around the S809 airfoil using contours of static pressure at angles of attack equal to −3°, 0°, 3°, and 9°, and at Reynolds numbers of Re = 1 × 10
6 and Re = 2 × 10
6 with the realizable k–ε model for air flow and air-sand particle two-phase flow consisting of 1% and 10% concentration of sand particles in the air.
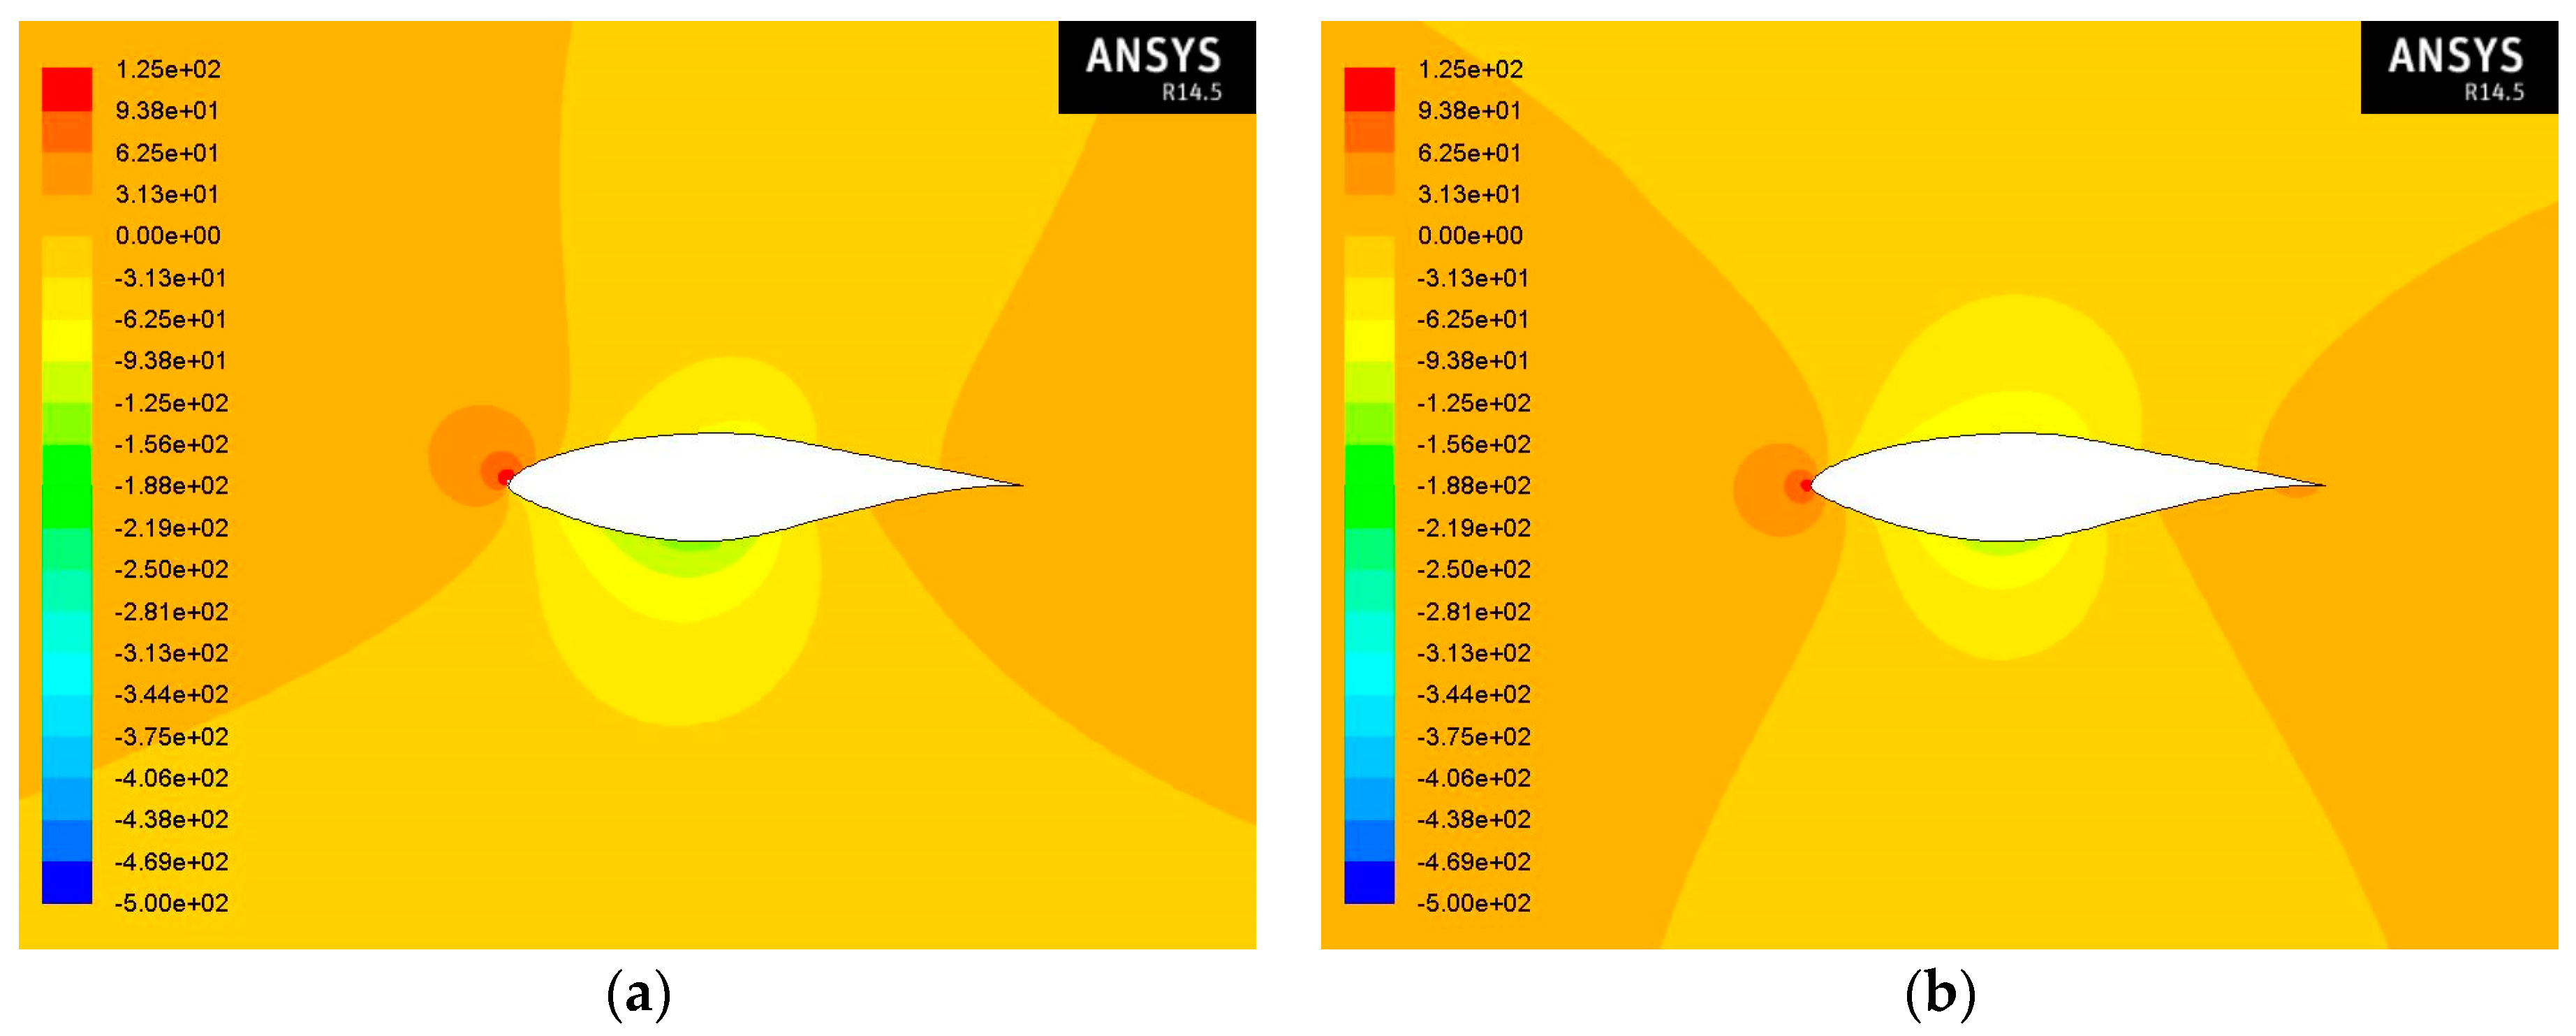
To begin with,
Figure 7 shows the contours of static pressure at various angles of attack and at Re = 1 × 10
6 for an S809 airfoil for air flow. Notably, the stagnation points, in other words the points in a flow where the fluid velocity is zero and, thus, the static pressure is equal to the total, are obvious. As can be seen, the pressure on the lower surface of the airfoil is greater than the pressure of the incoming flow stream. As a result, the airfoil is effectively “pushed” upward, normal to the incoming flow stream. Moreover, it can be seen that as the angle of attack increases, the trailing edge stagnation point moves forward on the airfoil.
Regarding the effect of sand particles on the aerodynamic performance, the contours shown in
Figure 8 in the case of 1% concentration of sand particles in the air seem to be almost the same with the respective static pressure contours for the air flow.
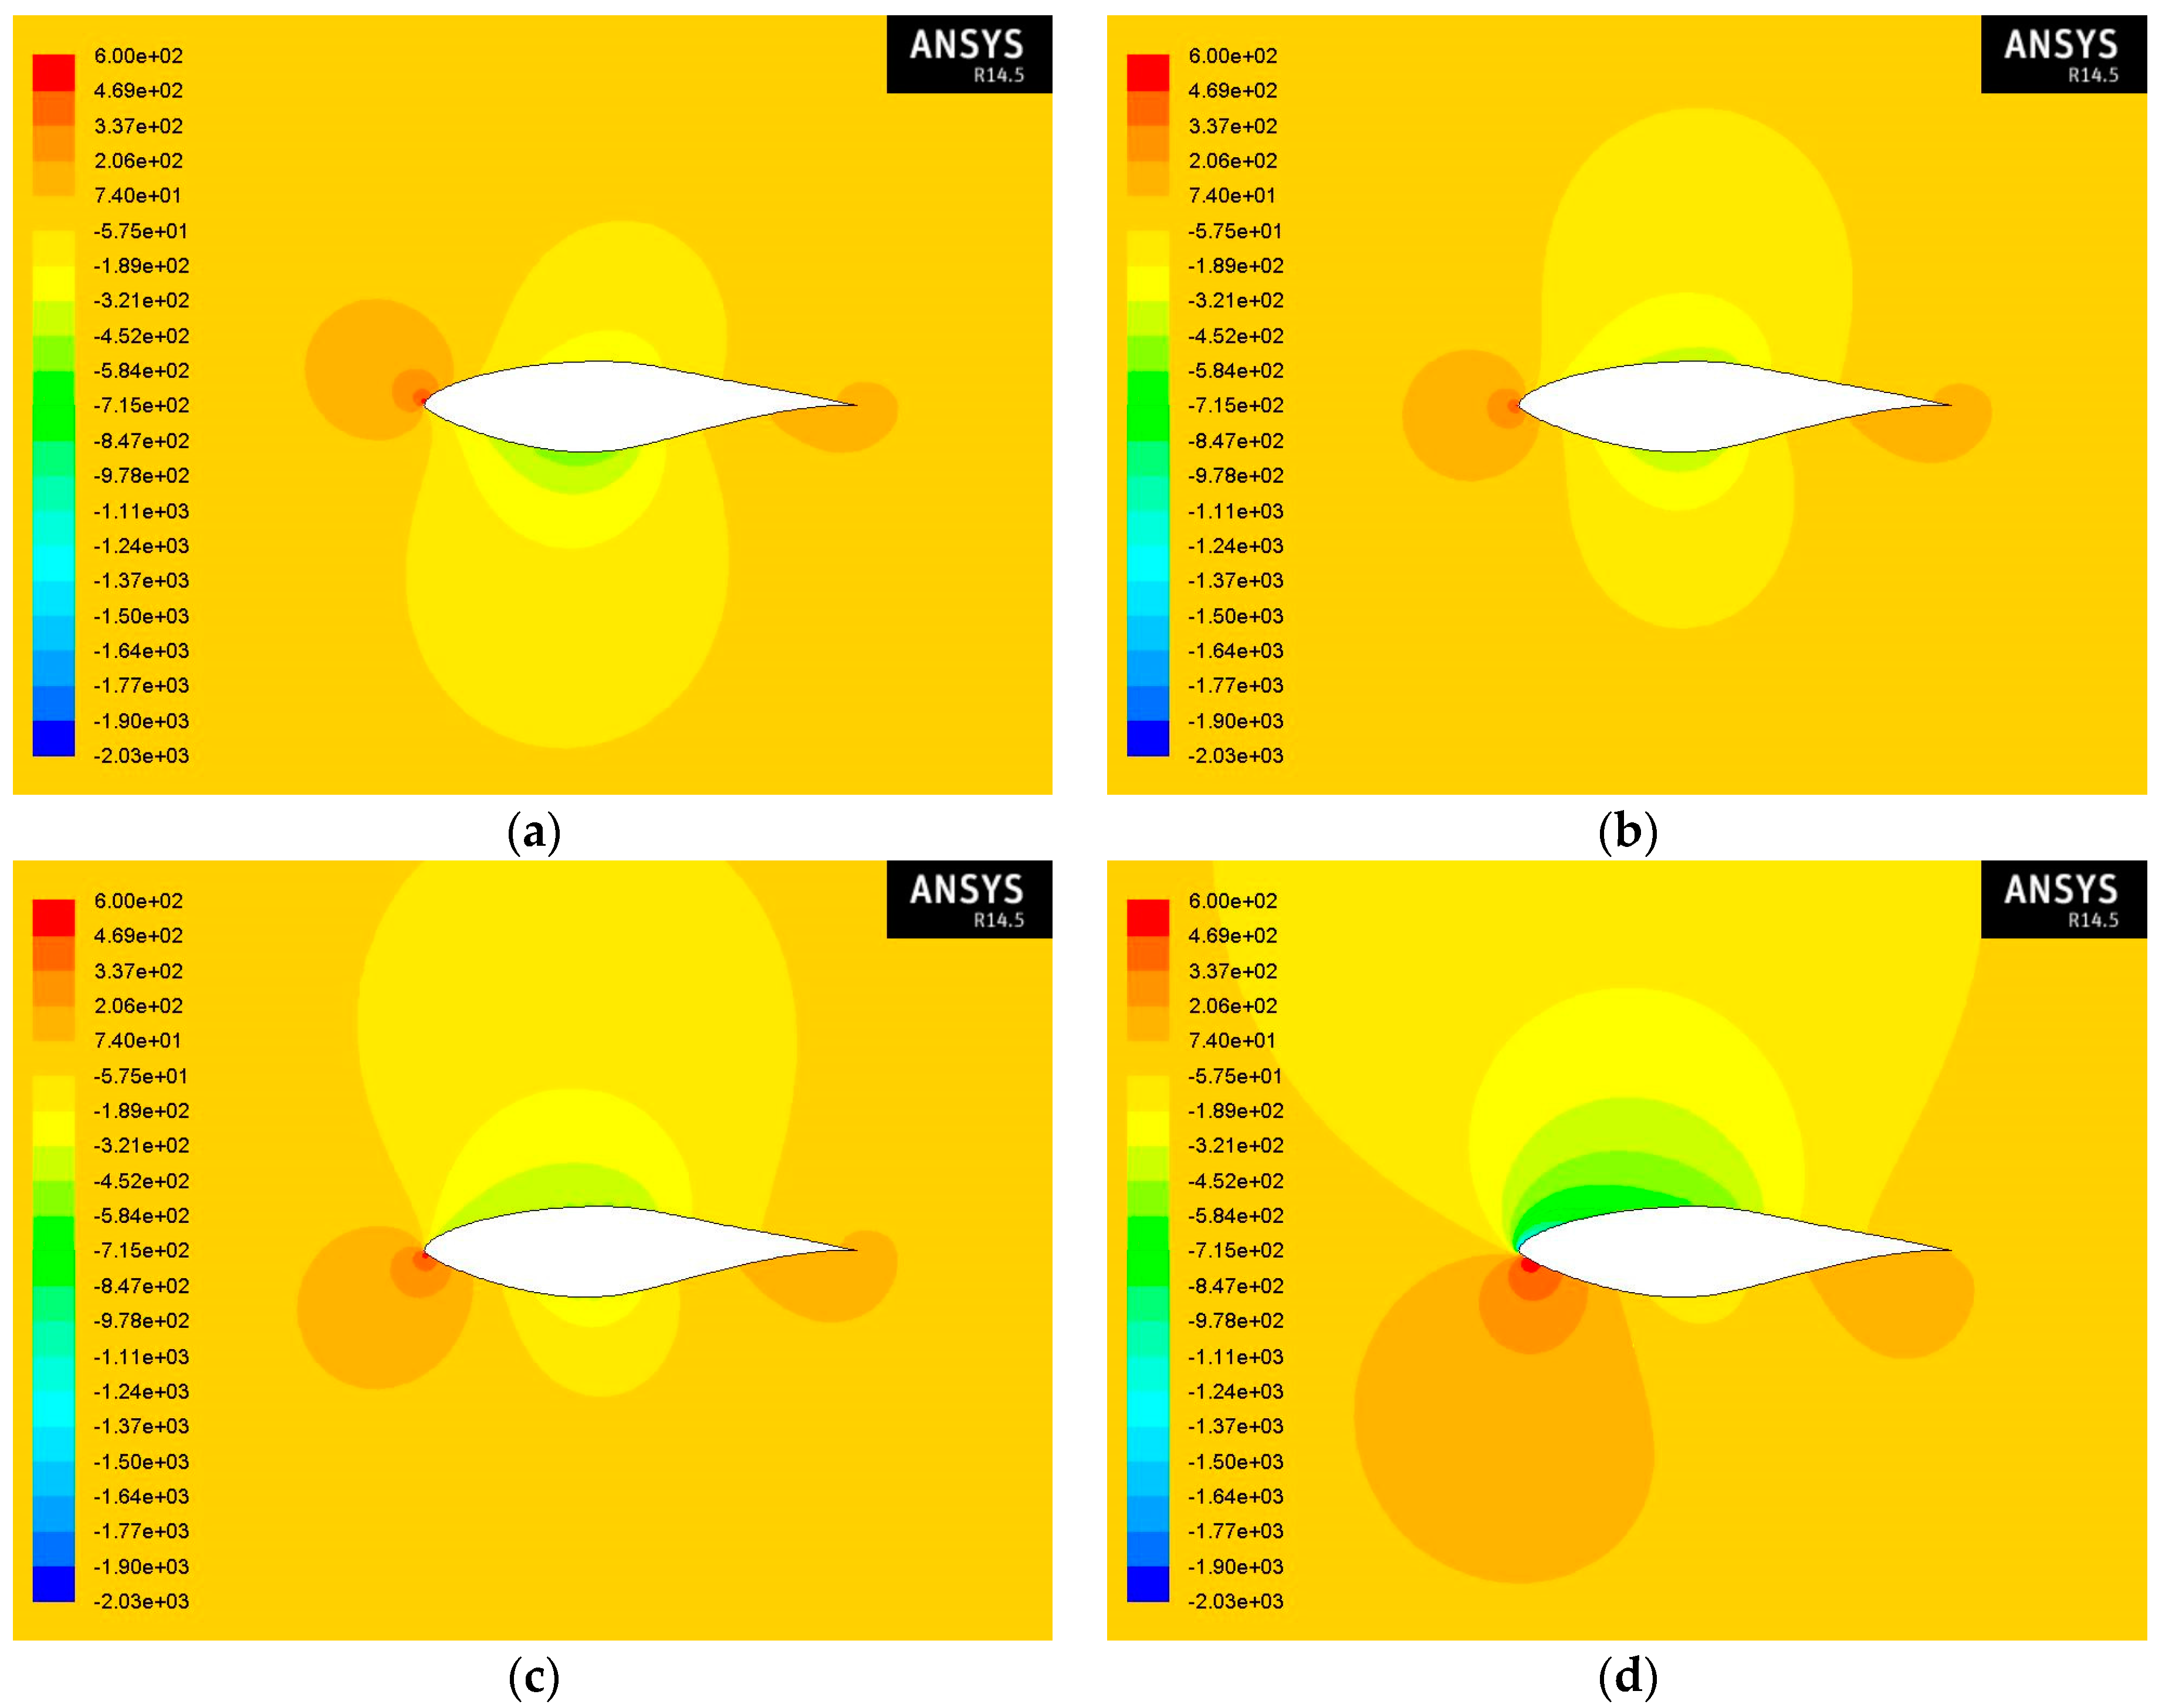
In
Figure 9 are shown the contours of static pressure in the case of 10% concentration of sand particles in the air. In comparison with the contours for the air flow a very small difference can be observed. More specifically, the pressure seems to achieve lower values on the lower surface and higher values on the upper surface as the concentration increases.
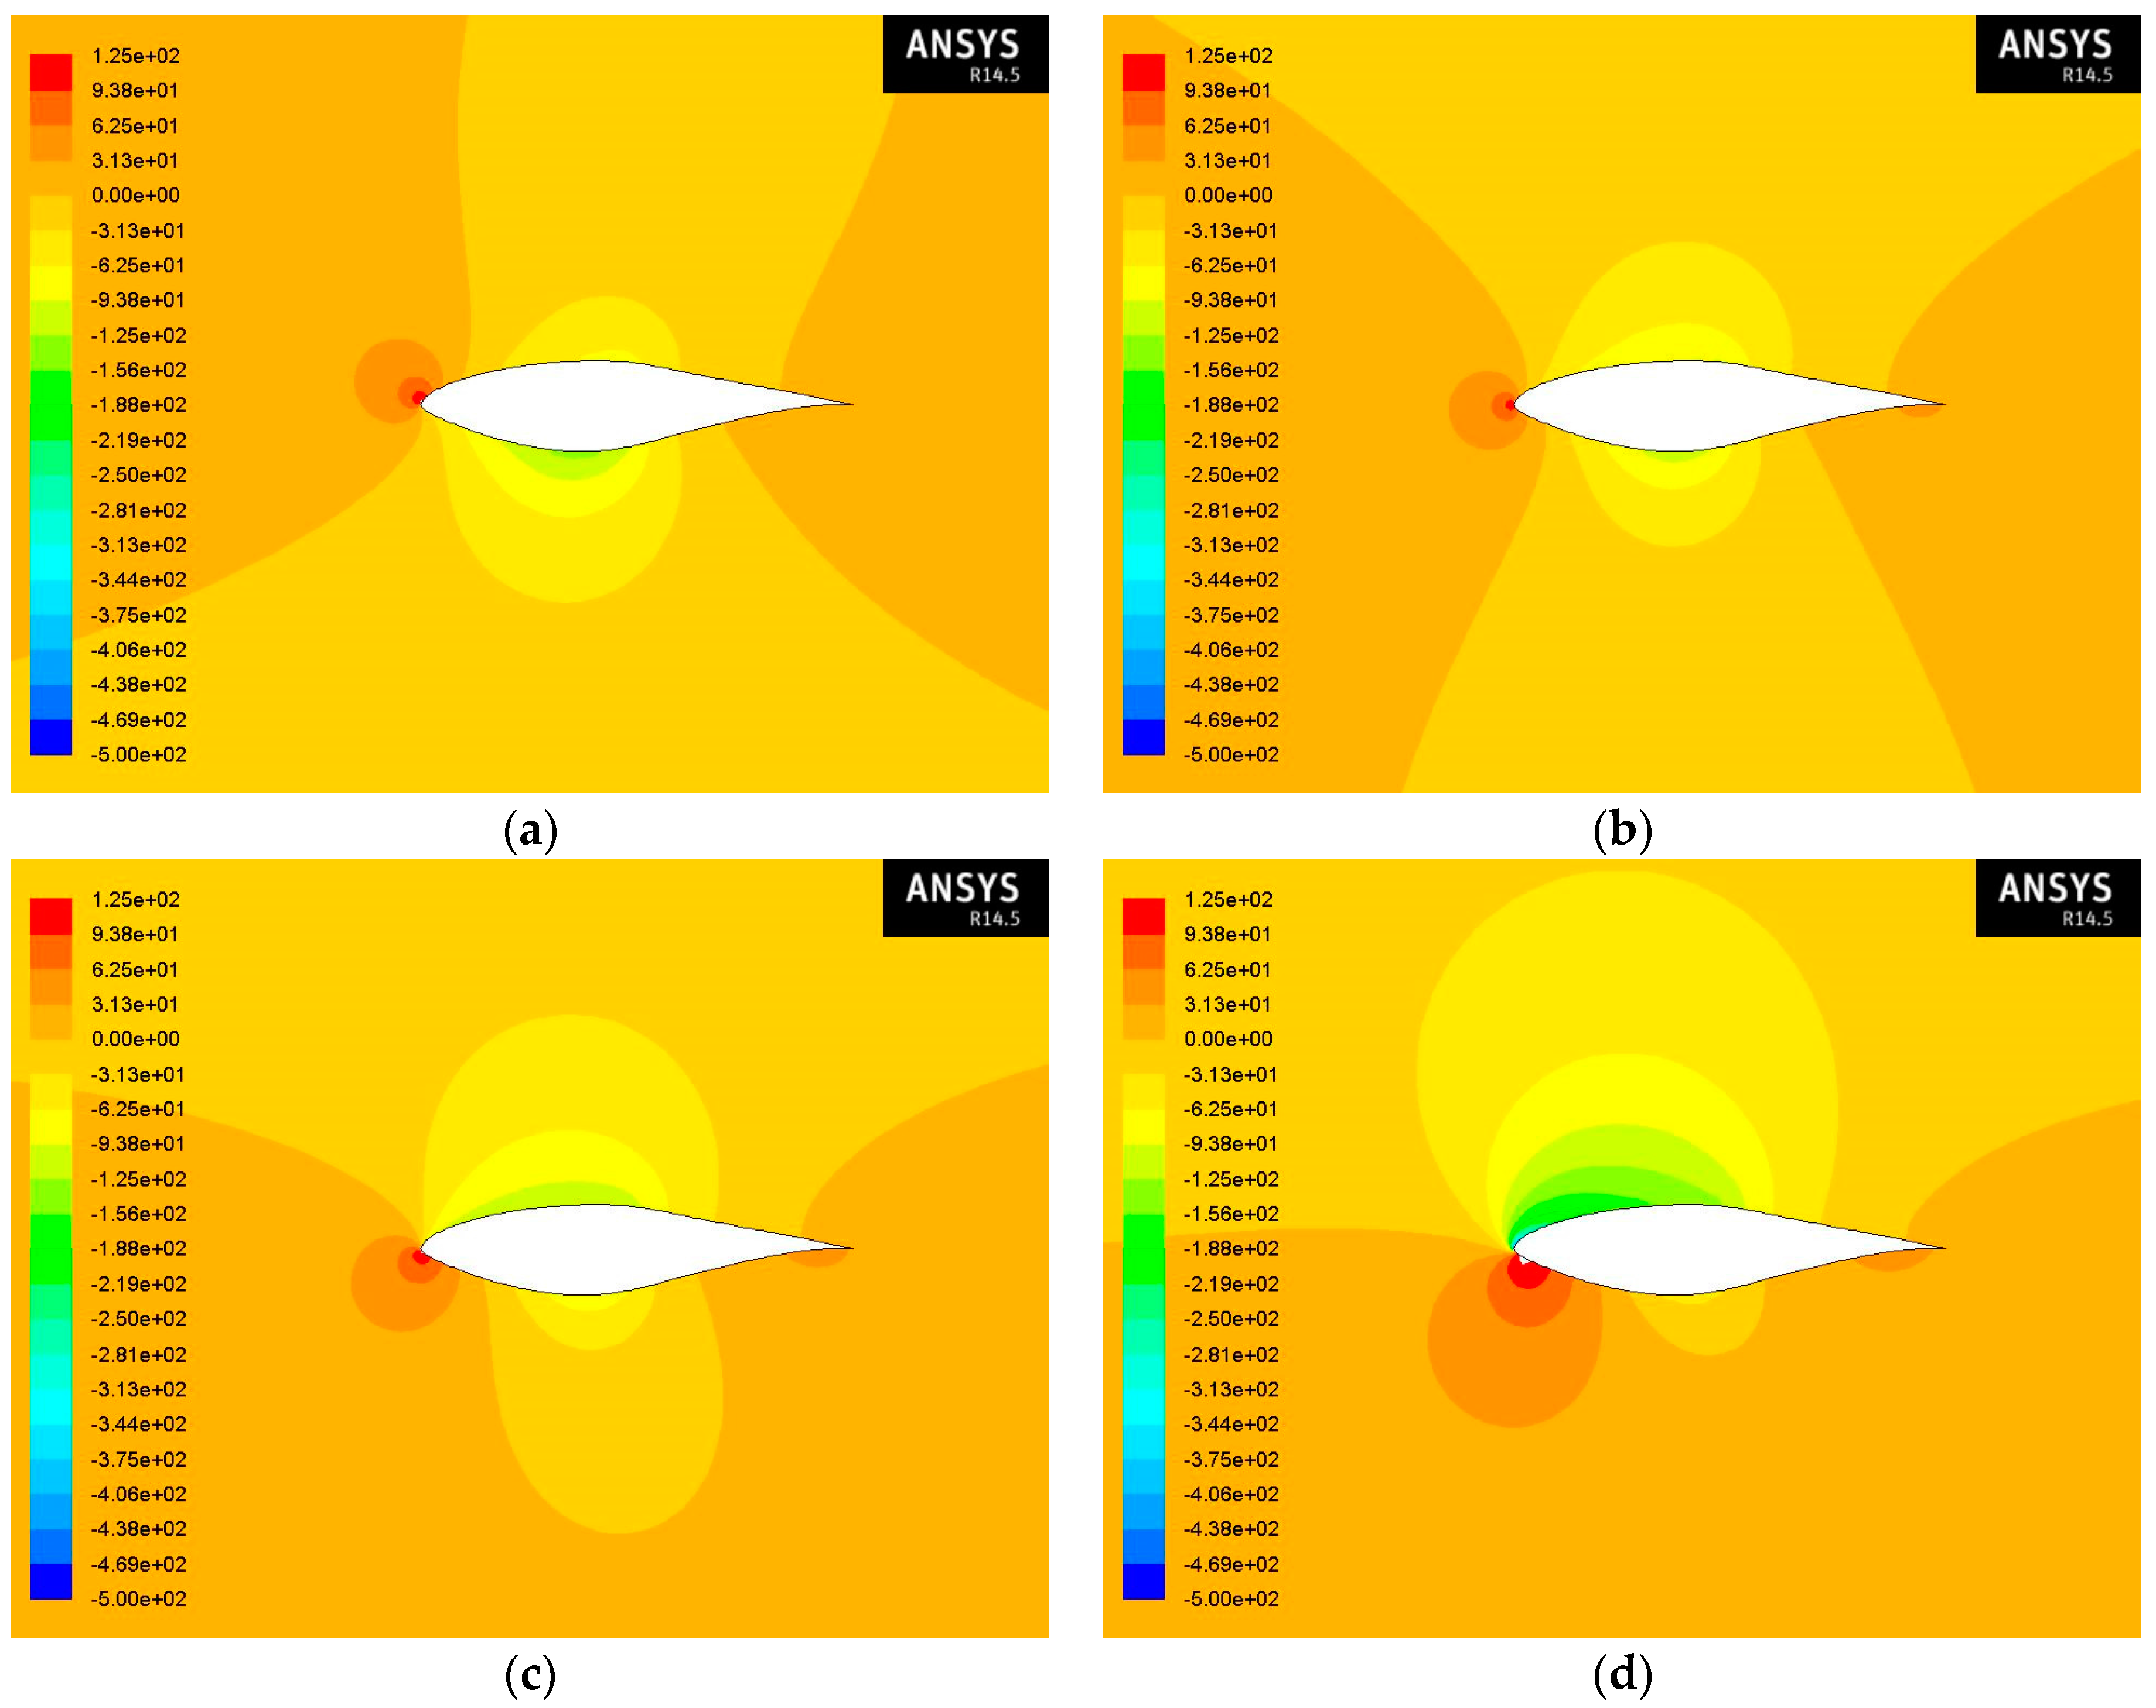
The contours of static pressure at various angles of attack and at Re = 2 × 10
6 for air flow and air-sand particle two-phase flow for 1% and 10% concentration of sand particles in the air are given in
Figure 10,
Figure 11 and
Figure 12 and they seem to have similar behavior with the contours of static pressure at Re = 1 × 10
6. However, as the Reynolds number increases, the upper surface pressure achieves lower values for each angle of attack.
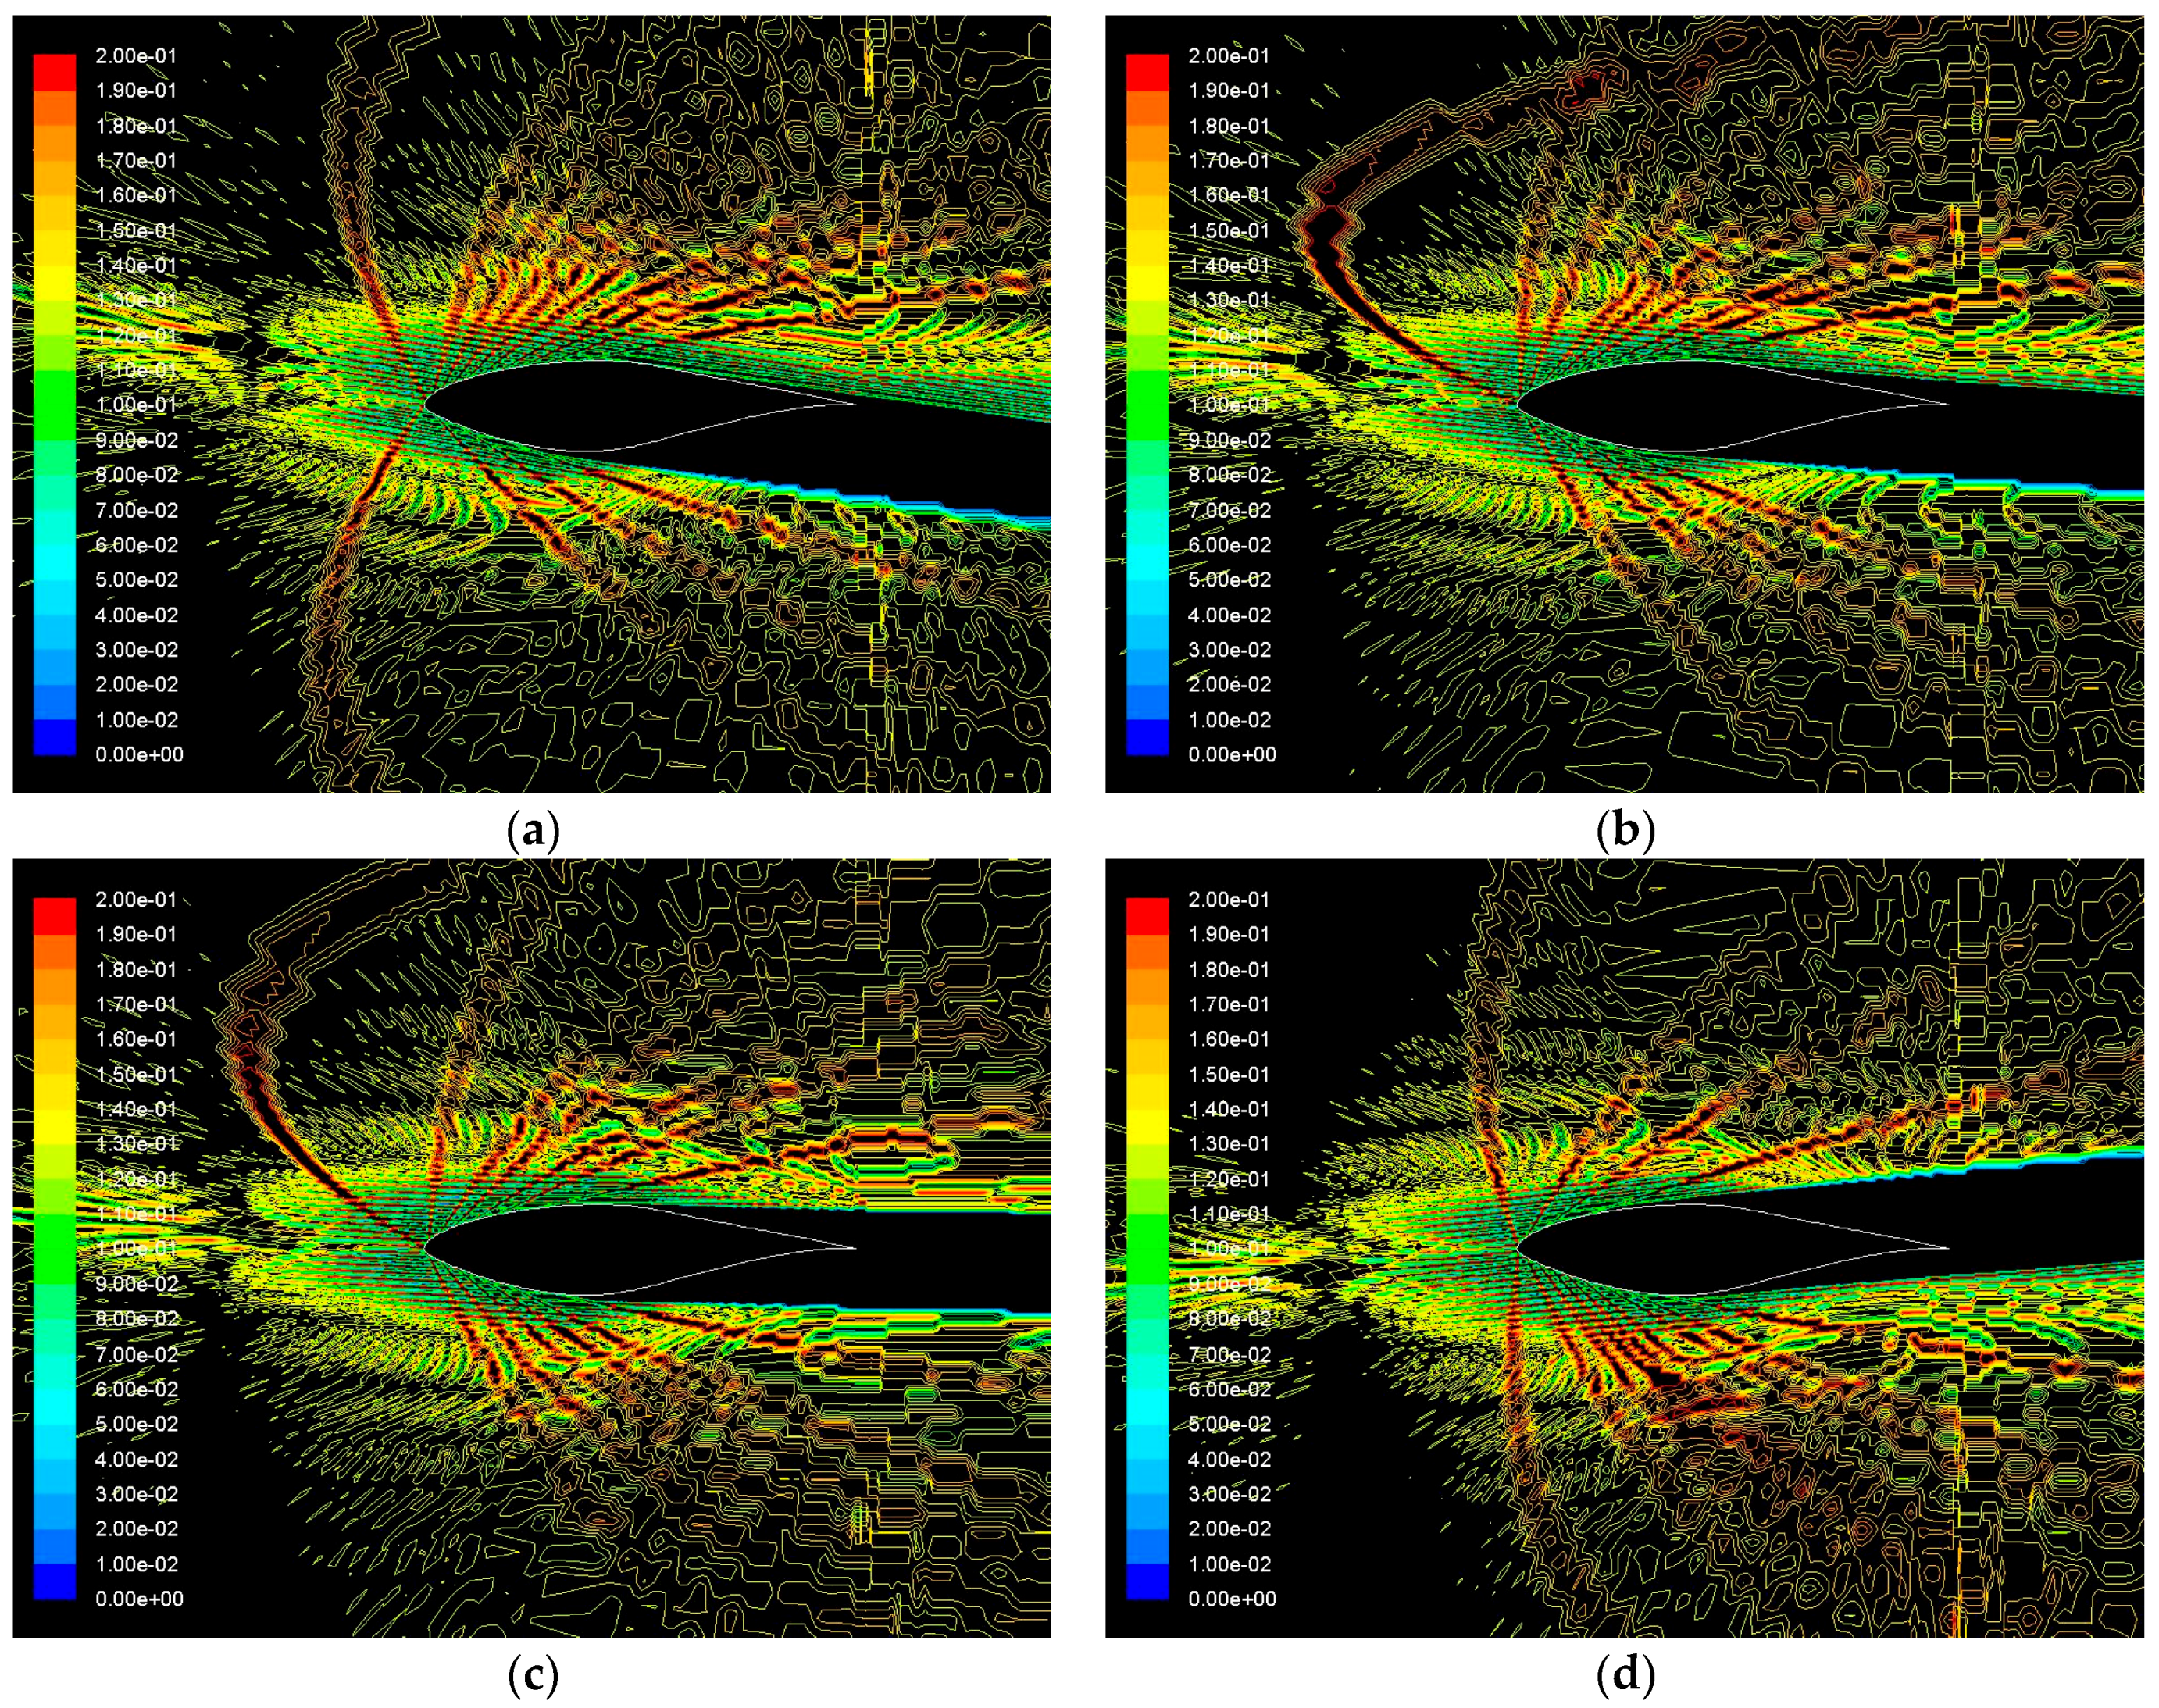
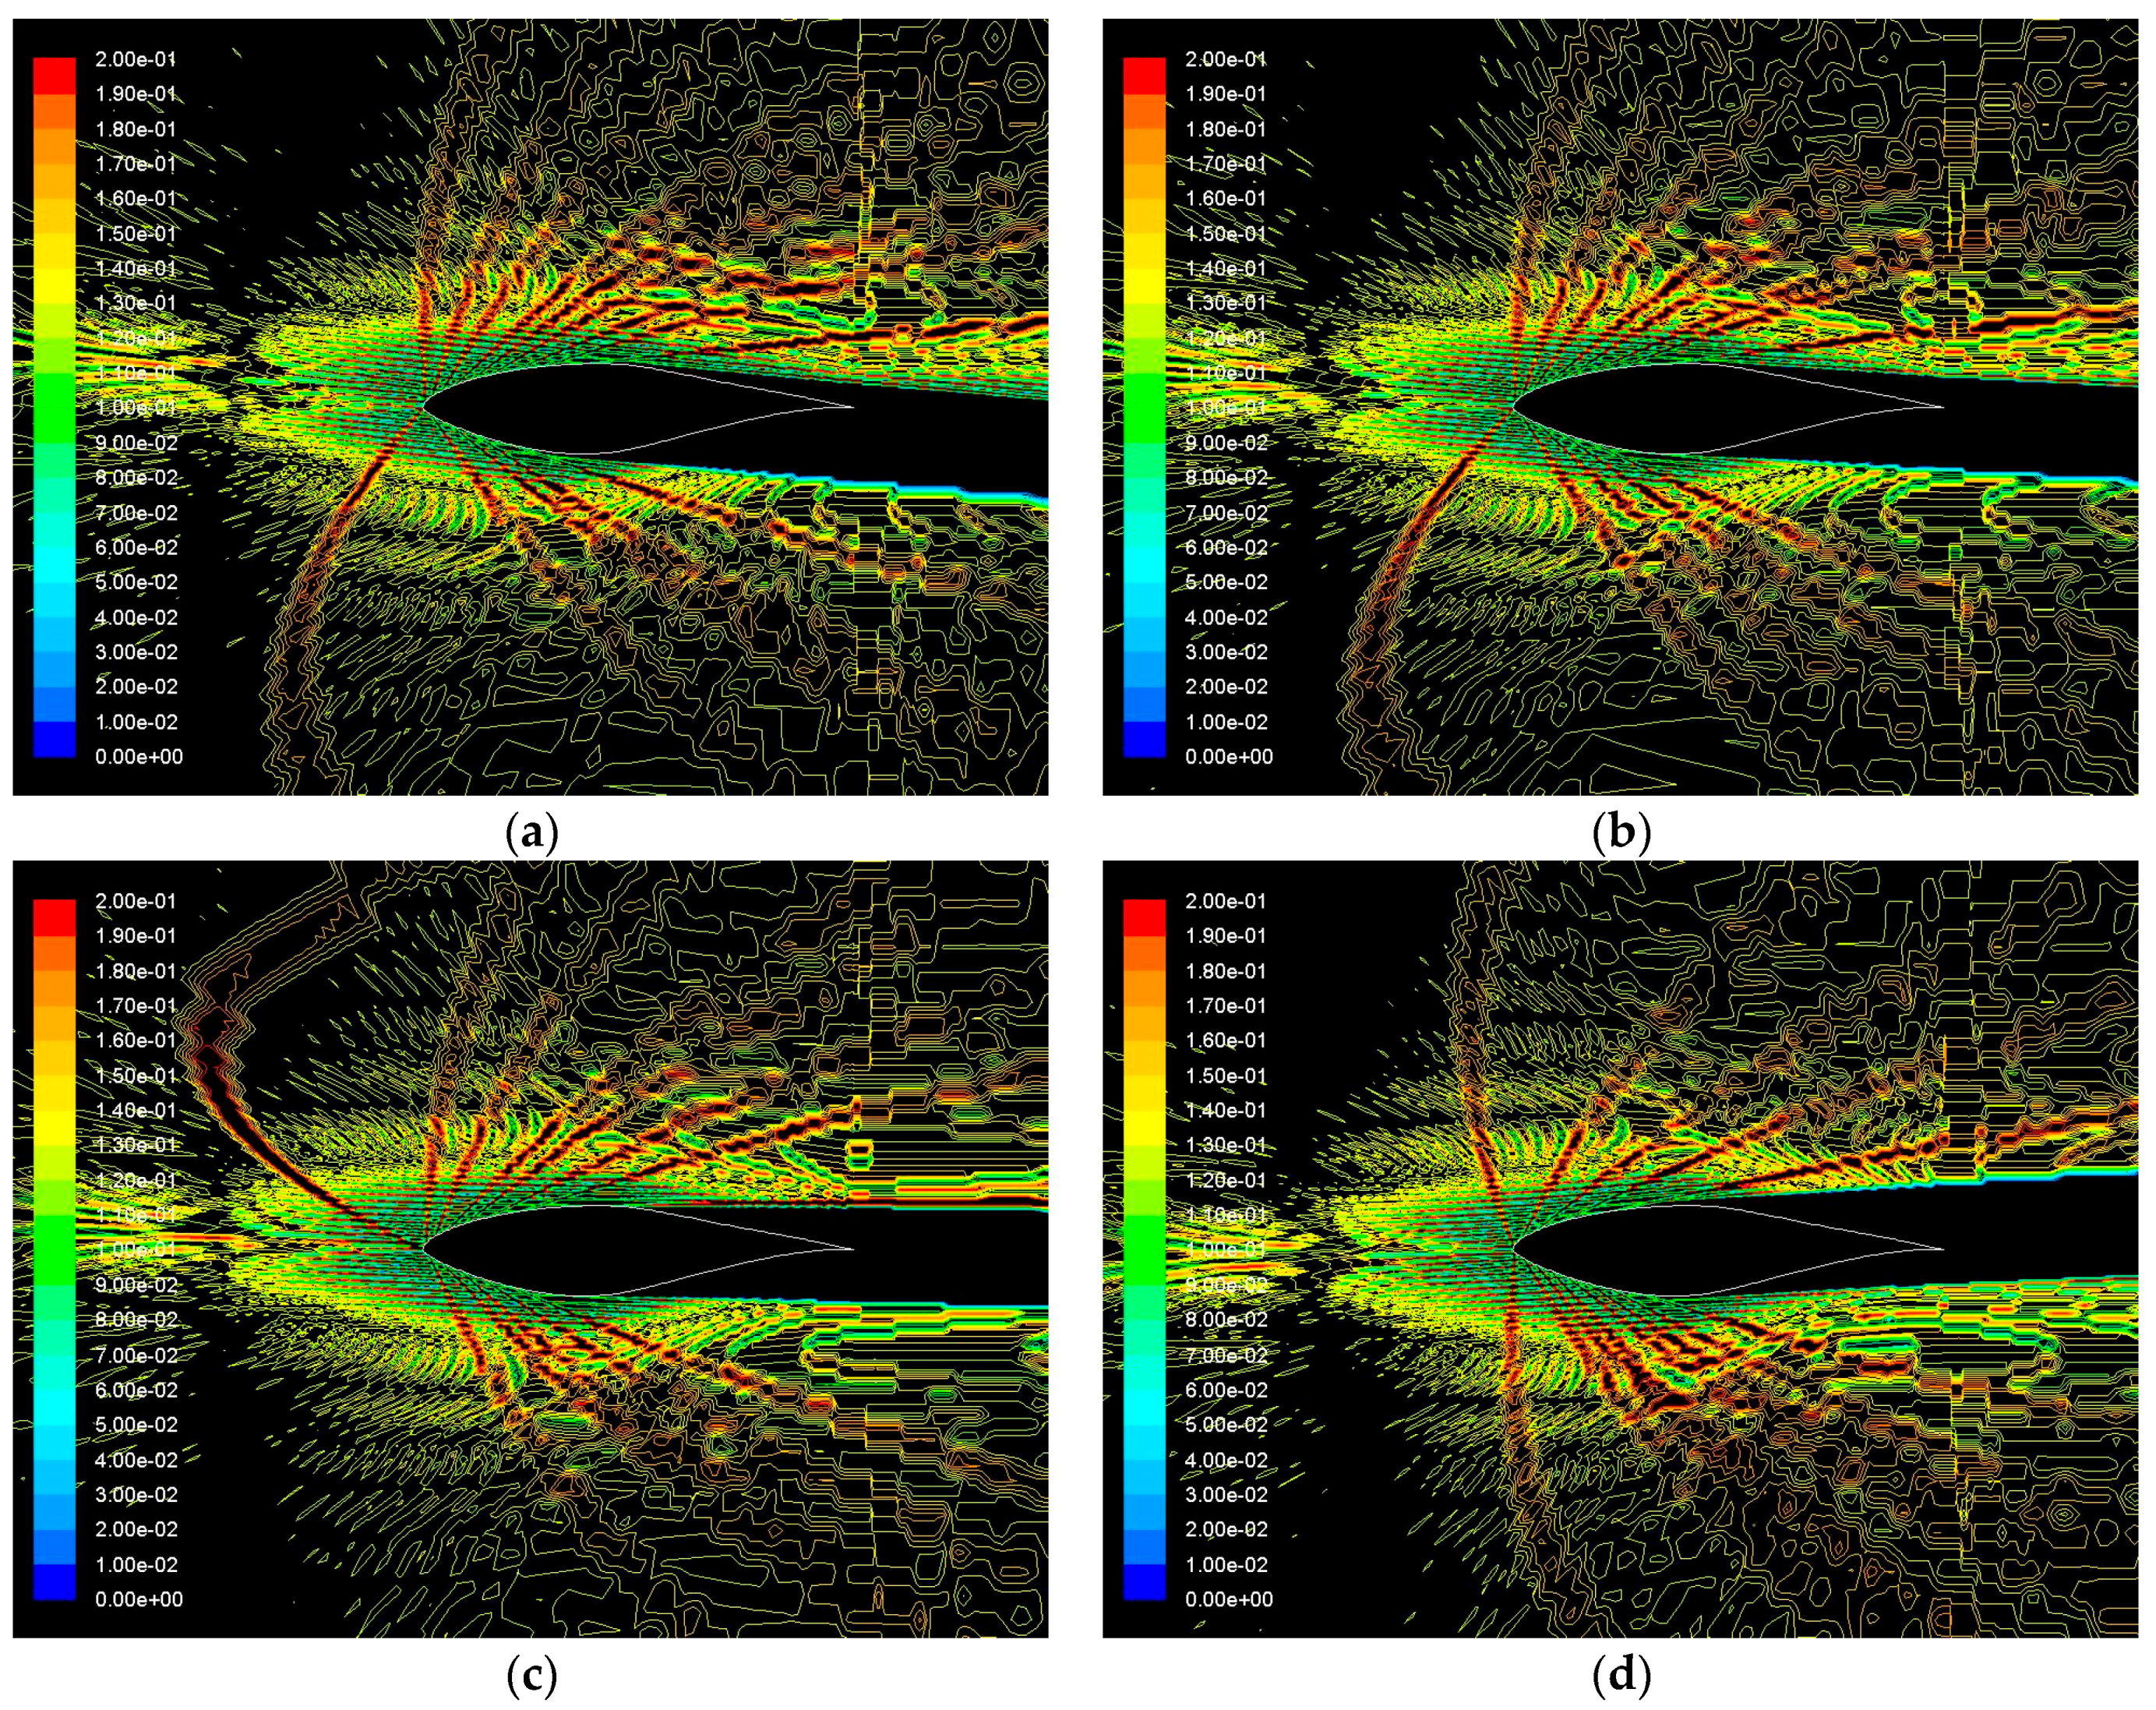
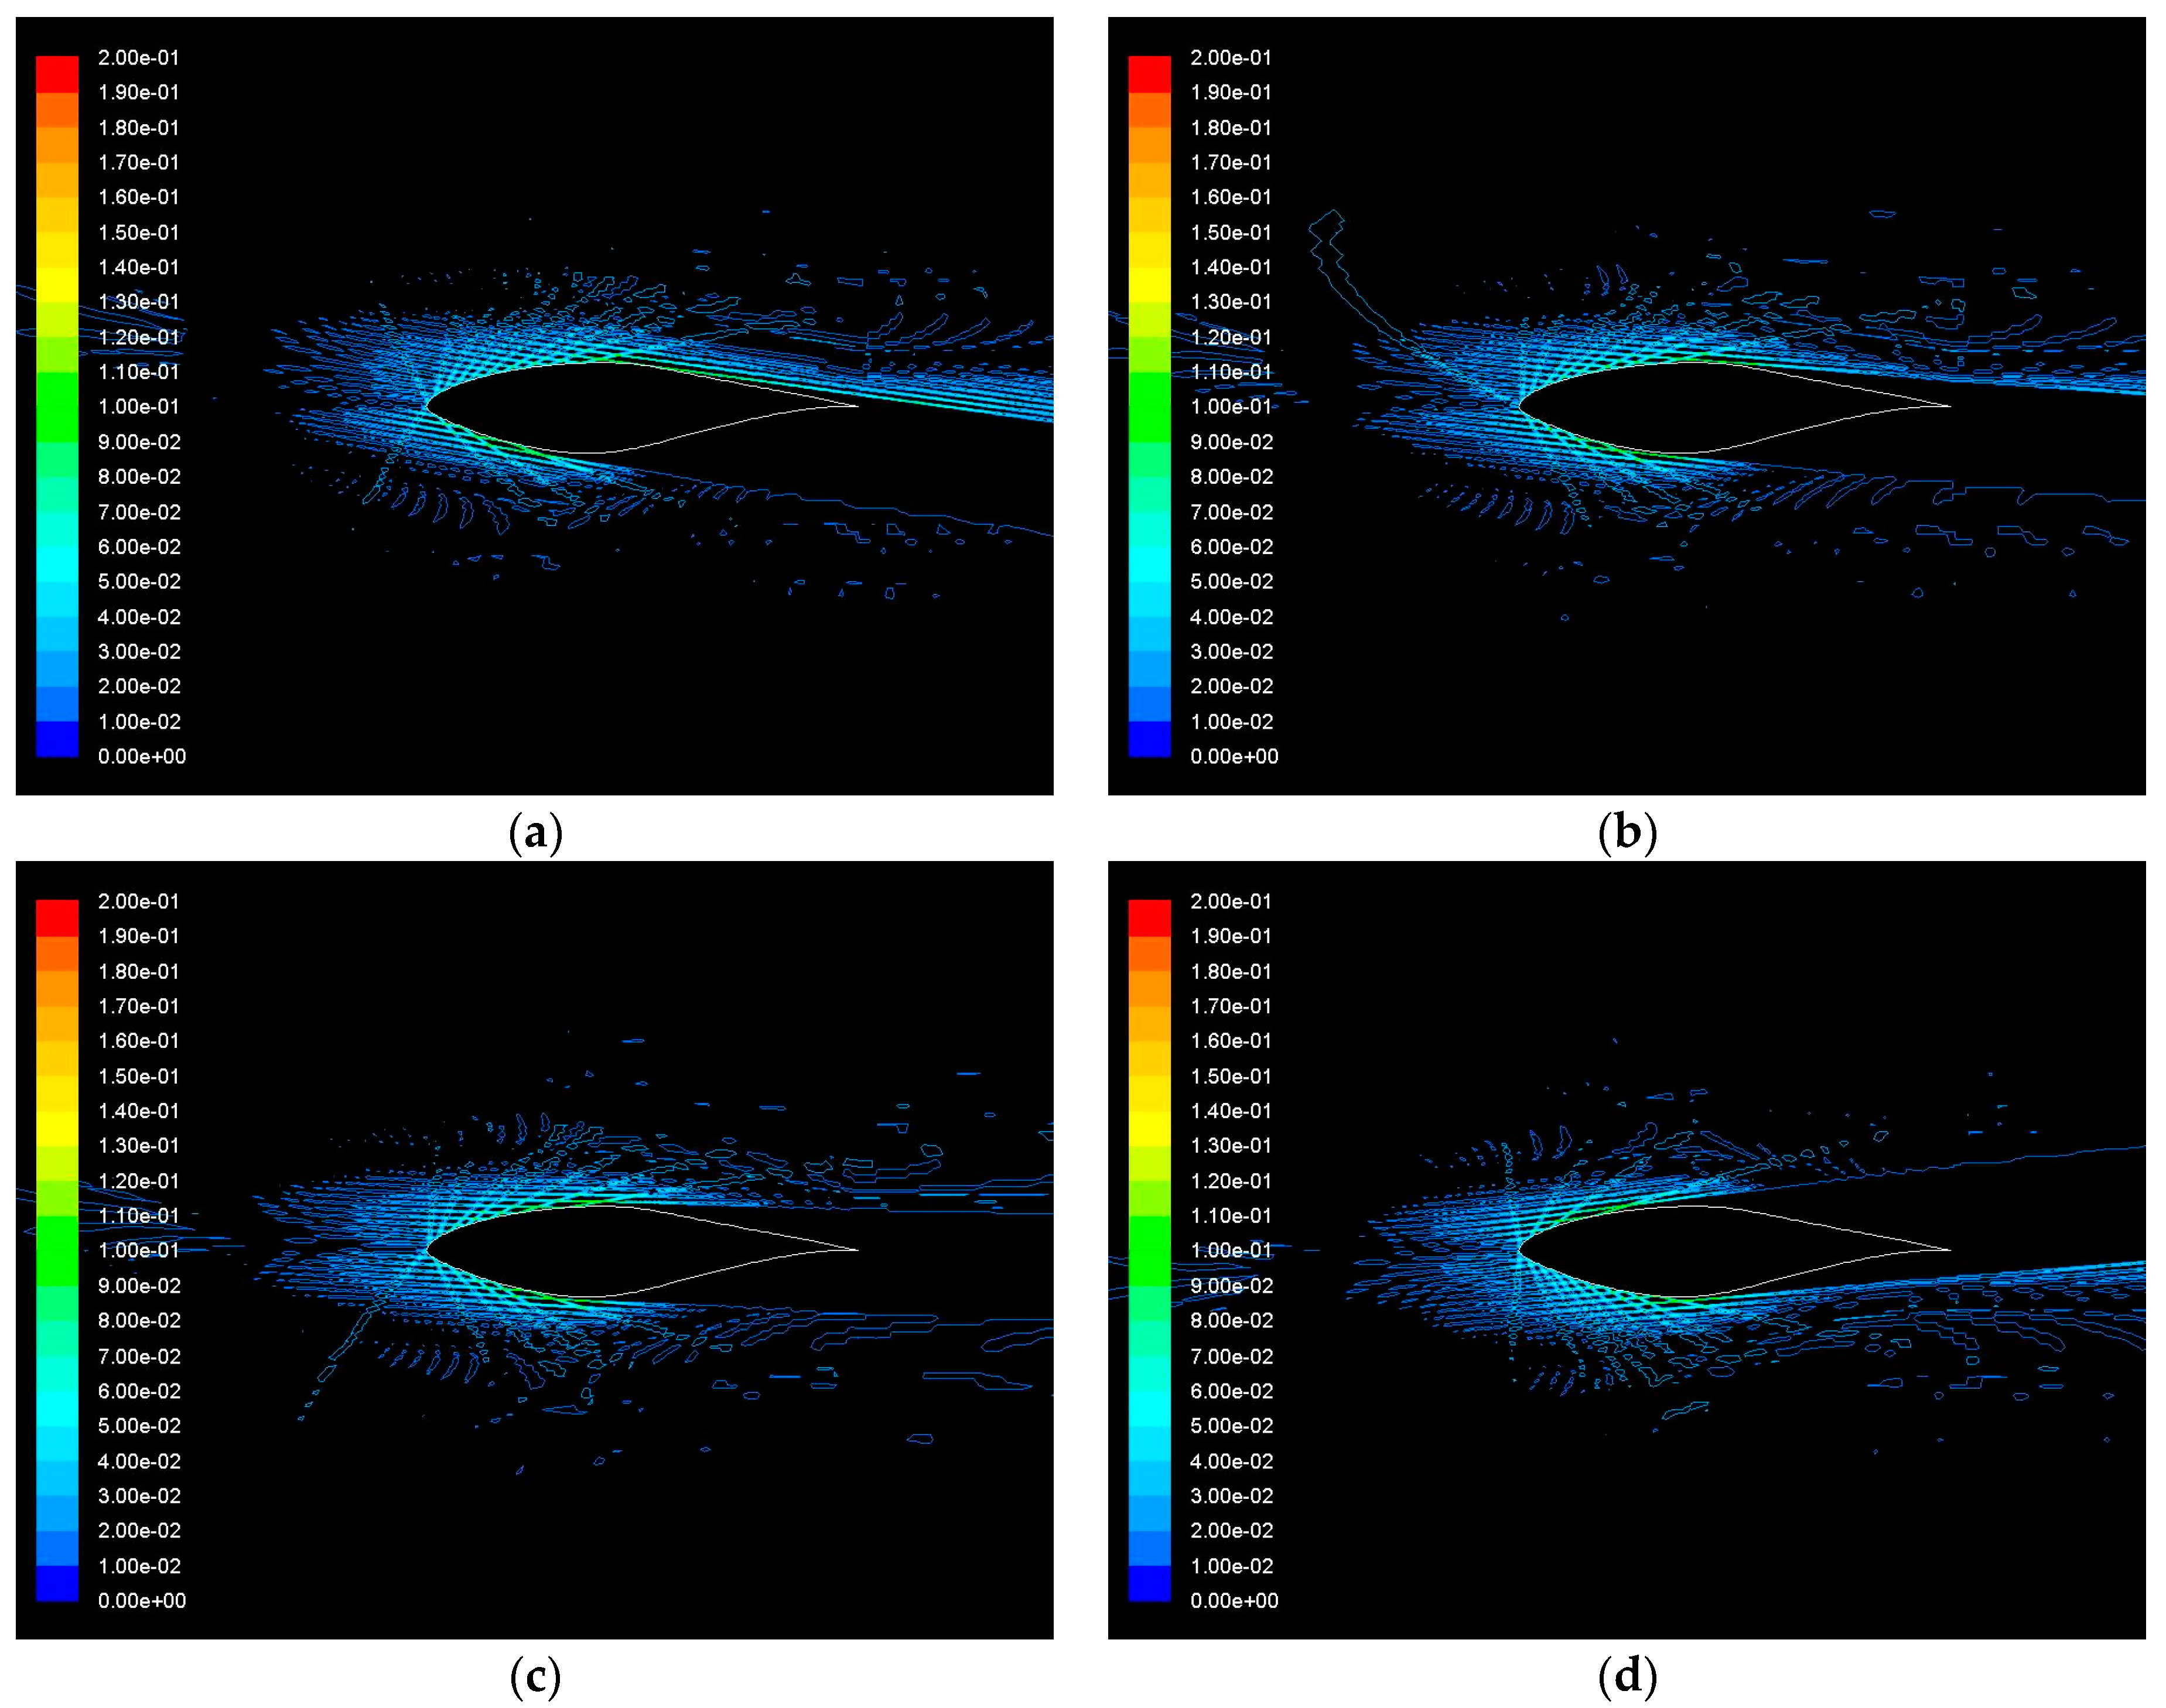
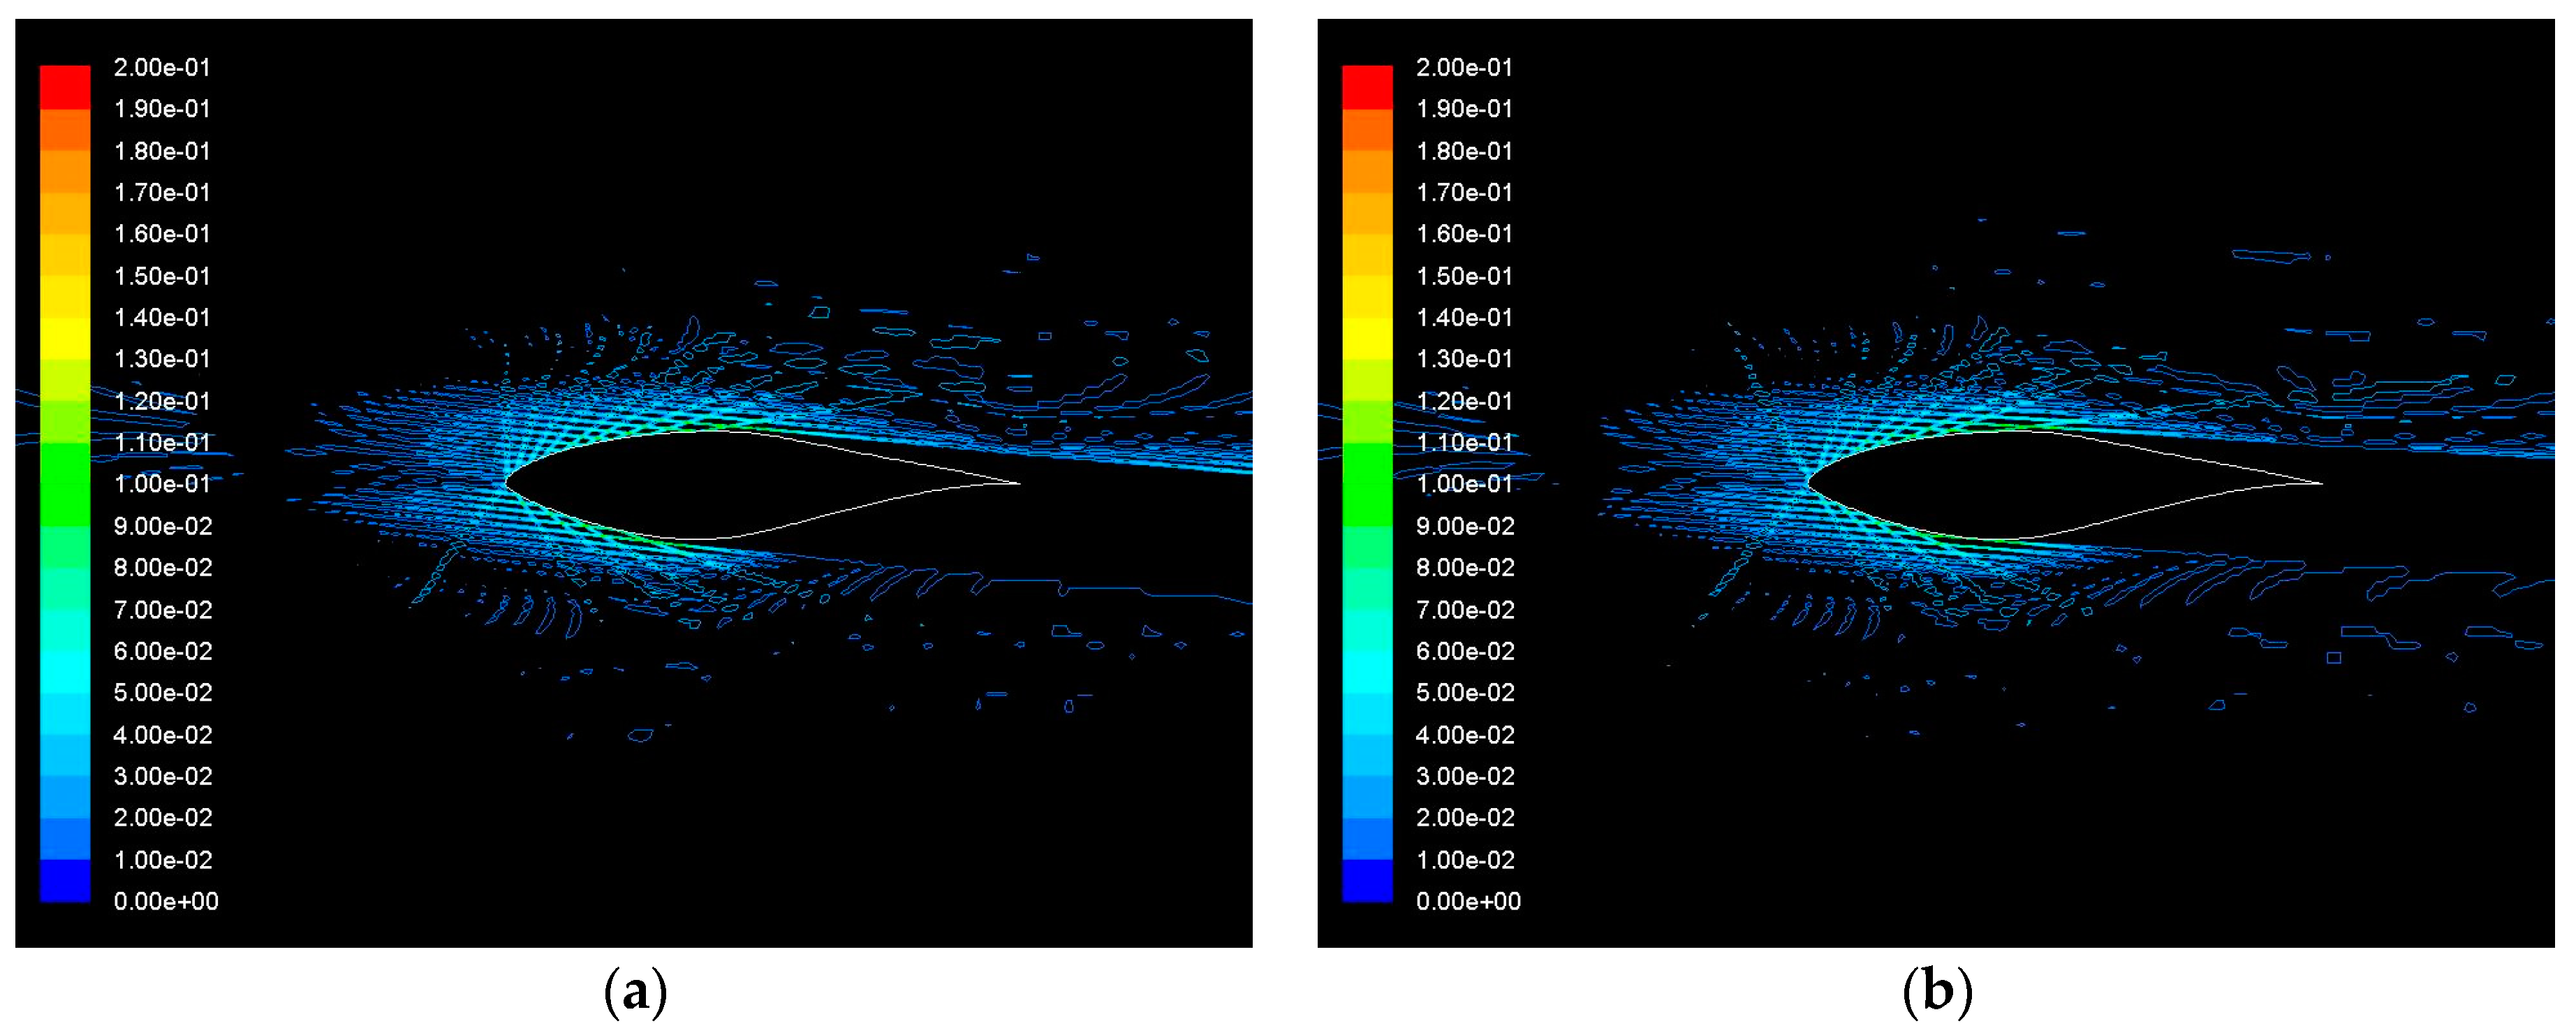
Subsequently,
Figure 13 and
Figure 14 provide the contours of sand particle concentration over the S809 airfoil at various angles of attack and at Re = 1 × 10
6 for 1% and 10% concentration of sand particles in the air, respectively, with the realizable k–ε turbulence model. As can be seen, the sand particles tend to concentrate mainly in the region of the trailing edge to the middle of the airfoil, and as the concentration of them in the air increases, the airfoil is surrounded by more particles.
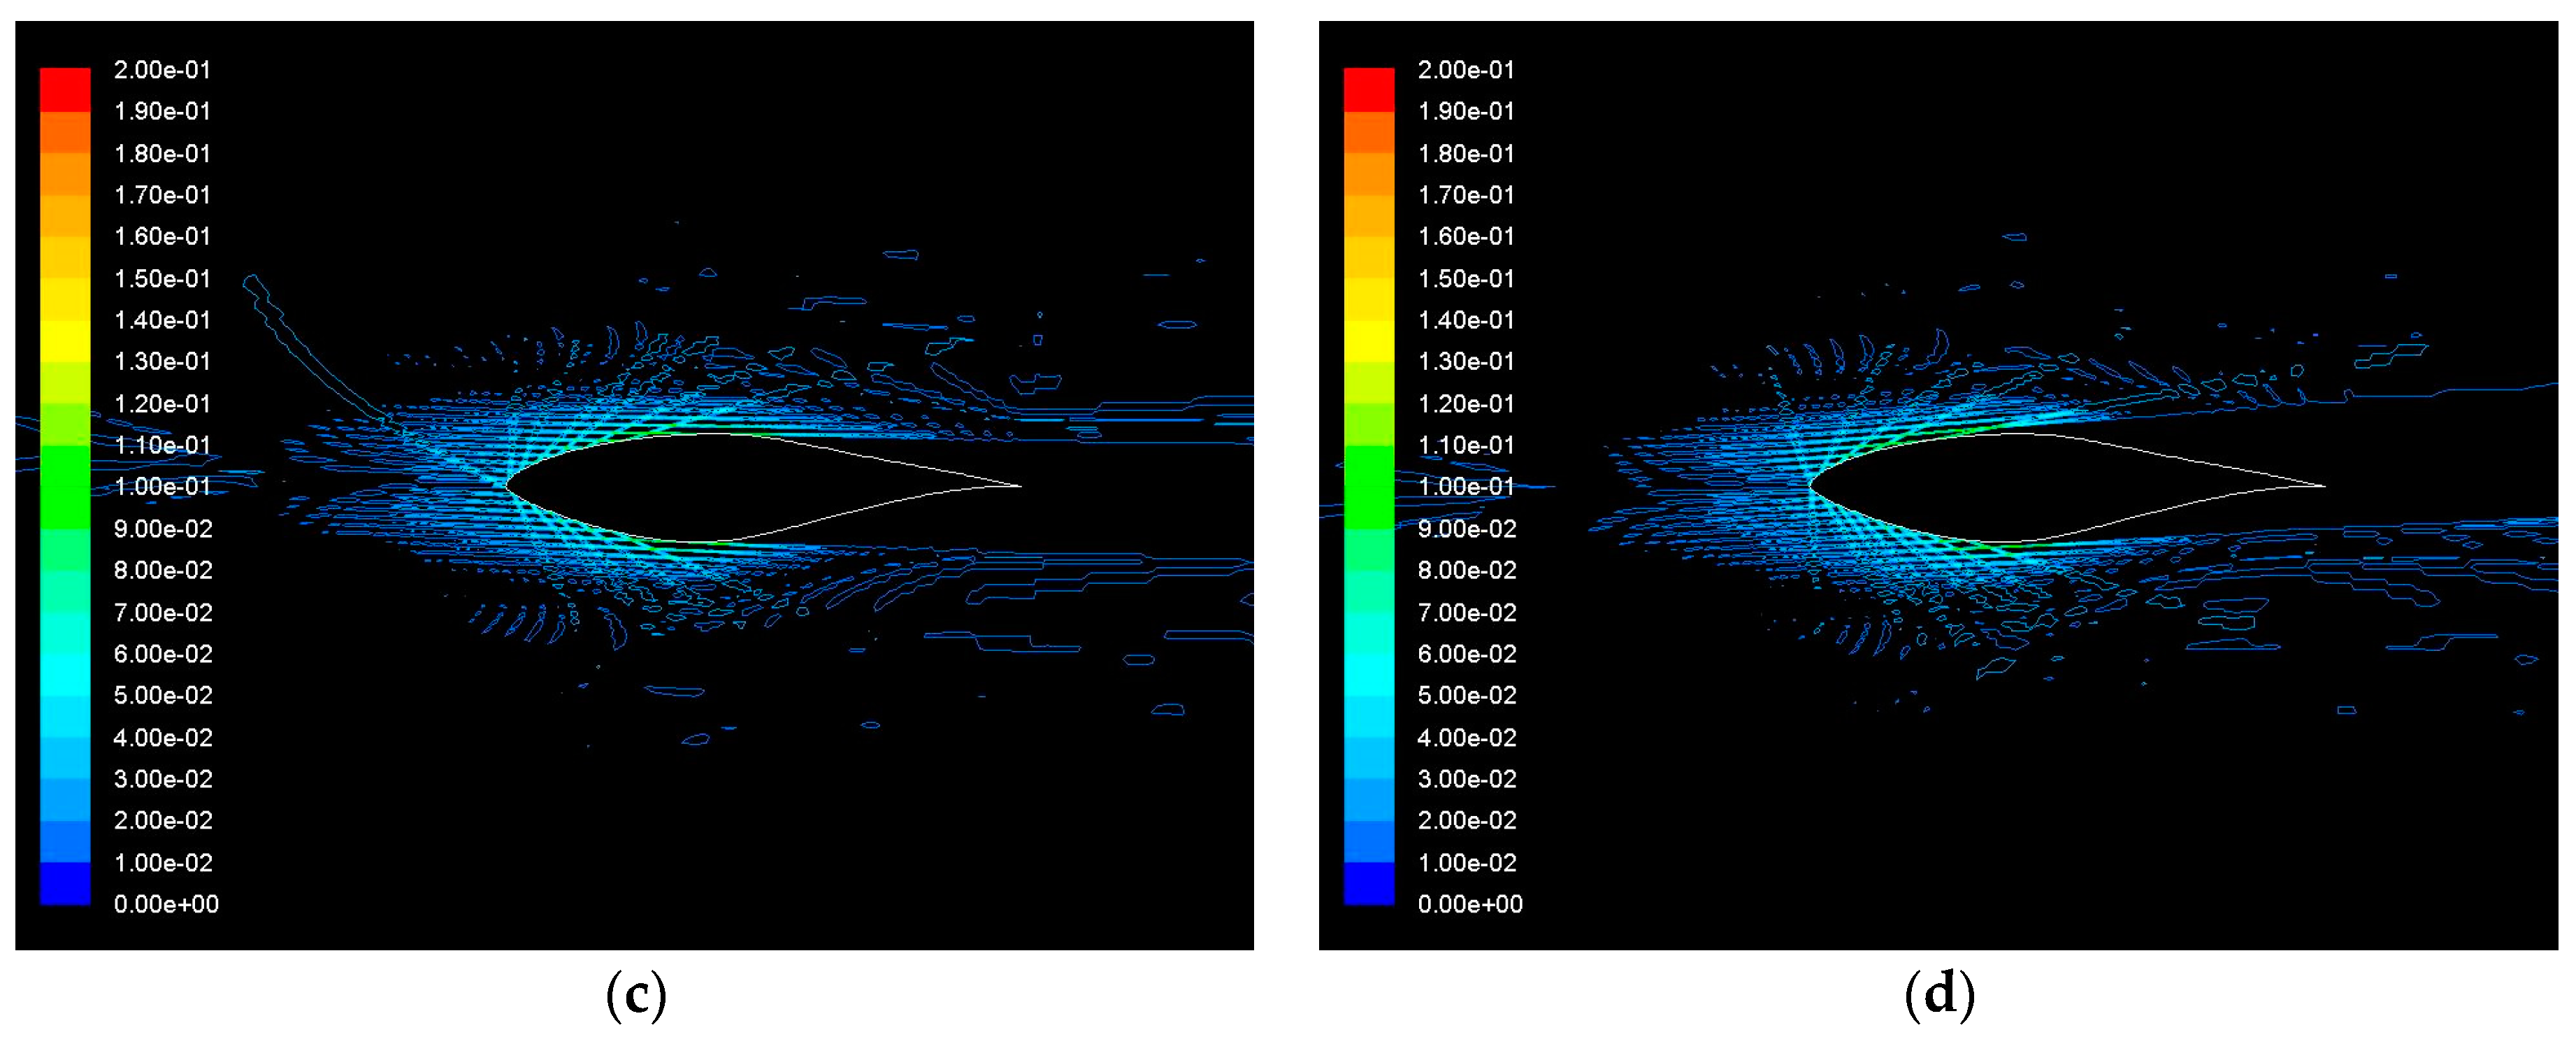
Similarly, regarding the contours of sand particles concentration over the S809 airfoil at a Reynolds number of Re = 2 × 10
6 with the realizable k–ε turbulence model for 1% concentration of sand particles in the air as shown in
Figure 15, and 10% concentration of sand particles in the air as illustrated in
Figure 16, the sand particles seem to have the same behavior as the concentration of them in the air increases, as for the case of Re = 1 × 10
6. Furthermore, it can be observed that, as the Reynolds number increases, the sand particles drift towards the trailing edge of the airfoil.
5. Conclusions
The present study set out to determine the effect of air-sand particle two-phase flow, consisting of two different concentrations of sand particles in the air, on the aerodynamic performance of an S809 airfoil at Reynolds numbers of Re = 1 × 10⁶ and Re = 2 × 10⁶.
Summing up the results, it can be concluded that the aerodynamic performance of the S809 airfoil degrades in the two-phase flow; in other words, the lift coefficient decreases and, simultaneously, the drag coefficient increases. In general, the degradation increases as the angle of attack and the concentration of sand particles increase for both Reynolds numbers. The mixture of air and sand particles change the skin friction to greater values and, thus, the total drag is larger.
From the outcome of the current investigation it is also possible to conclude that the realizable k–ε model seems to be the most appropriate turbulence model to predict the degradation of the aerodynamic performance of a S809 airfoil due to the concentration of sand particles in the air flow at a wide range of angles of attack.
Moreover, based on the illustration of the flow field around the S809 airfoil, our understanding of the effects of sand concentration in air can be enhanced. It has been shown that the static pressure in the case of a 1% concentration of sand is almost the same with the pressure in the air flow, while in the case of a 10% concentration, a very small difference can be observed. It is apparent that the lower surface of the airfoil seems to have lower values, and the upper surface higher values, of static pressure as the sand concentration increases for both Reynolds numbers.
Finally, the contours of sand particle concentration over the S809 airfoil suggests that, in general, the sand particles tend to concentrate mainly in the region of the trailing edge to the middle of the airfoil, and as the concentration of them in the air increases, the airfoil is surrounded by more particles. Additionally, the particles drift towards the trailing edge of the airfoil by increasing the Reynolds number.

