

Predicting the Occurrence of Metabolic Syndrome Using Machine Learning Models

1
Department of Informatics and Computer Engineering, School of Engineering, University of West Attica, Egaleo, 12243 Athens, Greece
2
Department of Electrical and Computer Engineering, School of Engineering, University of Patras, 26504 Patras, Greece
*
Author to whom correspondence should be addressed.
Computation 2023, 11(9), 170; https://doi.org/10.3390/computation11090170
Submission received: 1 March 2023
/
Revised: 11 August 2023
/
Accepted: 1 September 2023
/
Published: 3 September 2023
(This article belongs to the Special Issue Signal Processing and Machine Learning in Data Science)
Abstract
:The term metabolic syndrome describes the clinical coexistence of pathological disorders that can lead to the development of cardiovascular disease and diabetes in the long term, which is why it is now considered an initial stage of the above clinical entities. Metabolic syndrome (MetSyn) is closely associated with increased body weight, obesity, and a sedentary lifestyle. The necessity of prevention and early diagnosis is imperative. In this research article, we experiment with various supervised machine learning (ML) models to predict the risk of developing MetSyn. In addition, the predictive ability and accuracy of the models using the synthetic minority oversampling technique (SMOTE) are illustrated. The evaluation of the ML models highlights the superiority of the stacking ensemble algorithm compared to other algorithms, achieving an accuracy of 89.35%; precision, recall, and F1 score values of 0.898; and an area under the curve (AUC) value of 0.965 using the SMOTE with 10-fold cross-validation.
1. Introduction
Metabolic syndrome is a nosological entity that is strongly correlated with many cardiovascular risk factors, which are observed and coexist within the same individual, such as obesity, type 2 diabetes mellitus, arterial hypertension, and dyslipidemia. Metabolic syndrome is also called Syndrome X or Insulin Resistance Syndrome [1,2]. Someone has metabolic syndrome if three or more of the following criteria for metabolic syndrome are abnormal [3,4]:
- Waist circumference greater than 102 cm and 88 cm for men and women, respectively.
- Triglyceride levels greater than or equal to 150 mg/dL.
- HDL lower than 40 mg/dL and 50 mg/dL for men and women, respectively.
- Blood pressure, systolic greater than or equal to 130 or diastolic greater than or equal to 85 mmHg.
- Fasting plasma glucose levels greater than or equal to 110 mg/dL.
The primary cause of metabolic syndrome is the insulin resistance of the tissues, especially the muscles, liver, and adipose tissue, i.e., the adverse effect of endogenous insulin on these organs. Insulin resistance is associated with diabetes, whose triggering factor is obesity. The causes of metabolic syndrome are closely related to certain factors contributing to diabetes mellitus and atherosclerosis. These factors include the production of anti-inflammatory proteins, i.e., proteins produced and secreted by adipose tissue, which have local and systemic effects [5,6]. Other contributing factors, and therefore causes of metabolic syndrome, are heredity, age, smoking, reduced physical activity, and dietary intake with increased calories (in particular, saturated animal fats can cause serious problems) [7,8,9].
Weight loss constitutes an etiological (namely, it acts causally) and thus an essential treatment of metabolic syndrome. It improves individual disorders related to blood sugar, blood pressure, and lipids, as well as insulin resistance. Moreover, increasing physical exercise, either in the form of going to the gym or an increase in daily activities, may have the same causal effect [10]. Also, medications that aid in weight loss, such as drugs that control insulin resistance (acting as antidiabetics), hypertension, and dyslipidemia, can equally help to control metabolic syndrome [11,12].
Prevention is dependent on an appropriate healthy diet, such as the Mediterranean diet, which helps to reduce body weight, thereby preventing the occurrence of hyperlipidemia, hypertension, and diabetes. This diet is characterized by reduced fats, mainly of vegetable origin, with a special emphasis on olive oil, which has been proven to have a beneficial effect on insulin resistance (when consumed in small and moderate amounts). Also, this diet consists of minimal micromolecular carbohydrates (e.g., sugar) that can be rapidly absorbed, create hyperinsulinemia, and worsen insulin resistance. Moreover, it contains a lot of fibre, which helps in weight loss, regulates sugar, and reduces hyperlipidemia [13,14]. Additionally, a small amount of salt (less than 6 g per day), low amounts of cholesterol (up to 300 mg per day), and low or moderate amounts of alcohol (1–7 glasses per week, preferably red wine) can help control MetSyn. Finally, an increase in exercise and physical activity plays an important role in prevention since it prevents weight gain and reduces insulin resistance [15,16,17].
It is a common belief that, nowadays, medical experts have at their disposal numerous medications that can correct the nutritional deficiencies of a patient with metabolic syndrome by adapting to their profile and radically changing their quality of life. Furthermore, given that researchers have access to diverse medical and anthropometric data of various subjects, the efficient exploitation of these data using modern information processing methods, especially from the fields of Artificial Intelligence (AI) and machine learning (ML), can help build highly accurate predictive and diagnostic models, not only for metabolic syndrome but also for many other diseases. Indeed, ML techniques have played and will continue to play a key role in the prevention of disease complications through early prediction. Some characteristic examples are diabetes (as classification [18] or time-series tasks for continuous glucose prediction [19]), stroke [20], chronic obstructive pulmonary disease (COPD) [21], COVID-19 [22], chronic kidney disease (CKD) [23], liver disease [24], cardiovascular diseases (CVDs) [25], hypertension [26], lung cancer [27], etc.
The prediction of metabolic syndrome is the focus of the analysis and discussion in this research article. From an ML perspective, the contributions of this submission are fourfold:
- Data preprocessing is performed, which involves data cleaning and class balancing using the SMOTE. Thus, we are given the chance to experiment with effective classification models for the accurate identification of the occurrence of metabolic syndrome.
- In terms of feature ranking, three methods, namely information gain, gain ratio, and random forest, are chosen to measure their significance in the MetSyn class.
- In this submission, we experiment with a multitude of supervised ML models to determine the most accurate for classifying an unknown instance into the correct class. Well-known ML metrics with 10-fold cross-validation are used to evaluate the models’ performance. An “ablation experiment” is conducted to measure the role of class balancing in the ML models’ predictive performance. From this perspective, the experiments are executed with and without applying the SMOTE for the models’ training. The performance outcomes illustrate the prevalence of the ensemble model with the stacking technique due to the application of the SMOTE. Moreover, feature importance is measured with and without using the SMOTE.
- A discussion of related works on the prediction of metabolic syndrome using ML techniques and models is presented.
This paper is organized as follows. In Section 2, we analyze the methodology we adopted to process and comprehend the dataset we relied on. Next, in Section 3, we demonstrate the outcomes of the ML metrics used to evaluate the models’ performance. In Section 4, we provide a discussion of related works that use ML models and methods to predict metabolic syndrome. Finally, in Section 5, we summarize our research findings and discuss future directions.
2. Materials and Methods
This section briefly discusses the dataset we used in our experiments. In addition, the steps of the methodology followed are presented. Also, we describe the experiment’s environment, including the configuration of the ML models to maximize the performance metrics. Finally, the metrics used to evaluate the models are discussed.
2.1. Data Collection and Description
For the analysis, we selected a dataset [28] from the NHANES (National Health and Nutrition Examination Survey). The NHANES is one of a series of health-related programs conducted by the National Center for Health Statistics (NCHS) to provide information on the health and nutritional status of the non-institutionalized civilian resident population of the United States. This information has been used to estimate the prevalence of various diseases and conditions and provide information for use in planning health policies. The NHANES is unique in its collection of person-level demographic, health, and nutritional information from personal interviews and a standardized physical examination in a mobile examination center. The examination includes objective measures of health status, including height, weight, blood pressure, and the collection of blood and urine specimens for laboratory testing.
From the NHANES database, the data collector combined risk factor variables from multiple tables by submitting an SQL query: abnormal waist circumference of more than 35 inches for women and more than 40 inches for men, triglycerides above 150, HDL cholesterol below 50 in women or 40 in men, and a history of hypertension and mildly elevated fasting blood sugar (100–125). Numerous other variables were considered, such as uric acid, race, income, etc., since they may contribute to the modeling of metabolic syndrome.
From the above process, a set of 2401 samples was collected, represented by 13 attributes of which 10 are numerical and 3 nominal. Specifically, the numerical attributes include age [29], income [30], waist circumference (waistcirc), body mass index (BMI) [31], albuminuria, urine albumin–creatinine ratio (UrAlbCr), uric acid [32], blood glucose [33], high-density lipoprotein (HDL), and triglycerides [34]. The nominal attributes include sex [29], marital status [31], and race [32]. From now on, MetSyn denotes the target class, which is binary and indicates the occurrence or not of metabolic syndrome.
2.2. MetSyn Risk Prediction: Methodology
Metabolic syndrome risk prediction consists of several steps. In the first step, data preprocessing was applied to handle (i) incomplete data or lack of attribute values, (ii) different dimensions or distributions of the attributes, and (iii) class unbalancing. Then, we identified the features’ importance and selected several classifiers to design the risk prediction models. These steps are analyzed in the following subsections.
2.2.1. Data Preprocessing
Data preprocessing helps clean, format, and organize raw data. Hence, this step is necessary to enhance the quality of raw data, making it suitable for the extraction of meaningful insights. Among the data, from the total records (2401 in number), 208 had no marital status, 117 (4.9%) lacked income data, 5 (0.21%) had no waist circumference information, and finally, 117 (4.9%) had missing values for the BMI. Therefore, we decided to exclude those records with missing values.
After completing the previous step, the resulting number of participants was 2009, of whom 712 (35.4%) had been diagnosed with MetSyn. Also, the number of women was 1022 (50.9%), whereas the number of men was 987 (49.1%). The participants’ ages varied from 20 to 80 years. Concerning the participants’ races, six types were present in the dataset, White (40%), Black (23%), Asian (14.7%), Hispanic (9.9%), Mexican-American (9.9%), and Other (2.5%). Further statistical details of the numerical attributes are noted in Table 1.
In the following step, data normalization was applied to the attributes by rescaling the numerical attributes to a range between 0 and 1 to make the data dimensionless and/or have similar distributions. Moreover, to increase the efficiency of the models to be trained, class balancing was applied, creating synthetic samples in the minority class, i.e., MetSyn, following the steps of the SMOTE [35] (with ), as shown in Algorithm 1.
| Algorithm 1: SMOTE |
Steps 2–4 are repeated until the desired proportion S is satisfied. |
2.2.2. Feature Importance Ranking and Analysis
We employed three methods to rank the contribution of a feature in the MetSyn class. The results are illustrated in Figure 1, Figure 2 and Figure 3. The importance of the feature was evaluated under two cases: unbalanced (No SMOTE) and balanced data (SMOTE).
Initially, the value of an attribute Y was captured by measuring its information gain (InfoGain) according to the following equation:
Focusing on the right-hand side of Equation (1), the left term measures the entropy of the class variable C, which is defined as , where is the probability, such that (0: Non_MetSyn and 1: MetSyn). The term on the right-hand side, , is the conditional entropy of the class variable C given an attribute Y, with representing the conditional probability.
Then, the gain ratio (GR) method was employed, which was calculated as
The entropy of feature Y in Equation (2) was calculated by (with denoting the probability of feature ). The numerator of the is the InfoGain, which we previously analyzed. In addition to the previous methods, the random forest classifier was considered to measure the importance of features based on Gini impurity. This index measures a candidate feature’s ability to optimally split the instances into two classes.
The first two methods assigned the same order of importance to all variables, except for marital, race, age, uric acid, and albuminuria. All methods assigned blood glucose the highest ranking, whereas sex was assigned the lowest ranking with a rank close to zero. Moreover, the BMI and triglycerides were assigned the same order in the hierarchy, although the respective scores derived by each method were different.
In Figure 4 and Figure 5, we illustrate the Pearson correlation matrices [36] of the features (including the target class) without and with the use of the SMOTE. In both figures, it is shown that the linear relationship (positive or negative) among the features was maintained either without or with the use of the SMOTE. The strongest relationship was observed between the BMI and waist circumference, both without and with the use of the SMOTE, with values of 0.91 and 0.89, respectively. Most of the features have low associations (values in the range of 0.01–0.30). Waist circumference, BMI, triglycerides, and blood glucose indicated a medium-level positive linear relationship (values in the range of 0.3–0.5) with the metabolic syndrome class. Finally, it should be noted that all available features (demographic, biochemical, and social) were considered for training more generalized models.
2.3. Evaluation Models and Metrics
Among the wide list of ML models, we selected a representative number of classifiers for our experiments to determine which one could outperform the others by comparing their predictive abilities. More specifically, we selected the following classifiers: (i) two probabilistic models, namely naive Bayes (NB) [37] and logistic regression (LR) [38]; (ii) a decision tree-based model, i.e., J48 [39]; (iii) (linear) support vector machine (SVM) [40] which constitutes a well-known kernel-based classifier, (iv) extreme gradient boosting (XGBoost), bagging [41], random forest (RF) [42], rotation forest (RotF) [43], voting [44], and stacking [45] from the family of ensemble algorithms; (v) multilayer perceptron (MLP) [46], a fully connected feedforward artificial neural network; and (vi) k-nearest neighbors (kNN) [47], a distance-based classifier. Focusing on the ensemble models, the stacking method utilized the RF and J48 models as base classifiers and the LR model as a metaclassifier. Voting exploited the same base models, whose outcomes were combined by applying the average probabilities approach (soft voting), assigning an instance to the class with the highest average probability. Finally, the bagging method utilized the RF model.
The models’ performance was assessed by employing the accuracy, precision, recall, F1 score, and AUC metrics [22]. The confusion matrix consists of true positives (tp), true negatives (tn), false positives (fp), and false negatives (fn). Based on these elements, the aforementioned metrics can be defined as follows:
- Accuracy sums up the classification performance by measuring the number of correctly predicted instances out of the total data.
- Precision indicates how many of the instances that were positive for MetSyn actually belong to this class.
- Recall measures the proportion of instances of MetSyn that were correctly considered positive, concerning all positive instances.
- The F1 score is a measure of a model’s accuracy on a given dataset. It is used to evaluate a model’s performance in binary classification problems. It combines the precision and recall values of the model, and it is defined as the harmonic mean of them.
- To evaluate a model’s ability to distinguish MetSyn instances from Non-MetSyn ones, the AUC was utilized. The AUC varied in the range of [0, 1]; the closer to one, the more efficient the ML model.
2.4. Experimental Setup
The experiments were executed in the Waikato Environment for Knowledge Analysis (Weka) [48] on a personal computing system with the following characteristics: 11th generation Intel(R) Core(TM) i7-1165G7 @ 3.2 GHz, RAM 32 GB, Windows 11 Pro, 64-bit OS, and x64 processor. The 10-fold cross-validation procedure was preferred (due to its suitability for a limited-size dataset) to measure the models’ efficiency considering all features by training and comparing their performance with and without class balancing. The process was repeated until all folds were covered, and the average performance was recorded. The optimal parameter settings of the ML models are presented in Table 2.
3. Results
The performance evaluation was conducted before and after the application of class balancing to investigate the contribution of the SMOTE to the improvement of the models’ efficiency. The role of class balancing is demonstrated by the precision and recall values (and thus the F1 score) in the middle columns in Table 3. Training the ML models with class-balanced data using the SMOTE reduced false negatives and, as a result, enhanced the identification of non-healthy instances without deteriorating the prediction of healthy instances and, ultimately, reached high average performance. Moreover, we observed that the precision of the models exhibited an increase, which means that the false positives were also reduced. Hence, the number of correct predictions of the minority class was increased using the SMOTE, improving both the precision and recall values of the MetSyn class.
From the investigated models shown in Table 3, the stacking ensemble outperformed the other models, achieving an accuracy of 89.35%; precision, recall, and F1 score values of 0.898; and an AUC value of 0.965. Also, bagging, which used RF as the base classifier, achieved an accuracy of 89.10%; precision, recall, and F1 score values of 0.891, 0.893, and 0.892, respectively; and an AUC value of 0.963. Bagging achieved the second-best performance after stacking, which was ranked first among the models. The RotF model achieved recall and AUC values of 0.867 and 0.944, respectively, whereas voting was characterized by higher recall and AUC values (0.887 and 0.957, respectively). Finally, Figure 6 illustrates the relationship between the true positive rate () and the false positive rate () when using SMOTE. Among the ensemble models, stacking, bagging, RF, and XGBoost exhibited approximately similar ROC curves, which were a bit higher than those of RotF and voting (this was verified for in the range ) but significantly higher than the other models.
4. Discussion
In this section, related works are presented that exploit different datasets, using as a reference point the prediction of the metabolic syndrome occurrence with the aid of ML models and techniques. The outline of these studies aimed to (i) show the interest of the research community in this health condition, (ii) highlight the diversity in available datasets, and (iii) identify the best-performing classifiers for metabolic syndrome risk prediction, although their performance is not explicitly compared to the research results of the present submission.
First, the authors of [49] used the National Cholesterol Education Program Third Adult Treatment Panel (ATP III) criteria to rank the health parameters (clinical and anthropometric measurements, lifestyle data, and blood tests) from a dataset in Mexico City. The random forest model prevailed in terms of sensitivity (0.93) and specificity (0.93) in classifying abdominal obesity in people with MetSyn. Similarly, the authors of [50] used the ATP III criteria with two ML models, decision tree and SVM, which were selected for the prediction of MetSyn occurrence. The sensitivity, specificity, and accuracy values achieved using SVM (decision tree) were 0.774 (0.758), 0.74 (0.72), and 0.757 (0.739), respectively.
Moreover, [51] analyzed data from 17,182 adults attending an annual checkup program (37,999 visit pairs) over 17 years. The light gradient boosting machine (LGBM) model exhibited better performance (sensitivity = 0.878, specificity = 0.702, AUC = 0.86) in the prediction of MetSyn. In [52], the authors evaluated the performance of different decision tree ML algorithms to predict the occurrence of MetSyn in self-paid health examination subjects who were examined with an ultrasound device called FibroScan. The AUC value achieved using fandom forest was 0.904.
Additionally, the authors of [53] aimed to develop a MetSyn prediction ML model using genetic and clinical factors of non-obese Koreans. The naive Bayes model prevailed over the other models in terms of the sensitivity (0.42), specificity (0.80), and AUC (0.69) values. In [54], an ML-based method for the early detection of MetSyn was presented, which uses only non-invasive features. The authors achieved AUC values of up to 0.90 with the ensemble classifier.
The discriminative abilities of the BMI, waist circumference, and waist-to-hip ratio in predicting two or more non-adipose components of MetSyn (high blood pressure, hypertriglyceridemia, low high-density lipoprotein-cholesterol, and high fasting plasma glucose) were examined in [55]. A receiver operating characteristic (ROC) curve analysis was used to evaluate the ability of each anthropometric index to discriminate MetSyn from non-MetSyn cases based on the AUC. The study in [56] aimed to identify and rank the most important nutritional and non-nutritional factors contributing to the development of MetSyn using a data-mining method. The results illustrated the high ability of the random forest model to correctly predict MetSyn, achieving a sensitivity of 0.97.
The eXtreme gradient boosting model was utilized in [57,58], achieving AUC values of 0.88 and 0.93, respectively, in the prediction of MetSyn. Also, in [59,60], the LR model was employed, achieving AUC values of 0.817 and 0.813, respectively. In [61], a new MetSyn risk score was established and validated to predict the risk of MetSyn within the next three years. The proposed ML model achieved an AUC of 0.68.
In this work, we considered a dataset that combines biochemical indices (albuminuria, UrAlbCr, uric acid, blood glucose, HDL, triglycerides) that capture the most relevant factors of metabolic syndrome, along with sociodemographic features (such as age, income, race, and marital status). Several classifiers, including those models that adopt the concept of ensemble learning, were trained and tested assuming 10-fold cross-validation with and without using the SMOTE. In the evaluation, the most critical numerical performance metrics, along with a graphical illustration of the AUC curves, were compared. Finally, it should be noted that among the ensemble learning methods that were assessed in this study, stacking was our preferred method, attaining an accuracy of 89.35%; precision, recall, and F1 score values of 0.898; and an AUC value of 0.965.
5. Conclusions and Future Work
Metabolic syndrome is not an independent disease but a combination of factors that increase the risk of its development. It is closely related to increased body weight, obesity, and a sedentary lifestyle. The necessity of prevention and early diagnosis is imperative, as the condition takes on alarming proportions over time.
In this research article, we experimented with various ML models, namely NB, LR, kNN, SVM, J48, MLP, RotF, RF, XGBoost, stacking, bagging, and voting, to predict the risk of developing metabolic syndrome, with and without using the SMOTE with 10-fold cross-validation. Finally, the models were evaluated and compared in terms of accuracy, precision, recall, F1 score, and AUC to identify the most efficient for predicting the risk of an individual being diagnosed with metabolic syndrome. The experimental results demonstrated that the stacking ensemble model exhibited superior performance compared to the other models, achieving an accuracy of 89.35%; precision, recall, and F1 score values of 0.898; and an AUC value of 0.965 using the SMOTE with 10-fold cross-validation. A limitation of the current study is that the set features did not include the blood pressure and waist-to-hip ratio, which would make it even more accurate than the BMI for predicting the risk of metabolic syndrome [55].
As a future extension of this paper, we aim to incorporate an explainable step into the current methodology that considers techniques for features’ effects interpretation in metabolic syndrome risk prediction, such as individual conditional expectation (ICE) and partial dependence plot (PDP) [62]. The former visualizes how the changes in features impact an instance’s class prediction. The latter is a global method that captures the effect of a feature, focusing on an overall average, not specific instances.
Also, we aim to examine data-driven dimensionality reduction and visualization tools, such as t-distributed stochastic neighborhood embedding (t-SNE) which non-linearly transforms the input features into low-dimensional ones [63]. The acquired features will be investigated in combination with the currently available ones to determine whether they improve the classifiers’ performance. Although the initial scope of the study was to tackle the data imbalance issue considering a class balancing technique and all available features, measuring the performance metrics in terms of different portions of the input variables remained quite challenging. Here, we selected the SMOTE to tackle the imbalanced class distribution among MetSyn and Non-MetSyn instances for the models’ training. Automating the procedure to render it applicable for different portions of the input features and re-investigating the impact of selected features (based on their importance) in the performance metrics will be taken into consideration in an extended version of the current work. Finally, the ML framework will be expanded by investigating deep learning methods and comparing the results on the same metrics.
Author Contributions
M.T. and E.D. conceived the idea, designed and performed the experiments, analyzed the results, drafted the initial manuscript, and revised the final manuscript. All authors have read and agreed to the published version of the manuscript.
Funding
This research received no external funding.
Conflicts of Interest
The authors declare no conflict of interest.
References
- Swarup, S.; Goyal, A.; Grigorova, Y.; Zeltser, R. Metabolic syndrome. In StatPearls [Internet]; StatPearls Publishing: St. Petersburg, FL, USA, 2022. [Google Scholar]
- Grundy, S.M. Metabolic Syndrome; Springer: Berlin/Heidelberg, Germany, 2020. [Google Scholar]
- Zafar, U.; Khaliq, S.; Ahmad, H.U.; Manzoor, S.; Lone, K.P. Metabolic syndrome: An update on diagnostic criteria, pathogenesis, and genetic links. Hormones 2018, 17, 299–313. [Google Scholar] [CrossRef] [PubMed]
- Gutiérrez-Solis, A.L.; Datta Banik, S.; Méndez-González, R.M. Prevalence of metabolic syndrome in Mexico: A systematic review and meta-analysis. Metab. Syndr. Relat. Disord. 2018, 16, 395–405. [Google Scholar] [CrossRef] [PubMed]
- Lee, M.K.; Han, K.; Kim, M.K.; Koh, E.S.; Kim, E.S.; Nam, G.E.; Hong, O.K.; Kim, B.; Kwon, H.S. Combinations of metabolic syndrome components and the risk of type 2 diabetes mellitus: A nationwide cohort study. Diabetes Res. Clin. Pract. 2020, 165, 108237. [Google Scholar] [CrossRef]
- Aboonabi, A.; Meyer, R.R.; Singh, I. The association between metabolic syndrome components and the development of atherosclerosis. J. Hum. Hypertens. 2019, 33, 844–855. [Google Scholar] [CrossRef] [PubMed]
- Salzano, A.; D’Assante, R.; Heaney, L.M.; Monaco, F.; Rengo, G.; Valente, P.; Pasquali, D.; Bossone, E.; Gianfrilli, D.; Lenzi, A.; et al. Klinefelter syndrome, insulin resistance, metabolic syndrome, and diabetes: Review of literature and clinical perspectives. Endocrine 2018, 61, 194–203. [Google Scholar] [CrossRef]
- Paley, C.A.; Johnson, M.I. Abdominal obesity and metabolic syndrome: Exercise as medicine? BMC Sports Sci. Med. Rehabil. 2018, 10, 7. [Google Scholar] [CrossRef]
- Arhire, L.I.; Mihalache, L.; Covasa, M. Irisin: A hope in understanding and managing obesity and metabolic syndrome. Front. Endocrinol. 2019, 10, 524. [Google Scholar] [CrossRef]
- Myers, J.; Kokkinos, P.; Nyelin, E. Physical activity, cardiorespiratory fitness, and the metabolic syndrome. Nutrients 2019, 11, 1652. [Google Scholar] [CrossRef]
- Pilitsi, E.; Farr, O.M.; Polyzos, S.A.; Perakakis, N.; Nolen-Doerr, E.; Papathanasiou, A.E.; Mantzoros, C.S. Pharmacotherapy of obesity: Available medications and drugs under investigation. Metabolism 2019, 92, 170–192. [Google Scholar] [CrossRef]
- Nilsson, P.M.; Tuomilehto, J.; Rydén, L. The metabolic syndrome–What is it and how should it be managed? Eur. J. Prev. Cardiol. 2019, 26, 33–46. [Google Scholar] [CrossRef]
- Finicelli, M.; Squillaro, T.; Di Cristo, F.; Di Salle, A.; Melone, M.A.B.; Galderisi, U.; Peluso, G. Metabolic syndrome, Mediterranean diet, and polyphenols: Evidence and perspectives. J. Cell. Physiol. 2019, 234, 5807–5826. [Google Scholar] [CrossRef]
- Castro-Barquero, S.; Ruiz-León, A.M.; Sierra-Pérez, M.; Estruch, R.; Casas, R. Dietary strategies for metabolic syndrome: A comprehensive review. Nutrients 2020, 12, 2983. [Google Scholar] [CrossRef] [PubMed]
- Takase, H.; Hayashi, K.; Kin, F.; Nakano, S.; Machii, M.; Takayama, S.; Sugiura, T.; Dohi, Y. Dietary salt intake predicts future development of metabolic syndrome in the general population. Hypertens. Res. 2023, 46, 236–243. [Google Scholar] [CrossRef] [PubMed]
- Suliga, E.; Kozieł, D.; Ciesla, E.; Rebak, D.; Głuszek-Osuch, M.; Głuszek, S. Consumption of alcoholic beverages and the prevalence of metabolic syndrome and its components. Nutrients 2019, 11, 2764. [Google Scholar] [CrossRef] [PubMed]
- Morales-Palomo, F.; Ramirez-Jimenez, M.; Ortega, J.F.; Mora-Rodriguez, R. Effectiveness of Aerobic Exercise Programs for Health Promotion in Metabolic Syndrome. Med. Sci. Sports Exerc. 2019, 51, 1876–1883. [Google Scholar] [CrossRef]
- Dritsas, E.; Trigka, M. Data-driven machine-learning methods for diabetes risk prediction. Sensors 2022, 22, 5304. [Google Scholar] [CrossRef] [PubMed]
- Alexiou, S.; Dritsas, E.; Kocsis, O.; Moustakas, K.; Fakotakis, N. An approach for Personalized Continuous Glucose Prediction with Regression Trees. In Proceedings of the IEEE 2021 6th South-East Europe Design Automation, Computer Engineering, Computer Networks and Social Media Conference (SEEDA-CECNSM), Preveza, Greece, 24–26 September 2021; pp. 1–6. [Google Scholar]
- Dritsas, E.; Trigka, M. Stroke risk prediction with machine learning techniques. Sensors 2022, 22, 4670. [Google Scholar] [CrossRef]
- Dritsas, E.; Alexiou, S.; Moustakas, K. COPD severity prediction in elderly with ML techniques. In Proceedings of the 15th International Conference on PErvasive Technologies Related to Assistive Environments, Corfu, Greece, 29 June–1 July 2022; pp. 185–189. [Google Scholar]
- Dritsas, E.; Trigka, M. Supervised Machine Learning Models to Identify Early-Stage Symptoms of SARS-CoV-2. Sensors 2023, 23, 40. [Google Scholar] [CrossRef]
- Dritsas, E.; Trigka, M. Machine learning techniques for chronic kidney disease risk prediction. Big Data Cogn. Comput. 2022, 6, 98. [Google Scholar] [CrossRef]
- Dritsas, E.; Trigka, M. Supervised machine learning models for liver disease risk prediction. Computers 2023, 12, 19. [Google Scholar] [CrossRef]
- Dritsas, E.; Trigka, M. Efficient data-driven machine learning models for cardiovascular diseases risk prediction. Sensors 2023, 23, 1161. [Google Scholar] [CrossRef]
- Dritsas, E.; Alexiou, S.; Moustakas, K. Efficient data-driven machine learning models for hypertension risk prediction. In Proceedings of the IEEE 2022 International Conference on INnovations in Intelligent SysTems and Applications (INISTA), Biarritz, France, 8–12 August 2022; pp. 1–6. [Google Scholar]
- Dritsas, E.; Trigka, M. Lung Cancer Risk Prediction with Machine Learning Models. Big Data Cogn. Comput. 2022, 6, 139. [Google Scholar] [CrossRef]
- Metabolic Syndrome Dataset. Available online: https://data.world/informatics-edu/metabolic-syndrome-prediction (accessed on 26 February 2023).
- Zhang, J.; Zhu, W.; Qiu, L.; Huang, L.; Fang, L. Sex- and age-specific optimal anthropometric indices as screening tools for metabolic syndrome in Chinese adults. Int. J. Endocrinol. 2018, 2018, 1067603. [Google Scholar] [CrossRef]
- Jeong, S.; Cho, S.-i.; Kong, S.Y. Effect of income level on stroke incidence and the mediated effect of simultaneous diagnosis of metabolic syndrome diseases; a nationwide cohort study in South Korea. Diabetol. Metab. Syndr. 2022, 14, 110. [Google Scholar] [CrossRef]
- Suliga, E.; Cieśla, E.; Rębak, D.; Kozieł, D.; Głuszek, S. Relationship between sitting time, physical activity, and metabolic syndrome among adults depending on body mass index (BMI). Med. Sci. Monit. Int. Med. J. Exp. Clin. Res. 2018, 24, 7633. [Google Scholar] [CrossRef] [PubMed]
- Rashidbeygi, E.; Safabakhsh, M.; Mohammed, S.H.; Alizadeh, S. Metabolic syndrome and its components are related to a higher risk for albuminuria and proteinuria: Evidence from a meta-analysis on 10,603,067 subjects from 57 studies. Diabetes Metab. Syndr. Clin. Res. Rev. 2019, 13, 830–843. [Google Scholar] [CrossRef]
- Mohtashami, A. Effects of bread with Nigella sativa on blood glucose, blood pressure and anthropometric indices in patients with metabolic syndrome. Clin. Nutr. Res. 2019, 8, 138–147. [Google Scholar] [CrossRef] [PubMed]
- Mocciaro, G.; D’amore, S.; Jenkins, B.; Kay, R.; Murgia, A.; Herrera-Marcos, L.V.; Neun, S.; Sowton, A.P.; Hall, Z.; Palma-Duran, S.A.; et al. Lipidomic approaches to study HDL metabolism in patients with central obesity diagnosed with metabolic syndrome. Int. J. Mol. Sci. 2022, 23, 6786. [Google Scholar] [CrossRef]
- Chen, J.; Huang, H.; Cohn, A.G.; Zhang, D.; Zhou, M. Machine learning-based classification of rock discontinuity trace: SMOTE oversampling integrated with GBT ensemble learning. Int. J. Min. Sci. Technol. 2022, 32, 309–322. [Google Scholar] [CrossRef]
- Zhang, R.; Nie, F.; Li, X.; Wei, X. Feature selection with multi-view data: A survey. Inf. Fusion 2019, 50, 158–167. [Google Scholar] [CrossRef]
- Berrar, D. Bayes’ theorem and naive Bayes classifier. Encycl. Bioinform. Comput. Biol. ABC Bioinform. 2018, 403. [Google Scholar]
- Nusinovici, S.; Tham, Y.C.; Yan, M.Y.C.; Ting, D.S.W.; Li, J.; Sabanayagam, C.; Wong, T.Y.; Cheng, C.Y. Logistic regression was as good as machine learning for predicting major chronic diseases. J. Clin. Epidemiol. 2020, 122, 56–69. [Google Scholar] [CrossRef] [PubMed]
- Posonia, A.M.; Vigneshwari, S.; Rani, D.J. Machine Learning based Diabetes Prediction using Decision Tree J48. In Proceedings of the IEEE 2020 3rd International Conference on Intelligent Sustainable Systems (ICISS), Thoothukudi, India, 3–5 December 2020; pp. 498–502. [Google Scholar]
- Pisner, D.A.; Schnyer, D.M. Support vector machine. In Machine learning; Elsevier: Amsterdam, The Netherlands, 2020; pp. 101–121. [Google Scholar]
- González, S.; García, S.; Del Ser, J.; Rokach, L.; Herrera, F. A practical tutorial on bagging and boosting based ensembles for machine learning: Algorithms, software tools, performance study, practical perspectives and opportunities. Inf. Fusion 2020, 64, 205–237. [Google Scholar] [CrossRef]
- Palimkar, P.; Shaw, R.N.; Ghosh, A. Machine learning technique to prognosis diabetes disease: Random forest classifier approach. In Advanced Computing and Intelligent Technologies; Springer: Berlin/Heidelberg, Germany, 2022; pp. 219–244. [Google Scholar]
- Husna, N.A.; Bustamam, A.; Yanuar, A.; Sarwinda, D. The drug design for diabetes mellitus type II using rotation forest ensemble classifier. Procedia Comput. Sci. 2021, 179, 161–168. [Google Scholar] [CrossRef]
- Dogan, A.; Birant, D. A weighted majority voting ensemble approach for classification. In Proceedings of the IEEE 2019 4th International Conference on Computer Science and Engineering (UBMK), Samsun, Turkey, 11–15 September 2019; pp. 1–6. [Google Scholar]
- Pavlyshenko, B. Using stacking approaches for machine learning models. In Proceedings of the 2018 IEEE Second International Conference on Data Stream Mining & Processing (DSMP), Lviv, Ukraine, 21–25 August 2018; pp. 255–258. [Google Scholar]
- Masih, N.; Naz, H.; Ahuja, S. Multilayer perceptron based deep neural network for early detection of coronary heart disease. Health Technol. 2021, 11, 127–138. [Google Scholar] [CrossRef]
- Cunningham, P.; Delany, S.J. k-Nearest neighbour classifiers—A Tutorial. ACM Comput. Surv. (CSUR) 2021, 54, 1–25. [Google Scholar] [CrossRef]
- Weka. Available online: https://www.weka.io/ (accessed on 26 February 2023).
- Gutiérrez-Esparza, G.O.; Infante Vázquez, O.; Vallejo, M.; Hernández-Torruco, J. Prediction of metabolic syndrome in a Mexican population applying machine learning algorithms. Symmetry 2020, 12, 581. [Google Scholar] [CrossRef]
- Karimi-Alavijeh, F.; Jalili, S.; Sadeghi, M. Predicting metabolic syndrome using decision tree and support vector machine methods. ARYA Atheroscler. 2016, 12, 146. [Google Scholar]
- Tavares, L.D.; Manoel, A.; Donato, T.H.R.; Cesena, F.; Minanni, C.A.; Kashiwagi, N.M.; da Silva, L.P.; Amaro, E., Jr.; Szlejf, C. Prediction of metabolic syndrome: A machine learning approach to help primary prevention. Diabetes Res. Clin. Pract. 2022, 191, 110047. [Google Scholar] [CrossRef]
- Yu, C.S.; Lin, Y.J.; Lin, C.H.; Wang, S.T.; Lin, S.Y.; Lin, S.H.; Wu, J.L.; Chang, S.S. Predicting metabolic syndrome with machine learning models using a decision tree algorithm: Retrospective cohort study. JMIR Med. Inform. 2020, 8, e17110. [Google Scholar] [CrossRef]
- Choe, E.K.; Rhee, H.; Lee, S.; Shin, E.; Oh, S.W.; Lee, J.E.; Choi, S.H. Metabolic syndrome prediction using machine learning models with genetic and clinical information from a nonobese healthy population. Genom. Inform. 2018, 16, e31. [Google Scholar] [CrossRef] [PubMed]
- Datta, S.; Schraplau, A.; Da Cruz, H.F.; Sachs, J.P.; Mayer, F.; Böttinger, E. A machine learning approach for non-invasive diagnosis of metabolic syndrome. In Proceedings of the 2019 IEEE 19th International Conference on Bioinformatics and Bioengineering (BIBE), Athens, Greece, 28–30 October 2019; pp. 933–940. [Google Scholar]
- Cheong, K.C.; Ghazali, S.M.; Hock, L.K.; Subenthiran, S.; Huey, T.C.; Kuay, L.K.; Mustapha, F.I.; Yusoff, A.F.; Mustafa, A.N. The discriminative ability of waist circumference, body mass index and waist-to-hip ratio in identifying metabolic syndrome: Variations by age, sex and race. Diabetes Metab. Syndr. Clin. Res. Rev. 2015, 9, 74–78. [Google Scholar] [CrossRef] [PubMed]
- Hosseini-Esfahani, F.; Alafchi, B.; Cheraghi, Z.; Doosti-Irani, A.; Mirmiran, P.; Khalili, D.; Azizi, F. Using machine learning techniques to predict factors contributing to the incidence of metabolic syndrome in tehran: Cohort study. JMIR Public Health Surveill. 2021, 7, e27304. [Google Scholar] [CrossRef] [PubMed]
- Lee, S.; Lee, H.; Choi, J.R.; Koh, S.B. Development and validation of prediction model for risk reduction of metabolic syndrome by body weight control: A prospective population-based study. Sci. Rep. 2020, 10, 10006. [Google Scholar] [CrossRef] [PubMed]
- Yang, H.; Yu, B.; OUYang, P.; Li, X.; Lai, X.; Zhang, G.; Zhang, H. Machine learning-aided risk prediction for metabolic syndrome based on 3 years study. Sci. Rep. 2022, 12, 2248. [Google Scholar] [CrossRef] [PubMed]
- Lee, S.; Lee, S.K.; Kim, J.Y.; Cho, N.; Shin, C. Sasang constitutional types for the risk prediction of metabolic syndrome: A 14-year longitudinal prospective cohort study. BMC Complement. Altern. Med. 2017, 17, 438. [Google Scholar] [CrossRef]
- Li, G.; Esangbedo, I.C.; Xu, L.; Fu, J.; Li, L.; Feng, D.; Han, L.; Xiao, X.; Li, M.; Mi, J.; et al. Childhood retinol-binding protein 4 (RBP4) levels predicting the 10-year risk of insulin resistance and metabolic syndrome: The BCAMS study. Cardiovasc. Diabetol. 2018, 17, 69. [Google Scholar] [CrossRef]
- Zou, T.T.; Zhou, Y.J.; Zhou, X.D.; Liu, W.Y.; Van Poucke, S.; Wu, W.J.; Zheng, J.N.; Gu, X.M.; Zhang, D.C.; Zheng, M.H.; et al. MetS risk score: A clear scoring model to predict a 3-year risk for metabolic syndrome. Horm. Metab. Res. 2018, 50, 683–689. [Google Scholar] [CrossRef]
- Molnar, C.; König, G.; Herbinger, J.; Freiesleben, T.; Dandl, S.; Scholbeck, C.A.; Casalicchio, G.; Grosse-Wentrup, M.; Bischl, B. General pitfalls of model-agnostic interpretation methods for machine learning models. In Proceedings of the xxAI-Beyond Explainable AI: International Workshop, Held in Conjunction with ICML 2020, Vienna, Austria, 18 July 2020; Revised and Extended Papers. Springer: Berlin/Heidelberg, Germany, 2022; pp. 39–68. [Google Scholar]
- Devassy, B.M.; George, S. Dimensionality reduction and visualisation of hyperspectral ink data using t-SNE. Forensic Sci. Int. 2020, 311, 110194. [Google Scholar] [CrossRef]
Figure 1.
Feature importance based on the information gain, with and without using the SMOTE.
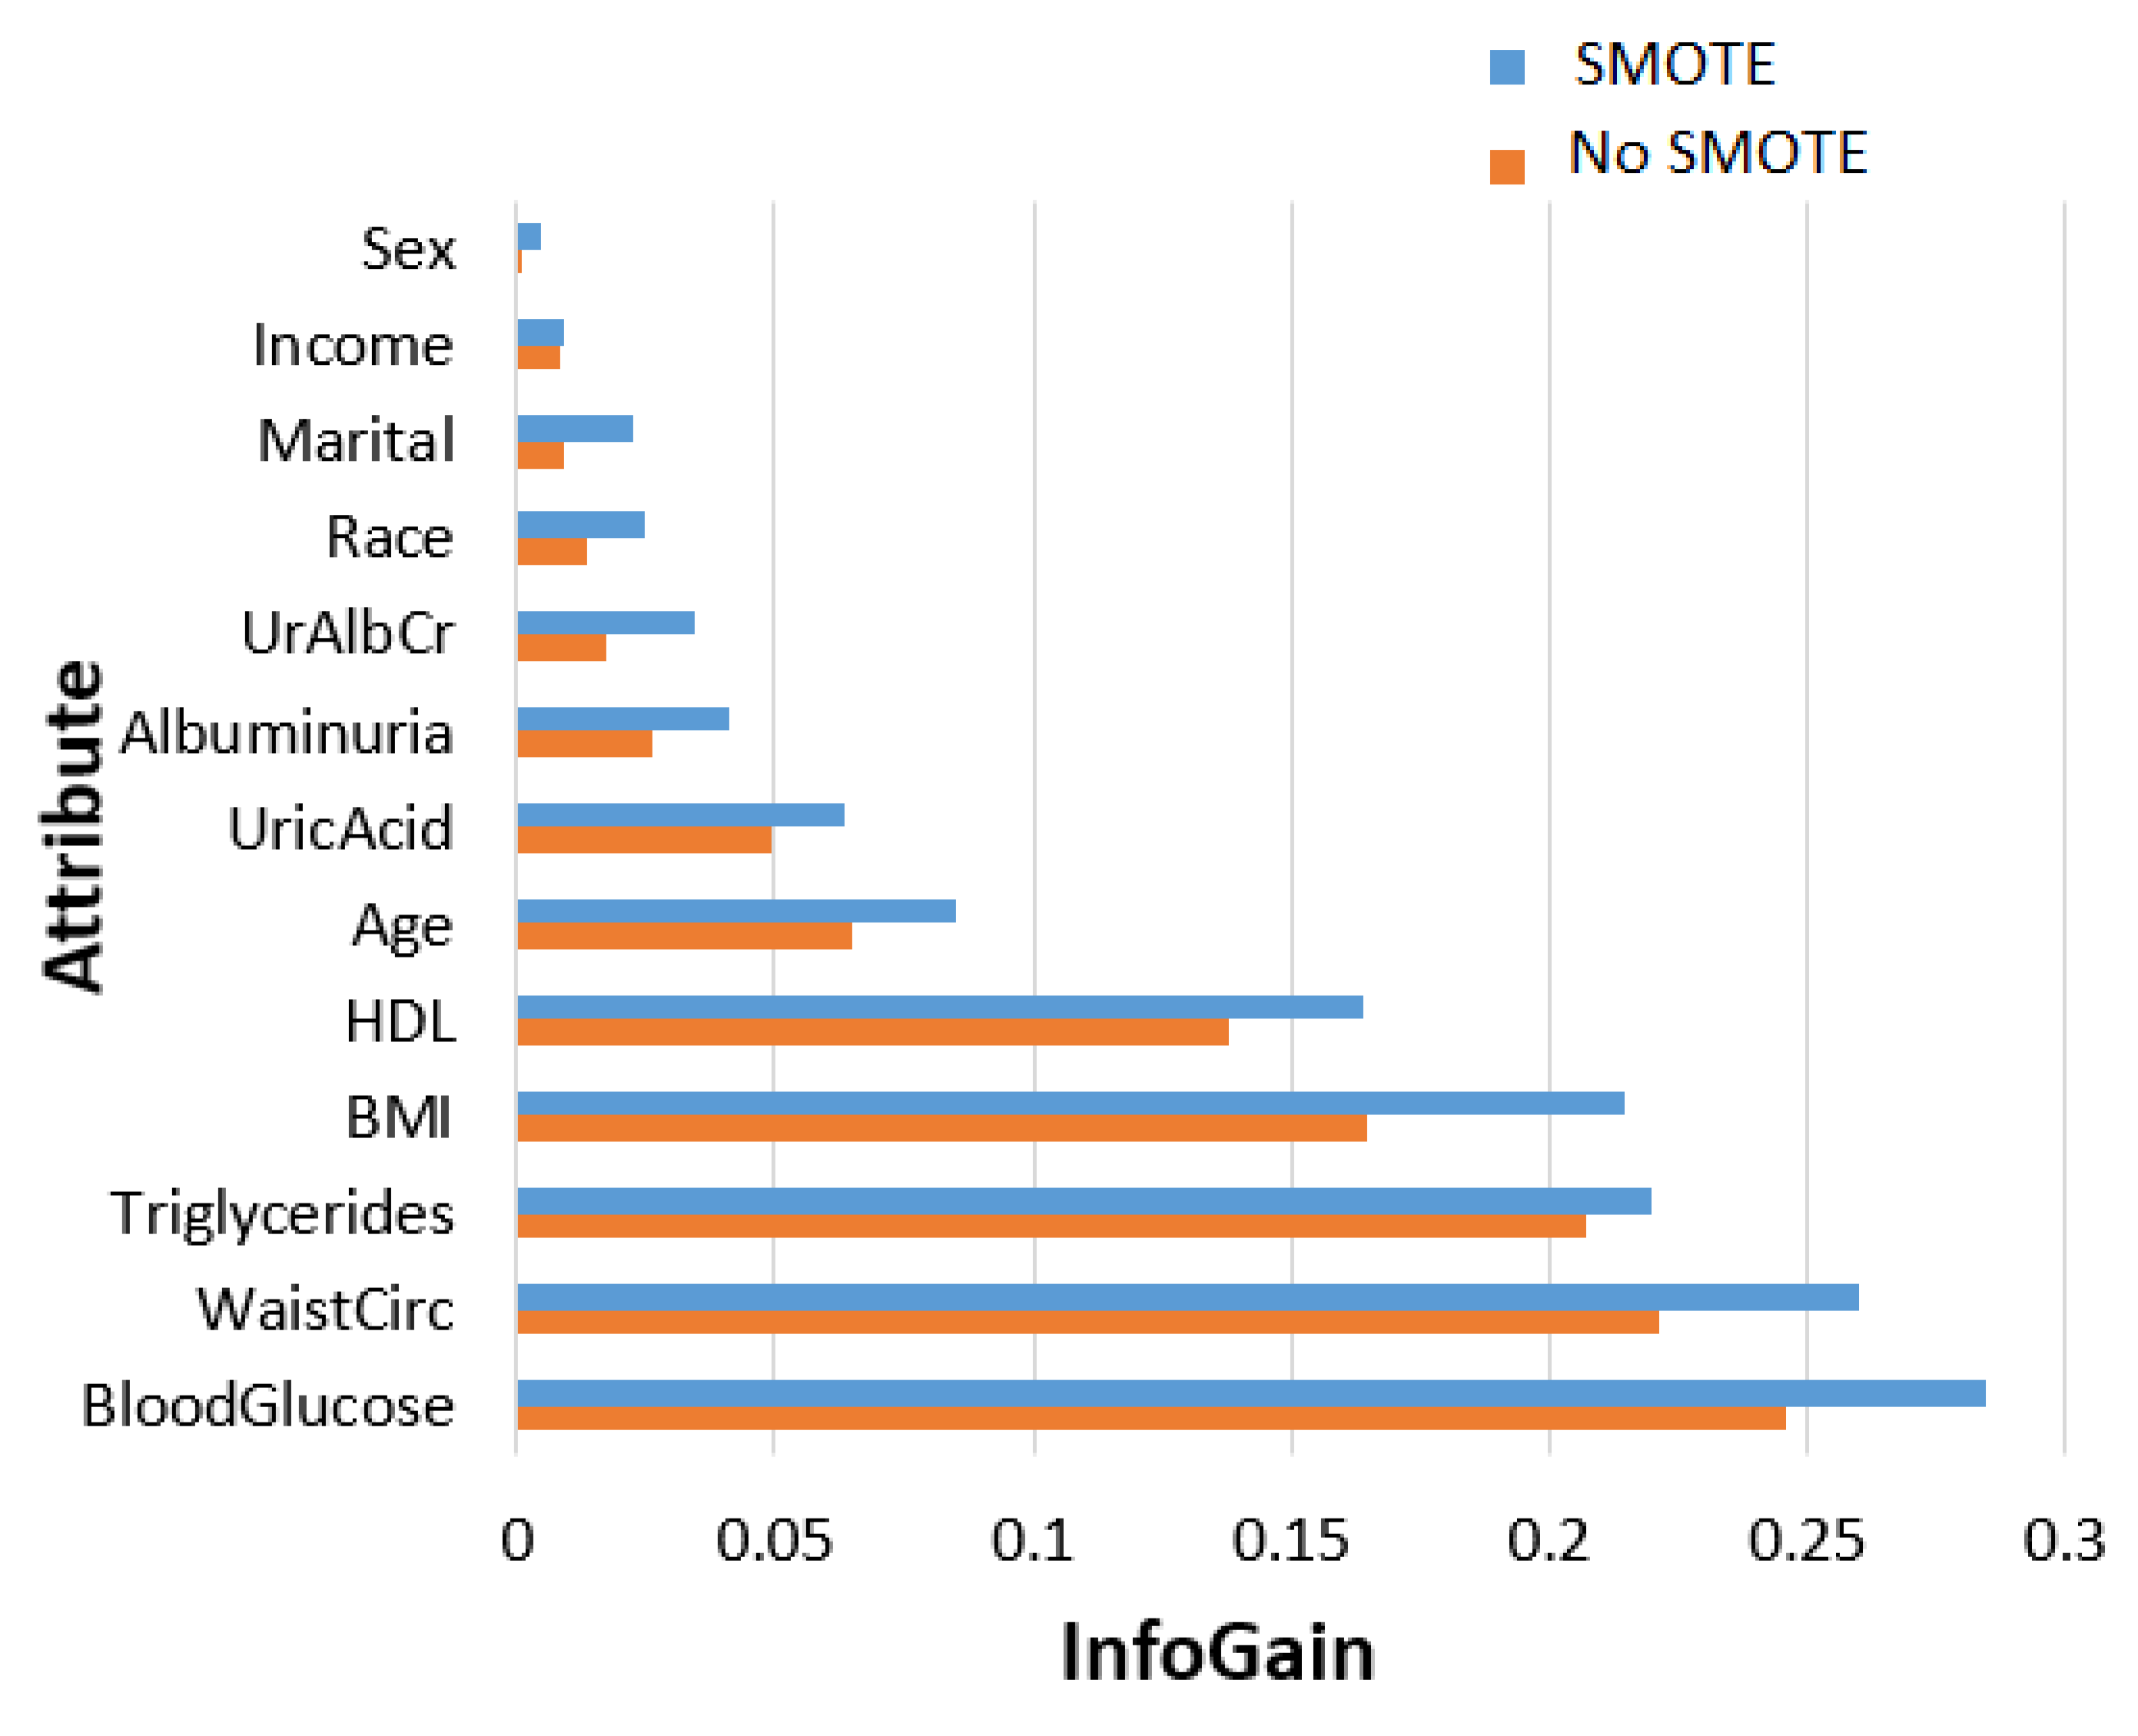
Figure 2.
Feature importance based on the gain ratio, with and without using the SMOTE.
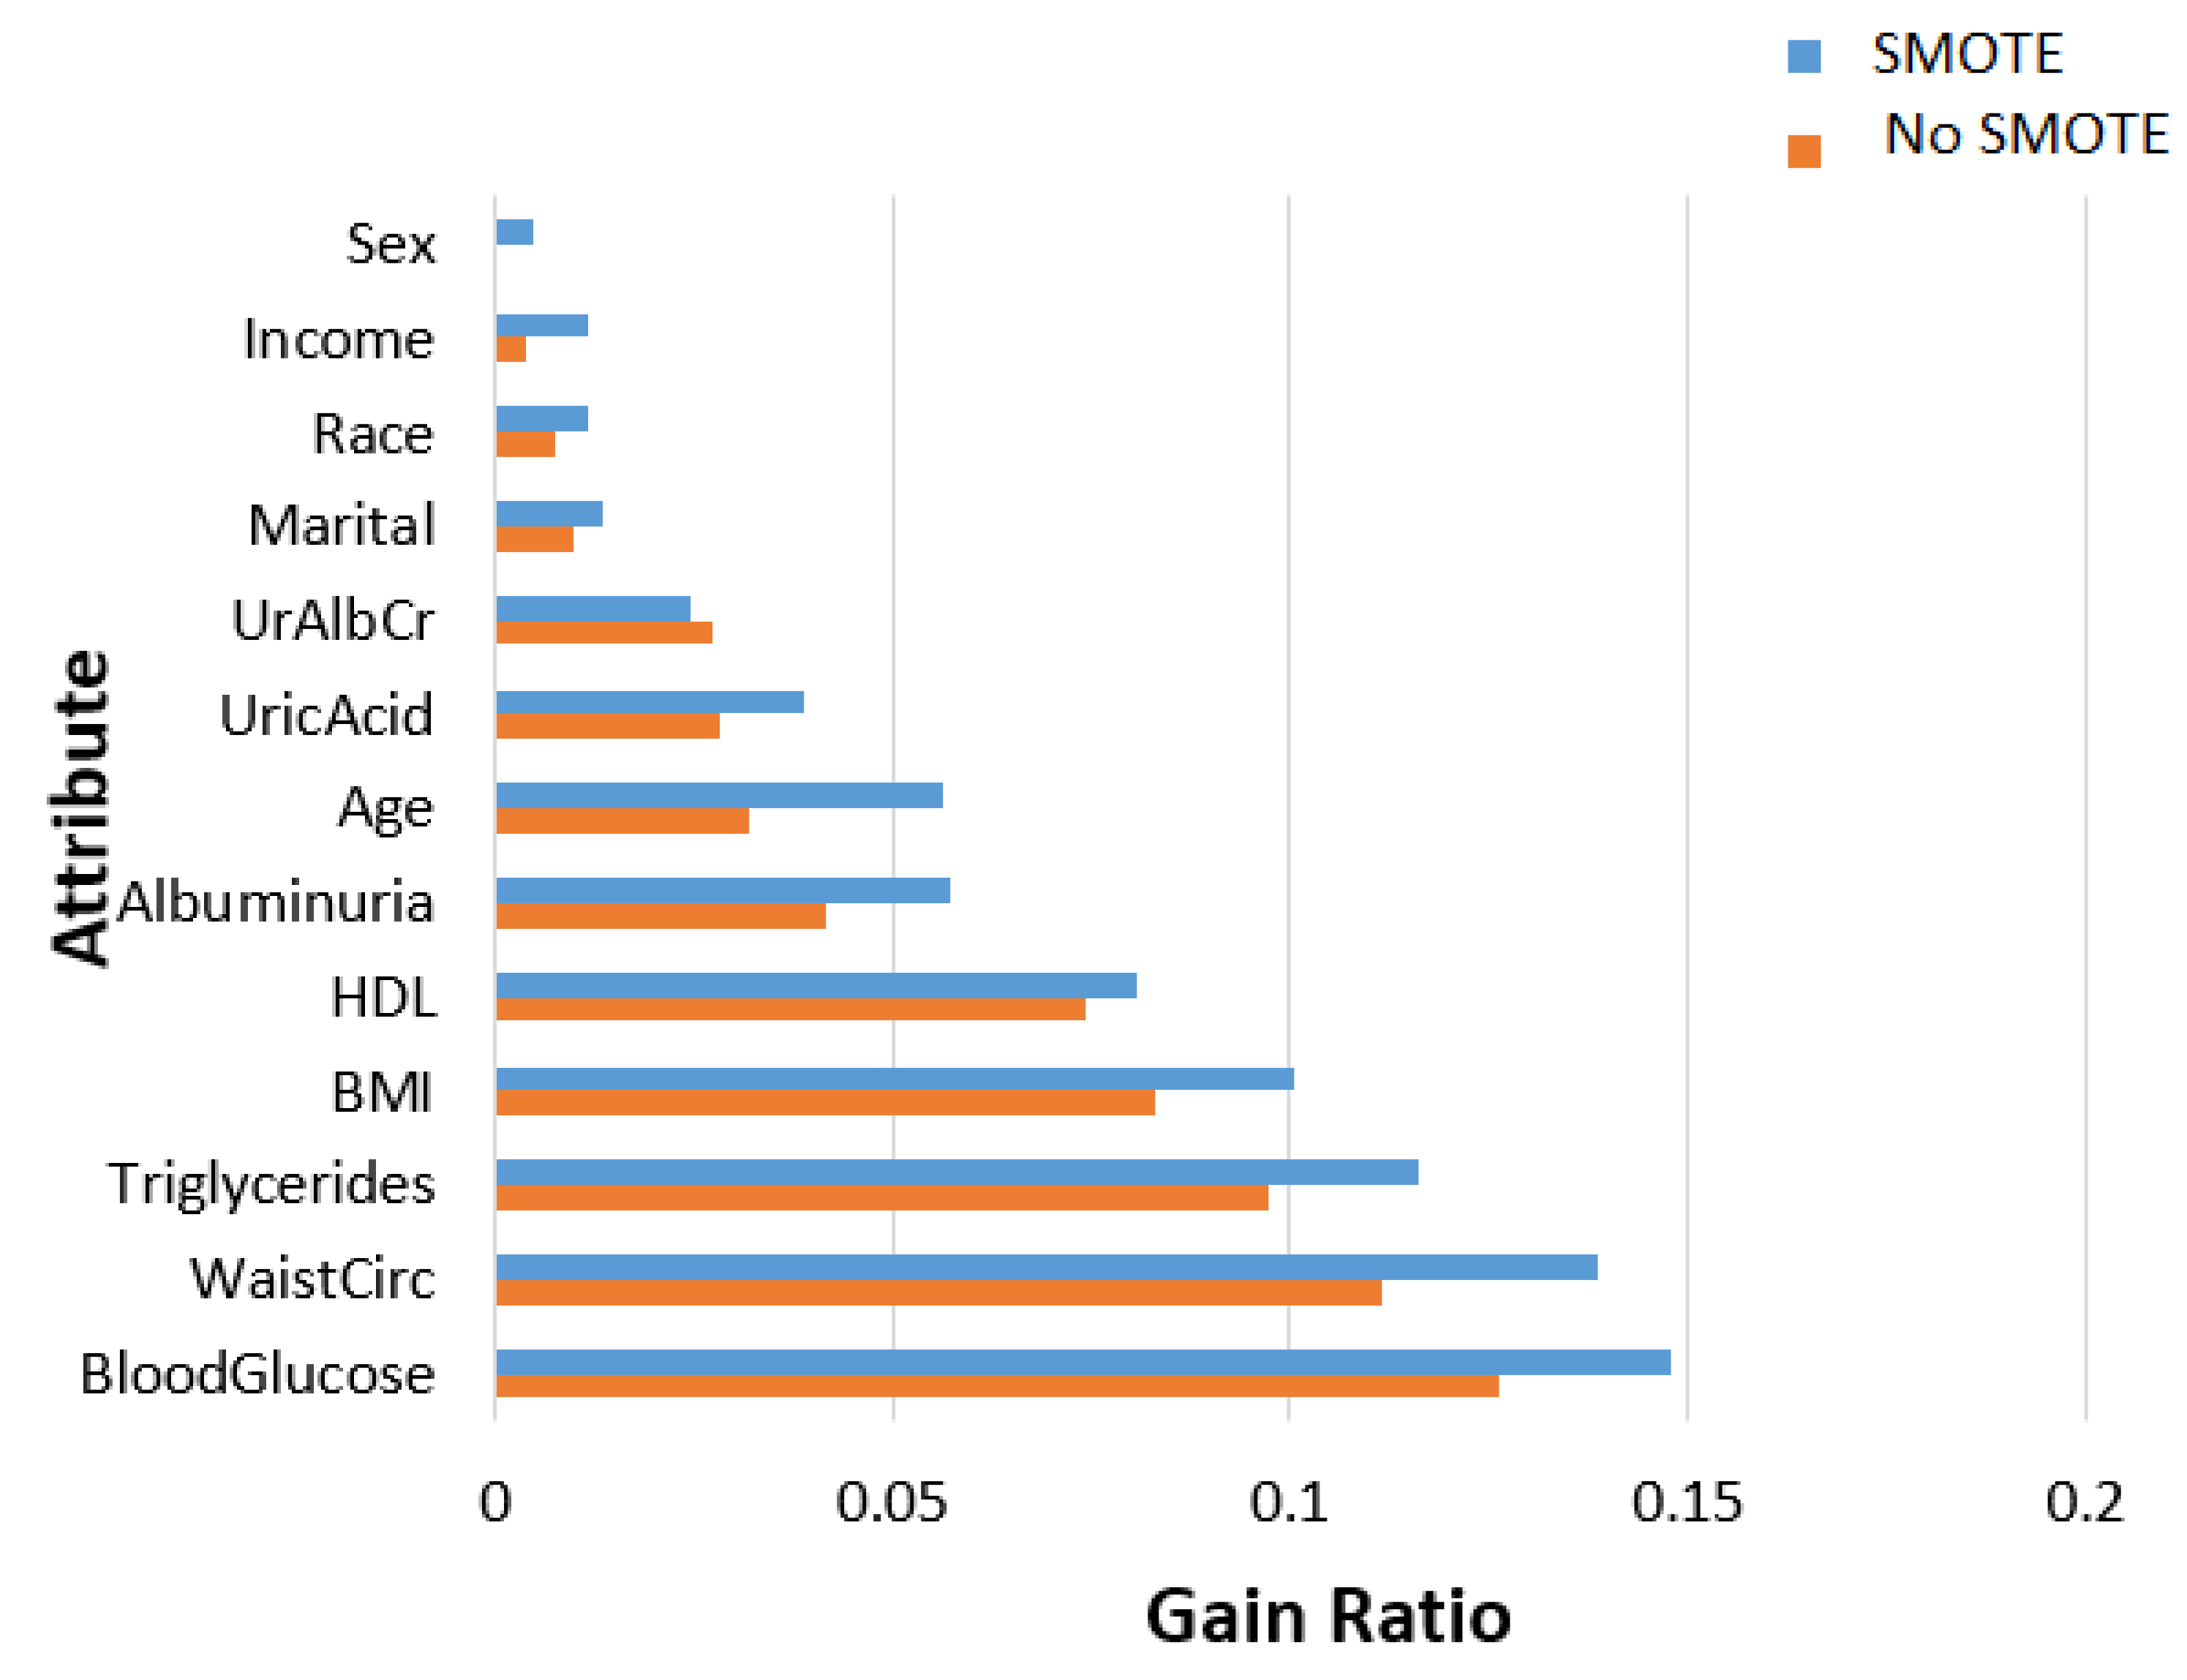
Figure 3.
Feature importance based on Gini impurity, with and without using the SMOTE.
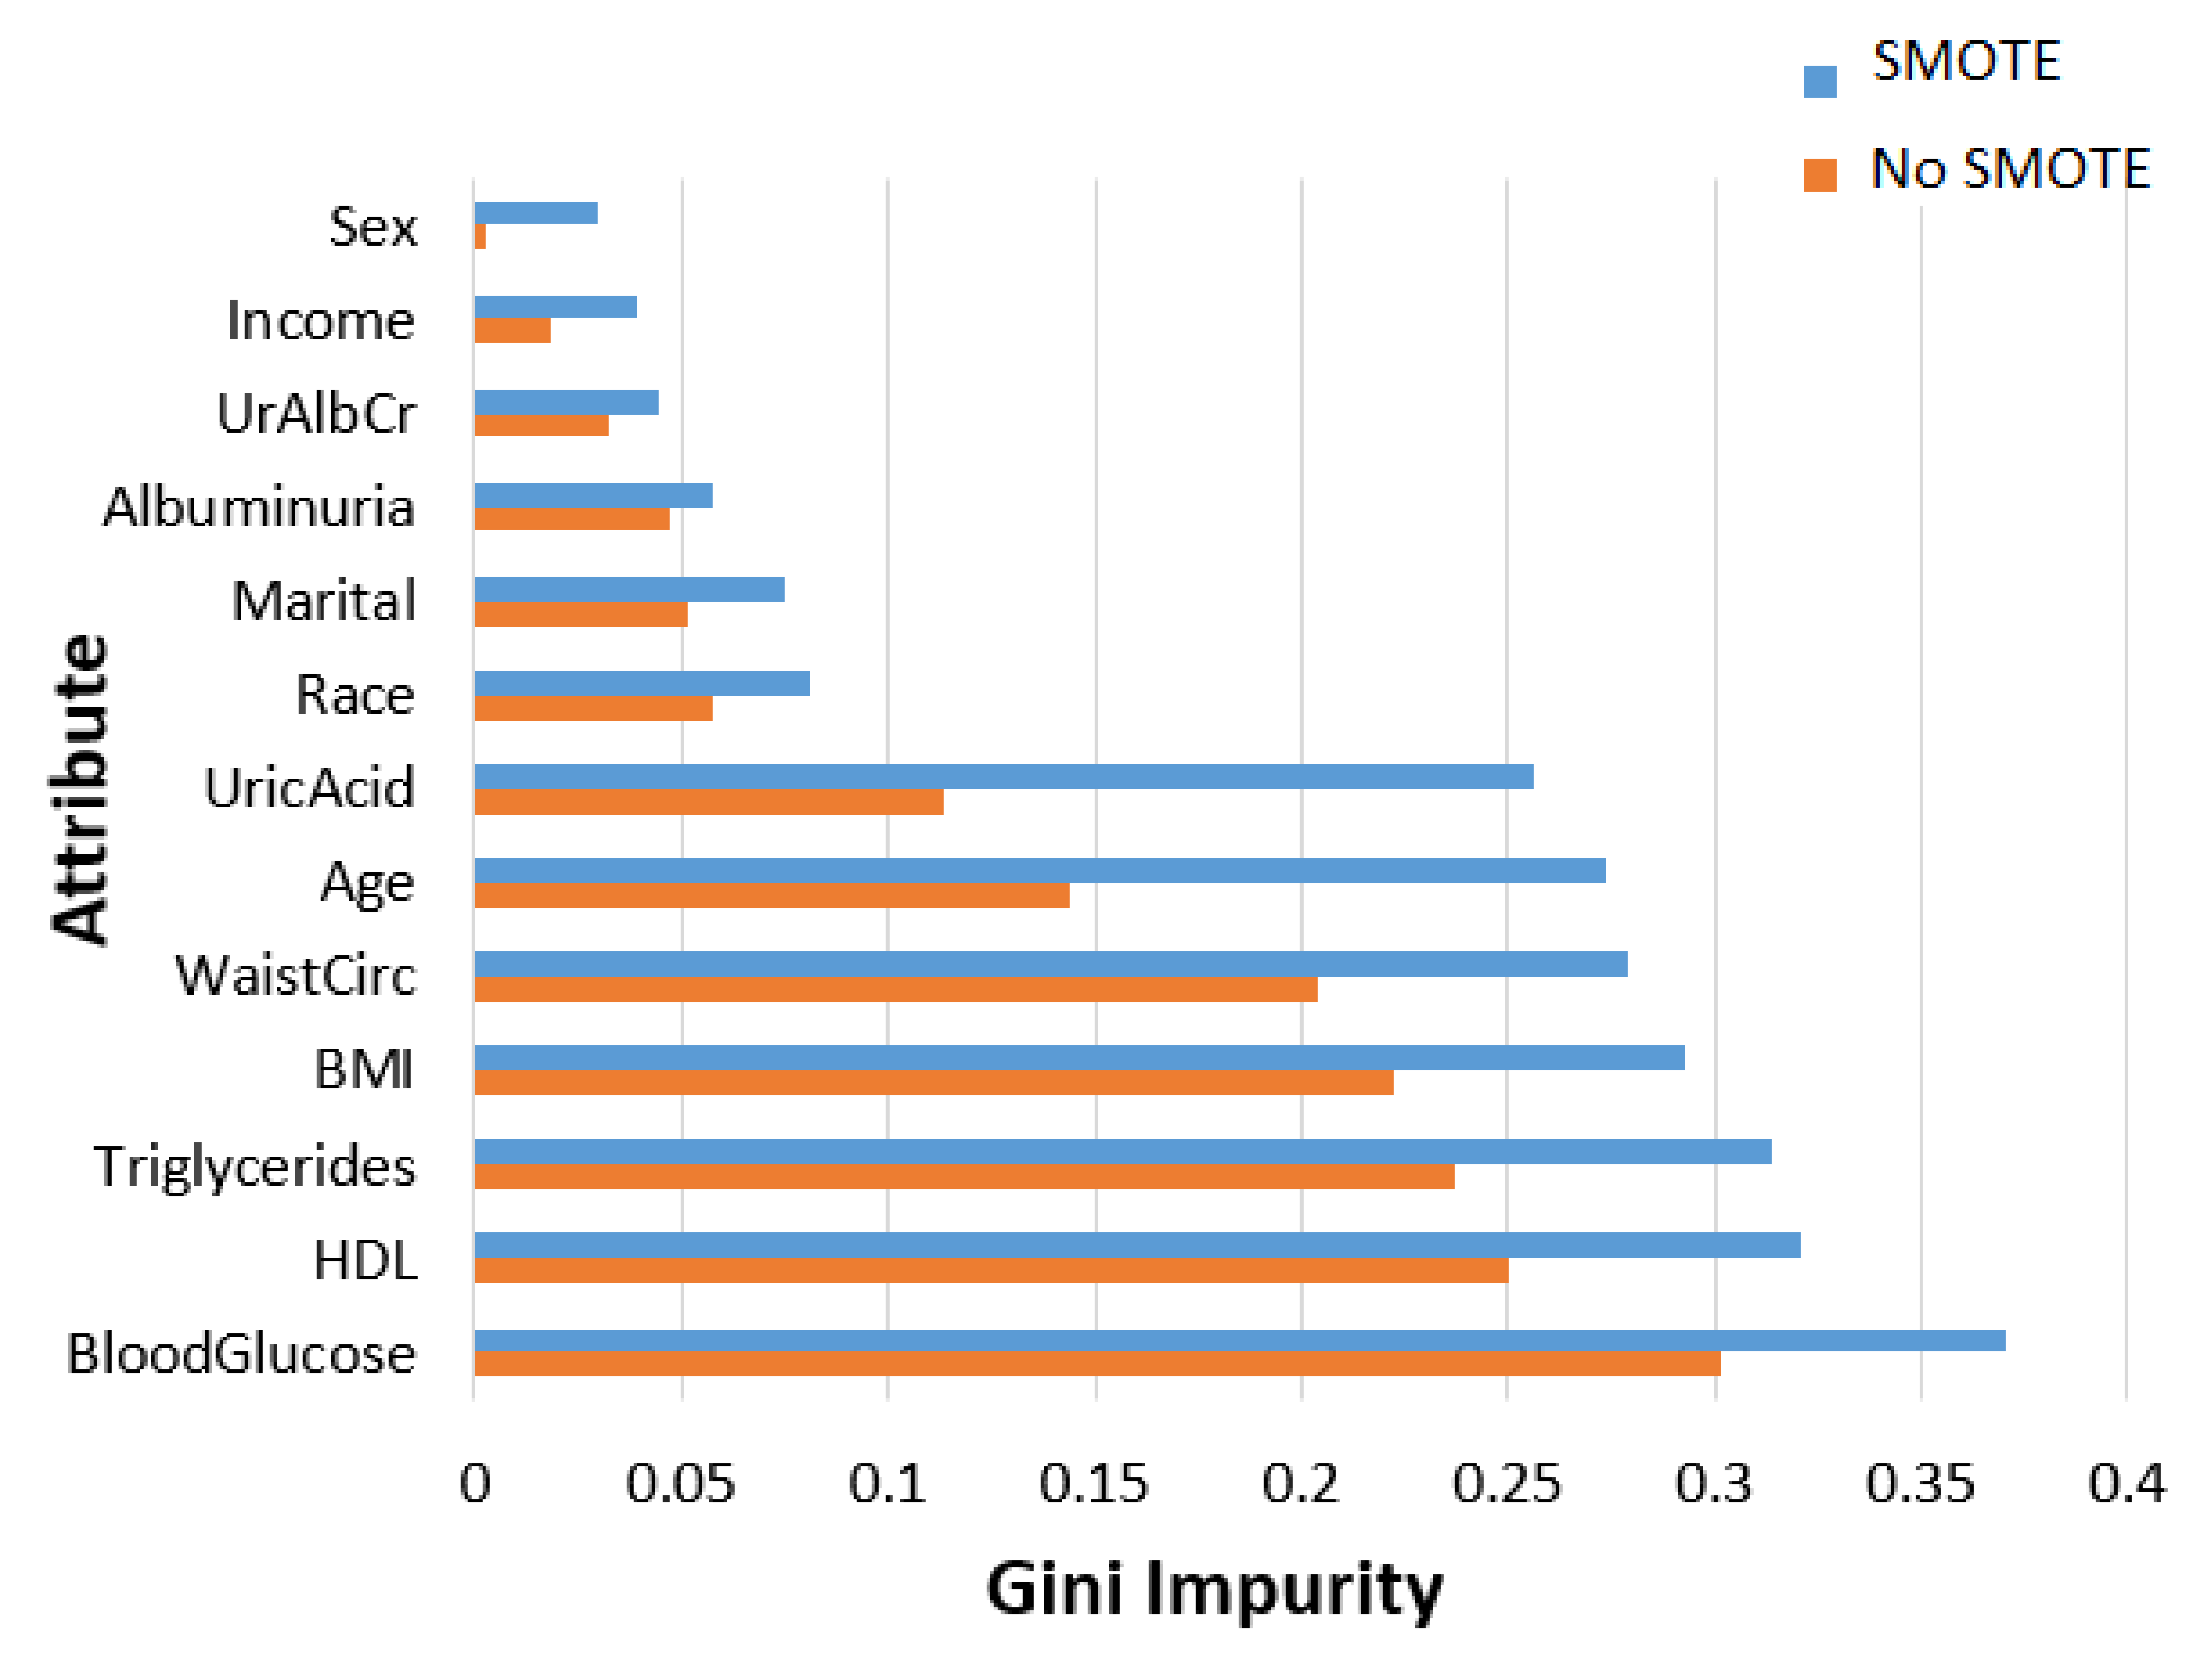
Figure 4.
Correlation matrix for different pairs of features (except for income, marital status, and race).
Figure 4.
Correlation matrix for different pairs of features (except for income, marital status, and race).
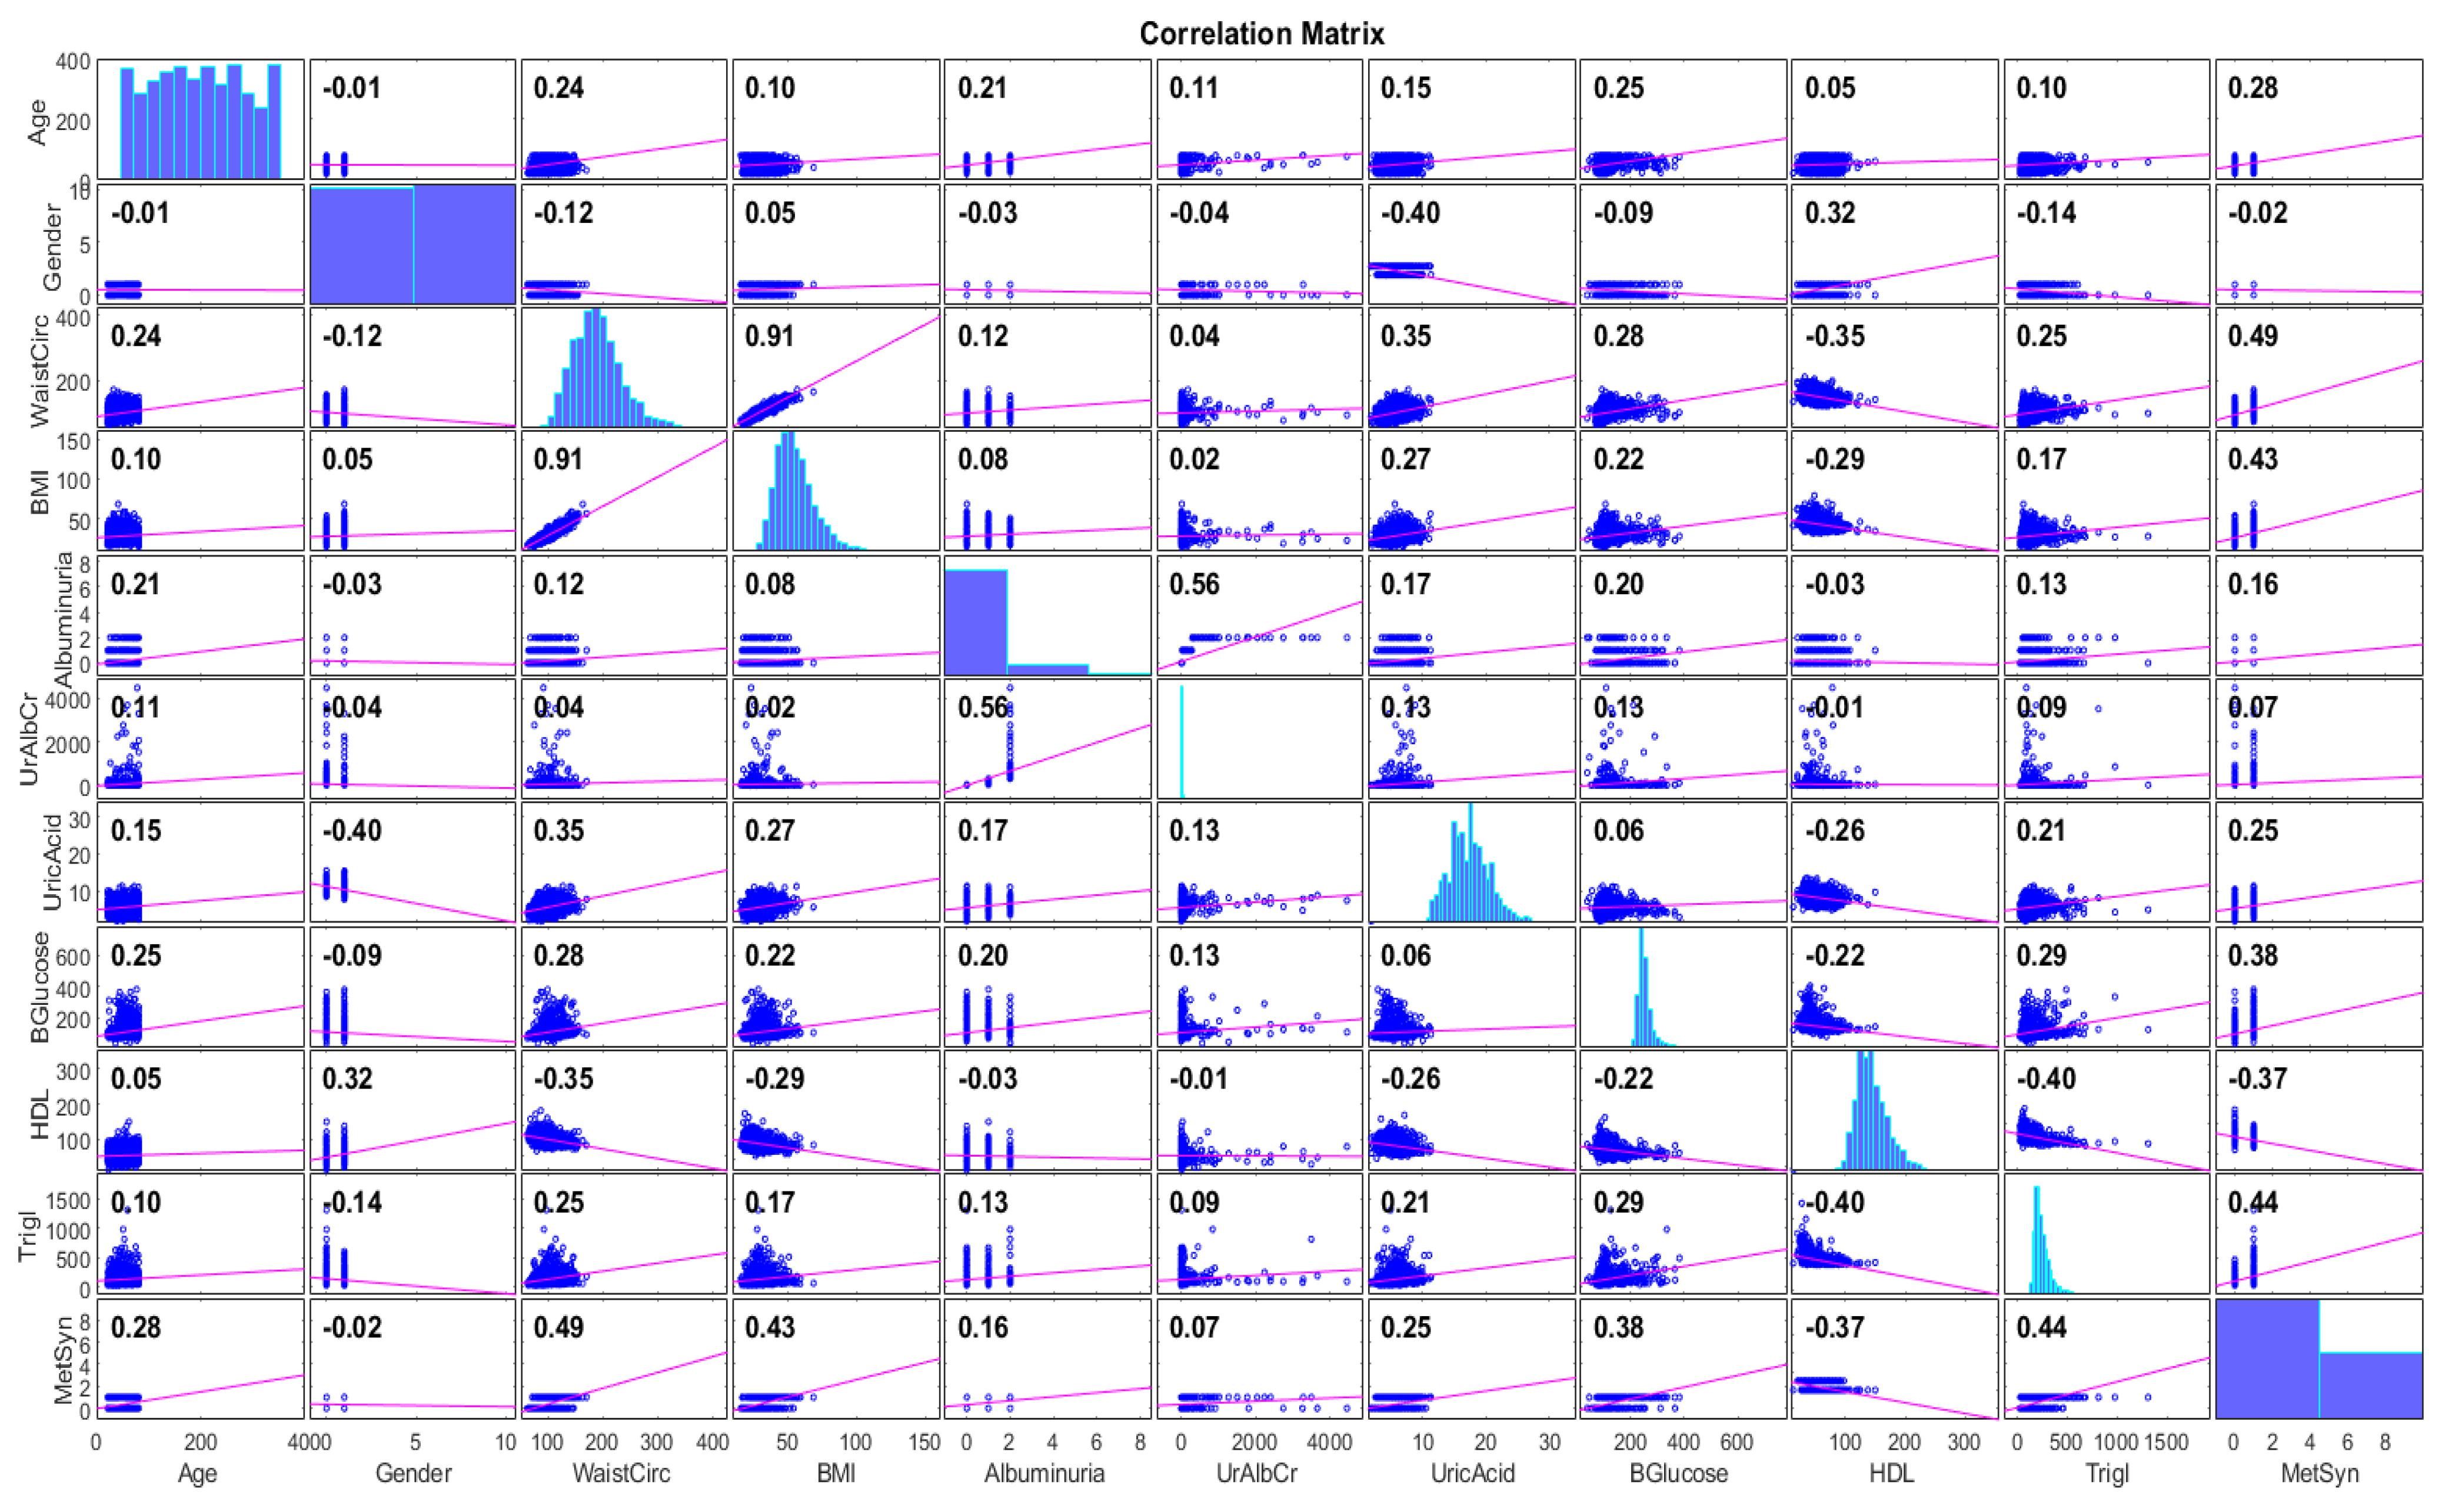
Figure 5.
Correlation matrix for different pairs of features when using the SMOTE (except for income, marital status, and race).
Figure 5.
Correlation matrix for different pairs of features when using the SMOTE (except for income, marital status, and race).
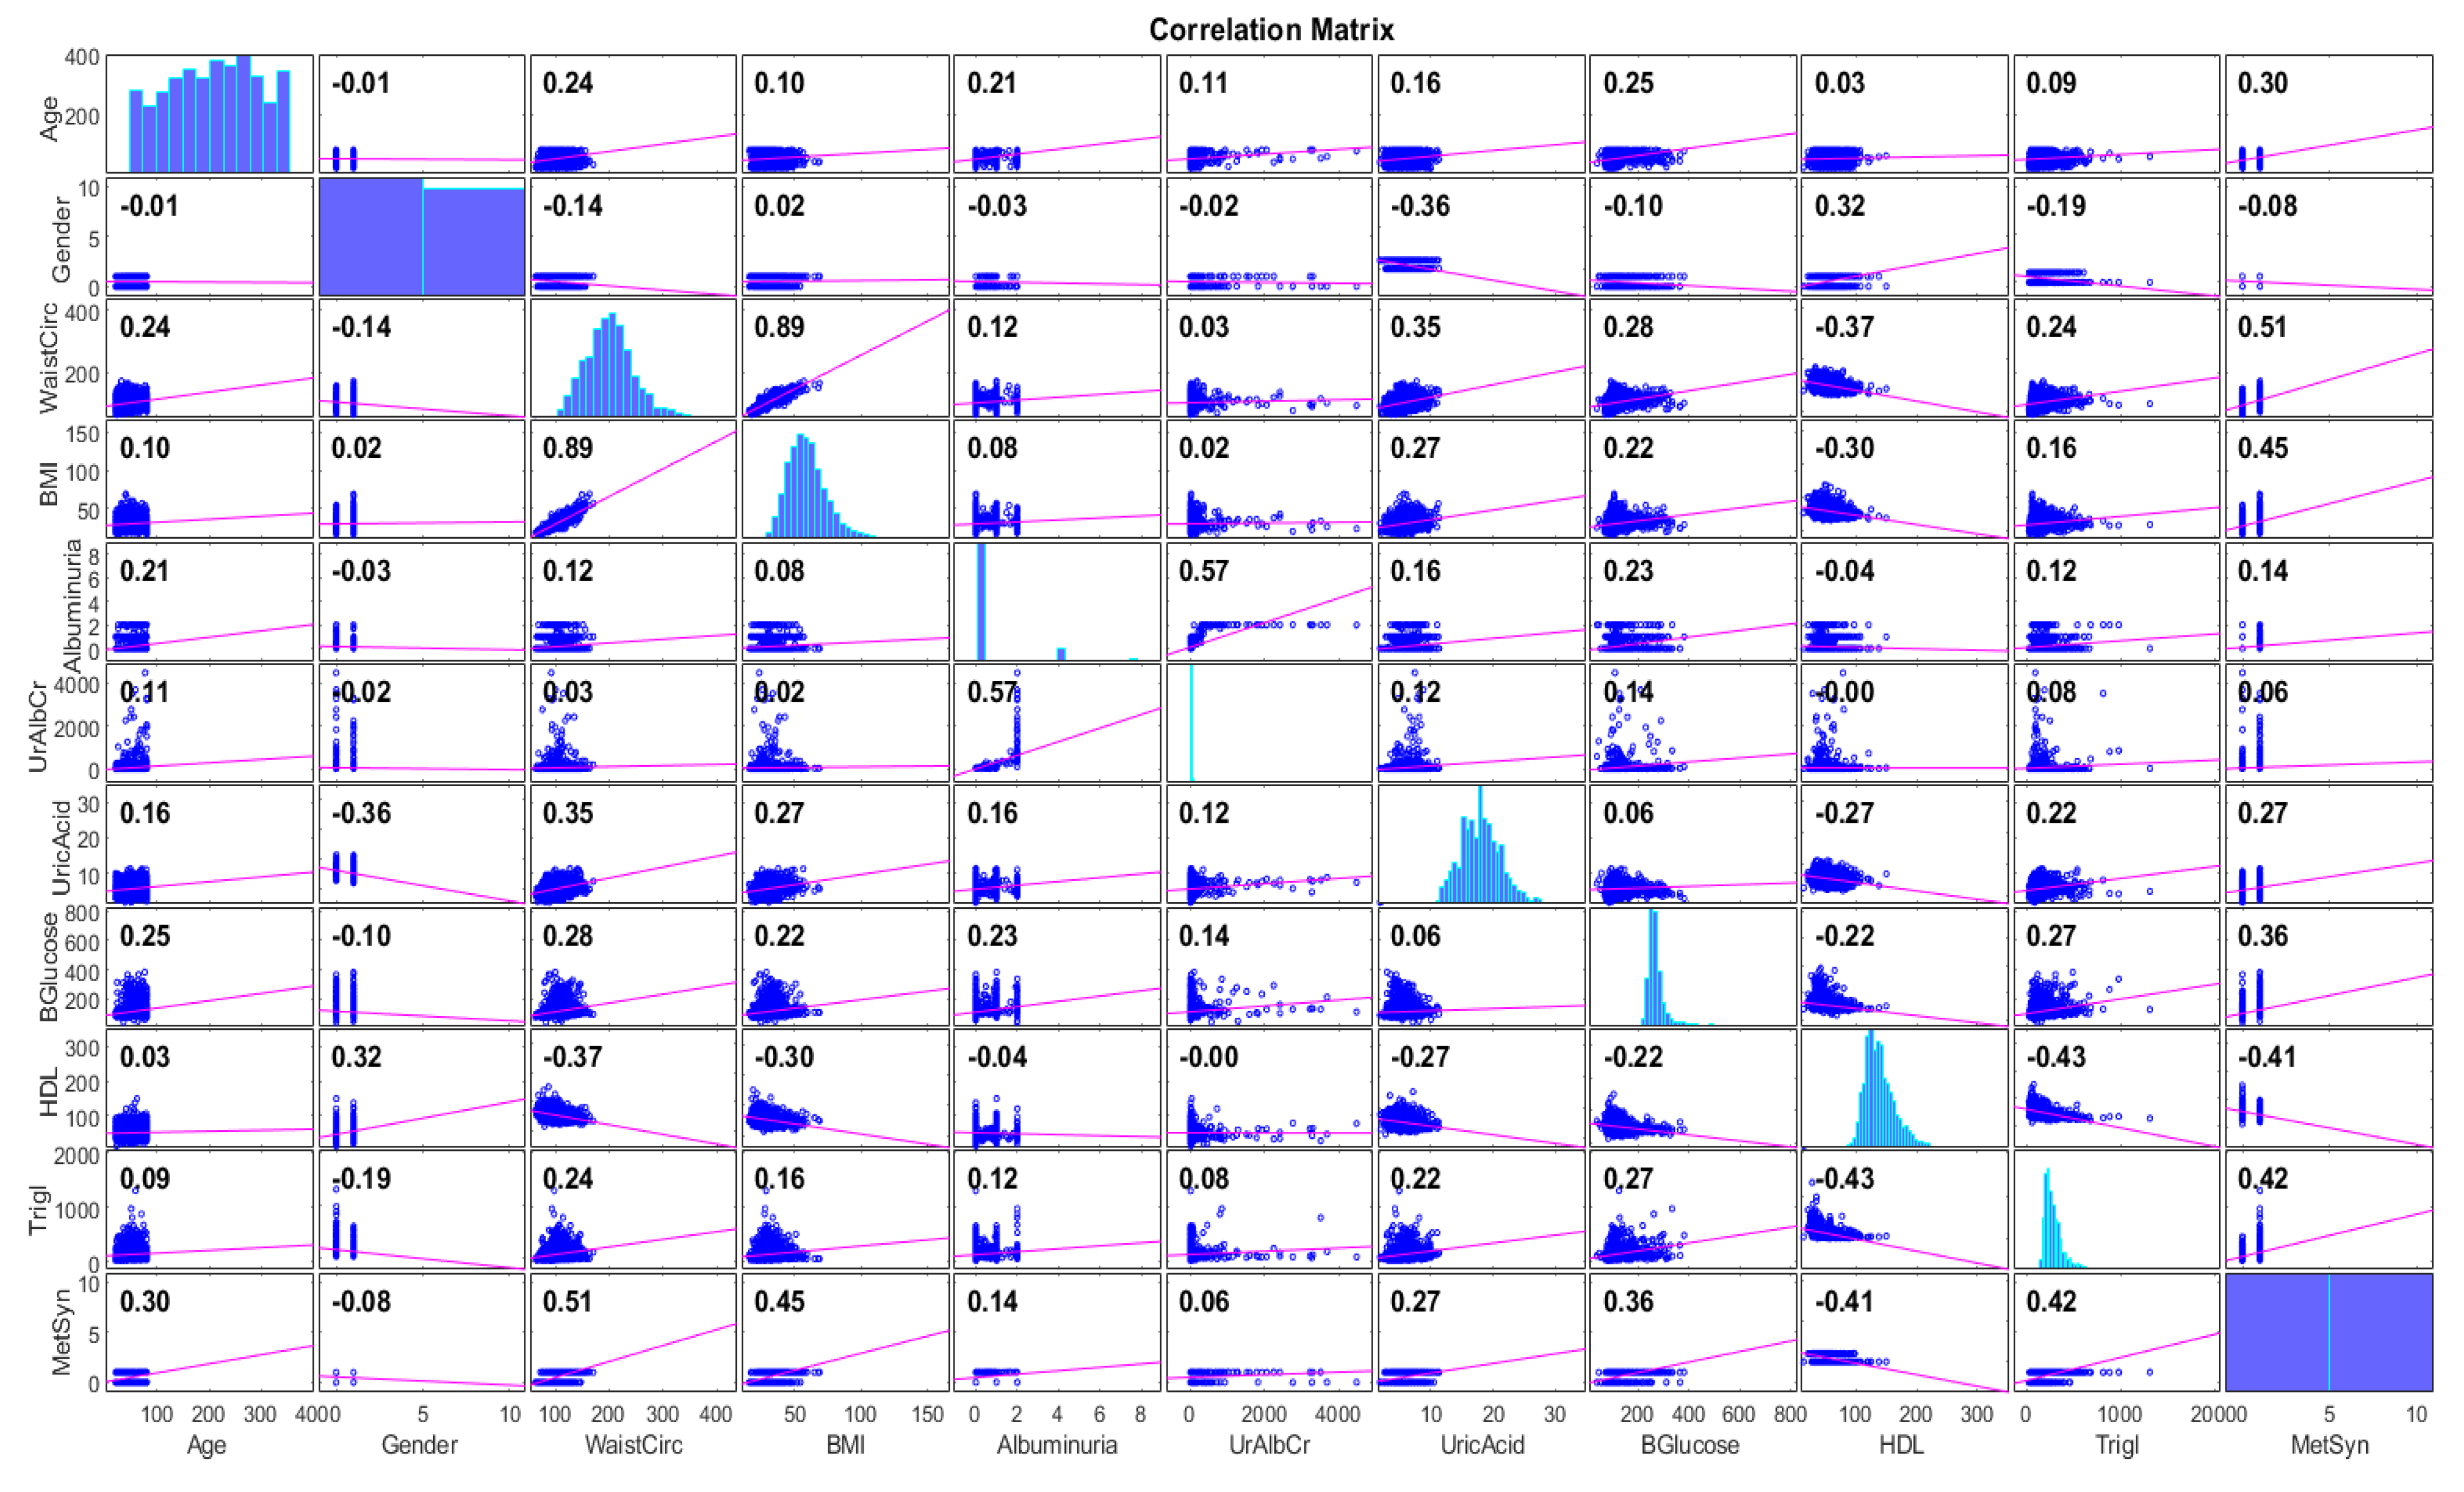
Figure 6.
AUC ROC curves of ML models using the SMOTE with 10-fold cross-validation.


Table 1.
Univariate analysis of the dataset (without the SMOTE).
| Attribute | Description | ||
|---|---|---|---|
| Min | Max | Mean ± std Dev | |
| age | 20 | 80 | 49.2 ± 17.4 |
| income | 300 | 9000 | 4147.2 ± 2984.6 |
| waistcir | 63.1 | 170.5 | 98.5 ± 16.3 |
| BMI | 15.7 | 68.7 | 28.7 ± 6.58 |
| albuminuria | 0 | 2 | 0.15 ± 0.41 |
| UrAlbCr | 1.4 | 4462.8 | 42.3 ± 241.4 |
| uric acid | 1.8 | 11.3 | 5.5 ± 1.4 |
| blood glucose | 39 | 382 | 108 ± 33.6 |
| HDL | 14 | 150 | 53.5 ± 15 |
| triglycerides | 26 | 1311 | 126.9 ± 89.8 |
Table 2.
Machine learning models’ settings.
| Model | Parameters |
|---|---|
| LR | use Conjugate Gradient Descent: True |
| J48 | reduced Error Pruning: False save lnstance Data: True use MDL Correction: True subtree Raising: True binary Splits: True collapse Tree: True |
| MLP | learning rate = 0.1 training time = 200 |
| k-NN | k = 3 Search Algorithm: Linear NN Search with Euclidean cross-validate: True |
| NB | use Kernel Estimator: False use Supervised Discretization: True |
| SVM | kernel type: linear |
| RF | break Ties Radomly: True store out of Bag Predictions: True |
| XGBoost | batch Size: 100 num Decimal Places: 2 |
| RotF | classifier: RF number of Groups: True projection Filter: Principal Components |
| Stacking | classifiers: RF and J48 meta Classifier: LR |
| Voting | classifiers: RF and J48 combination Rule: average of probabilities |
| Bagging | classifiers: RF print Classifiers: True store out of Bag Predictions: True |
Table 3.
An overview of the ML models’ evaluation.
| Accuracy (%) | Precision | Recall | F1 Score | AUC | ||||||
|---|---|---|---|---|---|---|---|---|---|---|
| No SMOTE | SMOTE | No SMOTE | SMOTE | No SMOTE | SMOTE | No SMOTE | SMOTE | No SMOTE | SMOTE | |
| NB | 84.57 | 84.87 | 0.849 | 0.854 | 0.846 | 0.858 | 0.847 | 0.856 | 0.926 | 0.930 |
| LR | 83.27 | 83.56 | 0.831 | 0.835 | 0.833 | 0.837 | 0.832 | 0.836 | 0.891 | 0.912 |
| SVM | 82.83 | 82.96 | 0.826 | 0.829 | 0.828 | 0.833 | 0.827 | 0.831 | 0.796 | 0.806 |
| MLP | 84.87 | 84.98 | 0.847 | 0.851 | 0.849 | 0.853 | 0.848 | 0.852 | 0.901 | 0.919 |
| 3-NN | 75.91 | 75.96 | 0.754 | 0.757 | 0.759 | 0.763 | 0.756 | 0.760 | 0.779 | 0.789 |
| J-48 | 86.56 | 86.61 | 0.865 | 0.869 | 0.865 | 0.868 | 0.865 | 0.868 | 0.895 | 0.918 |
| RF | 88.93 | 89.15 | 0.890 | 0.894 | 0.890 | 0.894 | 0.890 | 0.894 | 0.958 | 0.962 |
| RotF | 85.51 | 86.71 | 0.854 | 0.868 | 0.854 | 0.867 | 0.854 | 0.867 | 0.937 | 0.944 |
| Stacking | 88.95 | 89.35 | 0.889 | 0.898 | 0.889 | 0.898 | 0.889 | 0.898 | 0.960 | 0.965 |
| Bagging | 88.80 | 89.10 | 0.888 | 0.891 | 0.892 | 0.893 | 0.890 | 0.892 | 0.958 | 0.963 |
| Voting | 87.36 | 87.49 | 0.873 | 0.885 | 0.878 | 0.887 | 0.875 | 0.886 | 0.956 | 0.957 |
| XGBoost | 87.50 | 88.15 | 0.821 | 0.873 | 0.832 | 0.889 | 0.826 | 0.881 | 0.949 | 0.961 |
Disclaimer/Publisher’s Note: The statements, opinions and data contained in all publications are solely those of the individual author(s) and contributor(s) and not of MDPI and/or the editor(s). MDPI and/or the editor(s) disclaim responsibility for any injury to people or property resulting from any ideas, methods, instructions or products referred to in the content. |
© 2023 by the authors. Licensee MDPI, Basel, Switzerland. This article is an open access article distributed under the terms and conditions of the Creative Commons Attribution (CC BY) license (https://creativecommons.org/licenses/by/4.0/).
Share and Cite
MDPI and ACS Style
Trigka, M.; Dritsas, E. Predicting the Occurrence of Metabolic Syndrome Using Machine Learning Models. Computation 2023, 11, 170. https://doi.org/10.3390/computation11090170
AMA Style
Trigka M, Dritsas E. Predicting the Occurrence of Metabolic Syndrome Using Machine Learning Models. Computation. 2023; 11(9):170. https://doi.org/10.3390/computation11090170
Chicago/Turabian StyleTrigka, Maria, and Elias Dritsas. 2023. "Predicting the Occurrence of Metabolic Syndrome Using Machine Learning Models" Computation 11, no. 9: 170. https://doi.org/10.3390/computation11090170
Note that from the first issue of 2016, this journal uses article numbers instead of page numbers. See further details here.