Article

Analytical and Numerical Results for the Diffusion-Reaction Equation When the Reaction Coefficient Depends on Simultaneously the Space and Time Coordinates

1
Institute of Physics and Electrical Engineering, University of Miskolc, 3515 Miskolc, Hungary
2
Department of Fluid and Heat Engineering, University of Miskolc, 3515 Miskolc, Hungary
3
Mechanical Engineering Department, University of Technology—Iraq, Baghdad 10066, Iraq
4
Wigner Research Center for Physics, 1051 Budapest, Hungary
*
Author to whom correspondence should be addressed.
Computation 2023, 11(7), 127; https://doi.org/10.3390/computation11070127
Submission received: 31 May 2023 / Revised: 20 June 2023 / Accepted: 27 June 2023 / Published: 29 June 2023

Abstract

:
We utilize the travelling-wave Ansatz to obtain novel analytical solutions to the linear diffusion–reaction equation. The reaction term is a function of time and space simultaneously, firstly in a Lorentzian form and secondly in a cosine travelling-wave form. The new solutions contain the Heun functions in the first case and the Mathieu functions for the second case, and therefore are highly nontrivial. We use these solutions to test some non-conventional explicit and stable numerical methods against the standard explicit and implicit methods, where in the latter case the algebraic equation system is solved by the preconditioned conjugate gradient and the GMRES solvers. After this verification, we also calculate the transient temperature of a 2D surface subjected to the cooling effect of the wind, which is a function of space and time again. We obtain that the explicit stable methods can reach the accuracy of the implicit solvers in orders of magnitude shorter time.

Graphical Abstract

1. Introduction

It is well known that linear transient diffusion and heat conduction are analogous phenomena: mathematically, both of them are described by the simplest parabolic PDE (partial differential equation). Diffusion means the distribution of the particles is changing [1], while in heat conduction, energy is transported via interacting particles of the material [2].
Considering extra source terms in the regular diffusion equation, we arrive to a more general type of the reaction–diffusion equations. Numerous general mathematical aspects of such systems can be found in various monographs such as [3,4,5]. For example, the role of the reaction–diffusion equations in plasma physics is analyzed in [6].
According to Newton’s law of cooling, heat loss by convection is proportional to the temperature if it is measured compared to the actual ambient temperature. So, for x ,   t , the simplest PDE in one space dimension which can describe heat conduction and convection is:
u x , t t = D 2 u x , t x 2 K   u x , t ,   u x , t = 0 = u 0 x
where u : × ;   x , t u x , t is the unknown function (temperature in the case of heat conduction and concentration in the case of particle diffusion), and D is the constant diffusion coefficient. In the case of heat conduction, D = k / ( c ρ ) is the thermal diffusivity, while c, ρ, and k are the specific heat, the density, and the heat conductivity of the material, respectively. The term K u is a reaction term, so (1) is a regular diffusion-reaction PDE. Typically, u 0 is the given initial function, while the boundary conditions will be discussed in the concrete analytical and numerical examples.
The convection cooling process has wide applications in various engineering fields, such as steel production and the manufacture of air-driven turbine blades [7]. The cooling medium is used in various industrial manufacturing procedures to maintain a suitable temperature throughout the manufacturing process [8]. In high-load electronics, cooling systems are also routinely applied. The primary goal of these is to maintain the improved operational speed of the machine and mitigate possible damage. In the most prevalent case of computers, when the temperature of the CPU (central processing unit) exceeds the safe operating limits [9], a mechanism will be activated to cool it, usually by a heat pipe [10]. Utilizing heat-pipe-cooled micro-reactors presents a promising option for decentralized, remote electricity supply and space power technology due to their exceptional inherent safety and minimal maintenance requirements [11].
It is well known that for the diffusion equation, some analytical solutions exist, which can be found in basic textbooks [1,2]. These solutions have crucial relevance to understanding the diffusion process itself. As a second point, these solutions help to test the properties and performance of old and new numerical methods.
The regular and irregular diffusion equations were investigated in detail by one of the authors in recent years [12]. For the regular diffusion equation with the travelling wave, self-similar, travelling profile, or with some generalized self-similar trial functions, numerous new types of analytic solutions were found. These solutions have a much more complicated structure than the well-known Gaussian (plus an error function in the most general case). These new solutions contain Kummer’s or Whittaker functions with quadratic arguments of a new free self-similar parameter which results in larger variety of the solutions. These solutions can have a drastically different rate of decay than the fundamental Gaussians. We derived solutions which have some oscillatory behavior with a rapid power law decay both in space and time.
In this work, we convey new results for a modified version of PDE (1), which will have a reaction coefficient that is not a constant, but depends both on time and space, which is the most important novelty of this work.
Equation (1) and other equations of a similar nature are sometimes solved by analytical and semi-analytical methods such as residual power series method [13] and optimal variational iteration method [14,15]. However, the most common way of solution is numerical integration [16], and numerous techniques have been put forth for this. Most of them fall into one of two categories: explicit schemes or implicit schemes. In comparison to one another, both types have a significant benefit and a disadvantage. The widely used explicit approaches, such as those based on explicit Runge–Kutta time integration, execute a time step in a reasonably short amount of time and are easily parallelizable. They have a restricted stability region [17] though, which means that if the time step size goes over the so-called CFL (Courant–Friedrichs–Lewy) limit, the solution is anticipated to grow indefinitely.
Since the implicit methods’ stability is inherently greater, many scientists consider them to be superior and frequently employ them for these and other related equations. For example, Mbroh and Munyakazi [18] solved one and two space-dimensional singularly perturbed reaction–diffusion problems by discretization of the space variable using a fitted operator finite difference method and then using the Crank–Nicolson scheme with Richardson extrapolation. Ndou et al. [19] combined the proper orthogonal decomposition method with the unconditionally positive finite difference (UPFD) algorithms to effectively solve linear and nonlinear advection–diffusion–reaction equations. Kumar et al. [20] employed the open-source package FEniCSx which uses a preconditioned Krylov subspace method to simulate heat transfer in a three-dimensional bracket. Jiang and Zhang [21] solved semilinear and fully nonlinear advection–diffusion–reaction equations by Krylov implicit integration factor methods, but the linear part of the system was exactly integrated. Heidari et al. [22] utilized a Legendre–Gauss–Lobatto spectral collocation method to solve a general diffusion–reaction equation. Kolev et al. [23] proposed a numerical method that preserves the nonnegative property of the variable of the solutions of a diffusion–reaction equation–system. Their method also applies implicit time discretization. In the case of the implicit methods, it is necessary to solve a set of algebraic equations in each time step, which is a difficult operation to parallelize. Large amounts of RAM are involved, and the calculations can be extremely slow. This occurs frequently in multidimensional space when the matrix is an enormous and non-tridiagonal but sparse matrix, but its inverse is a dense matrix. So, in practice, not direct but iterative procedures are used for solving the equation system, about which we will write more in the appropriate section later.
Semi-explicit or semi-implicit methods, which can be considered as combinations of the explicit and the implicit approach, can be quite effective as well. Beuken et al. [24] constructed versions of these methods based on the backward differentiation formula and Adams–Bashforth schemes for ODE systems, which can be an order of magnitude faster than some traditional methods. Fedoseev et al. [25] improved the performance of semi-implicit composition integration methods by variable step size control algorithms. The paper of Ji and Xing [26] proposes a set of time-marching methods which uses the generalized Padé approximation, the Gauss–Legendre quadrature, and explicit Runge–Kutta schemes to solve systems of ODEs. All of these can be applied to PDEs such as (1) after semi-discretization. Settanni and Sgura [27] solved a Lotka–Volterra type system of 2D reaction–diffusion equations by treating the diffusion part implicitly and the reaction part by some well-known explicit schemes as well as the alternating direction implicit (ADI) methods. Yadav et al. [28] recently developed new IMEX RK-type time-integrating methods for solving stiff convection–diffusion–reaction systems, where the diffusion and the reaction terms are treated implicitly. However, we think none of these methods overcome the problems of the explicit and implicit methods mentioned above. Recently, Essounge et al. demonstrated that explicit methods can be more than competitive compared to implicit ones even if the usage of small time step sizes are required [29].
Based on these facts, we have to agree with those scholars who invest their energy to create and examine explicit and unconditionally stable algorithms. For example, Chen-Charpentier and Kojouharov [30] proposed the so-called UPFD (unconditionally positive finite difference) scheme for the linear diffusion–advection–reaction equation. Later, Appadu [31], and recently, Savovic et al. [32] continue the examination of this algorithm. Pourghanbar et al. [33] used the alternating direction explicit (ADE) method of Saulyev type to solve a nonlinear PDE faster than the main implicit methods. Al-Bayati et al. [34] compared the performance of the ADE, the ADI, and the odd-even hopscotch methods to solve a system of diffusion–reaction equations. They found that the implicit method is more accurate but slower than the explicit methods.
Our research group has recently constructed several explicit methods for equations similar to (1). In our original publications, it was analytically shown that they are unconditionally stable for the linear diffusion or, in some cases, diffusion–reaction equation. The methods have been extensively tested in the case of the diffusion equation under circumstances where the diffusion coefficient is constant [35], depends on time [36], depends on space [37], or on both variables simultaneously [38]. In all cases, the novel algorithms proved to be very competitive when they are compared to the traditional methods, which were mostly explicit ones, and in a few cases, implicit “ode” solvers of MATLAB. One of the novelties from the numerical point of view is that now these novel methods are tested against the standard implicit method when the obtained algebraic system is solved by preconditioned conjugate gradient (PCG) as well as generalized minimal residual (GMRES) methods. The motivation of the paper from the numerical point of view is to compare the performance of these solvers and show that the traditional ones are far from being optimal to solve these problems, and the explicit and stable schemes can easily outperform them.
The structure of this paper is the following. We present the analytical solution of the equations for the different reaction function in Section 2. The discretization procedure and the used numerical algorithms are described in Section 3. The analytical solutions are reproduced by the methods and the numerical errors are examined in Section 4. Then, in Section 5, we take an application of heat transfer on a two-dimensional surface of two adjacent materials placed vertically, and the upper part of the body is exposed to constant heat convection and the lower part to variable heat convection with time. A conclusion section summarizes our findings at the end of the paper.

2. Analytical Solution

Let us study the one-dimensional diffusion–reaction equation given by:
u x , t t = D 2 u x , t x 2 + F ( x ,   t )   u ( x ,   t )
where F is the known coefficient of the reaction term, which is usually non-positive. To derive physically relevant solutions, we apply the travelling wave Ansatz:
u x , t = f ( x c t ) = f ( η )
where η is the reduced variable and f η is called the shape function. In this sense, we think that we can find solutions which have oscillatory behavior instead of the usual self-similar type diffusive and dispersive Gaussian-like solutions, which we derived in our former studies [12]. The first and second continuous derivatives of f η are supposed to exist with respect to η and denoted by primes. Of course, the form of F ( x ,   t ) has to be specified first. It is clear at the first moment that F ( x ,   t ) could be almost any function from the mathematical point of view. Considering physical arguments (e.g., F ( x ,   t ) is finite, or even goes to zero at infinite time and space coordinates, or F ( x ,   t ) has no singularities at any points), the possible forms of the F ( x ,   t ) are radically reduced. It is clear that if F ( x ,   t ) would go to infinity at large times or spatial coordinates that would mean an infinite driving term in the equation, which is far from physical reality. We tried numerous functions, e.g., Gaussian, exponential, and power law terms but found solutions only for the two terms shown in the following.
It is always interesting to study the influence of a well-localized impulse-like source; therefore, we tried the Lorenzian form and luckily found highly non-trivial solutions. As a second interesting system, the effect of periodic driving was investigated. It looked logical that for a traveling wave, Ansatz (capable of describing periodic or quasi-periodic solutions) applied to periodic driving gives reasonable periodic or quasi-periodic finite solutions. Our guess was confirmed, which is analyzed in the following.

2.1. Lorentzian Coefficient of the Reaction Term

First, we consider the following form for the F function:
F x , t = a 1 + x c t 2
where a is the strength parameter (amplitude) of the applied pulse. By utilizing the Ansatz (3), the reduced ODE is immediately obtained:
c   f η = D f η + a 1 + η 2 f η
The solution of this ODE is given by the MAPLE 12 software:
f η   = e c η 2 D 1 + η 2 c 1 HeunC 0 , 1 2 , 1 , c 2 16 D 2 , Ψ , η 2   +   c 2 η HeunC 0 , 1 2 , 1 , c 2 16 D 2 , Ψ , η 2   ,
where HeunC is the Heun function [39], and we introduced the abbreviation Ψ = 4 a D + 8 D 2 c 2 16 D 2 . More general technical details about the Heun’s function, together with other special functions, can be found in [39,40]. For additional specific information about Heun’s differential equation and on various Heun’s function, please consult [41,42]. It is almost impossible to give a complete parameter study of Equation (5) for the entire range of c 1 ,   c 2 ,   c ,   a ,   D . We just restrict us for the c 1 = 0 ,   c 2 = 1 ,   c > 0 ,   a > 0 ,   D > 0 subspace. Considering negative propagation velocity c < 0 just means reflecting the solution to the y-axis. For negative source strength a < 0 , we obtain non-decaying solutions at large η, which means either asymptotic saturation or divergence, which we consider unphysical. Diffusion processes where the concentration or the number of particles explode violate energy and matter conservation laws and it is rather counterintuitive that we obtain it typically for negative and not for positive values of a. So, although the solutions are mathematically valid for arbitrary values of the x and t variables, the solution on the whole real axis cannot always describe a real physical process. Nevertheless, the obtained functions—in principle—can describe real processes in any finite interval if the system boundaries are not closed, and energy or particles can enter from the surrounding space, which is reflected mathematically by the boundary conditions.
Numerous shape functions are presented in Figure 1 for different parameter sets. Smaller wave velocity shifts the singularity to the left and causes more oscillations (see the difference between the black and red curves in Figure 1). Increasing the diffusion coefficient D against the source strengths parameter a, but still being a > D smears out the decay range of the diffusion (compare the blue curve to the black one). Finally, considering that the diffusion parameter is larger than the source strength a < D , the oscillations disappear, maintaining a very flat local maximum and a very slow decay (compare the blue curve to the green one).
The x and t dependent solution of the reaction–diffusion PDE has the form of:
u x , t   = e c x c t 2 D 1 + x c t 2 c 1 HeunC 0 , 1 2 , 1 , c 2 16 D 2 , Ψ , x c t 2   +   c 2 x c t HeunC 0 , 1 2 , 1 , c 2 16 D 2 , Ψ , x c t 2  
We note that since our analytical solution is valid on the whole real axis, boundary conditions need to be specified only when the analytical solution is going to be reproduced by numerical methods. The time development of a solution function u x , t of Equation (6) is presented in Figure 2 for the same parameter set as the shape function is shown. We checked and found that all the solutions of u x , t for all the other three parameter sets given in Figure 1 have qualitatively the same shape.

2.2. Cosine Function as the Coefficient of the Reaction Term

For second case of investigation, we consider the following form for the F function:
F x , t = a cos x c t ,   a
As we mentioned above, periodic driving has always been a fundamental interest. By applying the travelling wave Ansatz (3) to transform the PDE (2), the following reduced ODE is immediately obtained.
c   f η = D f η + a cos η f η
The solution of this ODE is also given by the MAPLE 12 software:
f η   = e c η 2 D c 1 MathieuC c 2 D 2 , 2 a D , η 2   +   c 2 MathieuS c 2 D 2 , 2 a D , η 2   ,
where MathieuC and MathieuS are the Mathieu functions. General information about the mathematical properties of these functions can be found in [39]. More detailed analysis, however, is given in the monographs of [43,44,45,46].
To investigate the parameter dependence of the Mathieu functions, we have to follow a different strategy. It is well known from the theory of Mathieu functions that depending on the ratio of the first and second parameters, different regimes exist for the solutions. In the unstable regime, the Mathieu functions are not normalizable; therefore, they can go to infinity. In the stable regime, the function remains finite and can be normalized, which means that the integral of the function has a finite value.
Figure 3 presents the stability diagram of the Mathieu S function for η = 1 and for c = 1. The presented contour plot was evaluated with Wolfram Mathematica 12 software package. We applied the 0 a 5 and 0 D 10 parameter regime to present the stability regime of the solution which contains the Mathieu S function. In the colored regime, the function is normalizable and has no singularities. In the white regime, the function is singular. We mention that the stability chart of the Mathieu functions (without the Gaussian function) has a completely different shape: some parts are similar to the tulip flower; for figure see [39] (28.17.1.).
The solution of the PDE is:
u x , t   = e c x c t 2 D c 1 MathieuC c 2 D 2 , 2 a D , x c t 2 +   c 2 MathieuS c 2 D 2 , 2 a D , x c t 2  
In Figure 4, we present the 3D plot of this u x , t function for the parameter set for the parameters of c 1 = 0 ,   c 2 = 1 ,   c = 1 ,   D = 6 ,   a = 2 . The Mathieu C functions look globally very similar. We present the function for positive spatial and temporal coordinates. The asymptotic decay for zero at large arguments is clear to see. A similar solution will be reproduced numerically in the latter sections. The global properties of the solution remain similar to the shape function.

3. Numerical Solution Preliminaries for Materially Homogeneous and Inhomogeneous Systems

3.1. Discretization and Boundary Conditions for a 1D System

The time variable is uniformly discretized, which means t t 0 ,   t fin , and
t n = t 0 + n h   ,   n = 1 , ,   T   ,   h T = t fin t 0
An equidistant spatial grid is constructed on the interval x x 0   ,     x N = x 0 + L :
x j = x 0 + j Δ x   ,   j = 0 , ,   N   ,   N Δ x = L
The concrete space and time domain will be given when the case studies are presented.
After the application of the most frequent central difference formula for the space derivative in Equation (2), we obtain an ODE system for the node variables:
d u i d t = D u i 1 2 u i + u i + 1 Δ x 2 + F i n   u i
where F i n = F x i ,     t n . This can obviously be written into a matrix form:
d u d t = M u
where the matrix M of the system is N × N dimensional and depends on time through its diagonal elements.
In the next section, where the above given analytical solutions are reproduced, prescribed Dirichlet boundary conditions (calculated using the analytical solutions) are taken into account everywhere.

3.2. The Used Numerical Methods

It is widely known that for the general first order ODE y = f t , y , the theta method has the formula:
y n + 1 = y n + 1 + Δ t θ f t n , y n + 1 θ f t n + 1 , y n + 1
where θ 0 ,   1 θ 0 , 1 . In the case of Equation (10), it yields:
u i n + 1 = u i n + θ r u i ± 1 n 2 u i n + h F i n u i n + 1 θ r u i ± 1 n + 1 2 u i n + 1 + h F i n + 1 u i n + 1
where u i ± 1 n = u i + 1 n + u i 1 n and r = D h Δ x 2 is the well-known mesh ratio. This is clearly an implicit method if θ < 1 . By the so-called pseudo-implicit trick, we make it explicit: the neighbors u i ± 1 n in the second term at the right-hand side of (13) is taken into account at the old (n-th) time level. Using this, we obtain:
u i n + 1 = u i n + r u i ± 1 n + θ 2 r + h F i n u i n + 1 θ 2 r + h F i n + 1 u i n + 1
which may easily be rearranged as
u i n + 1 = 1 θ 2 r h F i n u i n + r u i ± 1 n 1 + 1 θ 2 r h F i n + 1
Note that the ui variable in both the conduction and convection term is considered at the old and the new time levels as well.
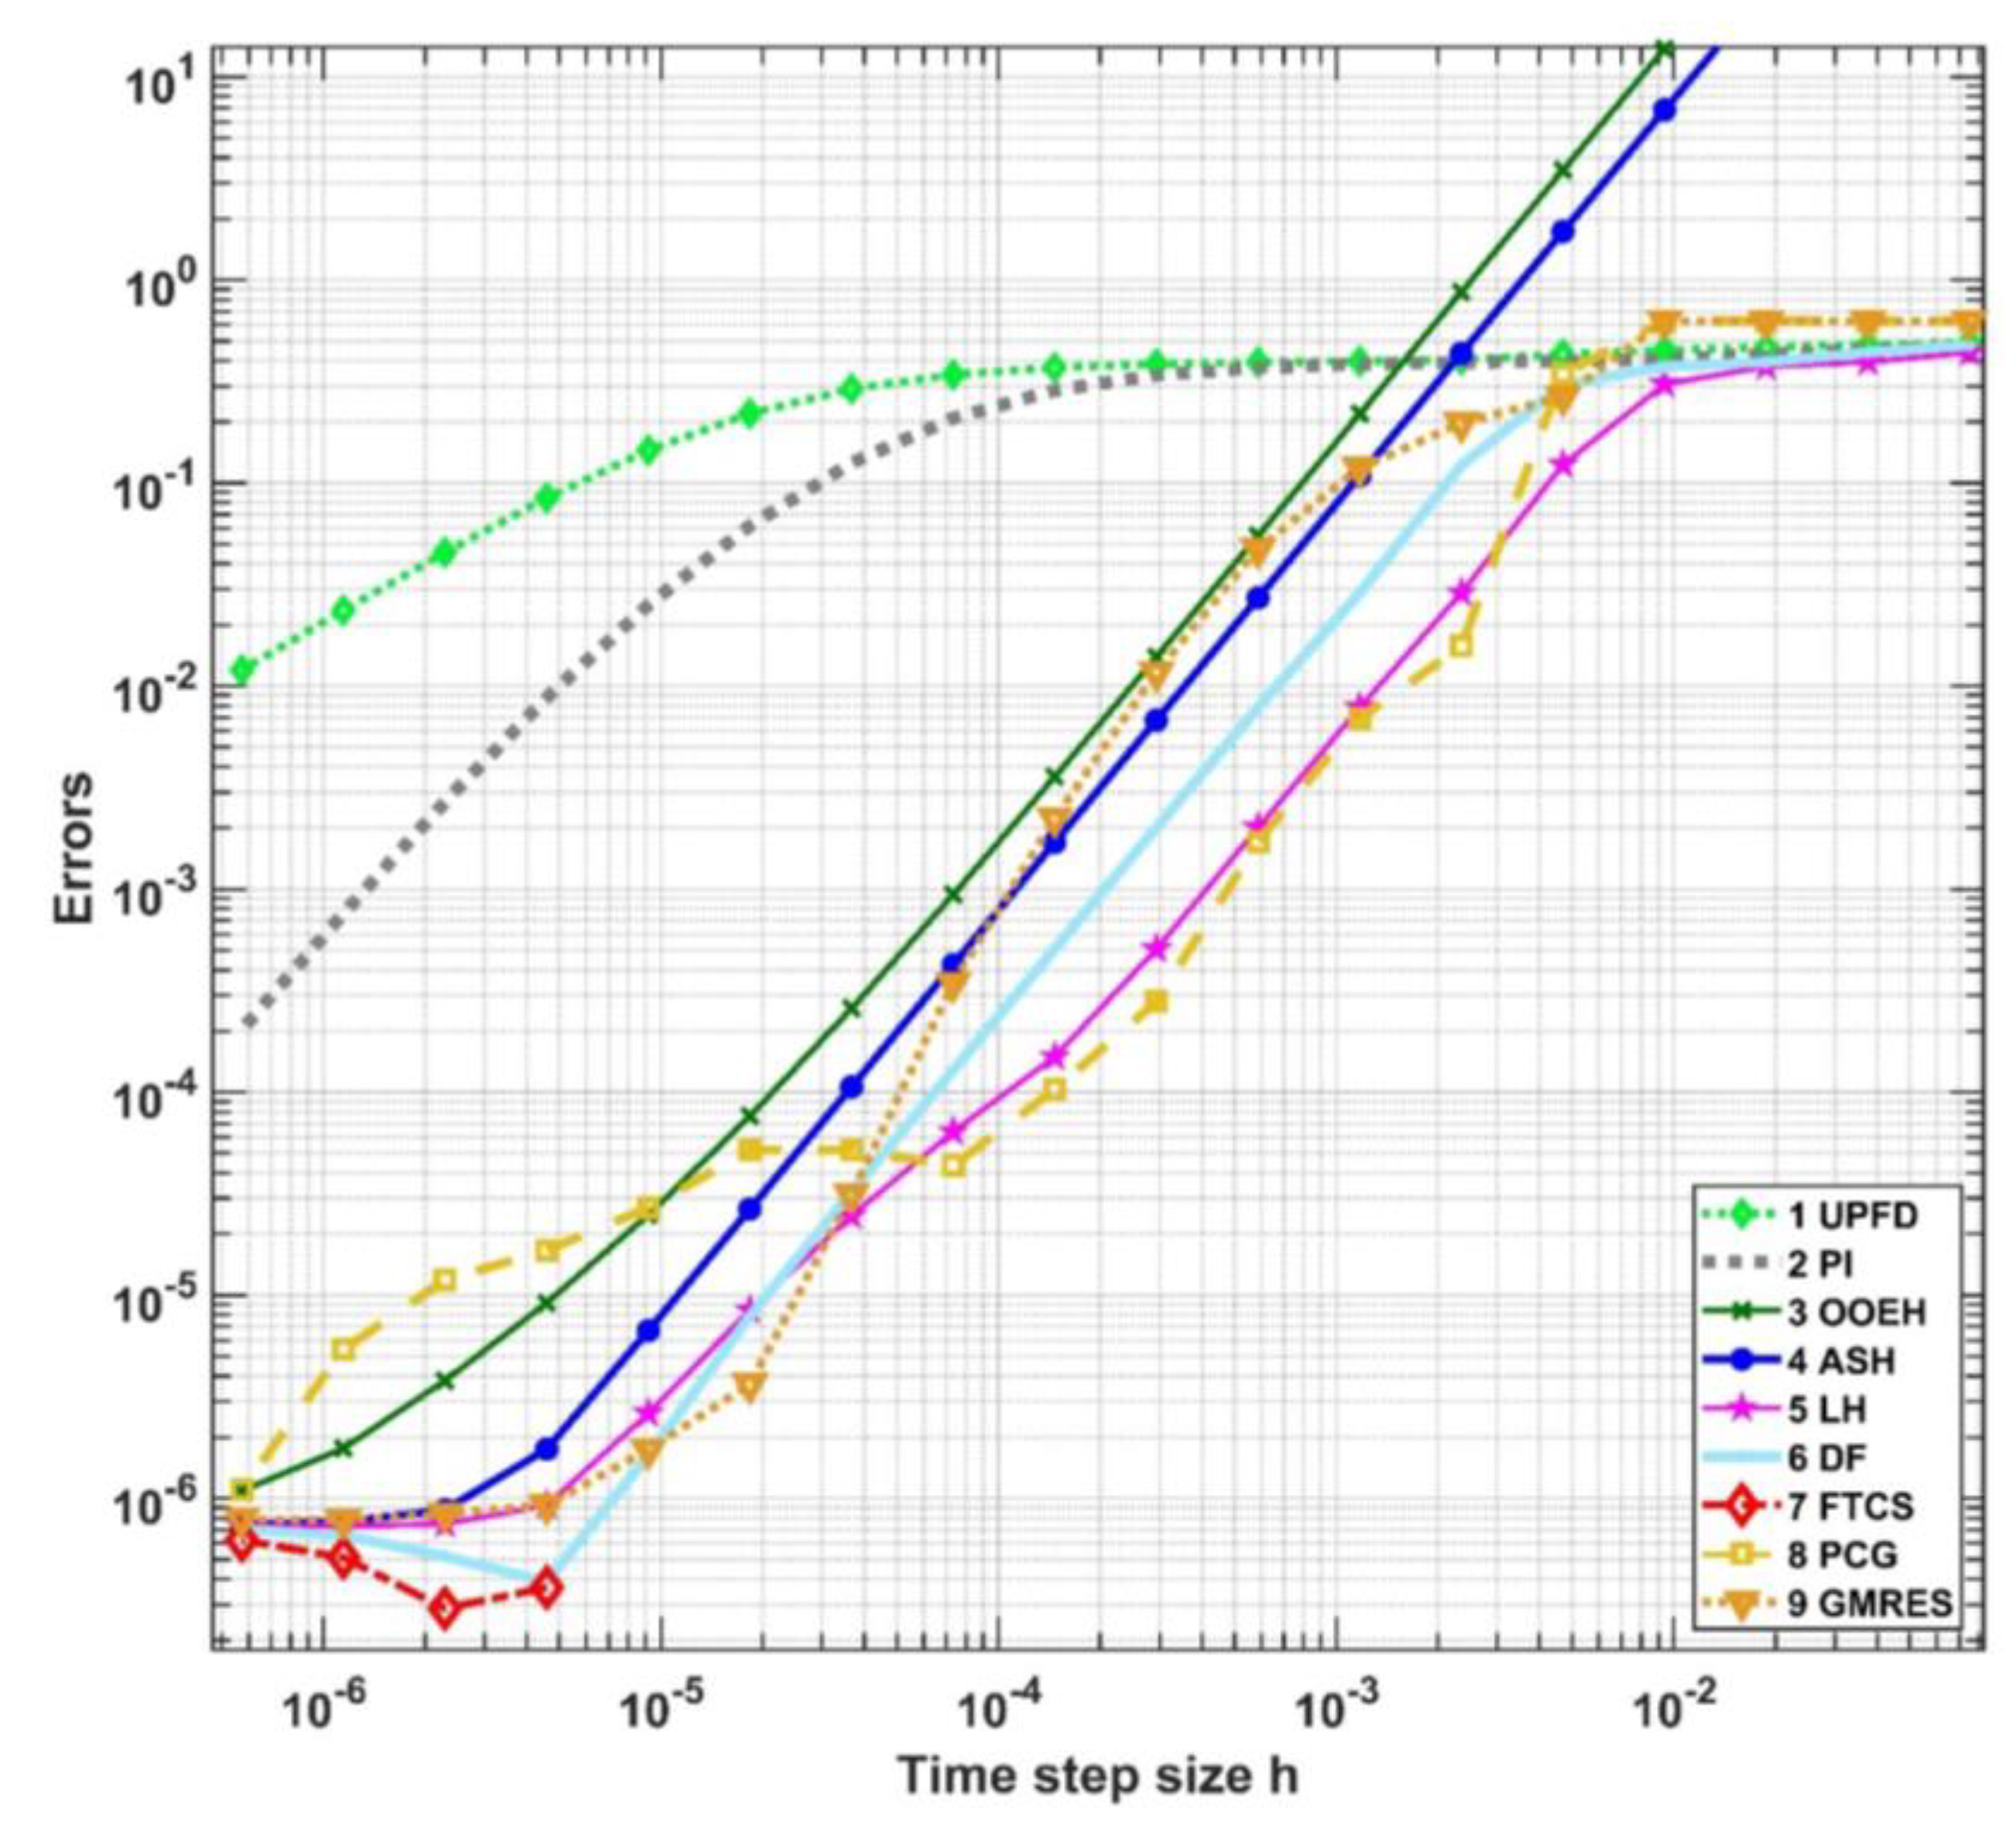
  • The simplest scheme used here is the so-called unconditionally positive finite difference (UPFD) formula, which is introduced for the linear diffusion–advection–reaction equation by Chen-Charpentier and Kojouharov [30]. Now the advection term is missing; thus, the new values of the cell variables can be obtained from Equation (15) by the θ = 0 substitution.
  • The next scheme we consider is the so-called pseudo-implicit (PI) method. Its two stages apply a modified version of formula (15) with different parameters. The first stage takes a half time step with θ 1 = 0 ; then, the second stage corresponds to a full time step with θ 2 = 1 2 which uses the results of the first stage as follows:
    Stage 1 :   u i pred = u i n + r u i ± 1 n / 2 1 + r h F i n + 1 / 2 ,   Stage 2 :   u i n + 1 = 1 r u i n + r u i ± 1 pred h u i pred u i n F i n 1 + r h F i n + 1
The application of the odd–even-type hopscotch schemes requires a special checkerboard-like space grid, in which the immediate neighbors of the so-called odd nodes are even and vice versa. In this work, three different structures are applied, see Figure 5, where only one odd and one even node is shown. The time elapses from top to bottom, and colored rectangles symbolize the stages. One exact repeating unit is surrounded by a blue dashed line for each case. In each stage, Formula (15) is employed, where the most up-to-date values of the neighbors u i ± 1 is used when the new value of ui is calculated.
3.
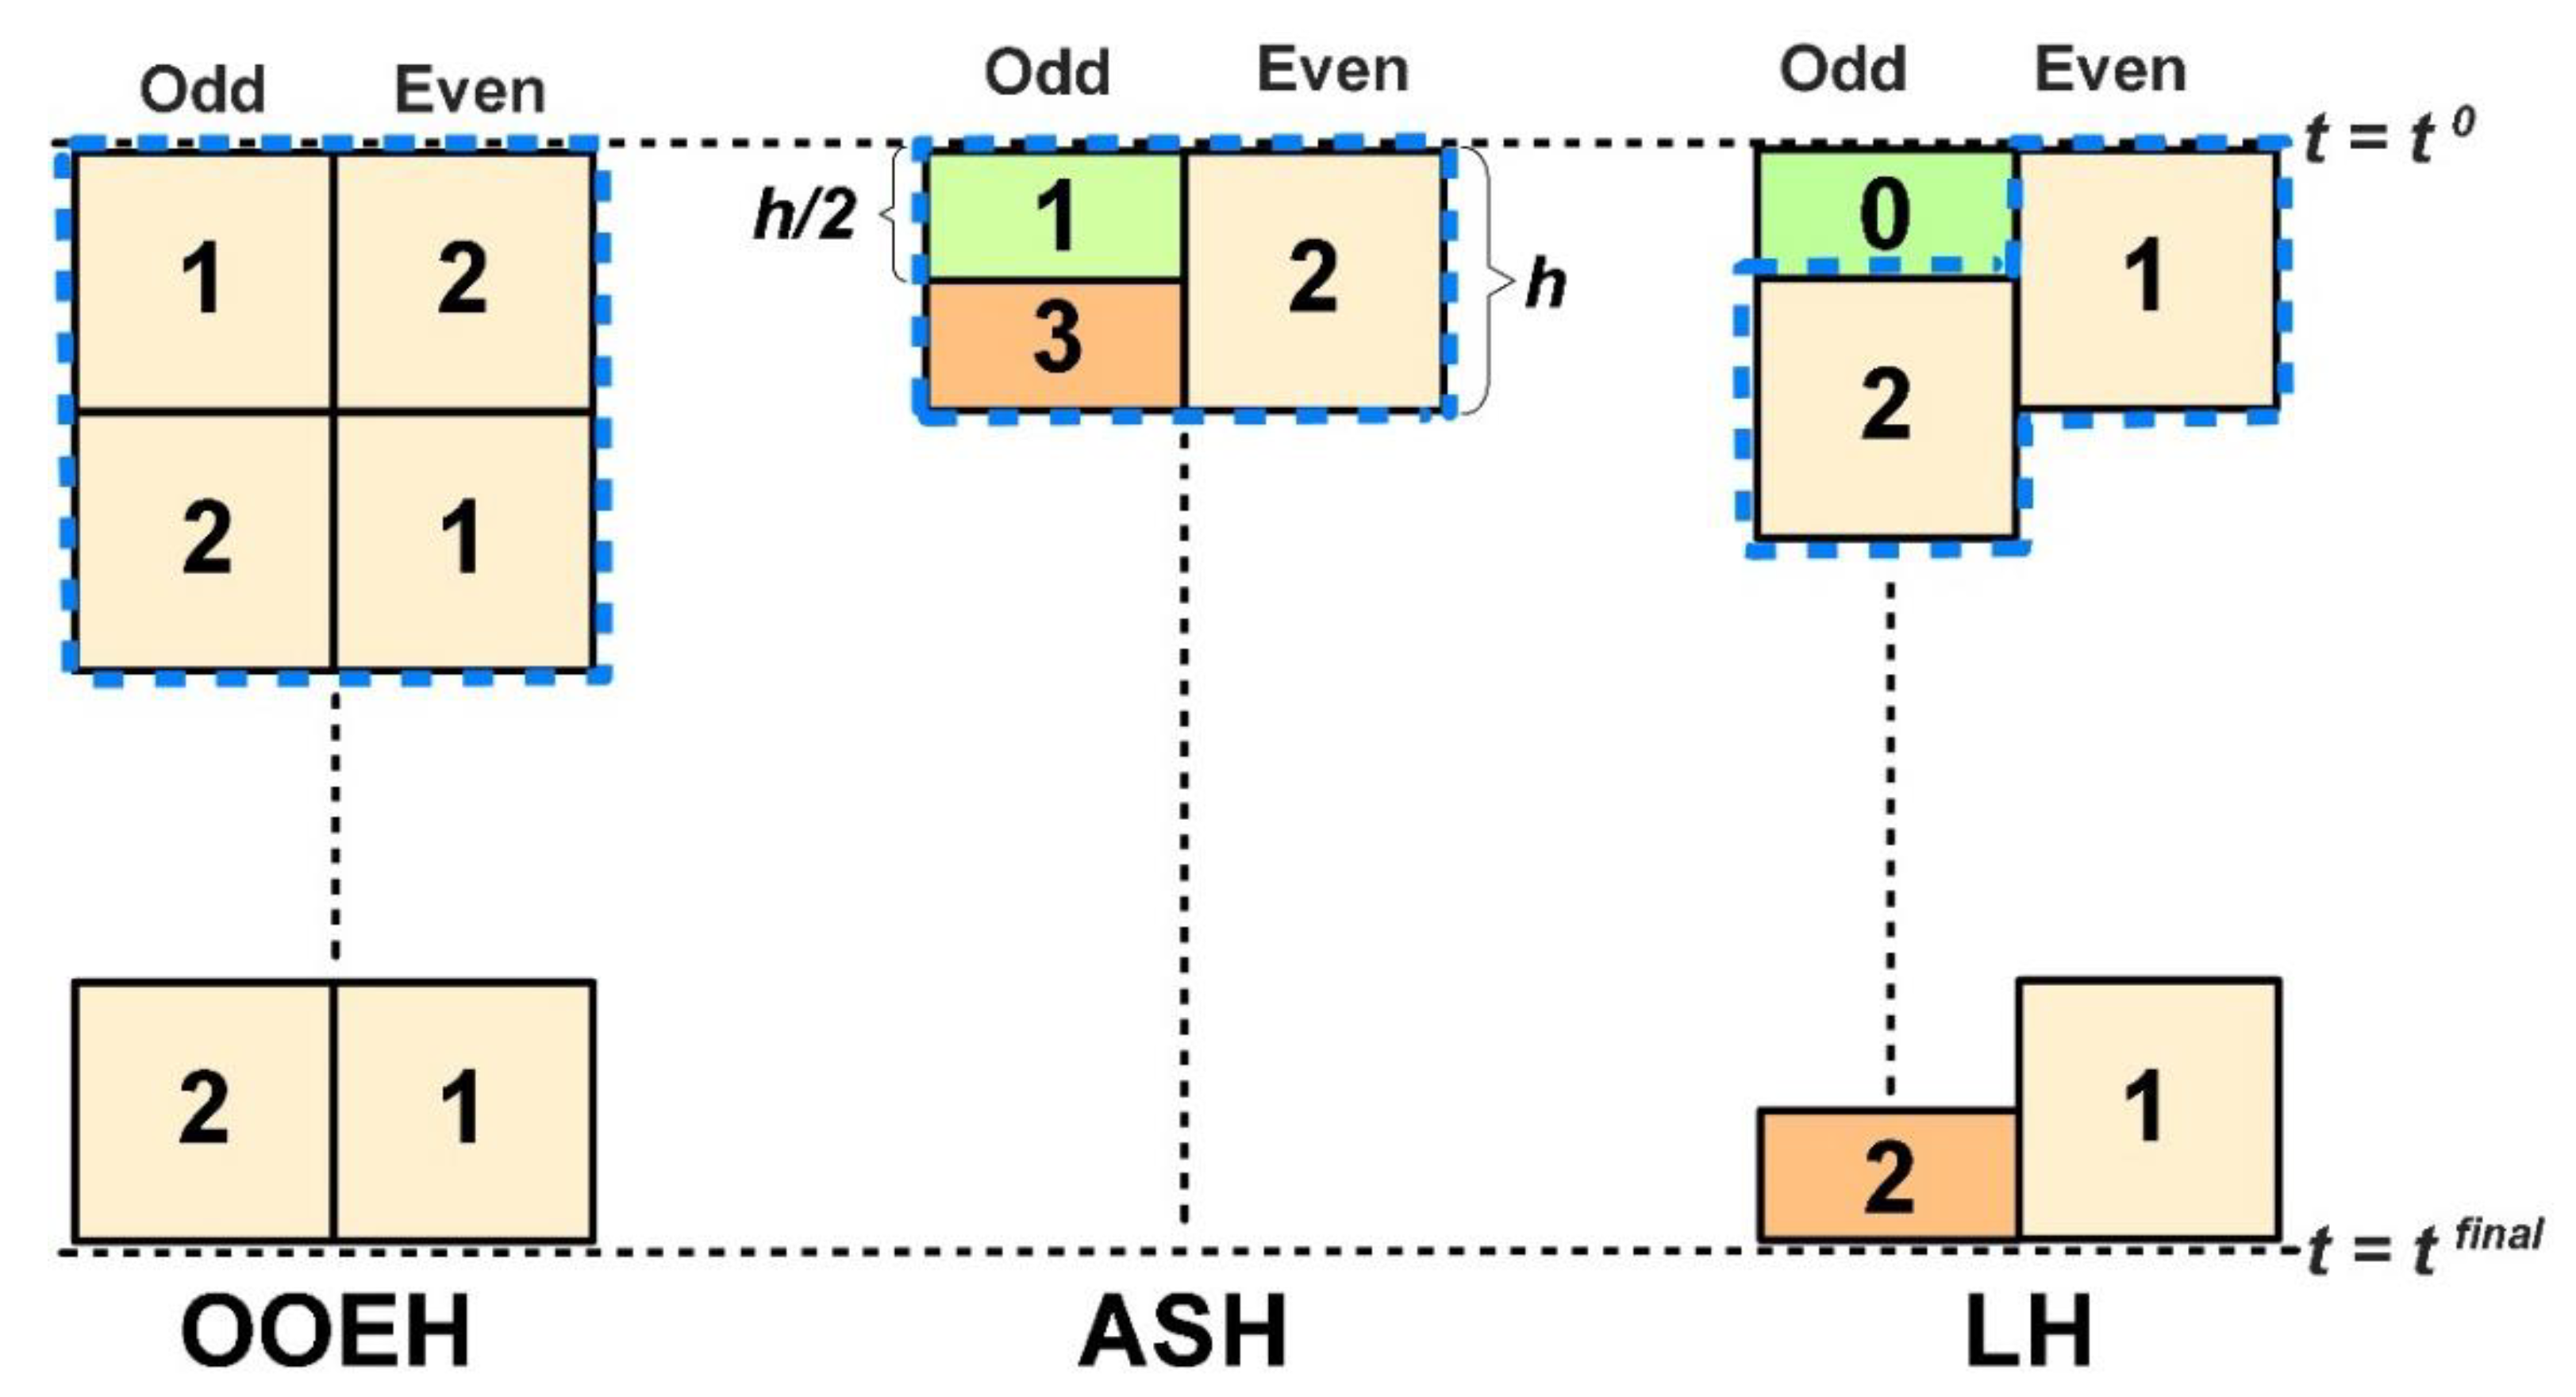
The original version of the odd–even hopscotch method ([47], denoted here by OOEH) uses only integer time steps with θ = 1 in the first and θ = 0 in the second stage.
4.
In the asymmetric-hopscotch (ASH) scheme, the repeating unit consists of two half and one full-size stages. First, a half-sized time step (light green rectangle with the number ‘1′) is taken for the odd nodes with θ = 0 , and then a full-length step for the even nodes (light orange rectangle) using θ = 1 2 , and finally a halved third stage (dark orange box) closes the calculation with θ = 1 .
5.
The leapfrog-hopscotch (LH) algorithm starts with Stage 0 (not repeated, green box), which uses θ = 0 . The intermediate stages as well as the last stage (light and dark orange boxes) uses θ = 1 2 .
6.
The Dufort–Frankel (DF) algorithm [48] (p. 313) is an old but non-conventional method. In our case, it employs the following formula:
u i n + 1 = 1 2 r u i n 1 + 2 r u i ± 1 n 1 + 2 r 2 h F i n + 1
As one can see, the r. h. s. of the formula contains u i n 1 , so it is a two-step method, which means it is not self-starter. The first time step has to be made by another algorithm for which we use the UPFD method. In the original DF method, the reaction term was not present. Here, we take it into account at the new time level, thus it appears in the denominator.
7.
The FTCS (forward-time central-space) scheme, which is built on the explicit Euler discretization, can be obtained from (13) by the θ = 1 substitution.
8.
The standard implicit scheme, which is built on the implicit Euler discretization, is obtained from (13) by the θ = 0 substitution. This yields an algebraic equation system with N unknowns, which can be solved in many ways. First, we solve it with the preconditioned conjugate gradient (PCG) method [49] which has been implemented by the built-in routine of MATLAB called pcg. The conjugate gradient method is a non-classical iterative method which can be used for solving linear equation systems with symmetric, positive definite coefficient matrix. In general, the conjugate gradient method yields high accuracy numerical solutions in the so-called A-norm. However, the convergence rate strongly depends on the spectral features of the coefficient matrix, thus it can be very slow for stiff problems. Hence, one can apply preconditioning, i.e., transforming the linear equation system into another linear equation system which is equivalent in the sense that it has the same solution, but it has more favorable spectral features. As a consequence, one loses some accuracy but can reach more favorable convergence rates.
9.
Finally, the above-mentioned algebraic system is solved by GMRES (generalized minimal residual) method [50,51]. It is a non-classical iteration method for solving linear systems of equations which are not necessarily symmetric. The essence of the method is to find an approximate solution of linear equation system, which is the most accurate approximation in the Euclidean norm if we consider a Krylov subspace with a given rank. The GMRES method has been implemented in the gmres built-in routine of MATLAB.
The PI, ASH, and LH methods were invented by our research group; thus, their description with more details can be found in our original publications. The PI was directly constructed for the diffusion–reaction equation, while the LH was optimized later [52] for this case. It is analytically proven that they are unconditionally stable if the reaction term is non-positive, and they have second-order temporal convergence. In the case of the ASH (as well as for the OOEH and DF, as far as we know), the unconditional stability (which is very rare for explicit methods) and the second-order convergence are proven only for the diffusion equation. On the other hand, the FTCS, the implicit, and the UPFD schemes have first-order convergence.

4. Verification of the Numerical Methods

The main task is to investigate the numerical error, most importantly how fast it decreases with the time step size h. We begin with a simulation for all of the nine methods, choosing a quite large and fixed h and registering the error, which is calculated as follows:
E r r o r = max 1 i < N u i analytic ( t fin ) u i num ( t fin )
This formula gives the usual L error, which is the maximum absolute difference at the final time t fin between the analytical and the numerical solution. Then, the time step size is divided by two subsequently while the simulation is repeated with the same parameters and settings until very small time step sizes are reached. The exception is the tolerance for the implicit methods, which always starts from 0.01 for the largest used time step size. Then, it is divided by 2.5 (3.2) in the case of the PCG (GMRES) solvers to keep the errors of the implicit discretization and that of the iterative solution comparable to optimize running time and accuracy at the same time.
The system matrix M has two parts: the reaction term gives only diagonal elements, while the diffusion term gives off diagonal ones as well. If the reaction is non-positive, M has only negative eigenvalues. If one denotes the eigenvalues with smallest (largest) absolute value by λ MIN λ MAX , then the CFL limit for the FTCS scheme can be exactly calculated as h CFL EE = 2 / λ MAX . Furthermore, the ratio λ MAX / λ MIN can be called the stiffness ratio of the problem.
The numerical calculations in this section are performed using the MATLAB R2018a software on a desktop computer with a DualCore Intel Pentium G3220, 3000 MHz CPU, 8 GB DDR3-1333 RAM. The analytical solutions and the boundary conditions containing the Mathieu or Heun functions are calculated by the Maple software and then imported to MATLAB. However, the values of the boundary conditions are supposed to be calculated for all time steps, which would consume much more time than performing the numerical time–integration algorithms for all the nodes of the mesh. We avoided these huge running times using a trick: the boundary values are calculated only in N t b time points, placed uniformly on the whole time interval. Then, linear interpolation using the pre-calculated boundary values at the two appropriate times in the vicinity of the actual time of the simulation is used to gain the values of the boundary conditions. It is always checked that this approximation yields a smaller error than the errors of the numerical methods around the middle of the space interval.

4.1. Case Study 1 with Small Value of Parameter a

In this numerical experiment, we use Equation (4) and the following parameters:
D = 1   ,     a = 0.1   ,   c = 1.4   ,   c 1 = 0.8763   , c 2 = 0.6572   ,   N x = 2000   , x 0 = 2 ,   Δ x = 0.005   , N t b = 2000 , t 0 = 1   ,   t fin = 3  
Since the contribution of the time-dependent term to the matrix elements are small, the CFL limit is only slightly changing and its value is approximately h C F L E E = 1.25 10 5 . The stiffness ratio is about 2 10 7 . The errors of the nine examined methods for decreasing time step sizes are shown in a log-log diagram in Figure 6. The minimum possible errors are determined by the (fixed) space discretization, see on the bottom left of the figure. We plot the analytical u function in Figure 7 at the initial and final time, as well as the numerical solution for the PCG and the LH solvers. We chose a time step size 0.002, for which the accuracy is more than acceptable in many engineering or biological applications.
One can see that the implicit methods roughly give the same error as the best explicit methods. However, their running time is usually more than three orders of magnitude larger than those of the explicit methods. The LH and DF methods can give a reasonable result in 0.1 s, while the implicit solvers need around 100 s. The explicit FTCS scheme is stable only below the CFL limit, and therefore only two points are presented at the bottom left side of the figure. To give a usable (actually very accurate) result, it needs about 20 s, which is still less than for the implicit methods. One can also see that the UPFD and the PI methods converge rather slowly. This is due to the fact [35] that their truncation errors contain more extra terms than those of the other methods.
The running times here are just examples. They will be measured more systematically in the next section, where realistic simulation of heat transfer in 2D will be conducted.

4.2. Case Study 2 with Large Value of Parameter a

In this numerical experiment, we use Equation (4) and the following parameters:
D = 1   ,   a = 5   ,   c = 1.9   ,   c 1 = 0.07987   , c 2 = 0.18153   ,   N x = 1000   , x 0 = 1 ,   Δ x = 0.004   , N t b = 2000 , t 0 = 1   ,   t fin = 1.6  
The CFL limit is slightly fluctuating around h C F L E E = 8 10 6 , while the stiffness ratio is increasing from 1.25 10 5 to 2.42 10 5 . The errors of the nine examined methods for decreasing time step sizes are shown in Figure 8. The running times of the implicit solvers are 200–1100 times longer than for the explicit schemes for the same time step sizes.
We plot the analytical u function in Figure 9 at the initial and final time, as well as the numerical solution for the LH and the implicit-GMRES solvers. In case of the former, the time step size is 2.3 10 3 , the maximum error is 0.029, while the running time is 0.011 s. In case of the GMRES solver, the time step size is 5.86 10 4 , the tolerance is 2.9 10 6 , the error is 0.048, while the running time is 21.2 s. The first non-divergent run for FTCS scheme took 4.2 s, but it produced a very accurate solution.

4.3. Case Study 3 with the Cosine Reaction-Term

In this numerical experiment, we use Equation (7) and the following parameters:
D = 1   ,   a = 0.8   ,   c = 0.5   ,   c 1 = 0.98697   , c 2 = 0.78958   ,   N x = 500   , x 0 = 0 ,   Δ x = 0.02   , N t b = 200 , t 0 = 1   ,   t fin = 2
The CFL limit is h C F L E E = 2 10 4 , while the stiffness ratio cannot be calculated in the usual way since there are positive eigenvalues due to the reaction term. The errors of the nine examined methods for decreasing time step sizes are shown in Figure 10. The running times of the implicit solvers are usually 200–300 times longer than for the explicit schemes.
We plot the analytical u function in Figure 11 at the initial and final time, as well as the numerical solution for the LH and the implicit-GMRES solvers for time step size 0.02. In the case of the former, the maximum error is 0.0450, while the running time is 0.01 s. In the case of the PCG solver, the error is 0.0406, while the running time is 0.2 s. This running time is only 20 times larger than that of the LH scheme due to the crude tolerance (0.01), which was chosen to reach roughly the same accuracy. The first non-divergent run for the FTCS scheme took 0.1 s. One can see that the explicit and stable methods, especially the LH, are significantly faster than the traditional methods.
We have to note that this reaction function is positive at half of the evaluation points. The problem is that, as it was mentioned, the stability of the numerical schemes is proven only for non-positive reaction terms. One can see that the methods behave very well in the presented case. However, for increasing amplitude a of the reaction term, they gradually become unstable. We present this case study only as a demonstration that the proposed schemes can be very effective even in this case, but the thorough investigation of the stability of the schemes in the case of reaction terms which are not always negative is out of the scope of this paper.

5. Numerical Simulation of Surface Subjected to Wind

In this section, all the running times are measured on a desktop computer with an Intel Core i7-324 11700F (16 CPUs) and 64 GB RAM is used, while the program we used is MATLAB R2020b.

5.1. The Structure and the Materials of the Surface

In this section, we model a wall surface with dimensions of 1 m on the x and y axes and 0.1 m on the z axis. In Figure 12, a wall’s surface is examined. Half of the surface ( 0 < x < 0.5   m ) is made of brick and the other half ( 0.5   m < x < 1   m ) is made of insulation.
In Table 1, the material attributes are considered. These coefficients exhibit a sharp discontinuity when one material passes into the other. On the other hand, these coefficients are constant inside a material.

5.2. Mesh Construction

We assume that in the z direction there is no heat transfer and the physical properties do not change, thus we fix Δ z = 0.1 m . From the computational point of view, a two-dimensional issue is studied. The x and y coordinates fall within the unit interval, and uniform square cells are used. We created meshes with four different resolutions with Nx = (50, 70, 90, and 100) and Ny = (50, 70, 90, and 100) for the number of cells in the x-axes and in the z-axes; therefore, N = N x N y = 2500 ,   4900 ,   8100 ,   and   10,000 is the global number of cells.

5.3. Discretization and Boundary Conditions in Inhomogeneous Media

Our goal now is to present a step-by-step derivation of the general discretization of the above problem starting from a simple one-dimensional problem. If the material properties depend on space, but the number of space dimensions is still one, the following equation can be the starting point for heat conduction:
c x ρ x u t =   x k x u x
We discretize the function k, and at the same time the space derivatives in Equation (20) by the standard central difference formula to obtain:
  c ( x i ) ρ ( x i ) u t x i = 1 Δ x k x i + Δ x 2 u ( x i + Δ x ) u ( x i ) Δ x + k x i Δ x 2 u ( x i Δ x ) u ( x i ) Δ x     .
Equations (20) and (21) are based on the node picture, typically used by mathematicians. Instead of node variables, let us introduce cell variables to arrive at a resistance-capacitance-type model of heat conduction. It means that u i , c i , and ρ i is the approximation of the average temperature, specific heat, and density of cell i, by their value at the cell center. Furthermore, k i , i + 1 is the heat conductivity between cell i and its (right) neighbor, estimated by its value at the border of the cells. Now, the previous formula will have the form:
d u i d t = 1 c i ρ i Δ x k i , i + 1 u i + 1 u i Δ x + k i 1 , i u i 1 u i Δ x    
Let us now consider heat conduction in a thin rod with cross-section S, divided into cells only along its length. The volume and the heat capacity of the cell can be given as V = S Δ x and C i = c i ρ i V , respectively. On the other hand, the thermal resistance between two neighboring cell is estimated as R i ,   i + 1 Δ x / S k i ,   i + 1 . Now, the equation for the time derivative of the temperature of each cell in the rod is as follows:
d u i d t = u i 1 u i R i 1 , i C i + u i + 1 u i R i + 1 , i C i
At this point, we generalize this treatment into the case of a thin plate, laying in the x-y plane with thickness Δ z , which computationally is the two-dimensional problem we actually study. The heat capacity of the cells are C i = c i ρ i Δ x Δ z Δ y , while for thermal resistance in the x-axes, we use the formula R i , i + 1 Δ x k i , i + 1 S x , and S x = Δ y Δ z is the surface area perpendicular to x. Therefore, the x and y direction resistances in the surface simulation with non-homogenous material and uniform mesh can be expressed as
R i , i + 1 Δ x k i Δ z Δ y   and   R i , i + N x Δ y k i Δ x Δ z
respectively, where the cell labelled i + N x appears directly underneath the cell labelled i. The horizontal and vertical resistance between cells i and i + 1 will vary if the materials on the two sides of the cell border are different [54]:
R i , i + 1 Δ x 2 k i Δ y Δ z + Δ x 2 k i + 1 Δ y Δ z
and
R i , i + N x Δ y 2 k i Δ x Δ z + Δ y 2 k i , i + N x Δ x Δ z
As a generalization of Equation (23), one may construct the ODE system for the time derivative of the cell variables for a generic grid by using the above approximations, as follows:
d u i d t = j i u j u i R i , j C i + q i K u i
The term q arises because the temperature is not taken related to the ambient temperature u a , since the latter is changing. In that case, heat conduction can be taken into account as a term K u a u , where the ambient temperature u a does not depend on u, and thus K u a is considered as a heat source term q. The source term potentially includes other heat sources such as radiation or the Joule-heat due to electric currents.

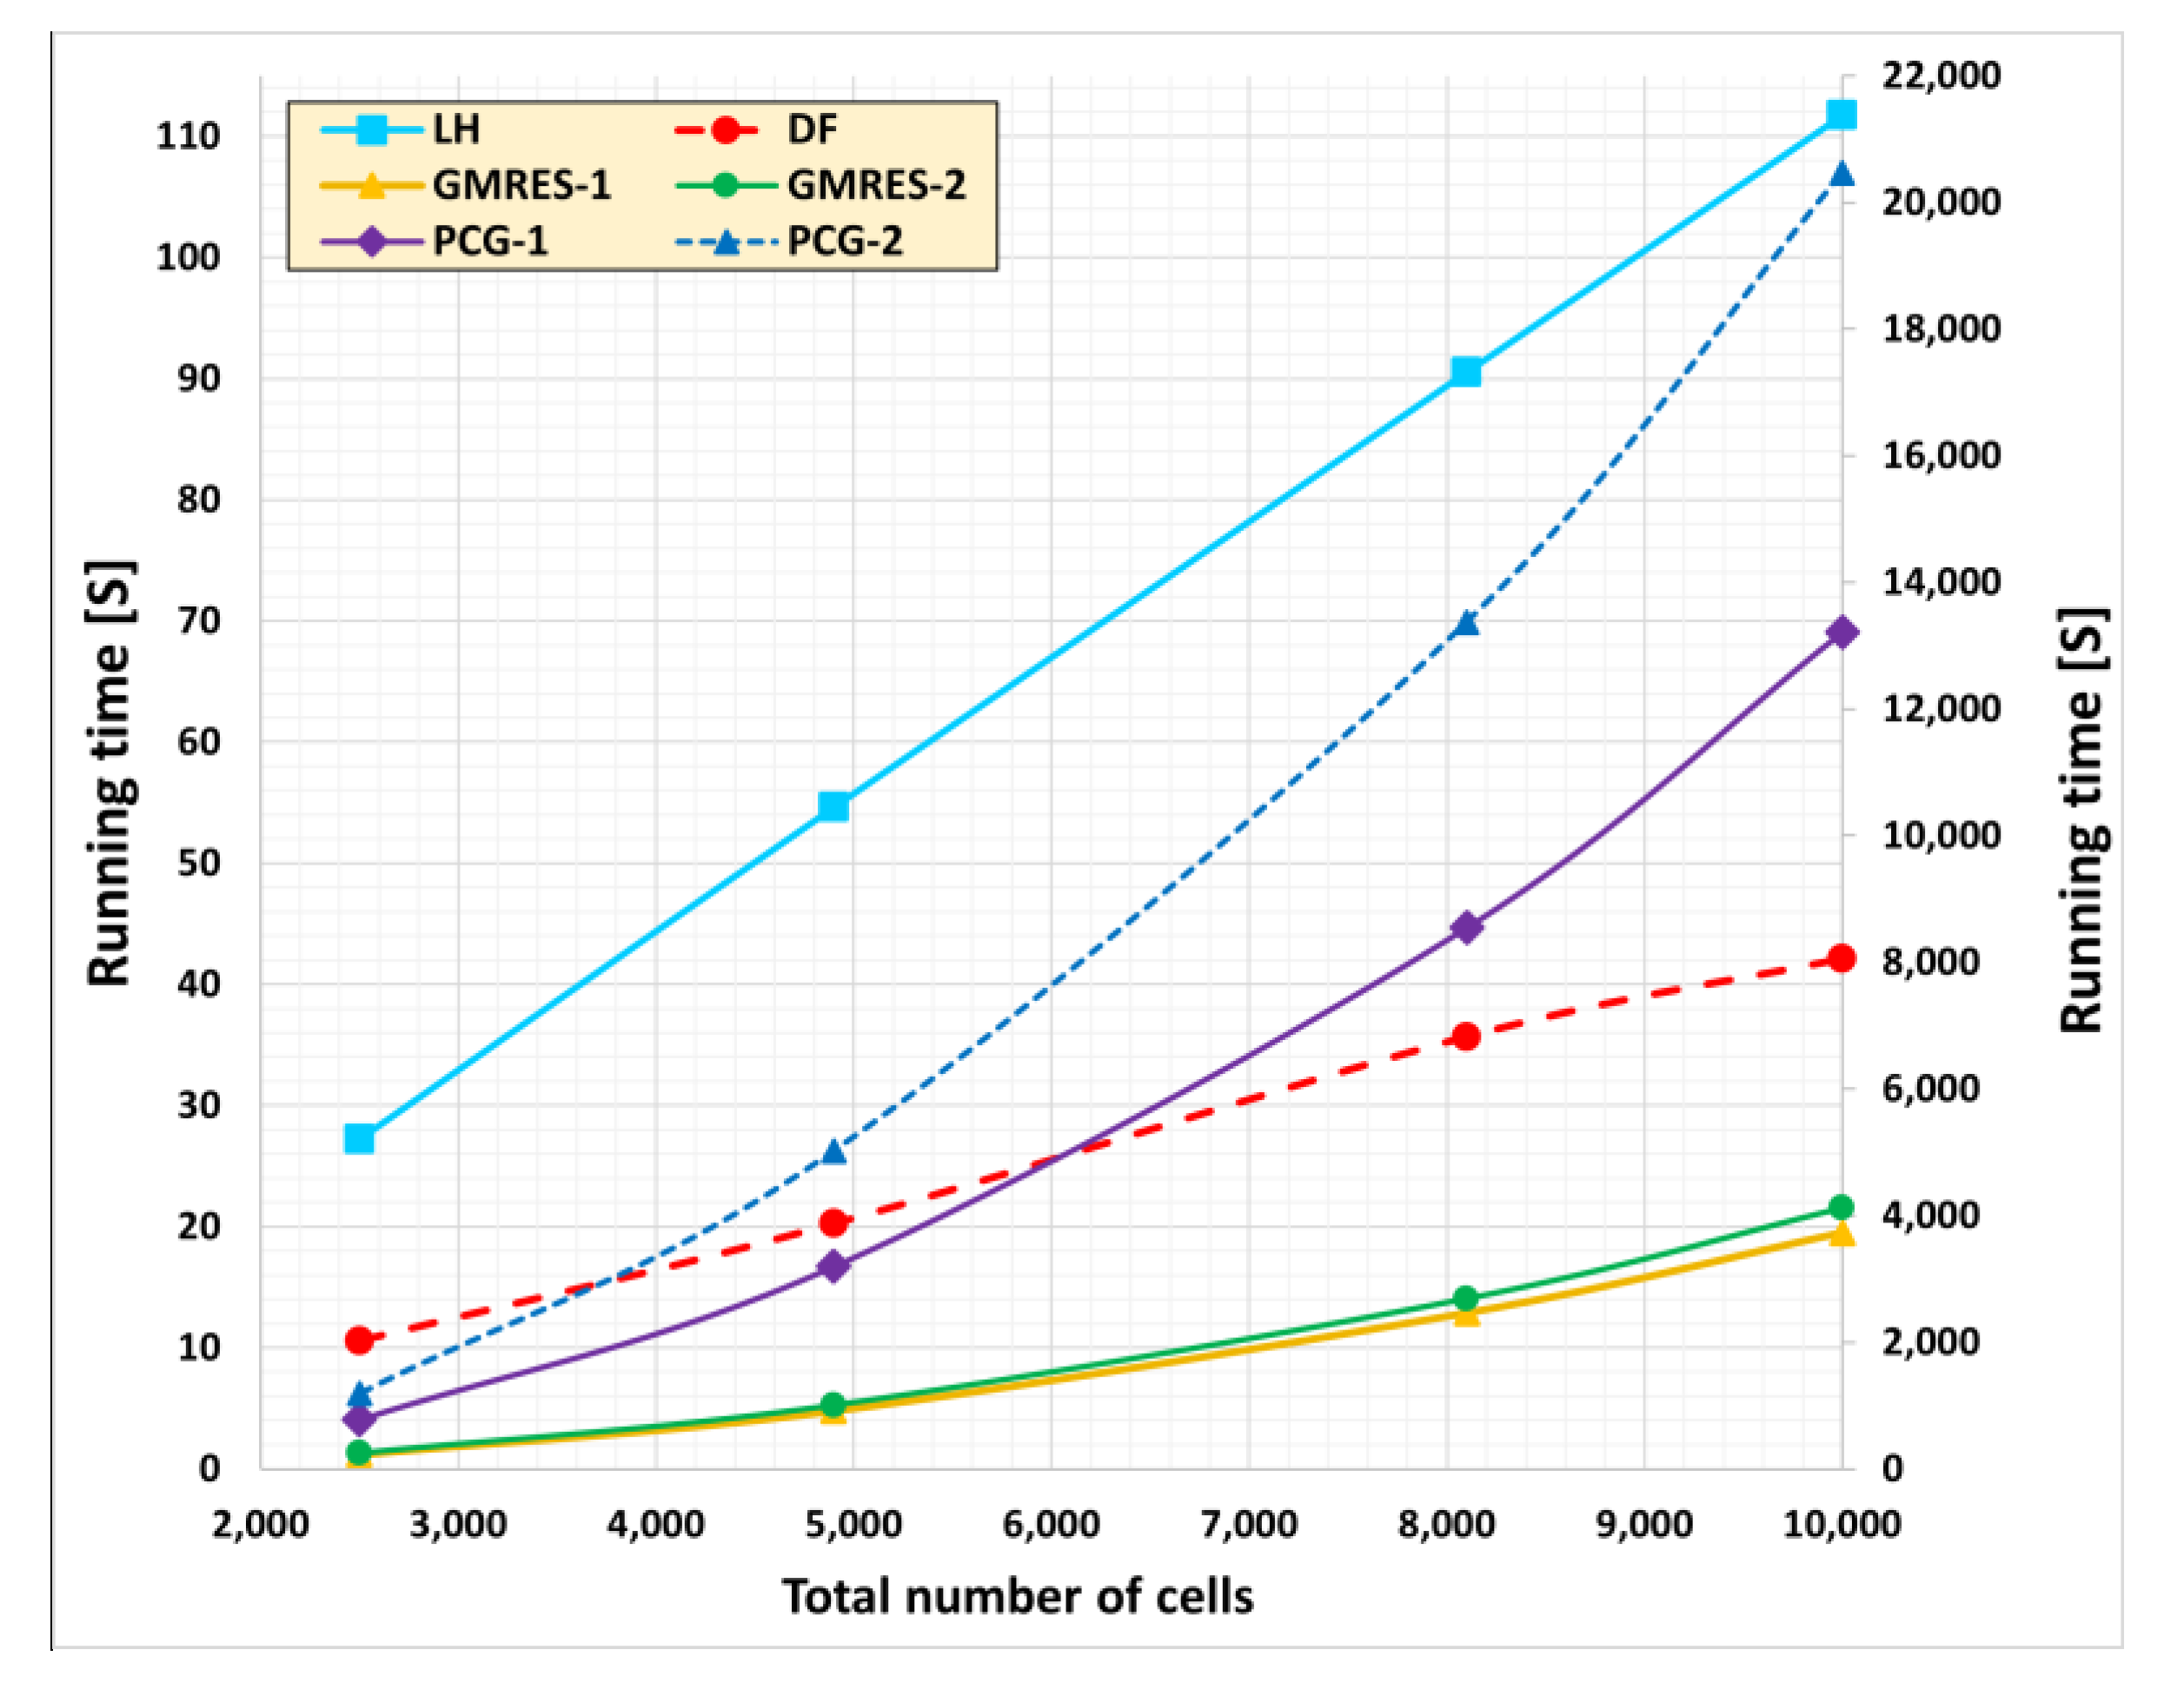
5.4. The Numerical Algorithms Used

The following two quantities will be used in the definition of the methods:
A i n = h j i u j n R i , j C i   + h q i ,   and   r i = h j i 1 R i , j C i ,   i = 1 ,   ,   N ,   n = 0 ,   ,   T
The quantity r is similar to the mesh-ratio r, introduced after Equation (13). The quantity A i n will transmit data to cell i from its surrounding ones. The two explicit methods we use here to solve Equation (27) are generalized via the following formulas.
1.
The leapfrog-hopscotch (LH) uses the generalized Theta-formula [55], which reads as follows for a full time step size:
u i n + 1 = 1 θ r i h K i n u i n + A i 1 + 1 θ r i h K i n + 1 ,   θ 0 ,     1
The length of the stages and the values of the parameter θ are the same as in the special case, see point 5 in Section 3.
2.
Dufort and Frankel (DF)
The initial stage applies the UPFD scheme, which can be obtained by the θ = 0 substitution from Equation (28). In all subsequent time steps, we employ the formula:
u i n + 1 = 1 r i u i n 1 + 2 A i n 1 + r i + 2 h K
The two implicit methods are also tested for the simulation of the wall. The standard implicit Euler discretization is applied to Equation (27) and then the obtained algebraic equation system is solved by the PCG and GMRES solvers.

5.5. The Initial and the Boundary Conditions

In this section, t fin = 22,500   s serves as the final time (the end of the examined time period). The duration of each time step is also expressed in seconds, first with h = 900 s, and it is decreased gradually to a small number (h = 0.01 s). A spatially constant initial temperature u x ,   y ,   t = 0 = 270   K is set. Neumann boundary conditions with a zero temperature-flux are applied to boundaries, preventing any conductive heat transfer:
u x ( x , y = 0 , t ) = u x ( x , y = 1 , t ) = u y ( x , y = 0 , t ) = u y ( x , y = 1 , t ) = 0
The desired insulating outcome is attained by setting the necessary resistances to infinity and the value of the matrix components indicating heat conduction over the boundary to zero.
Convective heat transfer occurs in the z-direction, which is perpendicular to the plane depicted in Figure 12. For the upper part ( 0 < y < 0.5   m ), the ambient temperature is taken to be constant, and for the lower part ( 0.5   m < y < 1   m ), the convection circumstances are changing with time according to changing weather conditions.
Table 2 shows that the z-direction convection coefficients ( h c ) and the temperature in the upper part of the plane in Figure 12 has constant values, whereas the lower part of the elements has changing values depending on the environmental conditions. The ambient air temperature and velocity is taken to be 17   ° C 290   K and v = 0   m / s for the upper part, and changing according to real weather conditions in Miskolc city from 5 a.m. to 11 p.m. on the second day of January [56] for the lower part, as shown in Table 2.
We obtain the values of the coefficients in our Equation (27) as follows [53]:
K = h c c ρ Δ z   ,   q = h c c ρ Δ z u a
We also supposed that the upper elements and lower elements have heat sources as follows:
  • For the upper elements: q u p = h c u p c ρ Δ z × u a
  • For the lower elements: q l o w l ( t ) = h c l o w ( t ) c ρ Δ z × u a l o w ( t ) ,
  • where K t = h c l o w t c ρ Δ z   ,   q i t = h c l o w ( t ) c ρ Δ z u l o w t .
The convection heat transfer coefficient for outside elements as a function of air velocity is estimated as follows [57]:
h c l o w ( t ) = 0.6 + 6.64 v ( t )  
  • v t : the air velocity is taken for each 900 s in [m/s].
  • u u p : the upper-side air temperature 295 [°K].
  • u l o w l t : the lower air temperature for each 900 s in [°K].

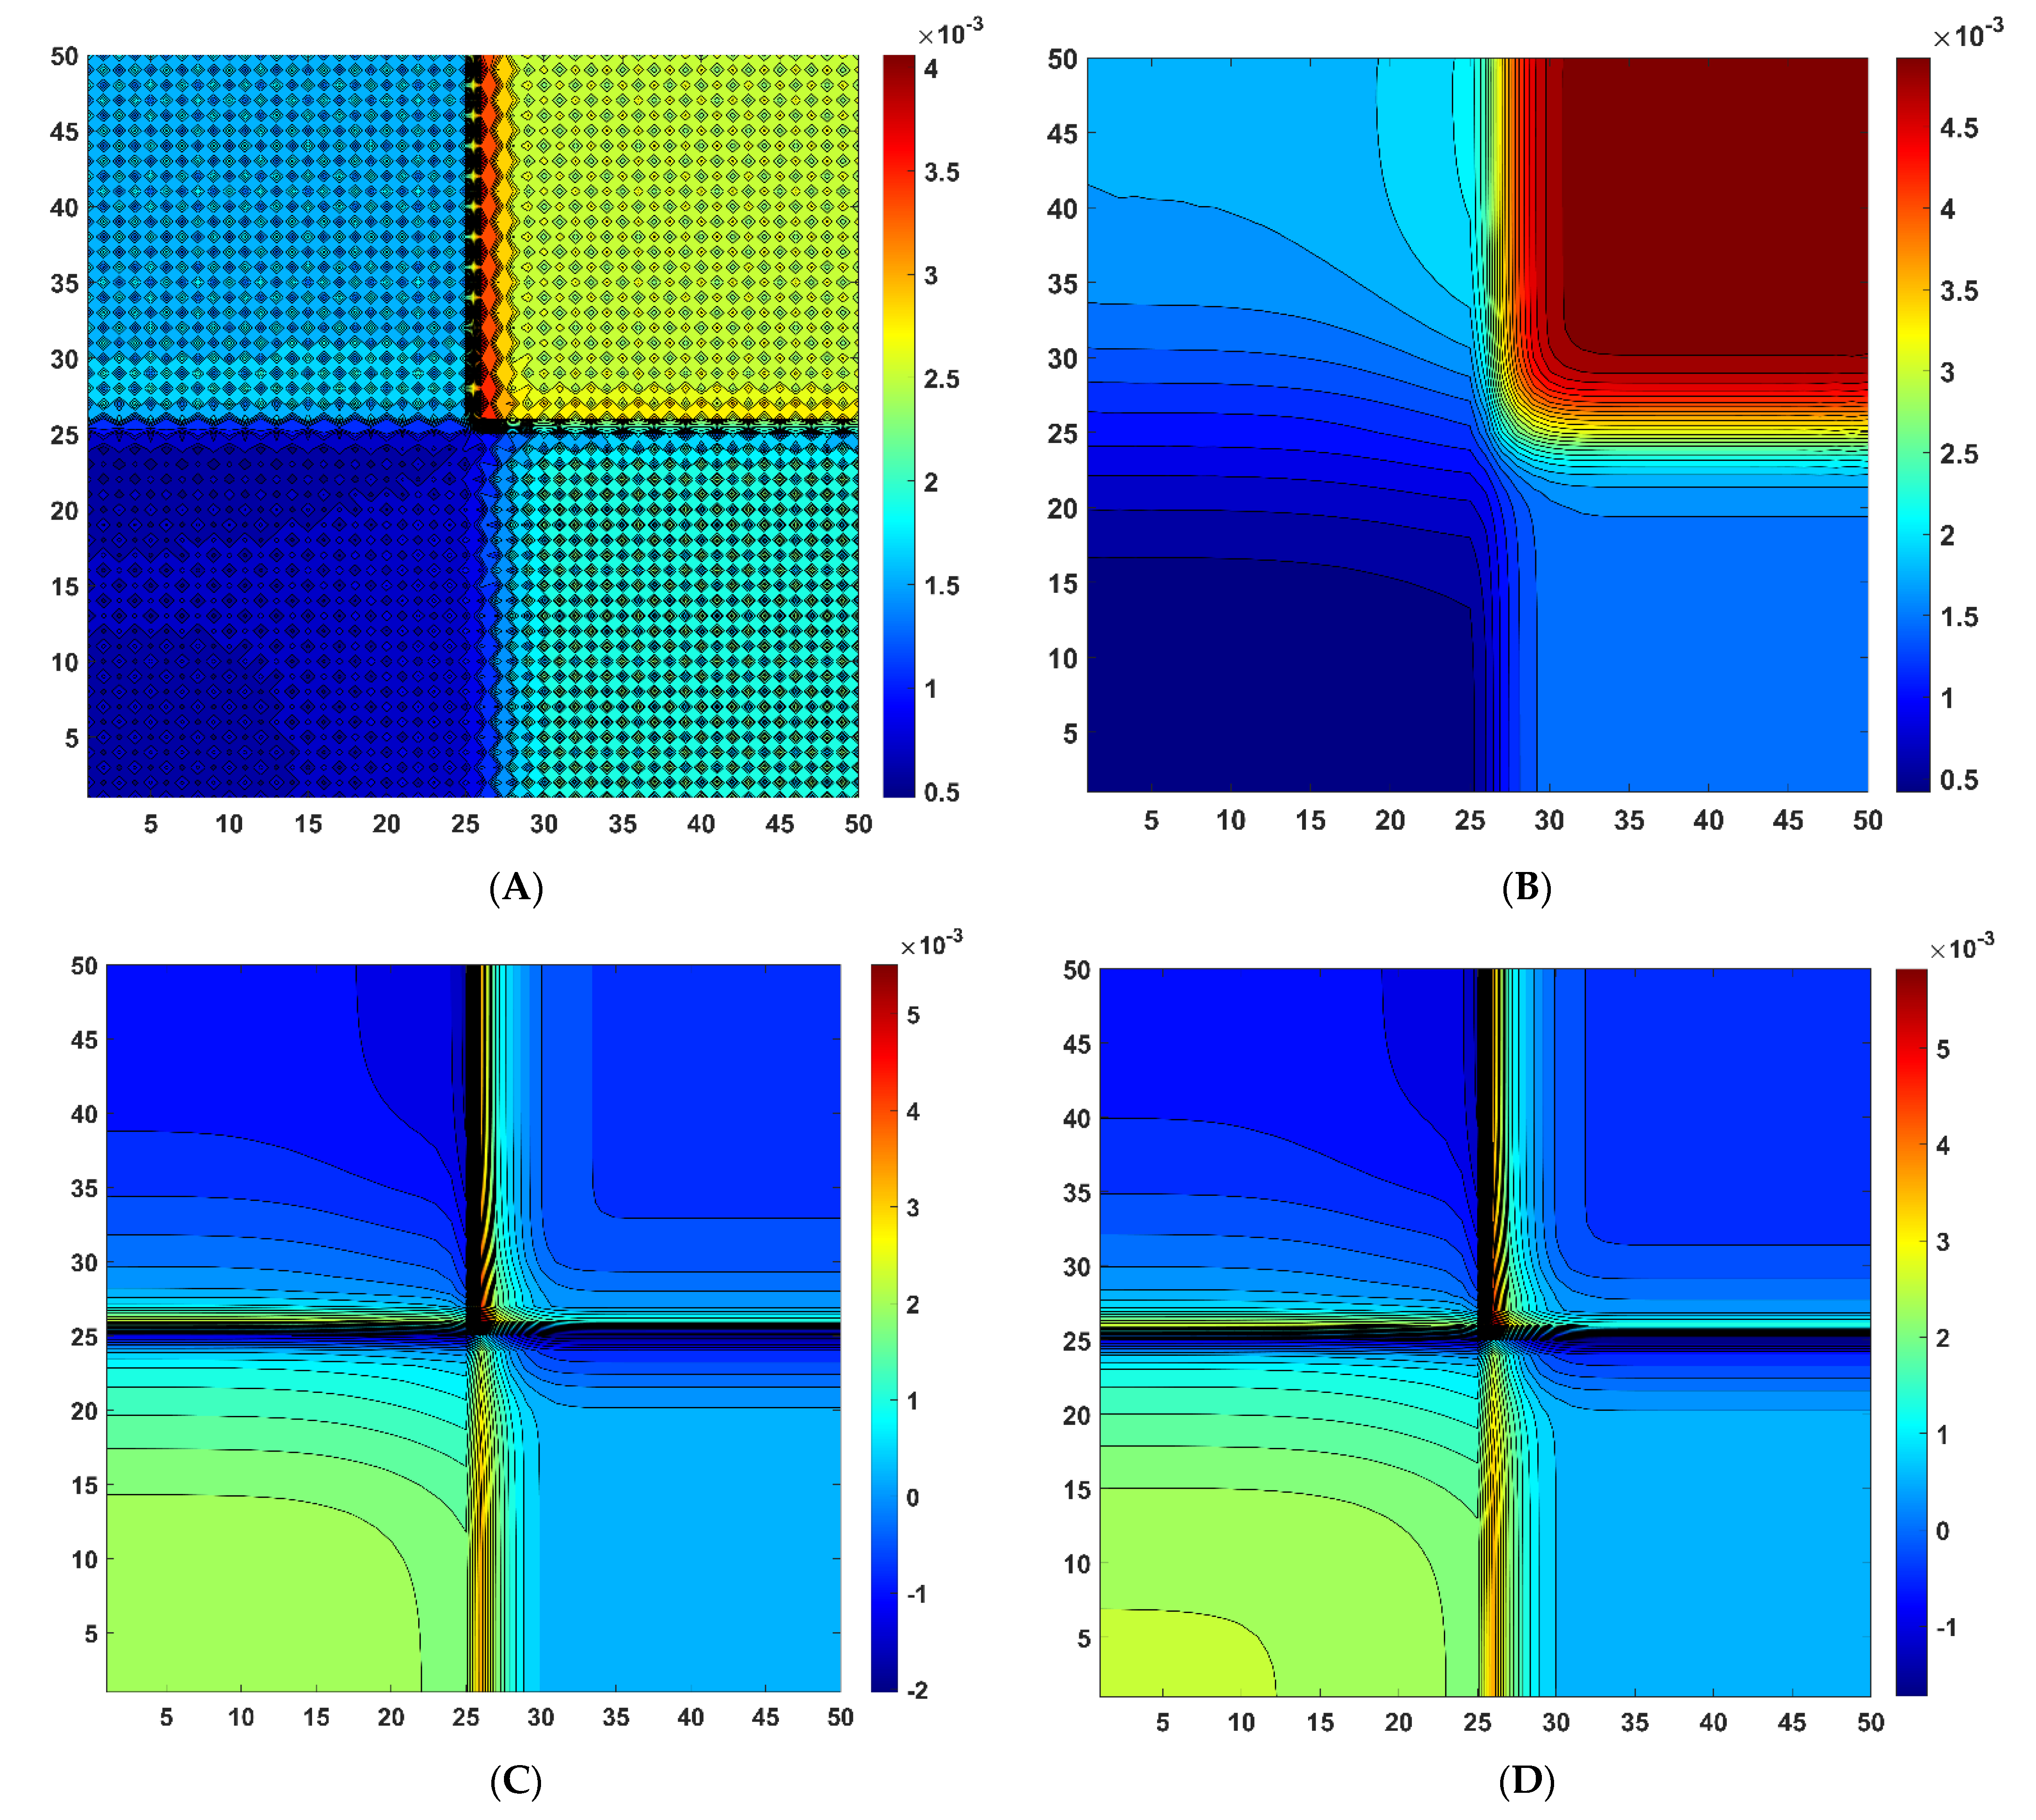
5.6. Results for the Surface of the Wall

Figure 13 shows the temperature distribution contour in Kelvin units for the surface area. The figure shows that in the case of the insulator (right-hand side of the figure), heat can hardly flow from the top of the figure to the bottom, so there are large temperature gradients. Moreover, because the heat capacity of the insulation layer is smaller than that of the brick layer, its temperature increases faster from the original 270 K.
The maximum errors of the cell temperatures at the final time as a function of time step size are shown in Figure 14 and Figure 15 for the 50 by 50 and 100 by 100 systems, respectively. One can see the LH is the most accurate scheme, followed by the DF, compared with the implicit methods with two different tolerances. Figure 16 and Figure 17 for the 50 by 50 and 100 by 100 systems, respectively, show the running time with the maximum errors. We use many time steps for the explicit methods (LH and DF) and less for the implicit methods because they are much slower, and we see that LH and DF are faster and more accurate.
Figure 18 shows the running time for time step size h = 1   s with the total number of cells on the horizontal axis. On the right-side axis, it is shown for the LH and DF methods and on the left-side axis for implicit methods. One can see that the running time is a linear function in the case of the explicit methods, but not for the implicit methods. If using a logarithmic scale in both axis (Figure 19), it becomes visible that the slope for the explicit methods is one, while it is around two for the implicit solvers. This is expected, since the explicit methods apply loops over the cells, so the running time is directly proportional to N, while the implicit solvers work with the system matrix with size N × N , thus the running time is proportional to N2. It means that for even larger system sizes, e.g., in 3D, they become even less competitive with the explicit and stable methods.
For the coarse mesh (50 by 50), we present the spatial distribution of errors in Figure 20 as 2D contour plots and in Figure 21 as curves for a specific z coordinate for the four methods. The time step sizes are chosen to reach very similar error levels. One can see that with the exception of the DF method, the errors are the largest, where the temperature gradients are largest, i.e., at the boundary of different materials and circumstances. The pattern of odd–even structure is also observable for the LH method, but even with this artificial oscillation, this algorithm is the most accurate. Table 3 shows the time step sizes, the errors, and the running times for the four methods in the case exemplified in Figure 20 and Figure 21.

6. Conclusions and Summary

The diffusion–reaction PDE was studied where the reaction term is linear in the unknown variable, but its coefficient depends on both space and time in two different nonlinear ways. New analytical solutions were conveyed using the travelling-wave trial function. The solution for Lorentzian and cosine coefficient-function contains the Heun function and the Mathieu functions, respectively, so they are very nontrivial. These solutions were then reproduced with high accuracy by nine numerical algorithms. Six of them are explicit schemes with excellent stability properties. The rest are the standard explicit and implicit methods, which were severely outperformed by especially the Dufort–Frankel and the recently invented leapfrog-hopscotch methods. These two methods are also tested against the implicit ones in a realistic 2D case, when the temperature development of the surface of a wall was simulated. The time- and space-dependent reaction term was implemented as forced convection due to wind, while the material properties of the surface changed abruptly in space. Again, the explicit and stable methods proved to be more efficient than the implicit ones, and this advantage is expected to increase with the system size.

Author Contributions

Conceptualization and methodology, E.K. and I.F.B.; supervision and resources, E.K.; analytical investigation and the related visualization, I.F.B.; software, Á.N. and A.H.A.; verification and the related visualization, E.K.; numerical investigation in 2D and the related visualization, A.H.A.; writing—original draft preparation, A.H.A. and I.F.B.; writing—review and editing, E.K., A.H.A. and Á.N. All authors have read and agreed to the published version of the manuscript.

Funding

This research received no external funding.

Data Availability Statement

Data available upon request from the first or the corresponding author.

Conflicts of Interest

The authors declare no conflict of interest.

References

  1. Jacobs, M.H. Diffusion Processes; Springer: Berlin/Heidelberg, Germany, 1935; ISBN 978-3-642-86414-8. [Google Scholar]
  2. Lienhard, J.H. A Heat Transfer Textbook, 4th ed.; Phlogiston Press: Cambridge, MA, USA, 2017; ISBN 9780971383524. [Google Scholar]
  3. Rothe, F. Global Solutions of Reaction-Diffusion Systems; Springer: Berlin/Heidelberg, Germany, 1984; Volume 1072, ISBN 978-3-540-13365-0. [Google Scholar]
  4. Smoller, J. Shock Waves and Reaction—Diffusion Equations; Springer: New York, NY, USA, 1994; Volume 258, ISBN 978-1-4612-6929-8. [Google Scholar]
  5. Gilding, B.H.; Kersner, R. Travelling Waves in Nonlinear Diffusion-Convection Reaction; Birkhäuse: Basel, Switzerland, 2004. [Google Scholar] [CrossRef] [Green Version]
  6. Wilhelmsson, H.; Lazzaro, E. Reaction-Diffusion Problems in the Physics of Hot Plasmas; CRC Press: Boca Raton, FL, USA, 2000; Available online: https://www.taylorfrancis.com/books/mono/10.1201/9781420033588/reaction-diffusion-problems-physics-hot-plasmas-wilhelmsson-lazzaro (accessed on 13 May 2023).
  7. Li, T.; Xiong, J.; Zhang, T.; Chai, X.; Liu, X. Multi-physics coupled simulation on steady-state and transients of heat pipe cooled reactor system. Ann. Nucl. Energy 2023, 187, 109774. [Google Scholar] [CrossRef]
  8. Xie, Q.; Wang, Y.; Li, X.; Yang, Z.; Li, J.; Xie, Z.; Wang, X.; Cai, J.; Xu, Q. Two-dimensional transient heat transfer model of moving quenching jet based on machine learning. Int. J. Heat Mass Transf. 2022, 191, 122765. [Google Scholar] [CrossRef]
  9. Kim, K.-S.; Won, M.-H.; Kim, J.-W.; Back, B.-J. Heat pipe cooling technology for desktop PC CPU. Appl. Therm. Eng. 2003, 23, 1137–1144. [Google Scholar] [CrossRef]
  10. Wang, Y.; Wang, B.; Zhu, K.; Li, H.; He, W.; Liu, S. Energy saving potential of using heat pipes for CPU cooling. Appl. Therm. Eng. 2018, 143, 630–638. [Google Scholar] [CrossRef]
  11. Du, H.; Ekkad, S.V.; Han, J.-C.; Lee, C.P. Detailed Film Cooling Measurements over a Gas Turbine Blade Using a Transient Liquid Crystal Image Technique. Int. J. Rotating Mach. 2001, 7, 415–424. [Google Scholar] [CrossRef] [Green Version]
  12. Mátyás, L.; Barna, I.F. General Self-Similar Solutions of Diffusion Equation and Related Constructions. Rom. J. Phys. 2022, 67, 101. [Google Scholar]
  13. Abdulrahman, A.; Gamaoun, F.; Kumar, R.V.; Khan, U.; Gill, H.S.; Nagaraja, K.; Eldin, S.M.; Galal, A.M. Study of thermal variation in a longitudinal exponential porous fin wetted with TiO2−SiO2/ hexanol hybrid nanofluid using hybrid residual power series method. Case Stud. Therm. Eng. 2023, 43, 102777. [Google Scholar] [CrossRef]
  14. Turkyilmazoglu, M. Convergent optimal variational iteration method and applications to heat and fluid flow problems. Int. J. Numer. Methods Heat Fluid Flow 2016, 26, 790–804. [Google Scholar] [CrossRef]
  15. Ain, Q.T.; Nadeem, M.; Karim, S.; Akgül, A.; Jarad, F. Optimal variational iteration method for parametric boundary value problem. AIMS Math. 2022, 7, 16649–16656. [Google Scholar] [CrossRef]
  16. Savović, S.; Djordjevich, A. Numerical solution of the diffusion equation describing the flow of radon through concrete SEQ CHAPTER. Appl. Radiat. Isot. 2008, 66, 552–555. [Google Scholar] [CrossRef]
  17. Jejeniwa, O.A.; Gidey, H.H.; Appadu, A.R. Numerical Modeling of Pollutant Transport: Results and Optimal Parameters. Symmetry 2022, 14, 2616. [Google Scholar] [CrossRef]
  18. Mbroh, N.A.; Munyakazi, J.B. A robust numerical scheme for singularly perturbed parabolic reaction-diffusion problems via the method of lines. Int. J. Comput. Math. 2021, 99, 1139–1158. [Google Scholar] [CrossRef]
  19. Ndou, N.; Dlamini, P.; Jacobs, B.A. Enhanced Unconditionally Positive Finite Difference Method for Advection–Diffusion–Reaction Equations. Mathematics 2022, 10, 2639. [Google Scholar] [CrossRef]
  20. Kumar, V.; Chandan, K.; Nagaraja, K.V.; Reddy, M.V. Heat Conduction with Krylov Subspace Method Using FEniCSx. Energies 2022, 15, 8077. [Google Scholar] [CrossRef]
  21. Jiang, T.; Zhang, Y.-T. Krylov implicit integration factor WENO methods for semilinear and fully nonlinear advection–diffusion–reaction equations. J. Comput. Phys. 2013, 253, 368–388. [Google Scholar] [CrossRef]
  22. Heidari, M.; Ghovatmand, M.; Skandari, M.H.N.; Baleanu, D. Numerical Solution of Reaction–Diffusion Equations with Convergence Analysis. J. Nonlinear Math. Phys. 2022, 30, 384–399. [Google Scholar] [CrossRef]
  23. Kolev, M.K.; Koleva, M.N.; Vulkov, L.G. An Unconditional Positivity-Preserving Difference Scheme for Models of Cancer Migration and Invasion. Mathematics 2022, 10, 131. [Google Scholar] [CrossRef]
  24. Beuken, L.; Cheffert, O.; Tutueva, A.; Butusov, D.; Legat, V. Numerical Stability and Performance of Semi-Explicit and Semi-Implicit Predictor–Corrector Methods. Mathematics 2022, 10, 2015. [Google Scholar] [CrossRef]
  25. Fedoseev, P.; Pesterev, D.; Karimov, A.; Butusov, D. New Step Size Control Algorithm for Semi-Implicit Composition ODE Solvers. Algorithms 2022, 15, 275. [Google Scholar] [CrossRef]
  26. Ji, Y.; Xing, Y. Highly Accurate and Efficient Time Integration Methods with Unconditional Stability and Flexible Numerical Dissipation. Mathematics 2023, 11, 593. [Google Scholar] [CrossRef]
  27. Settanni, G.; Sgura, I. Devising efficient numerical methods for oscillating patterns in reaction–diffusion systems. J. Comput. Appl. Math. 2016, 292, 674–693. [Google Scholar] [CrossRef]
  28. Yadav, V.S.; Singh, A.; Maurya, V.; Rajpoot, M.K. New RK type time-integration methods for stiff convection–diffusion–reaction systems. Comput. Fluids 2023, 257, 105865. [Google Scholar] [CrossRef]
  29. Essongue, S.; Ledoux, Y.; Ballu, A. Speeding up mesoscale thermal simulations of powder bed additive manufacturing thanks to the forward Euler time-integration scheme: A critical assessment. Finite Elements Anal. Des. 2022, 211, 103825. [Google Scholar] [CrossRef]
  30. Chen-Charpentier, B.M.; Kojouharov, H.V. An unconditionally positivity preserving scheme for advection–diffusion reaction equations. Math. Comput. Model. 2013, 57, 2177–2185. [Google Scholar] [CrossRef]
  31. Appadu, A.R. Performance of UPFD scheme under some different regimes of advection, diffusion and reaction. Int. J. Numer. Methods Heat Fluid Flow 2017, 27, 1412–1429. [Google Scholar] [CrossRef] [Green Version]
  32. Savović, S.; Drljača, B.; Djordjevich, A. A comparative study of two different finite difference methods for solving advection–diffusion reaction equation for modeling exponential traveling wave in heat and mass transfer processes. Ric. di Mat. 2022, 71, 245–252. [Google Scholar] [CrossRef]
  33. Pourghanbar, S.; Manafian, J.; Ranjbar, M.; Aliyeva, A.; Gasimov, Y.S. An Efficient Alternating Direction Explicit Method for Solving a Nonlinear Partial Differential Equation. Math. Probl. Eng. 2020, 2020, 9647416. [Google Scholar] [CrossRef]
  34. Al-Bayati, A.Y.; Manaa, S.A.; Al-Rozbayani, A.M. Comparison of Finite Difference Solution Methods for Reaction Diffusion System in Two Dimensions. AL-Rafidain J. Comput. Sci. Math. 2011, 8, 21–36. [Google Scholar] [CrossRef] [Green Version]
  35. Nagy, Á.; Majár, J.; Kovács, E. Consistency and Convergence Properties of 20 Recent and Old Numerical Schemes for the Diffusion Equation. Algorithms 2022, 15, 425. [Google Scholar] [CrossRef]
  36. Nagy, Á.; Omle, I.; Kareem, H.; Kovács, E.; Barna, I.F.; Bognar, G. Stable, Explicit, Leapfrog-Hopscotch Algorithms for the Diffusion Equation. Computation 2021, 9, 92. [Google Scholar] [CrossRef]
  37. Saleh, M.; Kovács, E.; Barna, I.F.; Mátyás, L. New Analytical Results and Comparison of 14 Numerical Schemes for the Diffusion Equation with Space-Dependent Diffusion Coefficient. Mathematics 2022, 10, 2813. [Google Scholar] [CrossRef]
  38. Saleh, M.; Kovács, E.; Barna, I.F. Analytical and Numerical Results for the Transient Diffusion Equation with Diffusion Coefficient Depending on Both Space and Time. Algorithms 2023, 16, 184. [Google Scholar] [CrossRef]
  39. Olver, F.W.J.; Lozier, D.W.; Boisvert, R.F.; Clark, C.W. NIST Handbook of Mathematical Functions; Cambridge University Press: New York, NY, USA, 2011; Volume 66, ISBN 978-0-521-14063-8. [Google Scholar]
  40. Slavyanov, S.; Lay, W. Special Functions: Unified Theory Based on Singularities; Oxford University Press Inc.: Oxford, UK, 2000; ISBN 9780198505730. [Google Scholar]
  41. Maier, R.S. The 192 solutions of the Heun equation. Math. Comput. 2006, 76, 811–843. [Google Scholar] [CrossRef]
  42. Ronveaux, A. Heun’s Differential Equations; Clarendon Press: Oxford, UK, 1995; ISBN 13978-0521687935. [Google Scholar]
  43. Strutt, M.J.O. Lamesche—Mathieausche—Und Verwandte Funktionen in Physik und Technik; Chelsea Publishing Company: New York, NY, USA, 1967. [Google Scholar]
  44. Meixner, J.; Schäfke, F.W. Mathieusche Funktionen und Sphäroidfunktionen; Springer: Berlin/Heidelberg, Germany, 1954. [Google Scholar] [CrossRef]
  45. Arscott, F.M. Periodic Differential Equations: An Introduction to Mathieu, Lamé, and Allied Functions; Pergamon: London, UK, 2013. [Google Scholar]
  46. McLachlan, N.W. Theory and Applications of Mathieu Functions; Oxford University Press Inc.: Oxford, UK, 1964. [Google Scholar]
  47. Gourlay, A.R.; Mcguire, G.R. General Hopscotch Algorithm for the Numerical Solution of Partial Differential Equations. IMA J. Appl. Math. 1971, 7, 216–227. [Google Scholar] [CrossRef]
  48. Hirsch, C. Numerical Computation of Internal and External Flows: Fundamentals of Numerical Discretization; Wiley: Hoboken, NJ, USA, 1988; Volume 1. [Google Scholar]
  49. Hestenes, M.R.; Stiefel, E. Methods of conjugate gradients for solving linear systems. J. Res. Natl. Bur. Stand. 1934, 49, 1952. [Google Scholar] [CrossRef]
  50. Barrett, R.; Berry, M.; Chan, T.F.; Demmel, J.; Donato, J.; Dongarra, J.; Eijkhout, V.; Pozo, R.; Romine, C.; Van Der Vorst, H. Templates for the Solution of Linear Systems: Building Blocks for Iterative Methods; Society for Industrial and Applied Mathematics: Philadelphia, PA, USA, 1994. [Google Scholar] [CrossRef]
  51. Saad, Y.; Schultz, M.H. GMRES: A Generalized Minimal Residual Algorithm for Solving Nonsymmetric Linear Systems. SIAM J. Sci. Stat. Comput. 1986, 7, 856–869. [Google Scholar] [CrossRef] [Green Version]
  52. Askar, A.H.; Omle, I.; Kovács, E.; Majár, J. Testing Some Different Implementations of Heat Convection and Radiation in the Leapfrog-Hopscotch Algorithm. Algorithms 2022, 15, 400. [Google Scholar] [CrossRef]
  53. Holman, J.P. Heat Transfer, 10th ed.; McGraw-Hill Educ.: New York, NY, USA, 2010; ISBN 0073529362. [Google Scholar]
  54. Jalghaf, H.K.; Omle, I.; Kovács, E. A Comparative Study of Explicit and Stable Time Integration Schemes for Heat Conduction in an Insulated Wall. Buildings 2022, 12, 824. [Google Scholar] [CrossRef]
  55. Omle, I.; Askar, A.H.; Kovács, E.; Bolló, B. Comparison of the Performance of New and Traditional Numerical Methods for Long-Term Simulations of Heat Transfer in Walls with Thermal Bridges. Energies 2023, 16, 4604. [Google Scholar] [CrossRef]
  56. Weather Online. Hungary Holiday Weather. 2023. Available online: https://www.worldweatheronline.com/miskolc-weatherhistory/miskolc/hu.aspx (accessed on 1 February 2023).
  57. Duffie, J.A.; Beckman, W.A. Solar Engineering of Thermal Processes; Wiley: New York, NY, USA, 1980. [Google Scholar]
Figure 1. The shape function of Equation (5) for the different parameter sets c 1 ,   c 2 ,   c ,   a ,   D ; the black, red, blue, and green lines are for (0, 1, 0.5, 7.4, 0.3), (0, 1, 2, 7.4, 0.3), (0, 1, 0.5, 7.4, 1.8), and (0, 1, 0.5, 2.4, 4.1), respectively.
Computation 11 00127 g001
Figure 2. The solution function of Equation (6) for the parameters of D = 0.3; a = 7.4; c = 1; Ψ = 5.572222 ; c1 = 0; c2 = 1, respectively.
Computation 11 00127 g002
Figure 3. The stability diagram of the shape function f ( η ) in the form of Equation (8) for c = 1 for the Mathieu S part c 1 = 0 ,   c 2 = 1 . The horizontal axis shows the range of the parameter a, which is responsible for the strength of the source term, while the vertical axis shows the range of the D, which is the diffusion coefficient. In the white regions, the function the integral of the function is infinite and therefore not stable. In the colored region, the integral is finite and has the value as the color shows.
Computation 11 00127 g003
Figure 4. The solution u x , t of Equation (2) with form of Equation (9) for c = 1 ,   a = 2 ,   D = 6 . Only the Mathieu S function is presented with c 2 = 1 ; the Mathieu C function looks similar.
Computation 11 00127 g004
Figure 5. Hopscotch-type space–time structures. The time elapses from the top t = t 0 to the bottom t = t fin .
Computation 11 00127 g005
Figure 6. Errors as a function of the temporal step size for Case study 1.
Computation 11 00127 g006
Figure 7. The concentration u as a function of x in the case of the initial function u 0 , the exact analytical solution at t fin , the implicit-PCG algorithm (with Tolerance 10−5), and the LH scheme for h = 0.002 in the case of small value of a (Case study 1). The maximum errors (and running times) are 0.0015 (98.7 s) and 0.0022 (0.107 s) for the PCG and LH methods, respectively.
Computation 11 00127 g007
Figure 8. Errors as a function of the temporal step size for Case study 2.
Computation 11 00127 g008
Figure 9. The concentration u as a function of x in the case of the initial function u 0 , the exact analytical solution at t fin , the implicit–GMRES algorithm, and the LH scheme. For more data, please see the main text.
Computation 11 00127 g009
Figure 10. Errors as a function of the temporal step size for Case study 3.
Computation 11 00127 g010
Figure 11. The concentration u as a function of x in the case of the initial function u 0 , the exact analytical solution at t fin , the implicit-PCM algorithm, and the LH scheme.
Computation 11 00127 g011
Figure 12. The surface of the modelled wall with two layers.
Computation 11 00127 g012
Figure 13. The temperature distribution contour in Kelvin units for the surface area (upper half) constant convection and (lower half) the convection changes with time depending on weather data.
Computation 11 00127 g013
Figure 14. The maximum errors as a function of the time step size h for the two implicit methods with two different tolerances and the two explicit methods in the case of the 50 by 50 system.
Computation 11 00127 g014
Figure 15. The maximum errors as a function of the time step size h for the examined methods for the 100 by 100 system.
Computation 11 00127 g015
Figure 16. The maximum errors as a function of the running time for the tested methods for the 50 by 50 system.
Computation 11 00127 g016
Figure 17. The maximum errors as a function of the running time for the tested methods for the 100 by 100 system.
Computation 11 00127 g017
Figure 18. The running time with total number of cells for h = 1   s . The left-hand side vertical axis refers to the LH and DF methods, while it is on the right-hand side axis for the implicit methods.
Computation 11 00127 g018
Figure 19. The running time in the same logarithmic scale for all the used solvers as a function of the total number of cells.
Computation 11 00127 g019
Figure 20. The error of temperature distribution contour in Kelvin units (A) LH, (B) DF, (C) GMRES, and (D) PCG methods.
Computation 11 00127 g020
Figure 21. The error of temperature distribution at z = 80 [cm] in Kelvin units for LH, DF, GMRES, and PCG methods along x-axis.
Computation 11 00127 g021
Table 1. Properties of the applied materials [53].
ρ kg m 3 c J kg 1 K 1 k W m 1 K 1
Brick19008400.73
Rigid Polyurethane Foam32014000.023
Table 2. The temperature and heat source in case of wall surface area [56].
Upper ElementsLower Elements
h c   W m 2 K 0.60.6–5.55
T (K)290275–280
Table 3. The performance for the numerical methods.
Numerical MethodTime Step Size h
(Tolerance)
Maximum
Error
Running Time (s)
leapfrog-hopscotch (LH)100.00421.32
Dufort–Frankel (DF)100.00510.97
generalized minimal residual (GMRES)1·(10−7)0.0058246.965
preconditioned conjugate gradient (PCG)1·(10−7)0.00621187.404
Disclaimer/Publisher’s Note: The statements, opinions and data contained in all publications are solely those of the individual author(s) and contributor(s) and not of MDPI and/or the editor(s). MDPI and/or the editor(s) disclaim responsibility for any injury to people or property resulting from any ideas, methods, instructions or products referred to in the content.

