
Grey Systems Model to Assess Water Quality in Mantaro River in Peru

Grupo de Investigación en Ciencias de la Tierra, Medio Ambiente y Sostenibilidad—CITMAS, Pontificia Universidad Católica del Perú PUCP, Lima 15023, Peru
*
Author to whom correspondence should be addressed.
Computation 2023, 11(11), 223; https://doi.org/10.3390/computation11110223
Submission received: 13 June 2023
/
Revised: 8 August 2023
/
Accepted: 11 September 2023
/
Published: 4 November 2023
(This article belongs to the Section Computational Engineering)
Abstract
:The section of the Mantaro River that flows through the department of Huancavelica, Peru, has been affected by toxic wastes and mineral residues from industrial and mining activities, which have directly impacted the water quality. In this work, a grey system model, based on the grey clustering method, was used to assess water quality. The grey clustering method was applied using the central point of triangular whitening weight functions (CTWF). In addition, the Prati index and the Environmental Quality Standards for water from the Peru government were revised and used for this study. In the case study, six physicochemical parameters, pH, DO, BOD, Cd, As, and Pb, at nine monitoring points were assessed along the Mantaro River. The results showed that the sixth monitoring point (P6), which is influenced by mining activity, was highly contaminated, while the other points were classified as noncontaminated. Finally, the results obtained by applying the grey clustering method can be useful to competent authorities, for decision making on water management in this watershed.
1. Introduction
Section III of the Mantaro River in Peru is located in the Huancavelica hydrographic network, which represents part of the middle course of the river. Moreover, rivers are the main transport agents for pollutants, depending on the proximity of any industrial activity [1]. The study area is mainly influenced by mining activities, which are engaged in the extraction of certain minerals that could cause environmental impacts on surface waters [2]. In fact, in 2010, there was an overflow of mining tailings caused by a company that affected the Totora Pampa, Escalera, and Opamayo rivers in Peru; this event caused serious damage to river biodiversity and health problems for the local population. The Peruvian government declared an environmental emergency for 90 days due to high concentration of weighted metals in spilled tailings. This event affected the local economy linked to agriculture and fishing [3]. Consequently, the need to analyze water quality in this sector is important because it could ensure that contaminant concentrations are within the permitted limits by environmental standards and could guarantee the correct management of this water resource.
In this way, the grey clustering method, which is based on grey systems, is proposed for the analysis of surface water quality on the selected monitoring points [2]. The grey clustering method consists of giving weights to the parameters or criteria established, classifying each monitoring point into a water quality level [4], and, subsequently, assessing the water quality and assigning a category to each monitoring point.
In turn, the case study was developed in Section III of the Mantaro River; this represents part of the middle course of the Mantaro River, which is 227.74 km [5]. For this study, nine monitoring points from the Water National Authority (ANA) technical report were used, five of which belong to domestic wastewater and the other four to mining activities. In addition, six physicochemical parameters of water quality were used to assess water quality by the grey clustering method.
Therefore, the specific objective of this study was to assess water quality in Section III of Mantaro River by applying the grey clustering method and to analyze the environmental impact of domestic wastewater and mining activities.
2. Literature Review
In this section, the literature review on the case study and methodology is presented.
2.1. About the Case Study
In the Mantaro River watershed, diverse activities such as agriculture, mining industry, or population-related activities are developed [6]. This work focuses on the water quality assessment resulting from these activities. However, the main activity that generates pollution in water is mining, as shown by studies on water pollution caused by lead [7] or on the risk to human health due to water pollution [8].
In addition, water pollution due to domestic wastewater from urban populations represents a serious problem along the Mantaro River watershed, as shown by studies on pollution of the river in central Peru [9], on the quality of drinking water and the Mantaro River [10], or on surface water quality in the Mantaro River watershed assessed after the cessation of anthropogenic activities due to the COVID-19 pandemic [11].
In 2012, a complaint was presented to the Peruvian government regarding the pollution of the Mantaro River due to productive activities, such as mining, hydroelectrical projects, and agriculture, in which were identified 261 mining activities, 10 hydroelectrical activities, and agriculture practices representing 1.1% of the total surface area. The government of Peru conducted a water quality monitoring effort, revealing concentrations of metals such as arsenic, cadmium, copper, mercury, lead, and zinc [12].
In addition, urban growth based on the free market land economy has been squandering agricultural land in the Mantaro watershed and causing serious negative impacts on the territory, such as the contamination of the Mantaro River, since most of the main urban centers discharge their sewage without any treatment, with the main effect being the reduction of the agricultural area, attacking the main economic activity of the valley; this is due to the fact that the production that satisfies local and regional demand runs the risk of disappearing. In this sense, the urban systems in the valley have historically developed, in relation to agricultural activity, in order to contemplate potential future scenarios, where the greatest concern should be to redirect the growth of towns so that the geography that characterizes the valley is protected [13].
In this context of environmental sustainability and public wellbeing, it is very important to develop studies on the status of water quality of the Mantaro River watershed. This could ensure the suitability of water for consumption by the human population and ecological systems in the region. In addition, the results of these studies could help local authorities and the central government to make the best decisions about the Mantaro River watershed management.
2.2. About the Methodology
Grey systems theory, proposed for the first time by Deng in 1982 [14], can be applied to solve different problems, as shown by studies on water quality assessment of main affluents of the Rimac river in Peru [15], on environmental conflict analysis on a hydrocarbon exploration project [16], or on improved fault diagnosis methods for power systems based on grey system theory [17].
Furthermore, the grey systems theory is a new methodology that focuses on the study of problems involving small samples and limited information. It deals with uncertain systems with partially known information through generating, excavating, and extracting useful information from what is available. Thus, systems’ operational behaviors and their laws of evolution can be correctly described and effectively monitored. In the natural world, uncertain systems with small samples and poor information are commonly observed. The extensive range of applicability of the grey systems theory is molded by this underlying reality. One pivotal characteristic of uncertain systems resides in the absence of comprehensive information. Situations where system information is not fully provided can be categorized into the following four cases [18]:
- (1)
- The details regarding the elements (parameters) are not fully provided.
- (2)
- The knowledge about the system’s structure is not complete.
- (3)
- The information concerning the system’s boundary is lacking.
- (4)
- The understanding of the system’s behaviors is not comprehensive.
The scenario of incomplete information is a common occurrence within our realms of social, economic, and scientific investigation. As a case in point, in the context of agricultural productions, despite possessing comprehensive and precise data pertaining to factors such as cultivation areas, seed types, fertilization methodologies, and irrigation practices, the presence of uncertainties within realms including the quality of labor, ecological settings, climatic circumstances, and dynamics of commodity markets introduces formidable challenges in the pursuit of achieving precise prognostications of production yields and the ensuing economic appraisals. For biological prevention systems, even with an understanding of the interrelations between insects and their indigenous predators, achieving the intended preventive effects is still a challenge. This difficulty arises from our lack of comprehension concerning the intricate dynamics encompassing the interactions among insects and baits, the interplay between their natural adversaries and the attractants, and the dynamics associated with distinct categories of natural antagonists. Regarding the modification and restructuring of the pricing framework, policymakers frequently encounter challenges in decision making attributed to the absence of comprehensive insights into the extent of psychological resilience exhibited by consumers and the intricate repercussions that adjustments in the cost of a particular commodity could exert upon the prices of other commodities. Within the domain of security markets, even the most astute market analysts cannot assure consistent success, owing to their inability to accurately prognosticate alterations in economic policies and interest rates, shifts in corporate management across diverse entities, the trajectory of prevailing political currents, shifts in investor behaviors within the international markets, and the cascading effects of price fluctuations within one group of commodities onto other groups. In the broader socioeconomic framework, due to the absence of distinct linkages between the “inside” and the “outside” and between the system itself and its environment, and due to the challenge in delineating the boundary separating the system’s internal and external domains, analyzing the impact of input on the output becomes intricate [19].
In this way, the grey systems theory emerges as a good option to apply to water quality assessment, as this topic is a problem of high uncertainty due to the different variables that intervene in this analysis. Moreover, the limited available information in this case study represents an advantage regarding other approaches, such as classical statistical procedures, fuzzy logic approaches, or machine learning approaches.
3. Methodology
The grey clustering method is an approach that can be applied by incidence matrixes or whitenization functions [19]. In this study, center-point triangular whitenization functions (CTWFs) were applied. In order to applied the CTWF method in the assessment, m monitoring points and a set of n water quality parameters or criteria, xij (I = 1, 2, …, m; j = 1,2, …, n), were defined. In Figure 1, the steps of the CTWF method are presented:
- Step 1: Determination of categories
First, five categories for each water quality parameter were assigned according to Peruvian water quality standard regulation and Prati index, which is an environmental standard that stablishes levels of environmental quality, and these were then used as grey classes in this work (λ1, λ2, λ3, λ4, λ5) [20,21].
- Step 2: Dimension removal
Then, the water quality parameters or criteria and sampling values were converted to nondimensionless values. Therefore, these new values represented the following arrangement: Z = {Zij; i = 1,2, …, m; j = 1,2, …, n}. This was normalized for each criterion Cj (j = 1, 2, …, n); the conversion was calculated by Equation (1).
- Step 3: Determination of the triangular functions
Following the CTWF method, five functions were defined according to water quality parameters of the Peruvian regulations and the Prati index, as shown in Figure 2.
Here,
Then, by using the triangular center-point whitening weight (CTWF), the functions for each of the established parameters or categories with its limits were described, for the k-th class grey, k = 1, 2, 3, 4, 5, of the j-th parameter, j = 1, 2, …, n, for a monitoring value xij, as shown in Equations (2)–(6):
- Step 4: Weight for each criterion
Afterwards, by using the statistical procedure of harmonic mean, the weights of each established parameter or criteria were calculated by Equation (7):
- Step 5: Determination of the clustering coefficient
To determine the integral clustering coefficient for each monitoring point i, i = 1, 2, …, with respect to the grey classes k, k = 1, 2, 3, 4, 5, we added the products of criteria with their grouping weights using Equation (8):
- Step 6: Determination of the maximum clustering coefficient
Finally, by using the max clustering coefficient, the results were determined to decide what object belonged to the k* grey class according to the selected monitoring points. In addition, if there were several objects in the k* grey class, these objects could be ordered according to the magnitudes of their full clustering coefficients by Equation (9):
4. Case of Study
The analysis of surface water quality was carried out in Section III of the Mantaro River in Peru. In addition, the area is mainly influenced by domestic wastewater and mining activities, as shown in Figure 3.
4.1. Definition of Study Objects
4.2. Definition of Assessment Criteria
Six assessment criteria were defined in this study, as shown in Table 3.
4.3. Definition of the Grey Classes
There were five grey classes or evaluation classes, according to water quality parameters of the Peruvian regulations and the Prati index. Table 4 shows the classes for this study.
4.4. Calculations Using the CTWF Method
The CTWF method was applied using the procedure indicated in the methodology; the calculations are presented in the following steps.
- Step 1: Determination of categories
The values calculated for each parameter were obtained according to water quality parameters of the Peruvian regulations and the Prati index. The standard values are shown in Table 5.
In addition, the sampling values were obtained from the Peru government in 2019 for nine monitoring points [22]. The values are shown in Table 6.
- Step 2: Dimension removal
From Table 5, the nondimensioned standard values for each criterion were determined using Equation (1) and are presented in Table 7.
Furthermore, from Table 6, the nondimensioned sampling values for each criterion for the nine monitoring points were obtained dividing by the mean of the standard values. The results are shown in Table 8.
- Step 3: Determination of the triangular functions
The values of Table 7 were substituted into Equations (2)–(6) and the triangular whitening functions of the five grey classes were obtained for each parameter. As an example, the functions of C1 criterion are presented in Equations (10)–(14).
Afterwards, the values of Table 8 were evaluated using the triangular whitening functions of the five criteria. As an example, the results of the first monitoring point (P1) are presented in Table 9.
- Step 4: Weight for each criterion
The harmonic mean method was used to determine the clustering weight using Equation (7). The weight values are shown in Table 10.
- Step 5: Determination of the clustering coefficient
The clustering coefficient was calculated by Equation (8). As an example, values from the first point (P1) are shown in Table 11.
- Step 6: Determination the maximum clustering coefficient
The maximum clustering coefficient was calculated using Equation (9). The results obtained for each monitoring point are shown in Table 12.
5. Results and Discussion
This section is developed in two parts, according to objectives of this work, as presented below.
5.1. About the Case Study
Table 12 shows the maximum clustering coefficients of the nine monitoring points. Eight of them have a water quality level of uncontaminated (λ1), and only one point is highly contaminated (λ5). Although most of the points are not contaminated, there are some that are of higher quality than others. For this purpose, Table 13 was made, and the points are ordered from highest to lowest quality according to their maximum clustering coefficient, which shows that the monitoring points that are influenced by domestic wastewater present a higher quality than the points influenced by the mining activities.
In addition, P6 was the most contaminated point; this was caused by a mining accident that occurred in the area. Specifically, in the case of the overflow of mine tailings from a mining company in 2010, this accident affected more than ten communities, whose residents consumed poisoned trout and contaminated water [23]. In this work, the data were collected from the government of Peru in 2018. However, after several years of the discharge, the water quality could not be improved. Moreover, the other points evaluated for this activity showed an efficient recovery; this may be attributed to the capacity of the rivers to self-purify [24]. Self-purification depends on the characteristics of the river; among the peculiarities that are taken into consideration are the flow discharge, flow rate, sediment load, and the creatures in the rivers [25]. To confirm this theory, studies should be made of the rivers found in Section III of the Mantaro River watershed. This would help to establish the areas that contain the natural water currents of this area and to know which are the determining factors for carrying out the process of self-purification [26].
5.2. About the Methodology
The method used in this work, which is based on the grey systems theory, allowed us to quantify qualitative information through whitenization functions [27,28]. The weights in this method were used to find the maximum clustering coefficient. These are related to the weight given to each criterion used for the analysis, which represents special attention given to their specification. The weights used for this study were objective (e.g., harmonic mean method), but subjective weights or equal weights can also be used [29,30].
There are other methods that can be used to assess water quality, such as the Delphi method, which consists of consulting a group of experts to reach a group opinion on a particular topic [31]. This methodology assumes that the collective consensus is more accurate and closer to reality; however, this technique uses descriptive statistics in data processing, which causes its quantification capacity to decrease [32].
Therefore, what differentiates the grey clustering method from other methods is the use of grey classes in each criterion, since it allows widening of the range of evaluation [14]. In addition, the grey clustering method has a good level of quantification and works very well with high-uncertainty problems [33]. This method does not necessarily have to be used alone; other methods can be incorporated to optimize the results [34,35].
6. Conclusions
In conclusion, it is estimated that water influenced by mining activities presents a higher contamination index than that influenced by domestic wastewater. However, as part of their natural processes, rivers have the capacity for self-purification, which can be beneficial in some aspects. It is necessary that actions could be managed by the government to guarantee environmental sustainability and water quality. In this sense, this work could be useful in alerting the competent entities about the monitoring points that present a high level of contamination and require special treatment to improve their water quality. In particular, the results from this study could help local authorities and the Peruvian central government to make the best decisions about water resource management in the Mantaro watershed.
In this work, the grey clustering method, which is based on grey systems theory, allowed the estimation of water resources quality, based on criteria and weights, which helped us to obtain a better assessment. However, the analysis could have been improved by including some other methodology, such as Shannon entropy, the Delphi method, or fuzzy logic approaches; nevertheless, the study turned out to be successful.
Finally, for future research, characterization of the country’s rivers can be carried out, to observe which of these would be able to recover and what factors provide this capacity to the water resources in case of any event. In addition, works could be developed to study water quality from the Mantaro River, in which the soil and water can be analyzed in order to protect the health of the population and the ecosystem.
Author Contributions
Conceptualization, A.D., J.C., M.L., V.G. and I.D.; methodology, A.D., J.C., M.L., V.G. and I.D.; software, J.C., M.L., V.G. and I.D.; validation, J.C., M.L., V.G. and A.D.; formal analysis, A.D., J.C., M.L., V.G. and I.D.; investigation, J.C., M.L., V.G. and I.D.; resources, J.C., M.L., V.G. and I.D.; data curation, J.C., M.L. and V.G.; writing—original draft preparation, J.C., M.L., V.G. and I.D.; writing—review and editing, A.D.; visualization, J.C., M.L., V.G. and I.D.; supervision, A.D.; project administration, A.D. All authors have read and agreed to the published version of the manuscript.
Funding
This research received no external funding.
Data Availability Statement
Not applicable.
Conflicts of Interest
The authors declare no conflict of interest.
References
- Isaeva, I.I.; Voronin, A.A.; Khoperskov, A.V.; Kharitonov, M.A. Modeling the Territorial Structure Dynamics of the Northern Part of the Volga-Akhtuba Floodplain. Computation 2022, 10, 62. [Google Scholar] [CrossRef]
- Scopus—Document Details—Using a Retention Pond to Capture Agricultural Contaminants from Surface Waters. Available online: https://www-scopus-com.ezproxybib.pucp.edu.pe/record/display.uri?eid=2-s2.0-85168807628&origin=resultslist&sort=plf-f&src=s&sid=7f8537cfbcb3fbae7cae20025d72297b&sot=b&sdt=b&s=TITLE-ABS-KEY%28water+quality+surface%29&sl=36&sessionSearchId=7f8537cfbcb3fbae7cae20025d72297b (accessed on 10 September 2023).
- Clima de Cambios PUCP Desborde de Relave Minero En Huancavelica Contaminó 3 Ríos. Available online: https://www.pucp.edu.pe/climadecambios/noticias/desborde-de-relave-minero-en-huancavelica-contamino-3-rios/ (accessed on 5 June 2023).
- Fu, X.Q.; Zou, Z.H. Water Quality Evaluation of the Yellow River Basin Based on Gray Clustering Method. In IOP Conference Series: Earth and Environmental Science; IOP Publishing: Bristol, UK, 2018. [Google Scholar]
- Heikkinen, A.M. Climate Change, Power, and Vulnerabilities in the Peruvian Highlands. Reg. Environ. Chang. 2021, 21, 82. [Google Scholar] [CrossRef]
- Velásquez, R.M.A.; Lara, J.V.M. Electrical Assessment by Lightning Phenomenon in Power Lines of Double Circuit. IEEE Lat. Am. Trans. 2016, 14, 2217–2225. [Google Scholar] [CrossRef]
- Scopus—Document Details—Surface Adsorption Mechanism between Lead(II,IV) and Nanomaghemite Studied on Polluted Water Samples Collected from the Peruvian Rivers Mantaro and Cumbaza. Available online: https://www-scopus-com.ezproxybib.pucp.edu.pe/record/display.uri?eid=2-s2.0-85160453137&origin=resultslist&sort=plf-f&src=s&sid=cbb4fa490103faa502b4ce395ce724c5&sot=b&sdt=b&s=TITLE-ABS-KEY%28mantaro%29&sl=22&sessionSearchId=cbb4fa490103faa502b4ce395ce724c5 (accessed on 24 July 2023).
- Scopus—Document Details—Lead and Cadmium Bioaccumulation in Fresh Cow’s Milk in an Intermediate Area of the Central Andes of Peru and Risk to Human Health. Available online: https://www-scopus-com.ezproxybib.pucp.edu.pe/record/display.uri?eid=2-s2.0-85132198992&origin=resultslist&sort=plf-f&src=s&sid=cbb4fa490103faa502b4ce395ce724c5&sot=b&sdt=b&s=TITLE-ABS-KEY%28mantaro+river%29&sl=22&sessionSearchId=cbb4fa490103faa502b4ce395ce724c5 (accessed on 24 July 2023).
- Scopus—Document Details—Bioadsorption by Coffee Leaves in Poluted River Mantaro Water at Central Peru. Available online: https://www-scopus-com.ezproxybib.pucp.edu.pe/record/display.uri?eid=2-s2.0-85126368489&origin=resultslist&sort=plf-f&src=s&sid=cbb4fa490103faa502b4ce395ce724c5&sot=b&sdt=b&s=TITLE-ABS-KEY%28mantaro+river%29&sl=22&sessionSearchId=cbb4fa490103faa502b4ce395ce724c5 (accessed on 24 July 2023).
- Scopus—Document Details—Evaluation of the Quality of Drinking Water and Rivers in the Mantaro Valley, Central Peru. Available online: https://www-scopus-com.ezproxybib.pucp.edu.pe/record/display.uri?eid=2-s2.0-85124007792&origin=resultslist&sort=plf-f&src=s&sid=cbb4fa490103faa502b4ce395ce724c5&sot=b&sdt=b&s=TITLE-ABS-KEY%28mantaro+river%29&sl=22&sessionSearchId=cbb4fa490103faa502b4ce395ce724c5 (accessed on 24 July 2023).
- Scopus—Document Details—Surface Water Quality in the Mantaro River Watershed Assessed after the Cessation of Anthropogenic Activities Due to the COVID-19 Pandemic. Available online: https://www-scopus-com.ezproxybib.pucp.edu.pe/record/display.uri?eid=2-s2.0-85107620913&origin=resultslist&sort=plf-f&src=s&sid=cbb4fa490103faa502b4ce395ce724c5&sot=b&sdt=b&s=TITLE-ABS-KEY%28mantaro+river%29&sl=22&sessionSearchId=cbb4fa490103faa502b4ce395ce724c5 (accessed on 24 July 2023).
- Caycho Bustamante, M. Denuncia de Contaminación En La Cuenca Del Mantaro; Organismo de Evaluación y Fiscalización Ambiental—OEFA: Lima, Peru, 2012.
- Chuquimantari, O.S. La Urbanización En El Valle Del Mantaro y Su Influencia En La Actividad Agrícola. Ciudad Arquit. 2013, 6, 83–90. [Google Scholar]
- Zhou, L.; Xu, S. Application of Grey Clustering Method. J. Am. Sci. 2006, 2, 53–58. [Google Scholar]
- Delgado, A.; Aguirre, A.; Palomino, E.; Salazar, G. Applying Triangular Whitenization Weight Functions to Assess Water Quality of Main Affluents of Rimac River. In Proceedings of the 2017 Electronic Congress (E-CON UNI), Lima, Peru, 22–24 November 2017; IEEE: Piscataway, NJ, USA, 2017; pp. 1–4. [Google Scholar]
- Delgado, A.; Romero, I. Environmental Conflict Analysis on a Hydrocarbon Exploration Project Using the Shannon Entropy. In Proceedings of the 2017 Electronic Congress, E-CON UNI 2017, Lima, Peru, 28 June 2017; Institute of Electrical and Electronics Engineers Inc.: Piscataway, NJ, USA, 2017; pp. 1–4. [Google Scholar]
- Wang, J.; Wang, J.; Wang, B. Improved Fault Diagnosis Method for Power Systems Based on Grey System Theory. In Proceedings of the 2017 International Conference on Dependable Systems and Their Applications (DSA), Beijing, China, 31 October–2 November 2017; p. 171. [Google Scholar] [CrossRef]
- Liu, S.; Lin, Y. Grey Information: Theory and Practical Applications; Springer: New York, NY, USA, 2006. [Google Scholar]
- Liu, S.; Lin, Y. Grey Systems Theory and Applications; Understanding Complex Systems; Springer: Berlin/Heidelberg, Germany, 2011; Volume 68, ISBN 978-3-642-16157-5. [Google Scholar]
- Prati, L.; Pavanello, R.; Pesarin, F. Assessment of Surface Water Quality by Single Index Pollution. Water Res. 1971, 5, 741–751. [Google Scholar] [CrossRef]
- Scopus—Document Details—Grey-Incidence Clustering Decision-Making Method with Three-Parameter Interval Grey Number Based on Regret Theory. Available online: https://www-scopus-com.ezproxybib.pucp.edu.pe/record/display.uri?eid=2-s2.0-85040098852&origin=resultslist&sort=r-f&src=s&sid=7f8537cfbcb3fbae7cae20025d72297b&sot=b&sdt=b&s=TITLE-ABS-KEY%28grey+clustering%29&sl=36&sessionSearchId=7f8537cfbcb3fbae7cae20025d72297b (accessed on 10 September 2023).
- Calixto, C.C. Coordinadora Regional Pasco Mesa de Concertación Para la Lucha Contra la Pobreza; GRP: Pasco, Peru, 2019. [Google Scholar]
- Pinto Herrera, H. Ecological and Environmental Disaster in Huancavelica; Universidad Nacional Mayor de San Marcos: Lima, Peru, 2010; pp. 321–338. [Google Scholar]
- Xu, P.; Zhang, Y.; Wu, S.; Feng, Y. The Forecast of the Surface Water Environment of Caohe River. In Proceedings of the 2009 3rd International Conference on Bioinformatics and Biomedical Engineering, Beijing, China, 11–13 June 2009. [Google Scholar] [CrossRef]
- Li, Y.; Niu, Y.; Wang, W.; Li, B. Grey-Incidence Clustering Decision-Making Method with Three-Parameter Interval Grey Number Based on Regret Theory. In Proceedings of the 2017 International Conference on Grey Systems and Intelligent Services (GSIS), Stockholm, Sweden, 8–11 August 2017; pp. 211–218. [Google Scholar] [CrossRef]
- Tian, S.; Wang, Z.; Shang, H. Study on the Self-Purification of Juma River. Procedia Environ. Sci. 2011, 11, 1328–1333. [Google Scholar] [CrossRef]
- Delgado, A.; Condori, R.; Hernández, M.; Huamani, E.L.; Andrade-Arenas, L. Artificial Intelligence Model Based on Grey Clustering to Access Quality of Industrial Hygiene: A Case Study in Peru. Computation 2023, 11, 51. [Google Scholar] [CrossRef]
- Scopus—Document Details—Gray Relational Clustering Model for Intelligent Guided Monitoring Horizontal Wells. Available online: https://www-scopus-com.ezproxybib.pucp.edu.pe/record/display.uri?eid=2-s2.0-85051422009&origin=resultslist&sort=r-f&src=s&sid=7f8537cfbcb3fbae7cae20025d72297b&sot=b&sdt=b&s=TITLE-ABS-KEY%28grey+clustering%29&sl=36&sessionSearchId=7f8537cfbcb3fbae7cae20025d72297b (accessed on 10 September 2023).
- Scopus—Document Details—A Study on the Quality Evaluation Index System of Smart Home Care for Older Adults in the Community—Based on Delphi and AHP. Available online: https://www-scopus-com.ezproxybib.pucp.edu.pe/record/display.uri?eid=2-s2.0-85149409641&origin=resultslist&sort=plf-f&src=s&sid=e83d2817ddded2e67cdb1f95dd5eb5dc&sot=b&sdt=b&s=TITLE-ABS-KEY%28AHP+delphi%29&sl=25&sessionSearchId=e83d2817ddded2e67cdb1f95dd5eb5dc (accessed on 10 September 2023).
- Yang, W.; Li, Y.; Wang, H.; Jiang, M.; Cao, M.; Liu, C. Multi-Objective Optimization of High-Power Microwave Sources Based on Multi-Criteria Decision-Making and Multi-Objective Micro-Genetic Algorithm. IEEE Trans. Electron Devices 2023, 70, 3892–3898. [Google Scholar] [CrossRef]
- Sun, X.; Ren, Q.; Hsu, W.L. Framework for Evaluation Index System of Carrying Water Resource. In Proceedings of the 2020 IEEE Eurasia Conference on IOT, Communication and Engineering (ECICE), Yunlin, Taiwan, 23–25 October 2020; pp. 349–352. [Google Scholar] [CrossRef]
- Sun, Y.; Hoi, L.M.; Kei Im, S. Constructing the Evaluation Index System of Chinese-Portuguese Machine Translation Using the Delphi and Analytic Hierarchy Process Methods. In Proceedings of the 2023 IEEE 3rd International Conference on Power, Electronics and Computer Applications (ICPECA), Shenyang, China, 29–31 January 2023; pp. 190–195. [Google Scholar] [CrossRef]
- She, R.; Fu, D. Research on Evaluation Strategy of Heterogeneous Computing Chip Based on Improved Common Origin Grey Clustering. In Proceedings of the 2023 4th International Conference on Computer Engineering and Application (ICCEA), Hangzhou, China, 7–9 April 2023; pp. 65–69. [Google Scholar] [CrossRef]
- Alex Tume-Bruce, B.A.; Delgado, A.; Huamaní, E.L. Implementation of a Web System for the Improvement in Sales and in the Application of Digital Marketing in the Company Selcom. Int. J. Recent Innov. Trends Comput. Commun. 2022, 10, 48–59. [Google Scholar] [CrossRef]
- Zhao, J. A Method of Power Supply Health State Estimation Based on Grey Clustering and Fuzzy Comprehensive Evaluation. IEEE Access 2023, 11, 12226–12236. [Google Scholar] [CrossRef]
Figure 1.
CTWF method flow chart.

Figure 2.
Triangular functions (a color for each function).
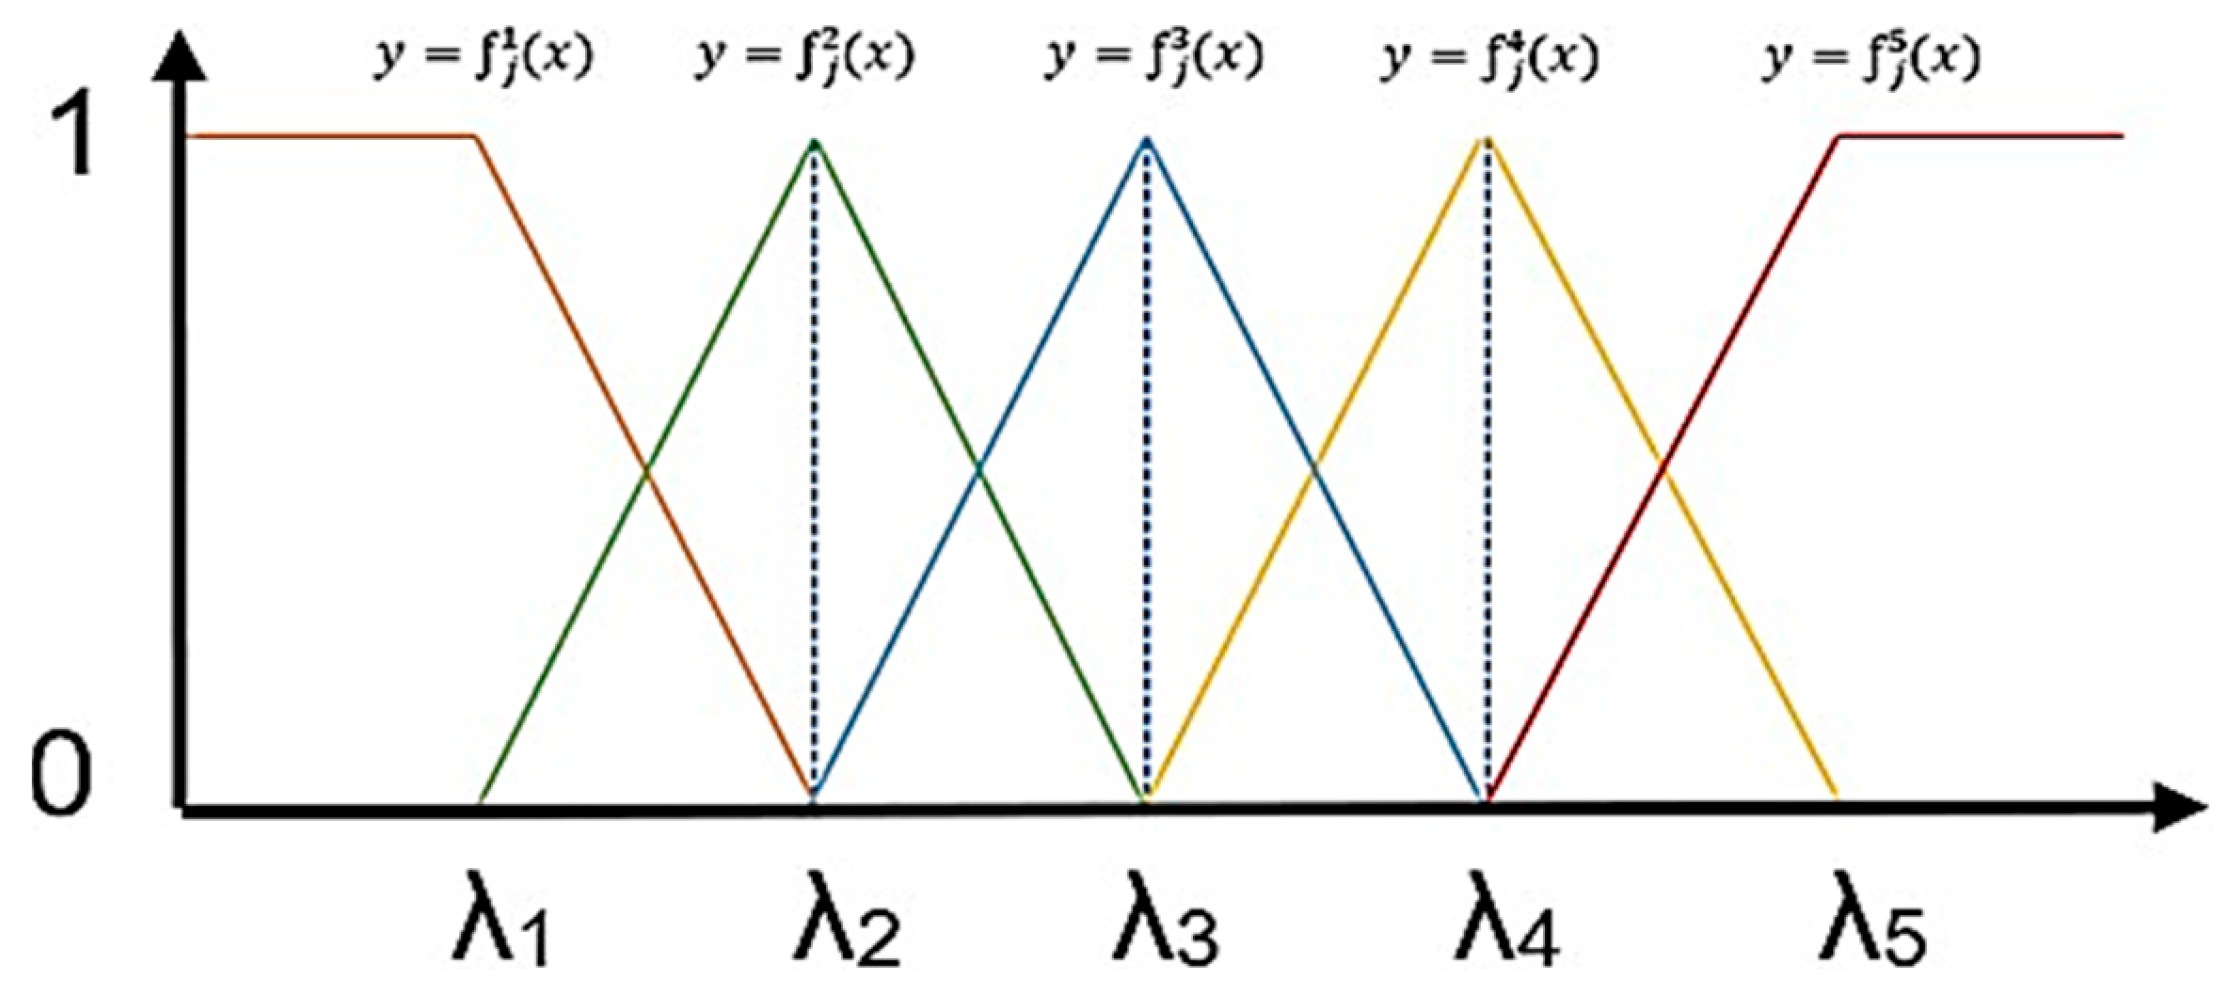
Figure 3.
Location map of the monitoring points (1, 2, 3, …, 9).


Table 1.
Monitoring points in the area influenced by domestic wastewater.
| Point | Name | Description | Coordinates UTM-WGS84 | |
|---|---|---|---|---|
| East | North | |||
| 1 | P1 | Ichu River, upstream of the Punco Punco water catchment. | 492797 | 8582601 |
| 2 | P2 | Ichu River, upstream from the city of Huancavelica, before the Municipal slaughterhouse. | 495411 | 8585670 |
| 3 | P3 | Ichu River, downstream from the city of Huancavelica, 100 m before Santa Rosa bridge. | 505969 | 8586595 |
| 4 | P4 | Disparate River, downstream of the confluence with the wastewater from El Brocal Hydroelectric Plant. | 501949 | 8585856 |
| 5 | P5 | Mantaro River, downstream of the wastewater treatment ponds in the Anco district | 544540 | 8597918 |
Table 2.
Monitoring points in the area influenced by mining activity.
| Point | Name | Description | Coordinates UTM-WGS84 | |
|---|---|---|---|---|
| East | North | |||
| 6 | P6 | Escalera River, upstream of mining company. | 492797 | 8582601 |
| 7 | P7 | Escalera River, downstream of mining company. | 495411 | 8585670 |
| 8 | P8 | Pallcapampa River, upstream of Corralpampa town (mining company). | 505969 | 8586595 |
| 9 | P9 | Pallcapampa River, downstream of Corralpampa town (mining company). | 501949 | 8585856 |
Table 3.
Assessment criteria or parameters for water quality.
| Criterion | Description | Units | Notation |
|---|---|---|---|
| pH | Hydrogen potential | pH unit | C1 |
| DO | Dissolved oxygen | mg/L | C2 |
| BOD | Biochemical oxygen demand | mg/L | C3 |
| Cd | Cadmium | mg/L | C4 |
| As | Arsenic | mg/L | C5 |
| Pb | Lead | mg/L | C6 |
Table 4.
Grey classes and their description.
| Grey Classes | |
|---|---|
| λ1 | Uncontaminated |
| λ2 | Acceptable |
| λ3 | Moderately contaminated |
| λ4 | Contaminated |
| λ5 | Highly contaminated |
Table 5.
Criteria and grey classes for case study.
| Criteria | λ1 | λ2 | λ3 | λ4 | λ5 |
|---|---|---|---|---|---|
| C1 | 7.2 | 7.25 | 8 | 8.5 | 9 |
| C2 | 8 | 7 | 6 | 5 | 4 |
| C3 | 1 | 2 | 4.5 | 9 | 13.5 |
| C4 | 0.01 | 0.05 | 0.09 | 0.13 | 0.17 |
| C5 | 0.1 | 0.2 | 0.3 | 0.4 | 0.5 |
| C6 | 0.01 | 0.05 | 0.05 | 0.09 | 0.13 |
Table 6.
Sampling values of each monitoring point.
| P1 | P2 | P3 | P4 | P5 | P6 | P7 | P8 | P9 | |
|---|---|---|---|---|---|---|---|---|---|
| C1 | 8.50000 | 8.40000 | 8.10000 | 9.00000 | 8.90000 | 7.00000 | 7.90000 | 8.50000 | 7.60000 |
| C2 | 4.33000 | 4.30000 | 3.80000 | 3.80000 | 5.40000 | 3.50000 | 3.20000 | 3.80000 | 3.30000 |
| C3 | 2.00000 | 2.00000 | 3.00000 | 2.00000 | 2.00000 | 30.00000 | 6.00000 | 2.00000 | 2.00000 |
| C4 | 0.00001 | 0.00001 | 0.00001 | 0.00001 | 0.00001 | 0.04593 | 0.01941 | 0.01941 | 0.00136 |
| C5 | 0.00189 | 0.00299 | 0.03706 | 0.01354 | 0.01061 | 0.15093 | 0.04318 | 0.00131 | 0.15038 |
| C6 | 0.00020 | 0.00020 | 0.00390 | 0.00320 | 0.00130 | 0.47940 | 0.03640 | 0.00020 | 0.00460 |
Table 7.
Nondimensioned standard values.
| λ1 | λ2 | λ3 | λ4 | λ5 | |
|---|---|---|---|---|---|
| C1 | 0.9011 | 0.9074 | 1.0013 | 1.0638 | 1.1264 |
| C2 | 1.3333 | 1.1667 | 1.0000 | 0.8333 | 0.6667 |
| C3 | 0.1667 | 0.3333 | 0.7500 | 1.5000 | 2.2500 |
| C4 | 0.1111 | 0.5556 | 1.0000 | 1.4444 | 1.8889 |
| C5 | 0.3333 | 0.6667 | 1.0000 | 1.3333 | 1.6667 |
| C6 | 0.1515 | 0.7576 | 0.7576 | 1.3636 | 1.9697 |
Table 8.
Nondimensioned values for the sampling values.
| P1 | P2 | P3 | P4 | P5 | P6 | P7 | P8 | P9 | |
|---|---|---|---|---|---|---|---|---|---|
| C1 | 1.0638 | 1.0513 | 1.0138 | 1.1264 | 1.1139 | 0.8761 | 0.9887 | 1.0638 | 0.9512 |
| C2 | 0.7217 | 0.7167 | 0.6333 | 0.6333 | 0.9000 | 0.5833 | 0.5333 | 0.6333 | 0.5500 |
| C3 | 0.3333 | 0.3333 | 0.5000 | 0.3333 | 0.3333 | 5.0000 | 1.0000 | 0.3333 | 0.3333 |
| C4 | 0.0001 | 0.0001 | 0.0001 | 0.0001 | 0.0001 | 0.5103 | 0.2157 | 0.2157 | 0.0151 |
| C5 | 0.0063 | 0.0100 | 0.1235 | 0.4513 | 0.0354 | 0.5031 | 0.1439 | 0.0044 | 0.5013 |
| C6 | 0.0030 | 0.0030 | 0.0591 | 0.0485 | 0.0197 | 7.2636 | 0.5515 | 0.0030 | 0.0697 |
Table 9.
Results of the triangular functions for P1.
| P1 | C1 | C2 | C3 | C4 | C5 | C6 |
|---|---|---|---|---|---|---|
| f1j(x) | 0.00000 | 0.67000 | 0.16667 | 1.00000 | 1.00000 | 1.00000 |
| f2j(x) | 0.00000 | 0.33000 | 0.83333 | 0.00000 | 0.00000 | 0.00000 |
| f3j(x) | 0.00000 | 0.00000 | 0.00000 | 0.00000 | 0.00000 | 0.00000 |
| f4j(x) | 0.50000 | 0.00000 | 0.00000 | 0.00000 | 0.00000 | 0.00000 |
| f5j(x) | 0.50000 | 0.00000 | 0.00000 | 0.00000 | 0.00000 | 0.00000 |
Table 10.
Weight values for each criterion.
| λ1 | λ2 | λ3 | λ4 | λ5 | |
|---|---|---|---|---|---|
| C1 | 0.0371 | 0.1124 | 0.1552 | 0.2084 | 0.2341 |
| C2 | 0.0514 | 0.1255 | 0.1494 | 0.1834 | 0.2029 |
| C3 | 0.2741 | 0.2789 | 0.1992 | 0.1427 | 0.1202 |
| C4 | 0.3084 | 0.1883 | 0.1494 | 0.1481 | 0.1432 |
| C5 | 0.1028 | 0.1569 | 0.1494 | 0.1605 | 0.1623 |
| C6 | 0.2262 | 0.1381 | 0.1973 | 0.1569 | 0.1373 |
Table 11.
Clustering coefficients for point P1.
| P1 | C1 | C2 | C3 | C4 | C5 | C6 | Result |
|---|---|---|---|---|---|---|---|
| f1j(x) | 0.000 | 0.000 | 0.000 | 1.000 | 1.000 | 1.000 | 0.7030 |
| f2j(x) | 0.000 | 0.000 | 1.000 | 0.000 | 0.000 | 0.000 | 0.3132 |
| f3j(x) | 0.000 | 0.000 | 0.000 | 0.000 | 0.000 | 0.000 | 0.0000 |
| f4j(x) | 1.000 | 0.330 | 0.000 | 0.000 | 0.000 | 0.000 | 0.2681 |
| f5j(x) | 0.000 | 0.670 | 0.000 | 0.000 | 0.000 | 0.000 | 0.2249 |
Table 12.
Maximum clustering coefficient for each point.
| POINT | λ1 | λ2 | λ3 | λ4 | λ5 | Level |
|---|---|---|---|---|---|---|
| P1 | 0.7030 | 0.3132 | 0.0000 | 0.2681 | 0.2249 | Uncontaminated |
| P2 | 0.5328 | 0.2226 | 0.0000 | 0.1091 | 0.0823 | Uncontaminated |
| P3 | 0.5104 | 0.1532 | 0.0576 | 0.1637 | 0.0206 | Uncontaminated |
| P4 | 0.5442 | 0.1915 | 0.0000 | 0.0000 | 0.2057 | Uncontaminated |
| P5 | 0.5062 | 0.2536 | 0.0519 | 0.0182 | 0.1852 | Uncontaminated |
| P6 | 0.1262 | 0.2052 | 0.0000 | 0.0000 | 0.2263 | Highly Contaminated |
| P7 | 0.3460 | 0.0365 | 0.1422 | 0.1870 | 0.1207 | Uncontaminated |
| P8 | 0.4905 | 0.2281 | 0.0000 | 0.0910 | 0.1029 | Uncontaminated |
| P9 | 0.5059 | 0.2567 | 0.1077 | 0.0364 | 0.0000 | Uncontaminated |
Table 13.
Comparison of the water quality of the monitoring points.
| Influenced by | Monitoring Points | Max Clustering Coefficient | Level |
|---|---|---|---|
| Domestic wastewater | P4 | 0.5442 | Uncontaminated |
P2 | 0.5328 | Uncontaminated | |
P1 | 0.5317 | Uncontaminated | |
P3 | 0.5104 | Uncontaminated | |
P5 | 0.5062 | Uncontaminated | |
| Mining activities | P9 | 0.5059 | Uncontaminated |
P8 | 0.4905 | Uncontaminated | |
P7 | 0.3460 | Uncontaminated | |
| P6 | 0.2263 | Highly contaminated |
Disclaimer/Publisher’s Note: The statements, opinions and data contained in all publications are solely those of the individual author(s) and contributor(s) and not of MDPI and/or the editor(s). MDPI and/or the editor(s) disclaim responsibility for any injury to people or property resulting from any ideas, methods, instructions or products referred to in the content. |
© 2023 by the authors. Licensee MDPI, Basel, Switzerland. This article is an open access article distributed under the terms and conditions of the Creative Commons Attribution (CC BY) license (https://creativecommons.org/licenses/by/4.0/).
Share and Cite
MDPI and ACS Style
Delgado, A.; Culqui, J.; Lazo, M.; Guerrero, V.; Delgado, I. Grey Systems Model to Assess Water Quality in Mantaro River in Peru. Computation 2023, 11, 223. https://doi.org/10.3390/computation11110223
AMA Style
Delgado A, Culqui J, Lazo M, Guerrero V, Delgado I. Grey Systems Model to Assess Water Quality in Mantaro River in Peru. Computation. 2023; 11(11):223. https://doi.org/10.3390/computation11110223
Chicago/Turabian StyleDelgado, Alexi, Joshis Culqui, Marisabel Lazo, Valeria Guerrero, and Isabel Delgado. 2023. "Grey Systems Model to Assess Water Quality in Mantaro River in Peru" Computation 11, no. 11: 223. https://doi.org/10.3390/computation11110223
Note that from the first issue of 2016, this journal uses article numbers instead of page numbers. See further details here.