
The Differential Evolution Algorithm for Solving the Problem of Size Selection and Location of Infectious Waste Incinerator

Abstract
:1. Introduction
- We develop a differential evolution algorithm that can efficiently solve the problem.
- We propose an adjustment of the mathematical model from non-linear to linear without changing the nature of the problem, which Lingo Solver can solve to optimality.
2. Related Literature
3. Problem Formulation
3.1. Problem Description
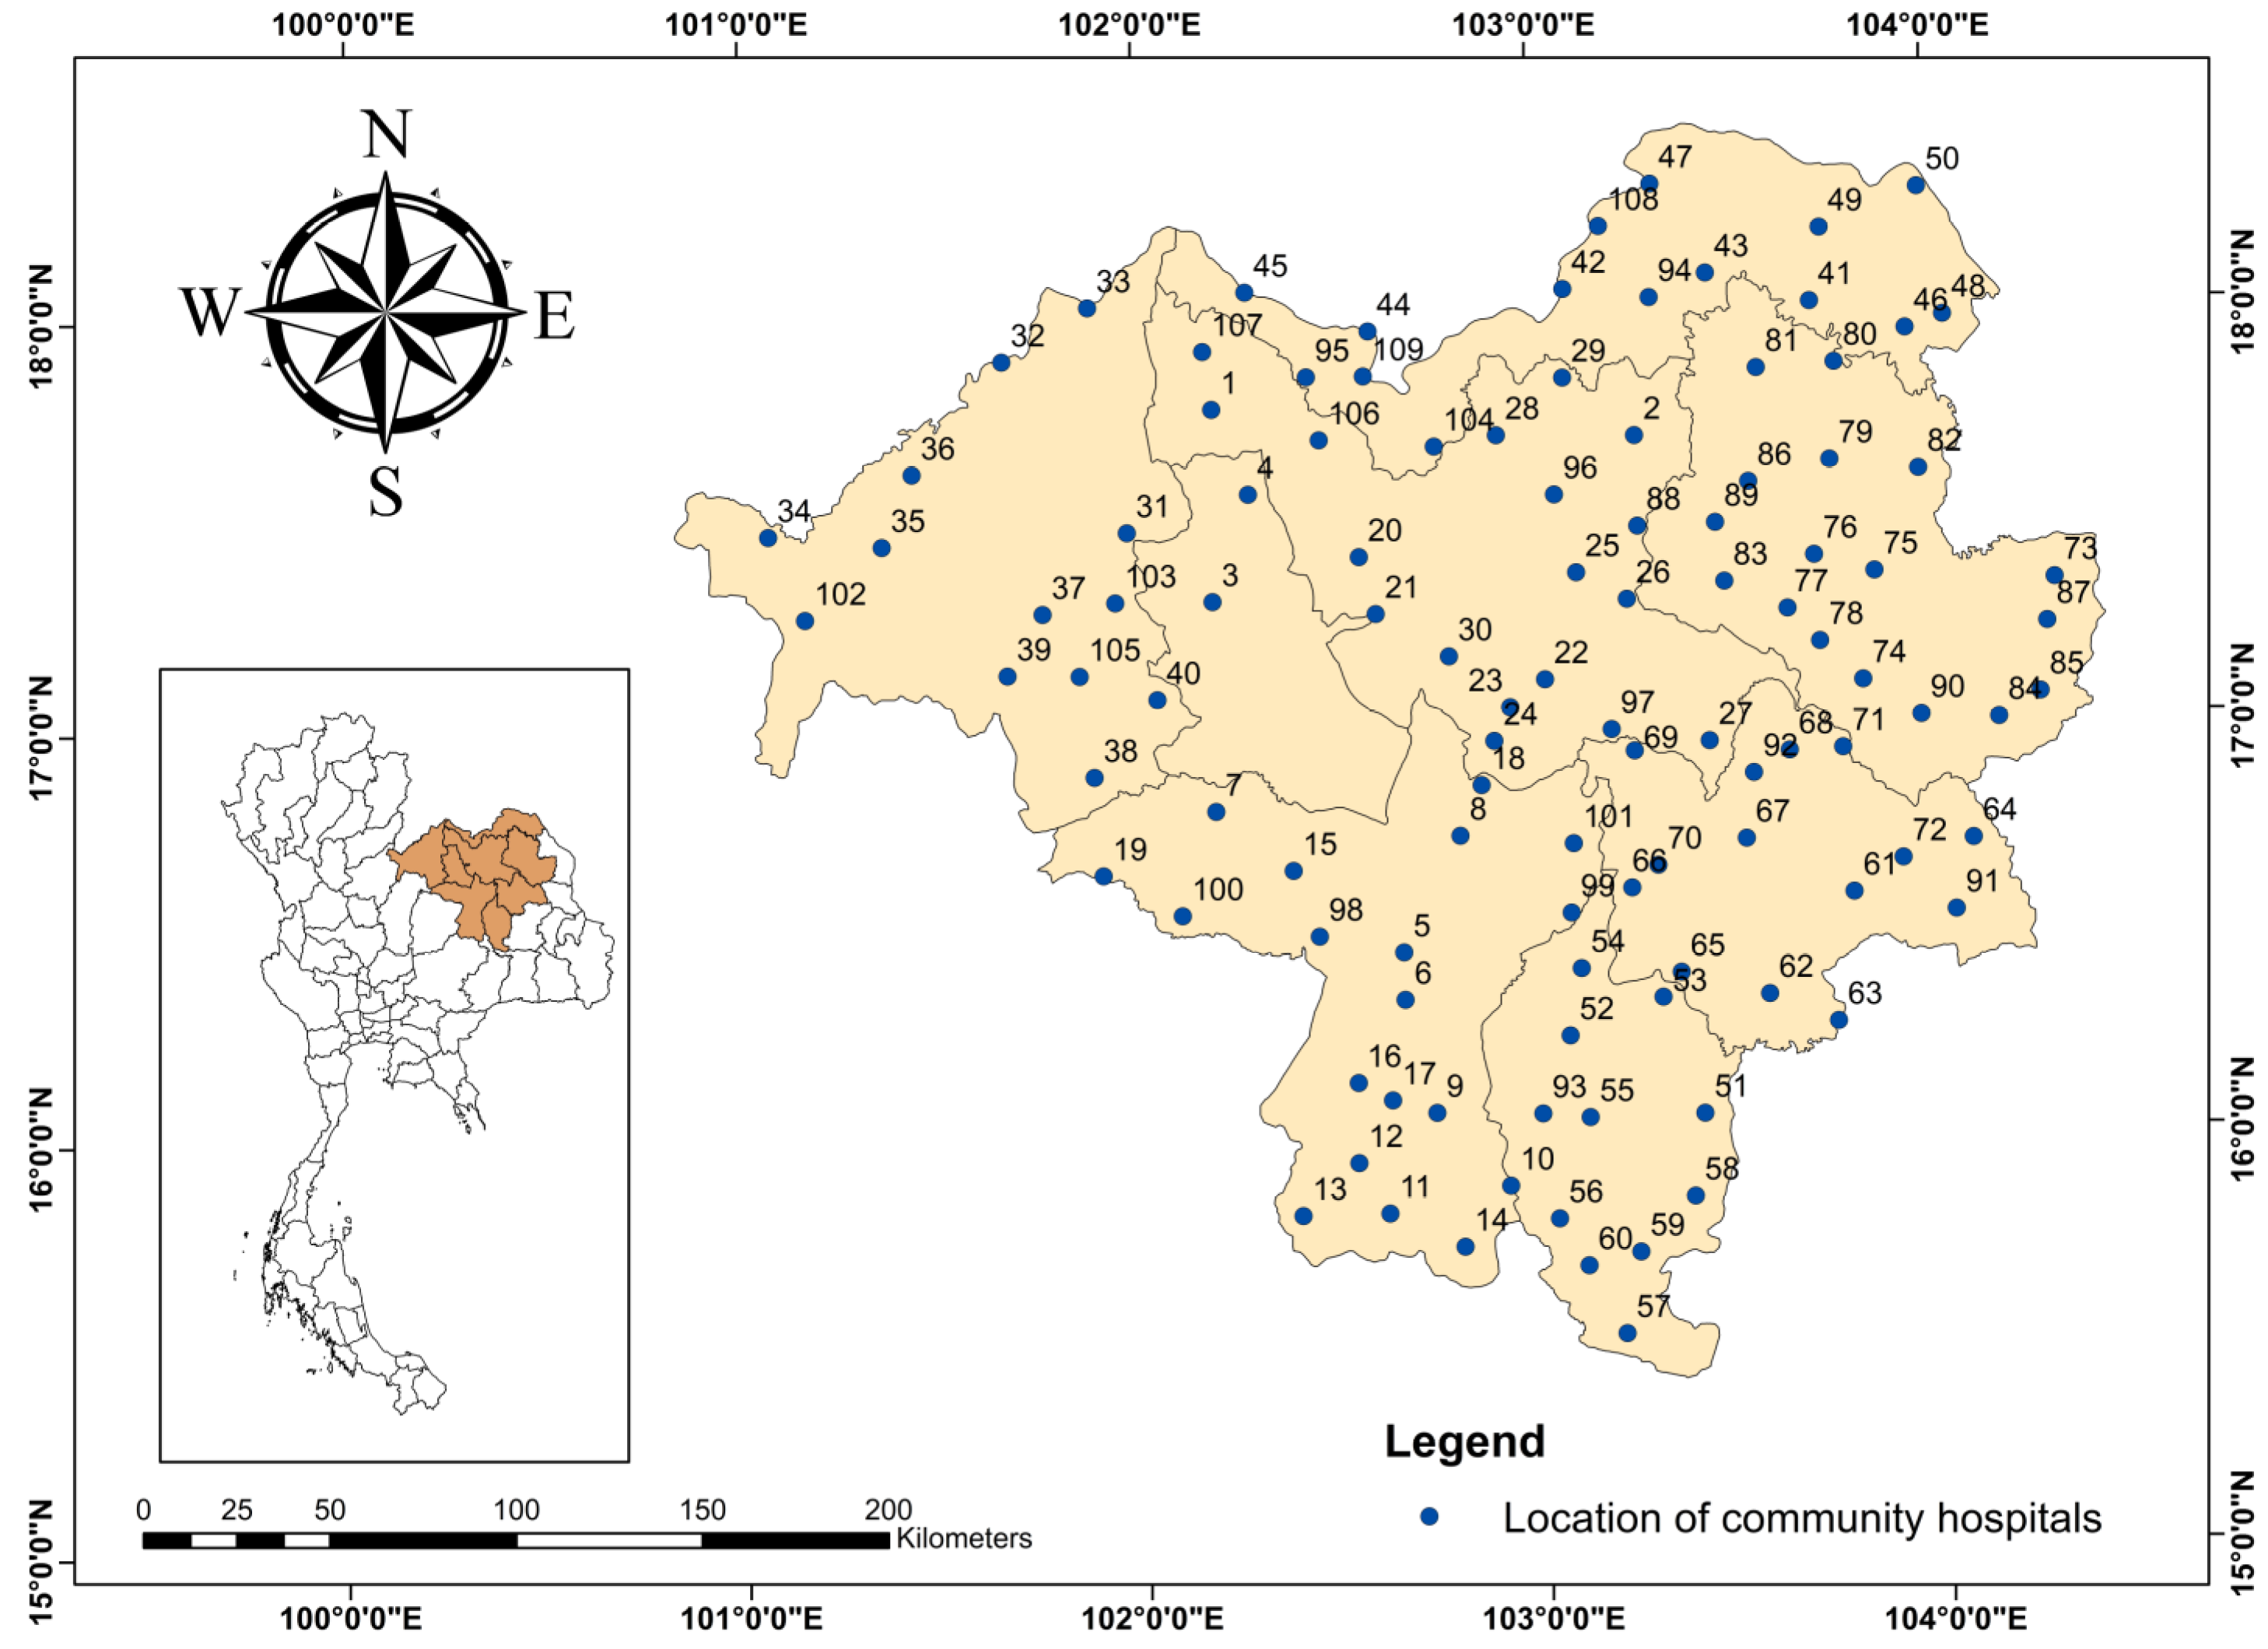
3.1.1. Data Collection
3.1.2. Information about Infectious Waste Incinerators
3.1.3. Transport Information for Infectious Waste
- The distance to each hospital uses the latitude and longitude of the hospital location, to be processed via Google Map. The distance is in kilometers.
- The vehicles used to collect infectious waste from each hospital use six-wheel trucks. The average speed of the truck is 60 km/h. The work time of the garbage collector is 12 h/day (including a 1 h break).
- The cost of transporting infectious waste is 5 THB/km, and the average weight of the infectious waste is 60 kg/bin.
- The average waste collection time is 2 min/bin, and the average service time is 10 min/time at each community hospital.
3.2. The Mathematical Model for the Problem of Size Selection and Location of the Infectious Waste Incinerators
4. Differential Evolution (DE) Algorithm
4.1. Initialization of Vectors
4.2. Mutation
4.3. Recombination
4.4. Selection
| Algorithm 1 Pseudo-Code of Differential Evolution Algorithm |
| 1: Set Iterations, Number of Vectors, , CR 2: Generate Initial Solution |
| 3: For i = 1 to Number of Vectors 4: random number between 0 and 1 5: random number between 0 and 1 6: random number between 0 and 1 7: Target vector solution, calculate objective function and update best solution 8: End for 9: For G = 1 to Max Iteration 10: Mutation 11: For i = 1 to Number of Vectors 12: 13: 14: 15: Mutant vector solution, calculate objective function and update best solution 16: End for 17: Recombination 18: For i = 1 to Number of Vectors 19: 20: 21: 22: Trial vector solution, calculate objective function and update best solution 23: End for 24: Selection 25: For i = 1 to Number of Vectors 26: 27: End for 28: End for |
| 29: Return best solution |
5. Results
5.1. Solving Problems with Mathematical Models
5.2. Case Study
6. Conclusions and Discussion
Author Contributions
Funding
Data Availability Statement
Conflicts of Interest
References
- Pharino, C. Infectious Waste Management in Thailand. In Challenges for Sustainable Solid Waste Management: Lessons from Thailand; Springer: Singapore, 2017; pp. 77–91. [Google Scholar]
- Miyazaki, M.; Une, H. Infectious waste management in Japan: A revised regulation and a management process in medical institutions. Waste Manag. 2005, 25, 616–621. [Google Scholar] [CrossRef] [PubMed]
- Overview of the Situation of Infectious Waste Management in Thailand. Available online: https://envmanifest.anamai.moph.go.th/?summary_year_list (accessed on 30 May 2022).
- Chummuel, C.; Pianthong, N.; Seabsiri, K. Investigation of Community Hospitals Infectious Waste Disposal in Upper Northeastern Region. UBU Eng. J. 2009, 2, 26–34. [Google Scholar]
- Nazari, A.; Salarirad, M.M.; Bazzazi, A.A. Landfill site selection by decision-making tools based on fuzzy multi-attribute decision-making method. Environ. Earth Sci. 2011, 65, 1631–1642. [Google Scholar] [CrossRef]
- Sresanpila, P.; Sindhuchao, S. A Heuristic for Solving the Location and Incinerator Selection Problem: A Case Study of Elimination of Infectious Waste of Community Hospitals in the Upper Northeastern Part of Thailand. UBU Eng. J. 2018, 11, 13–24. [Google Scholar]
- Kophonrat, K.; Sindhuchao, S. Size and Location Selection of Incinerators for Infectious Waste Collection of Community Hospitals in the Upper Part of Northeast of Thailand. In Proceedings of the 8th National Conference of Industrial Operations Development 2017, Bankok, Thailand, 19 May 2017; pp. 503–510. [Google Scholar]
- Drezner, Z.; Hamacher, H.W. (Eds.) Facility Location Applications and Theory, 1st ed.; Springer: Berlin/Heidelberg, Germany, 2002. [Google Scholar]
- Farahani, R.Z.; SteadieSeifi, M.; Asgari, N. Multiple criteria facility location problems: A survey. Appl. Math. Model. 2010, 34, 1689–1709. [Google Scholar] [CrossRef]
- Gendreau, M.; Laporte, G.; Semet, F. The Covering Tour Problem. In Operations Research; Institute for Operations Research and the Management Sciences: Maryland, USA, 1997; Volume 45, pp. 568–576. [Google Scholar]
- Alumur, S.; Kara, B.Y. A new model for the hazardous waste location-routing problem. Comput. Oper. Res. 2007, 34, 1406–1423. [Google Scholar] [CrossRef] [Green Version]
- Aboutahoun, A.W.J.L.S.J. Combined distance-reliability model for hazardous waste transportation and disposal. Life Sci. J. 2012, 9, 1286–1295. [Google Scholar]
- Wichapa, N.; Khokhajaikiat, P. Solving multi-objective facility location problem using the fuzzy analytical hierarchy process and goal programming: A case study on infectious waste disposal centers. Oper. Res. Perspect. 2017, 4, 39–48. [Google Scholar] [CrossRef]
- Wichapa, N.; Khokhajaikiat, P. Solving a multi-objective location routing problem for infectious waste disposal using hybrid goal programming and hybrid genetic algorithm. Int. J. Ind. Eng. Comput. 2018, 9, 75–98. [Google Scholar] [CrossRef]
- Suksee, S.; Sindhuchao, S. GRASP with ALNS for solving the location routing problem of infectious waste collection in the Northeast of Thailand. Int. J. Ind. Eng. Comput. 2021, 12, 305–320. [Google Scholar] [CrossRef]
- Rabe, M.; Gonzalez-Feliu, J.; Chicaiza-Vaca, J.; Tordecilla, R.D. Simulation-Optimization Approach for Multi-Period Facility Location Problems with Forecasted and Random Demands in a Last-Mile Logistics Application. Algorithms 2021, 14, 41. [Google Scholar] [CrossRef]
- Němec, P.; Stodola, P.; Pecina, M.; Neubauer, J.; Blaha, M. Optimization of the Weighted Multi-Facility Location Problem Using MS Excel. Algorithms 2021, 14, 191. [Google Scholar] [CrossRef]
- Yu, V.F.; Aloina, G.; Susanto, H.; Effendi, M.K.; Lin, S.-W. Regional Location Routing Problem for Waste Collection Using Hybrid Genetic Algorithm-Simulated Annealing. Mathematics 2022, 10, 2131. [Google Scholar] [CrossRef]
- Storn, R.; Price, K. Differential evolution—A simple and efficient heuristic for global optimization over continuous spaces. J. Glob. Optim. 1997, 11, 341–359. [Google Scholar] [CrossRef]
- Qin, A.K.; Huang, V.L.; Suganthan, P.N. Differential Evolution Algorithm With Strategy Adaptation for Global Numerical Optimization. IEEE Trans. Evol. Comput. 2009, 13, 398–417. [Google Scholar] [CrossRef]
- Chiang, C.-W.; Lee, W.-P.; Heh, J.-S. A 2-Opt based differential evolution for global optimization. Appl. Soft Comput. 2010, 10, 1200–1207. [Google Scholar] [CrossRef]
- Pitakaso, R.; Parawech, P.; Jirasirierd, G. Comparisons of Different Mutation and Recombination Processes of the DEA for SALB--1. In Proceedings of the Institute of Industrial Engineers Asian Conference 2013, Taipei, Taiwan, 18–20 July 2013; pp. 1571–1579. [Google Scholar]
- Zhu, W.; Tang, Y.; Fang, J.-A.; Zhang, W. Adaptive population tuning scheme for differential evolution. Inf. Sci. 2013, 223, 164–191. [Google Scholar] [CrossRef]
- Sethanan, K.; Pitakaso, R. Improved differential evolution algorithms for solving generalized assignment problem. Expert Syst. Appl. 2016, 45, 450–459. [Google Scholar] [CrossRef]
- Epitropakis, M.; Plagianakos, V.; Vrahatis, M. Evolving cognitive and social experience in Particle Swarm Optimization through Differential Evolution: A hybrid approach. Inf. Sci. 2012, 216, 50–92. [Google Scholar] [CrossRef] [Green Version]
- Miranda, V.; Alves, R. Differential Evolutionary Particle Swarm Optimization (DEEPSO): A Successful Hybrid. In Proceedings of the 2013 BRICS Congress on Computational Intelligence and 11th Brazilian Congress on Computational Intelligence, Ipojuca, Brazil, 8–11 September 2013; IEEE: New York, NY, USA, 2013; pp. 368–374. [Google Scholar]
- Sedki, A.; Ouazar, D. Hybrid particle swarm optimization and differential evolution for optimal design of water distribution systems. Adv. Eng. Informatics 2012, 26, 582–591. [Google Scholar] [CrossRef]
- Thongdee, T.; Pitakaso, R. Differential Evolution Algorithms Solving a Multi-Objective, Source and Stage Location-Allocation Problem. Ind. Eng. Manag. Syst. 2015, 14, 11–21. [Google Scholar] [CrossRef] [Green Version]
- Olenšek, J.; Tuma, T.; Puhan, J.; Bűrmen, Á. A new asynchronous parallel global optimization method based on simulated annealing and differential evolution. Appl. Soft Comput. 2011, 11, 1481–1489. [Google Scholar] [CrossRef]
- Zhao, X.; Lin, W.; Yu, C.; Chen, J.; Wang, S. A new hybrid differential evolution with simulated annealing and self-adaptive immune operation. Comput. Math. Appl. 2013, 66, 1948–1960. [Google Scholar] [CrossRef]
- Suksee, S.; Sindhuchao, S. Selection of locations and incinerators for infectious waste of hospitals in Northeastern Thailand. UBU Eng. J. 2021, 14, 48–57. [Google Scholar]


| Information | Infectious Waste Incinerator | ||
|---|---|---|---|
| Type 1 | Type 2 | Type 3 | |
| Price (THB) | 1,995,000 | 3,745,000 | 10,165,000 |
| Maximum Burning Rate (kg/hour) | 100 | 300 | 600 |
| Service Life (Years) | 10 | 10 | 10 |
| Characteristics of Each Type of Infectious Waste Incinerator | Type 1 | Type 2 | Type 3 |
|---|---|---|---|
| Incinerator Maintenance Fee (THB/Hour) | 53 | 90 | 128 |
| Utility Bills (THB/Hour) | 107 | 135 | 183 |
| Fuel Cost for Burning (THB/Hour) | 210 | 329 | 607 |
| Cost of Incineration of Infectious Waste (THB/Hour) | 370 | 554 | 918 |
| Depreciation (THB/Month) * | 16,397 | 30,781 | 83,548 |
| Employee Wages (THB/Month) ** | 31,500 | 31,500 | 31,500 |
| Fixed Cost of Incinerator Operation (THB/Month) | 47,897 | 62,281 | 115,048 |
| Vector Sets | Coordinates (Community Hospitals) | |||||
|---|---|---|---|---|---|---|
| 1 | 2 | 3 | … | 108 | 109 | |
| X1 | 0.78 | 0.45 | 0.2 | … | 0.52 | 0.15 |
| X2 | 0.8 | 0.91 | 0.85 | … | 0.81 | 0.35 |
| X3 | 0.1, 0.85, 0.43 | 0.58, 0.24, 0.9 | 0.33, 0.18, 0.75 | … | 0.65, 0.2, 0.88 | 0.45, 0.31, 0.9 |
| Vector Set | Coordinate | |||||
|---|---|---|---|---|---|---|
| 1 | 2 | 3 | … | 108 | 109 | |
| 0.78 | 0.45 | 0.2 | … | 0.52 | 0.15 | |
| 0.45 | 0.11 | 0.95 | … | 1.25 | 0.84 | |
| Random | 0.56 | 0.9 | 0.73 | … | 0.15 | 0.98 |
| 0.45 | 0.45 | 0.95 | … | 1.25 | 0.15 | |
| Parameter | Configure the Relevant Parameters |
|---|---|
| 1. Maximum Iterations | 1000 |
| 2. Number of Vectors | Four times the number of hospitals |
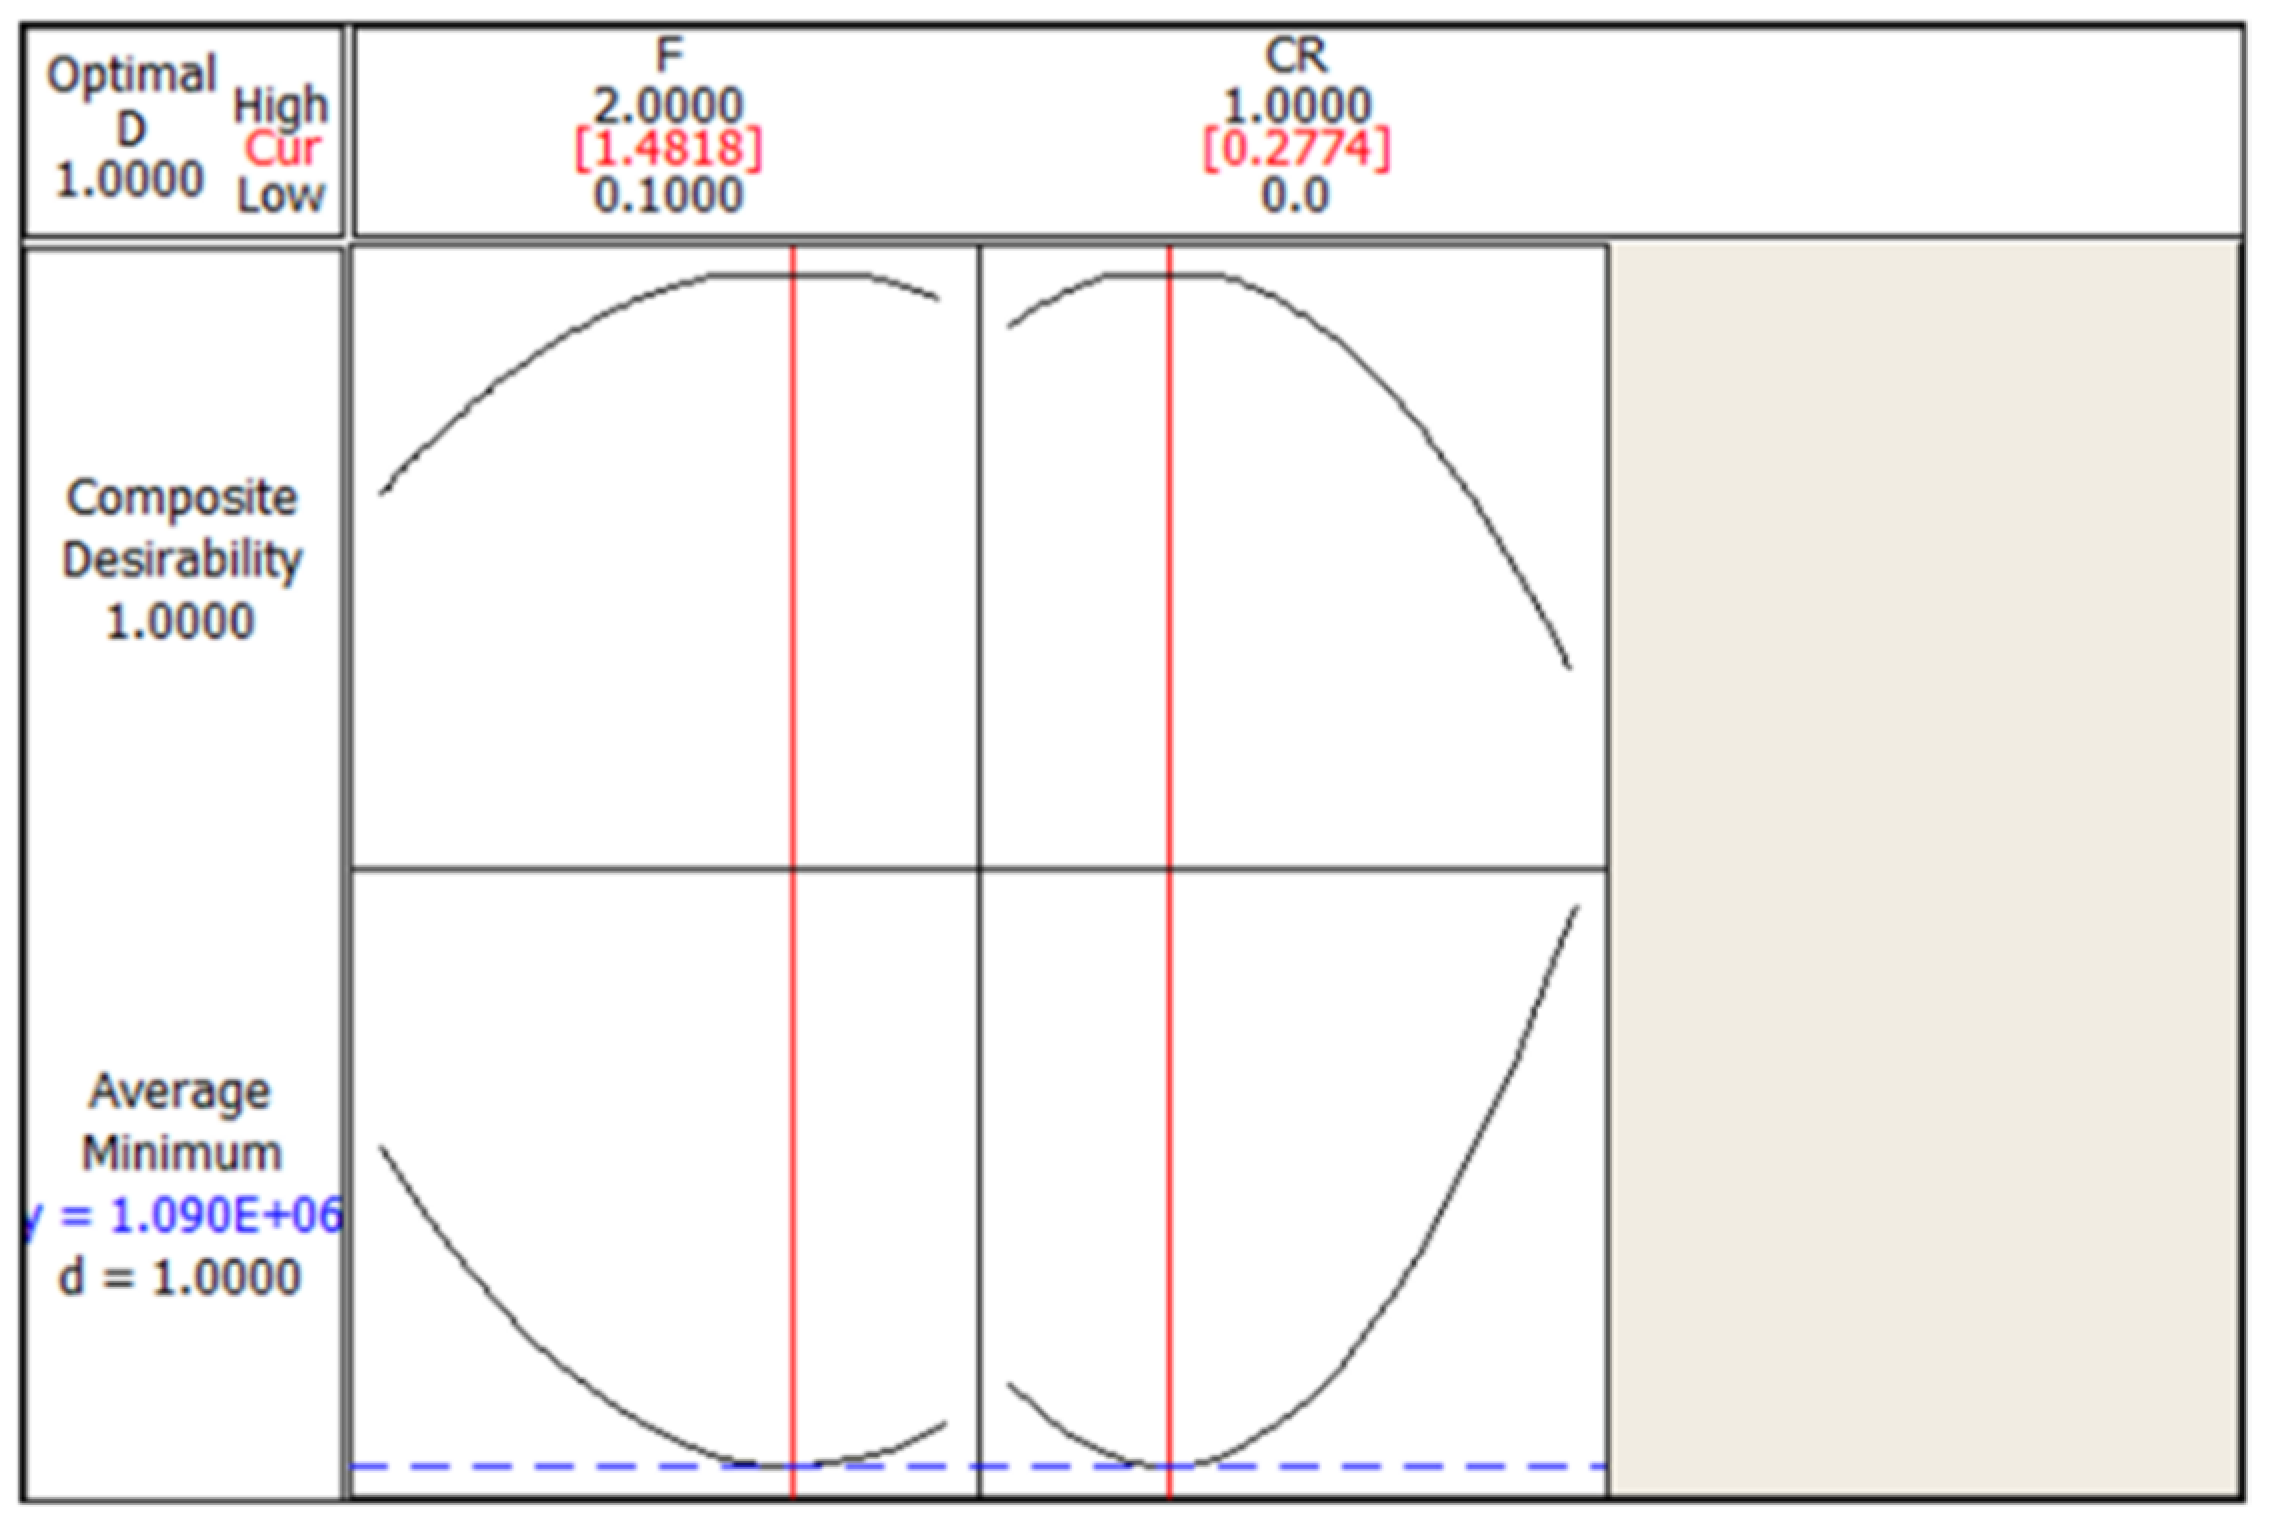
| 3. Scaling Factor: | 1.4818 |
| 4. CR | 0.2774 |
| Instance | Lingo—Original Mathematical Model | DE | Lingo—Modified Mathematical Model | |||||
|---|---|---|---|---|---|---|---|---|
| Status | Total Cost (THB/Month) | Processing Time(s) | Best Total Cost (THB/Month) | Best Processing Time(s) | Status | Total Cost (THB/Month) | Processing Time(s) | |
| 1 | Local Optimal | 632,639 | 58 | 610,504 | 17.292 | Global Optimal | 610,504 | 15 |
| 2 | Local Optimal | 742,170.6 | 53 | 699,410.6 | 4.984 | Global Optimal | 699,410.6 | 8 |
| 3 | Local Optimal | 672,856.7 | 55 | 641,236.7 | 16.636 | Global Optimal | 641,236.7 | 7 |
| 4 | Local Optimal | 758,315 | 50 | 723,335 | 4.296 | Global Optimal | 723,335 | 18 |
| 5 | Local Optimal | 746,705 | 60 | 707,319.96 | 1.937 | Global Optimal | 707,319.96 | 25 |
| 6 | Local Optimal | 671,182.9 | 59 | 659,862.9 | 40.827 | Global Optimal | 659,862.9 | 5 |
| 7 | Local Optimal | 636,229.8 | 51 | 595,729.8 | 22.726 | Global Optimal | 595,729.8 | 31 |
| 8 | Local Optimal | 668,438.1 | 63 | 620,997.6 | 14.71 | Global Optimal | 620,997.6 | 21 |
| 9 | Local Optimal | 715,228.6 | 51 | 682,633.6 | 50.261 | Global Optimal | 682,633.6 | 33 |
| 10 | Local Optimal | 719,170.1 | 57 | 617,558.4 | 12.681 | Global Optimal | 617,558.4 | 31 |
| Instance | Total Cost | Processing Time | ||
|---|---|---|---|---|
| DE | Lingo—Modified Mathematical Model | DE | Lingo—Modified Mathematical Model | |
| 1 | −3.50 | −3.50 | −70.19 | −74.14 |
| 2 | −5.76 | −5.76 | −90.60 | −84.91 |
| 3 | −4.70 | −4.70 | −69.75 | −87.27 |
| 4 | −4.61 | −4.61 | −91.41 | −64.00 |
| 5 | −5.27 | −5.27 | −96.77 | −58.33 |
| 6 | −1.69 | −1.69 | −30.80 | −91.53 |
| 7 | −6.37 | −6.37 | −55.44 | −39.22 |
| 8 | −7.10 | −7.10 | −76.65 | −66.67 |
| 9 | −4.56 | −4.56 | −1.45 | −35.29 |
| 10 | −14.13 | −14.13 | −77.75 | −45.61 |
| Average | −5.77 | −5.77 | −66.08 | −64.70 |
| Detail | p-Value |
|---|---|
| Processing Time | 0.895 |
| Instance | Number of Hospital | Result from Lingo | Result from DE | Difference in Total Cost (%) | |||
|---|---|---|---|---|---|---|---|
| Status | Total Cost (THB/Month) | Processing Time(s) | Best Total Cost (THB/Month) | Best Processing Time(s) | |||
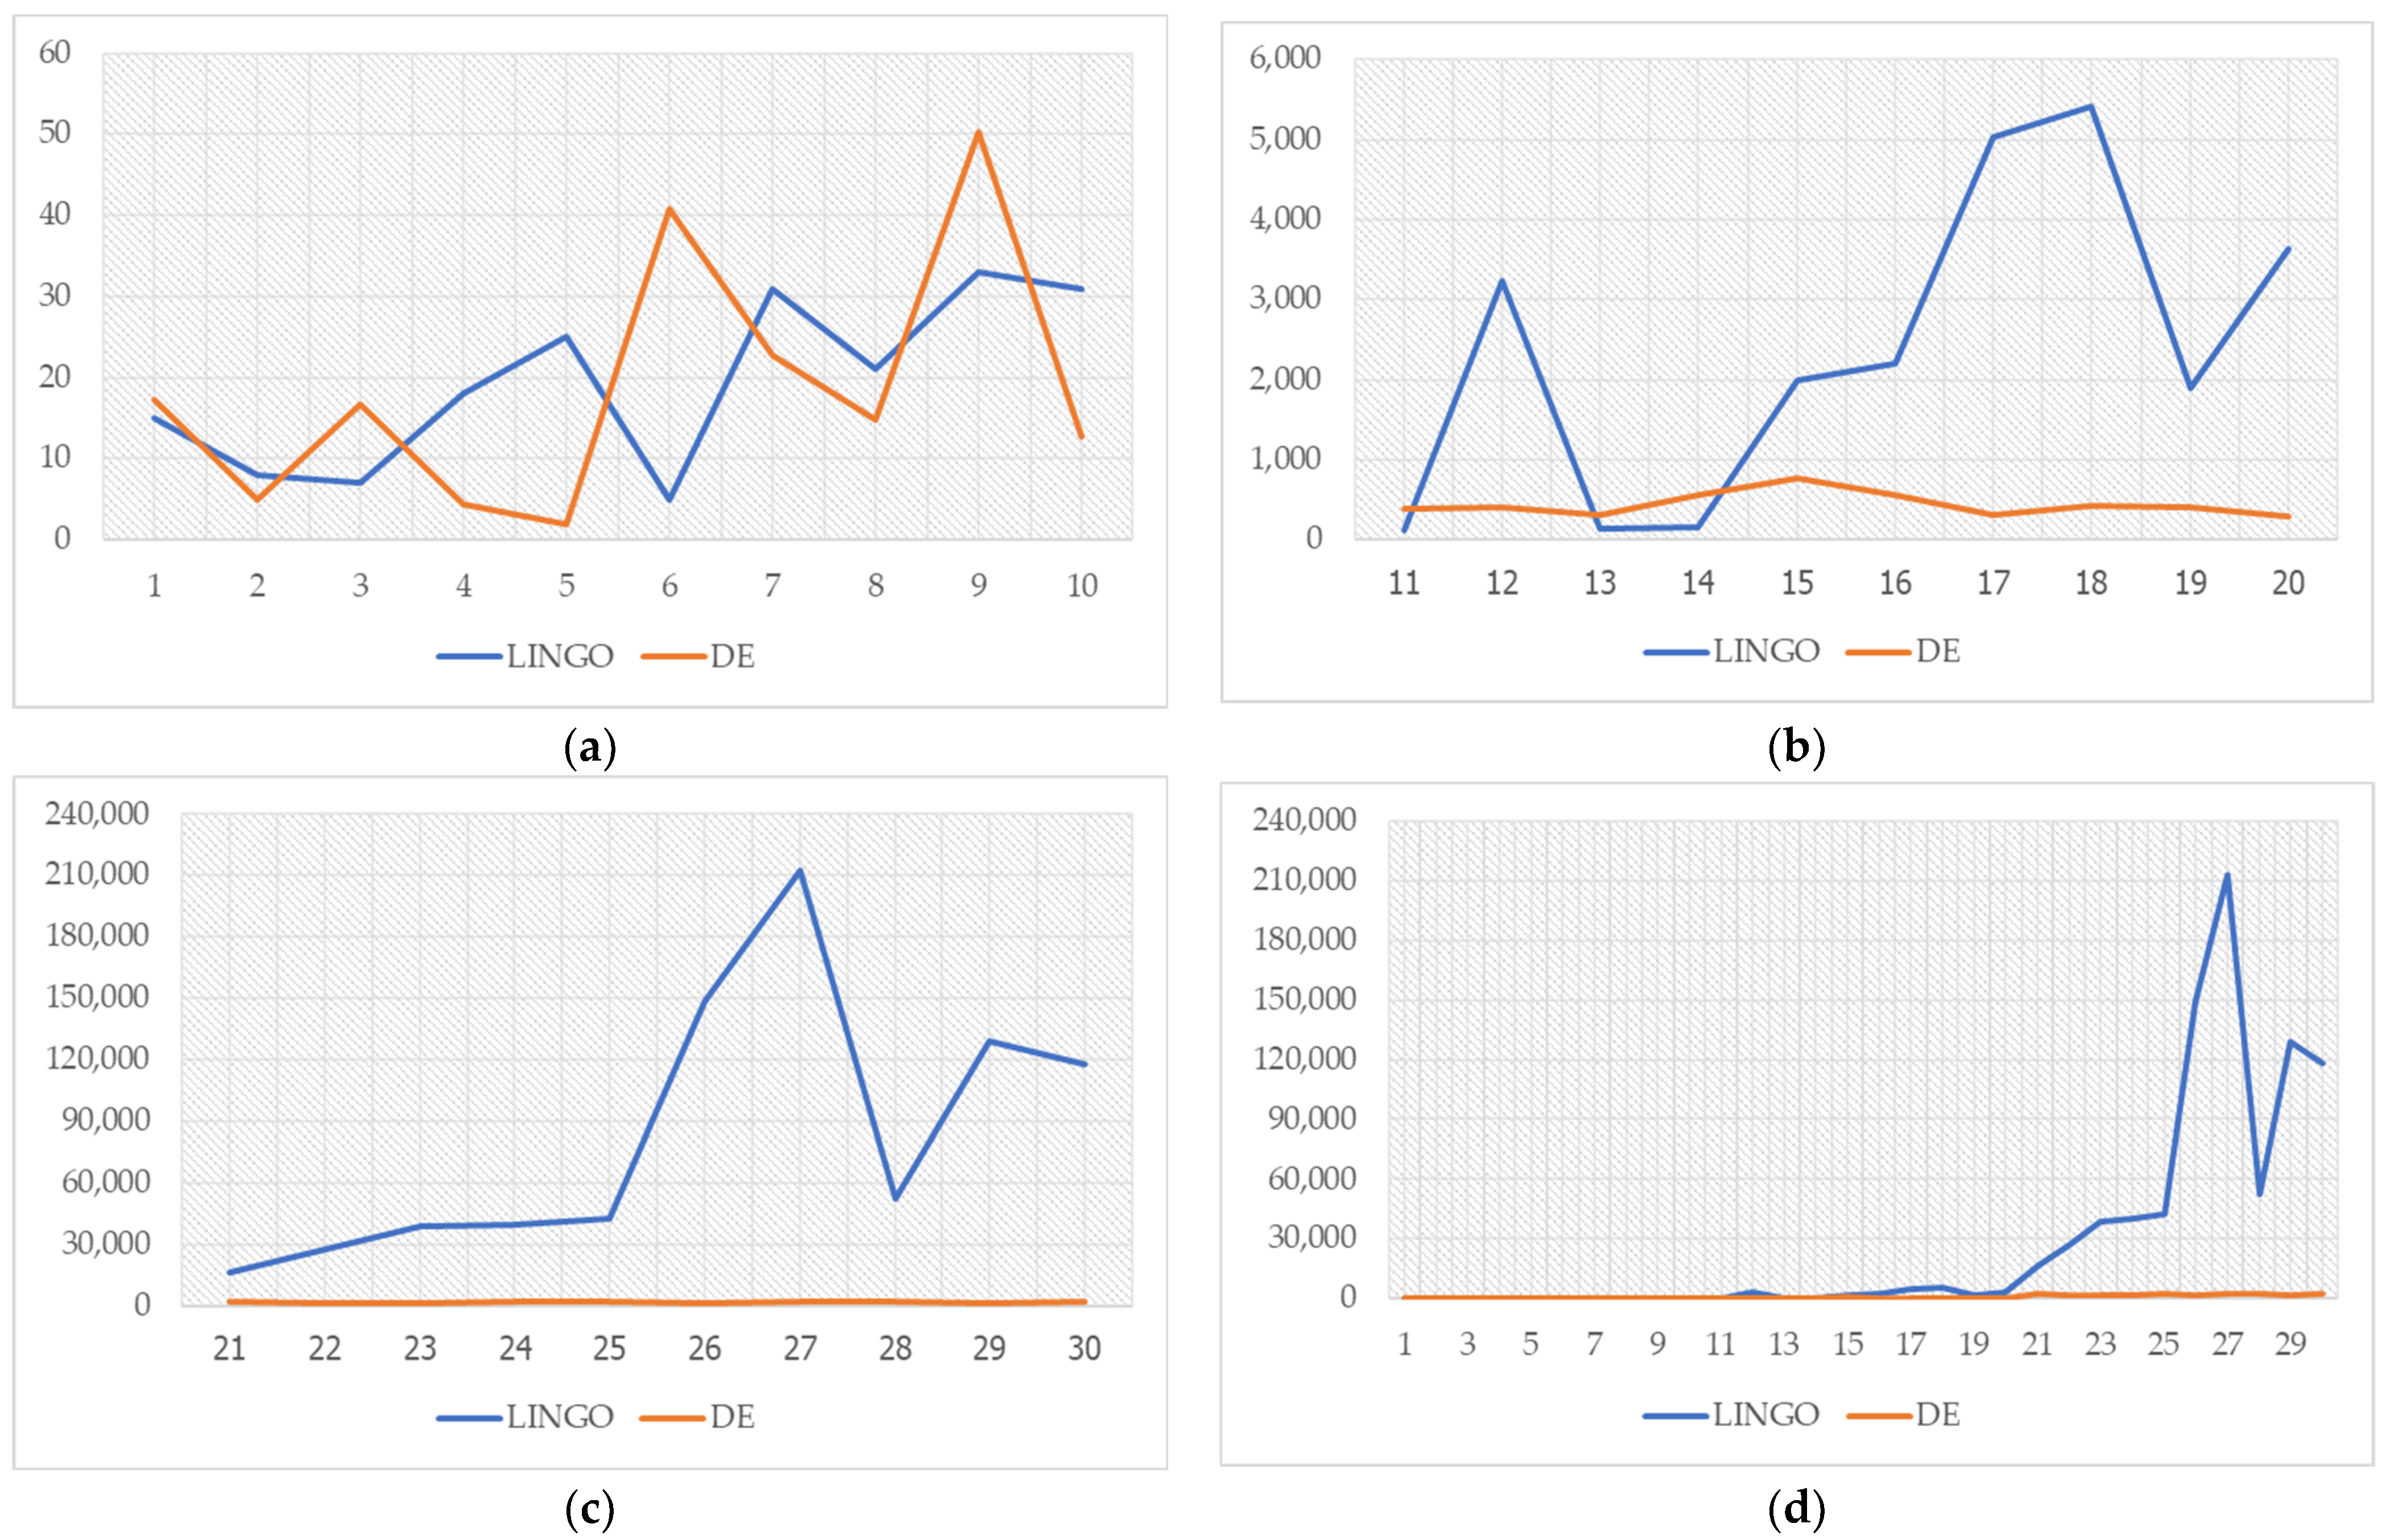
| 1 | 50 | Global optimal | 610,504 | 15 | 610,504 | 17.292 | 0.0000 |
| 2 | 50 | Global optimal | 699,410.6 | 8 | 699,410.6 | 4.984 | 0.0000 |
| 3 | 50 | Global optimal | 641,236.7 | 7 | 641,236.7 | 16.636 | 0.0000 |
| 4 | 50 | Global optimal | 723,335 | 18 | 723,335 | 4.296 | 0.0000 |
| 5 | 50 | Global optimal | 707,319.96 | 25 | 707,319.96 | 1.937 | 0.0000 |
| 6 | 50 | Global optimal | 659,862.9 | 5 | 659,862.9 | 40.827 | 0.0000 |
| 7 | 50 | Global optimal | 595,729.8 | 31 | 595,729.8 | 22.726 | 0.0000 |
| 8 | 50 | Global optimal | 620,997.6 | 21 | 620,997.6 | 14.71 | 0.0000 |
| 9 | 50 | Global optimal | 682,633.6 | 33 | 682,633.6 | 50.261 | 0.0000 |
| 10 | 50 | Global optimal | 617,558.4 | 31 | 617,558.4 | 12.681 | 0.0000 |
| 11 | 100 | Global optimal | 1,078,002 | 124 | 1,078,002 | 392.462 | 0.0000 |
| 12 | 100 | Global optimal | 1,095,953 | 3,239 | 1,095,953 | 412.25 | 0.0000 |
| 13 | 100 | Global optimal | 1,070,054 | 143 | 1,070,054 | 299.107 | 0.0000 |
| 14 | 100 | Global optimal | 1,108,291 | 161 | 1,108,291 | 554.625 | 0.0000 |
| 15 | 100 | Global optimal | 1,074,216.07 | 1,986 | 1,074,216.07 | 761.654 | 0.0000 |
| 16 | 100 | Global optimal | 1,050,140 | 2,210 | 1,050,140 | 558.452 | 0.0000 |
| 17 | 100 | Global optimal | 1,081,190 | 5,033 | 1,081,190 | 307.007 | 0.0000 |
| 18 | 100 | Global optimal | 1,112,685 | 5,420 | 1,112,685 | 428.688 | 0.0000 |
| 19 | 100 | Global optimal | 1,106,656 | 1,900 | 1,106,656 | 401.476 | 0.0000 |
| 20 | 100 | Global optimal | 1,071,397 | 3,637 | 1,071,397 | 283.793 | 0.0000 |
| 21 | 150 | Global optimal | 1,469,615 | 16,556 | 1,469,615 | 2,315.933 | 0.0000 |
| 22 | 150 | Global optimal | 1,467,808 | 27,258 | 1,467,808 | 1505.632 | 0.0000 |
| 23 | 150 | Global optimal | 1,526,718 | 38,603 | 1,526,718 | 1674.715 | 0.0000 |
| 24 | 150 | Global optimal | 1,535,098 | 40,011 | 1,535,098 | 2,031.46 | 0.0000 |
| 25 | 150 | Global optimal | 1,432,549 | 42,911 | 1,432,549 | 2,272.94 | 0.0000 |
| 26 | 150 | Global optimal | 1,511,526 | 148,775 | 1,511,526 | 1672.97 | 0.0000 |
| 27 | 150 | Global optimal | 1,508,135 | 212,837 | 1,508,135 | 2165.418 | 0.0000 |
| 28 | 150 | Global optimal | 1,450,927 | 52,503 | 1,450,927 | 2157.674 | 0.0000 |
| 29 | 150 | Global optimal | 1,444,293 | 128,805 | 1,444,293 | 1552.48 | 0.0000 |
| 30 | 150 | Global optimal | 1,465,037 | 117,992 | 1,465,037 | 2382.795 | 0.0000 |
| Case study | 109 | Global optimal | 569,562.66 | 105 | 569,562.66 | 11.928 | 0.0000 |
| Null Hypotheses | Alternative Hypotheses | p-Value |
|---|---|---|
| 0.008 | ||
| 0.004 |
| Method | Status | Total Cost (THB/Month) | Difference in Total Cost with Optimal Solution (%) |
|---|---|---|---|
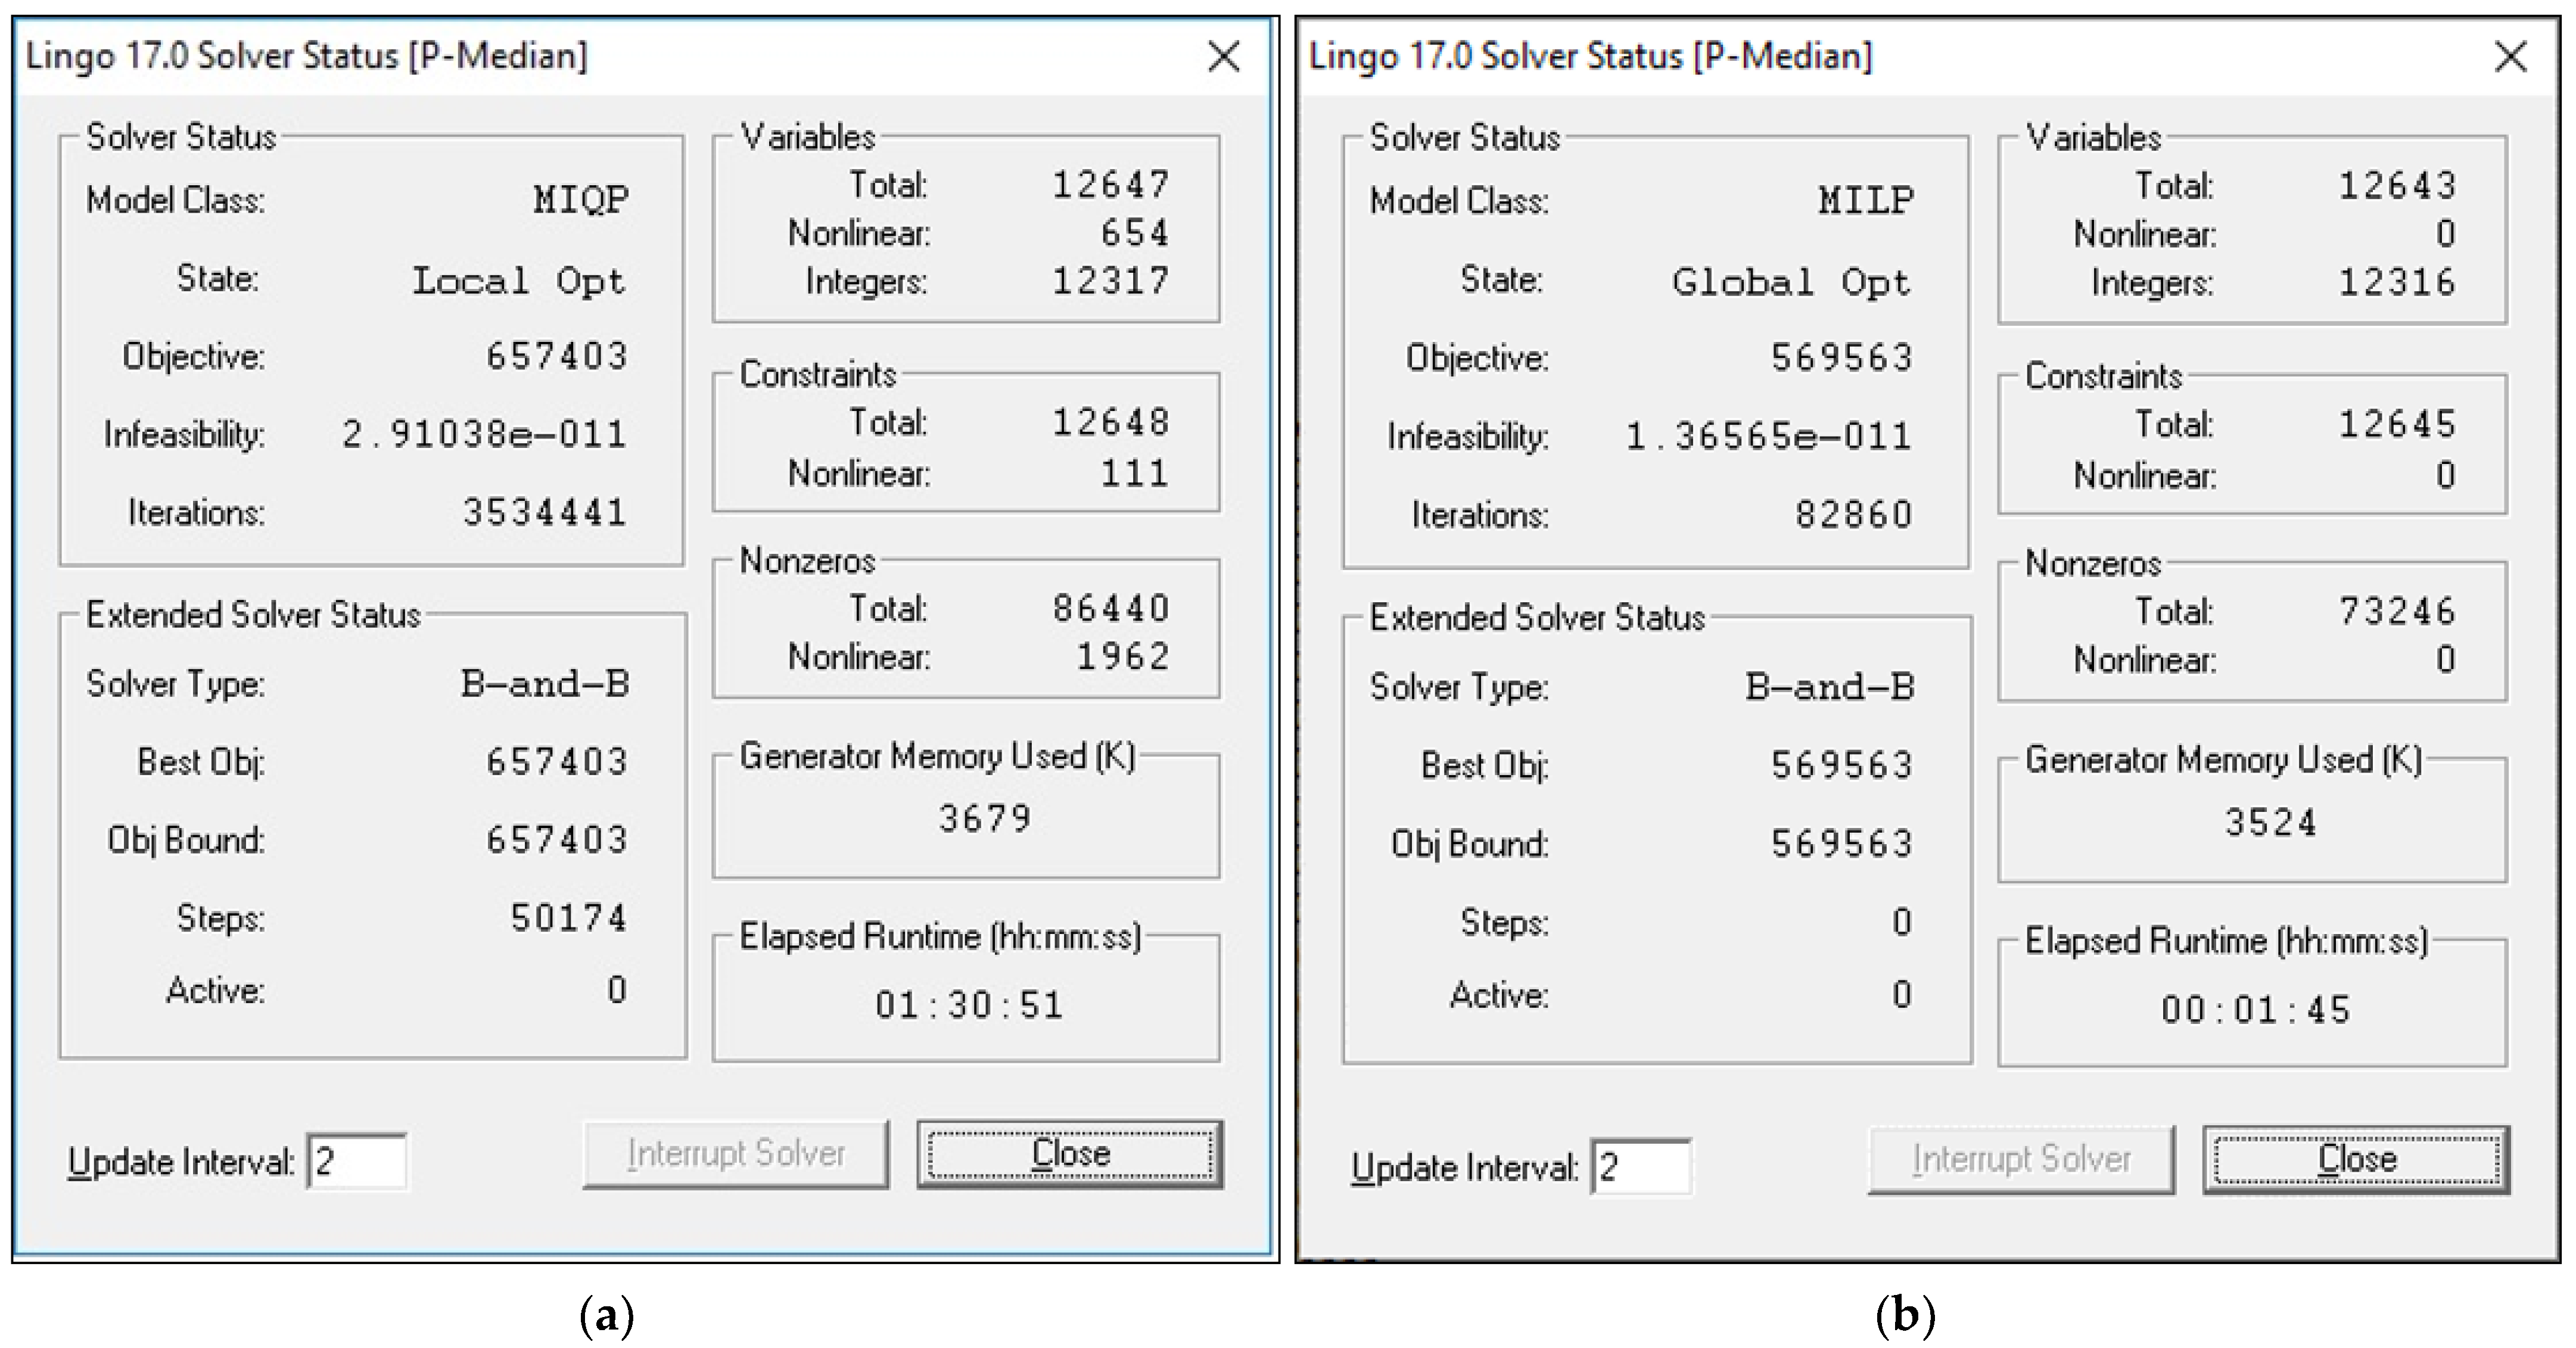
| Original mathematical model by Lingo [6] | Local Optimal | 657,402.66 | 13.36 |
| Particle Swarm Optimization (PSO) [6] | - | 588,298 | 3.18 |
| Iterated Local Search (ILS) [7] | - | 570,183 | 0.11 |
| Mathematical model (Linear) by Lingo | Global Optimal | 569,562.66 | 0.00 |
| Differential Evolution (DE) | - | 569,562.66 | 0.00 |
| Suitable disposal Facilities | Hospitals | Type of Incinerator | Burning Time (Hour/Month) | Total Cost (THB/month) |
|---|---|---|---|---|
| P25 | H1, H2, H3, H4, H7, H18, H20, H21, H22, H23, H24, H25, H26, H27, H28, H29, H30, H31, H32, H33, H34, H35, H36, H37, H38, H39, H40, H41, H42, H43, H44, H45, H46, H47, H48, H49, H50, H68, H69, H73, H74, H75, H76, H77, H78, H79, H80, H81, H82, H83, H84, H85, H86, H87, H88, H89, H90, H92, H94, H95, H96, H97, H102, H103, H104, H105, H106, H107, H108, H109 (70 hospitals) | 300 Kg/Hr. | 209.75 | 569,562.66 |
| P52 | H5, H6, H8, H9, H10, H11, H12, H13, H14, H15, H16, H17, H19, H51, H52, H53, H54, H55, H56, H57, H58, H59, H60, H61, H62, H63, H64, H65, H66, H67, H70, H71, H72, H91, H93, H98, H99, H100, H101 (39 hospitals) | 300 Kg/Hr. | 150.54 |
Disclaimer/Publisher’s Note: The statements, opinions and data contained in all publications are solely those of the individual author(s) and contributor(s) and not of MDPI and/or the editor(s). MDPI and/or the editor(s) disclaim responsibility for any injury to people or property resulting from any ideas, methods, instructions or products referred to in the content. |
© 2023 by the authors. Licensee MDPI, Basel, Switzerland. This article is an open access article distributed under the terms and conditions of the Creative Commons Attribution (CC BY) license (https://creativecommons.org/licenses/by/4.0/).
Share and Cite
Srisuwandee, T.; Sindhuchao, S.; Srisuwandee, T. The Differential Evolution Algorithm for Solving the Problem of Size Selection and Location of Infectious Waste Incinerator. Computation 2023, 11, 10. https://doi.org/10.3390/computation11010010
Srisuwandee T, Sindhuchao S, Srisuwandee T. The Differential Evolution Algorithm for Solving the Problem of Size Selection and Location of Infectious Waste Incinerator. Computation. 2023; 11(1):10. https://doi.org/10.3390/computation11010010
Chicago/Turabian StyleSrisuwandee, Thitiworada, Sombat Sindhuchao, and Thitinon Srisuwandee. 2023. "The Differential Evolution Algorithm for Solving the Problem of Size Selection and Location of Infectious Waste Incinerator" Computation 11, no. 1: 10. https://doi.org/10.3390/computation11010010