
Experimental vs. Numerical Computation of Acoustic Analyses on the Thickness Influence of the Multilayer Panel

Department of Mechanics, University POLITEHNICA of Bucharest, 060042 Bucharest, Romania
*
Author to whom correspondence should be addressed.
Computation 2023, 11(1), 1; https://doi.org/10.3390/computation11010001
Submission received: 21 November 2022
/
Revised: 12 December 2022
/
Accepted: 14 December 2022
/
Published: 20 December 2022
(This article belongs to the Special Issue Selected Papers from the 10th International Conference from Scientific Computing to Computational Engineering (IC-SCCE 2022))
Abstract
:Sound-absorbing panels made with a perforated front and a sound-absorbing material on the back have been used in many forms of construction for a long time. It is a reasonably efficient system, obtaining high values of sound absorption at a specific resonant frequency, depending on the design of the structure of the sound-absorbing multilayer panel. The present work considers an acoustic panel in two constructive types, consisting of four layers: a front panel made of perforated sheet, polyethylene foam foil, basalt wool board with two different thicknesses, and a back panel of the non-perforated sheet. Due to the different thicknesses of the basalt wool board, for the multilayer structure of the acoustic panel, differences in acoustic impedance and acoustic absorption can be highlighted, experimentally determined with an impedance tube, using the transfer function method (TFM) based on EN ISO 10534-2 in the frequency range 100–3200 Hz. In the meantime, a method was developed to predict the sound absorption coefficient, namely the prediction of sound absorption coefficient using the transfer matrix method (PSAC-TMM). This computational model of the multilayer acoustic panel is introduced considering the internal geometry of the multilayer panel, as well as the computation of the acoustic impedance of each layer, all gathered through the transfer matrix method (TMM). Comparative analyses between experimental data and predictive results using PSAC-TMM were performed, validating the PSAC-TMM as a predictive method to estimate the sound absorption coefficient for acoustic multilayer panels.
1. Introduction
Knowledge of sound-absorbing materials and their structures is essential for noise control. Without this knowledge, effective noise control becomes more a matter of chance than intelligent design [1].
There is a wide range of sound-absorbing materials whose properties depend on frequency, absorption composition, thickness, surface finish, and mounting method. However, materials with a high absorption coefficient are usually porous [2].
The so-called composite materials, built from various combinations of materials, have wide use, increasing the sound absorption capacity.
In the case of low frequencies, Gao et al. [3] studied a teaching–learning-based optimization algorithm, where the geometric parameters were used as optimization variables. The effective-medium model and transfer-matrix method were used to calculate the sound absorption coefficient and optimize the sound absorption coefficient for high acoustic absorption.
Multilayer composites composed of ethylene–propylene–diene monomer, foams, and ethylene–propylene–diene monomer-perforated plates were proposed by Wang X.T. et al. [4] to improve sound absorption properties at medium and low frequencies. Models of composites with variable section cavities were designed, and the influence of structural parameters on the sound absorption coefficient were explored. The artificial fish swarm algorithm and improved particle swarm optimization were presented to optimize the structural parameters of the composite composed of one perforated board with variable section cavities and two foams.
The acoustic performance of a perforated plate absorber depends upon several parameters, such as the physical geometry of the absorber, acoustic spectrum, and sound pressure level of the acoustic source. Wang et al. [5] investigated and validated a porous media model, implemented as a sub-model within a CFD solver, against several well-acknowledged acoustic experiments undertaken in an impedance tube for a sound pressure wave incident typical to a perforated plate. The model expresses the underlying governing equations within the perforated plates in terms of a pseudo-physical velocity representation and demonstrates that the porous model can represent acoustic properties of perforated plate absorbers in linear and non-linear absorption regimes, the inertial effect in the presence of a mean bias flow.
Kim [6] presents a sound-absorbing structure constructed using multiple layers of fibrous papers. Layers of thin fibrous membranes (mulberry papers and coconut fibers) are spiral-shaped. Its acoustic properties changed by adjusting the thin layer’s length and density. To verify the noise reduction principle of the proposed absorber, wave propagation analysis in slits was used and compared with the measured results. To evaluate the dynamic properties of helical-shaped-sound absorbers, dynamic stiffness and loss factor were also measured and compared for each sample.
Plant fibers are materials that can increase energy savings and are being analyzed for their reduced environmental impact. Tamas-Gavrea et al. [7] studied three multi-layered panels developed as environmentally friendly flax-fiber-based products for building industry applications.
Additionally, composite materials with improved sound-absorbing properties can be obtained using sheep wool [8,9] as a raw material. The results showed that a different product was obtained by simply hot-pressing the wool, which could be processed and easily manipulated and has a comparable sound absorption performance to mineral wool or recycled polyurethane foam.
The Delany–Bazley (adapted for foams), Allard–Champoux and Hamet–Berengeir mathematical models were used by Tiuc et al. [10] to determine the sound absorption coefficient. The results of this study show that the analyzed models were unsuitable for new composite porous materials and that new models should be developed to describe their acoustic absorption properties.
Composite structures that use basalt mineral wool materials and perforated sheet metals are mainly used for road acoustic panels to reduce traffic noise. A very accurate estimate cannot be made when the panel structure is not considered, only its geometry [11,12]. When sound barriers are made solely from reflective materials, the noise bounces off but is not eliminated. Barriers incorporating absorptive materials mitigate sound waves and protect hearing and health. These barriers have a layer of absorbing material and air beneath the perforated metal panel. Although this material does a lot to reduce the severity of sounds, there are not only features of such panels that deliver results. In addition, the porous nature of perforated metal noise-control panels and tiles absorbs and dissipates sound waves.
The noise is reflected but not eliminated when sound barriers are made exclusively of reflective materials. Barriers that incorporate absorbent materials attenuate sound waves and protect hearing and health. These barriers have a layer of absorbent material and air under the perforated metal panel. Although this material greatly reduces the severity of sounds, it is not only the features of such panels that provide results. In addition, the porous nature of the panels and the noise control with perforated metal sheet panels serve to absorb and dissipate sound waves.
2. Evaluations of The Sound Absorption of The Multilayer Panel
The approach used in this work to assess the sound absorption of a multilayer structure is based on evaluating the sound impedance of each layer (e.g., perforated panel, porous material). In the case of a perforated sheet, the acoustic impedance of a single hole was used to obtain that of the entire perforated sheet by using its open area ratio; the panel was considered to be a set of short tubes of similar length to its thickness. It was also assumed that the wavelength of the sound that propagates was large enough compared to the dimensions of the tube (i.e., the size of the hole). The impedance of the perforated sheet includes terms due to the viscosity of the air, the radiation (from a hole in a baffle), and the interaction between the holes. Using complex characteristic impedance and wavenumber, air gaps can be modeled by a pure reactance term.
The proposed structure from Figure 1 consists of a perforated sheet (thickness ), mineral wool (which can be two thicknesses, for case 1 and for case 2), a polyethylene foil (thickness ), and a non-perforated sheet, which can be considered a rigid wall (thickness and ).
In this case, the rigid wall’s normal surface impedance is infinite . Then, it can be further evaluated for each layer. The impedance obtained after layer 1 (mineral wool with thickness and ) is [13]:
where is the characteristic impedance of the mineral wool, is its wavenumber, and or is the thickness of this mineral wool.
In the same way, the impedance produced by the second layer (polyethylene) is:
where is the characteristic impedance of the polyethylene, is its wavenumber, and is the thickness of this polyethylene. The characteristic values of the parameters that refer to mineral wool and polyethylene can be obtained experimentally [14], or using an empirical prediction method by regression analysis of measured sound absorption data [15].
The surface impedance of the total system along the normal direction for the system with three layers, considered: mineral wool, polyethylene, and perforated sheet, can be expressed as:
where the acoustic transfer impedance of a perforated sheet is given by:
and being the perforation rate of the sheet.
The impedance of one hole (tube with length) can be computed using the mathematical formulation [16]:
where is the air density, is the air velocity, is the angular frequency, is the thickness of the perforated panel, is the radius of the circular hole (), is the coefficient of air viscosity, is the wavelength, is the nth order of Bessel’s function, is the Stokes wave number and is the end correction which accounts for the interaction between the orifices [13].
For the analysis of multilayer systems using the transfer matrix method (TMM) [17,18], it is considered that the acoustic impedance along the normal direction of a material interface is determined using particle velocity continuity (on both sides of the interface) and knowing the acoustics properties of the medium (characteristic of impedance , and propagation constant or wavenumber ). In this method [17,18], each layer is represented using a general transfer matrix that reports the sound pressure and particle speed before and after passing through the layer , allowing the establishment of the following relationship:
where is the quadric-pole matrix corresponding to the ith layer [18,19]. For layer i, the following transfer matrix can be written:
a relationship in which is the complex characteristic impedance and is the wavenumber in the layer. This relationship can be applied to the layers of mineral wool or polyethylene material .
In this case, for a three-layer system, multiplying the individual transfer matrices yields:
In the case of the perforated panel with multi-layer sheets, considering that the speed before and after passing through this layer is the same, the quadric-pole matrix can be written as follows:
where is the transfer impedance of the perforated panel from Equation (4).
The impedance of the whole panel can be computed as , and the sound absorption coefficient for a sound incidence angle to the normal direction of the surface is given by:
where is the reflection coefficient that can be approximated in terms of the normal surface impedance of the global system from the following equation:
where is the acoustic impedance of the air. Based on the transfer matrix method and these previously computed equations, the values of the sound absorption curves can be estimated for systems with a much larger number of layers. In the following section, the experimental data will be revealed for the acoustic system considered in this work.
3. Experimental Results vs. Numerical Simulations and Discussions
The determination of acoustic absorption was performed according to EN ISO 10534-2 [20] using an impedance tube type 4206A (medium tube), see Figure 2, in the frequency range of 100–3200 Hz using the transfer function method (TFM). A PULSE multichannel system 3560-B-030 with five channels and a signal generator connected to a 2716 Brüel & Kjaer signal amplifier was used for the signal acquisition of two microphones, type 4187. The experimental data processing was performed with Brüel & Kjær PULSE Lab shop software which includes “Normal Incidence Absorbtion” on the “Acoustic Material Testing in Tube” application (7758-type analysis software-PULSE Material Testing). For these determinations, specimens with a diameter of 63.5 mm and thicknesses of about 50 and 100 mm were used. The experimental tests were performed in the Acoustics Laboratory of ICECON S.A. Bucharest. The producers of such multilayer structures use these elements based on Romanian National Reglementations with official technical approvals by implementing acoustic panels on the geometrical frontiers of the railway tracks. These types of structures can also be used to protect against the noise produced by automotive traffic, road and railways traffic.
Samples with a diameter of 63.5 mm from sound-absorbing panels were tested for sound absorption tests: three pieces with a thickness of 50 mm and three samples with a thickness of 100 mm. The elements of the sound-absorbing panel structure are illustrated in Figure 3:
The environmental parameters monitored in the laboratory during the experimental tests regarding atmospheric pressure, temperature, and relative humidity, presented in Table 1, were measured with a laboratory barometer and an electronic thermo-hygrometer. The evaluated parameters related to sound velocity, air density, and air impedance characteristic were automatically calculated by the “Normal Incidence Absorption” software.
The input data from the project set-up are presented in Table 2, and they are established automatically by software in the calibration stage.
After entering the input data and environmental conditions (see Table 1 and Table 2), the following steps were: channel calibration (external calibration with type 4231 sound calibrator), measure signal-to-noise ratio (background noise measurement and signal measurement), calibration control (with calibration step: interchange microphone positions and regular microphone positions–necessary for transfer function) and material testing control (measurement of absorption coefficient). For post-processing, it was possible to extract measured data to 1/1, 1/3, 1/12, or 1/24 octave. The export result in Excel format contained the absorption coefficient, reflection coefficient, impedance ratio, admittance ratio, corrected transfer function, calibration factor, signal-to-noise ratio, and project set-up. The absorption coefficient evaluation method is detailed in Appendix A.
The experimental results are presented in Figure 4, Figure 5 and Figure 6. Figure 4 illustrates the comparative effects of the absorption curve for mineral wool boards with a thickness of 50 mm (Vb1) and 100 mm (Vb2) as a frequency function.
As can be determined from Figure 4, increasing the thickness of the mineral in the range 50–100 mm had the effect of a better absorption coefficient in the frequency range 100–700 Hz and was not sensitive in the range 1200–3200 Hz.
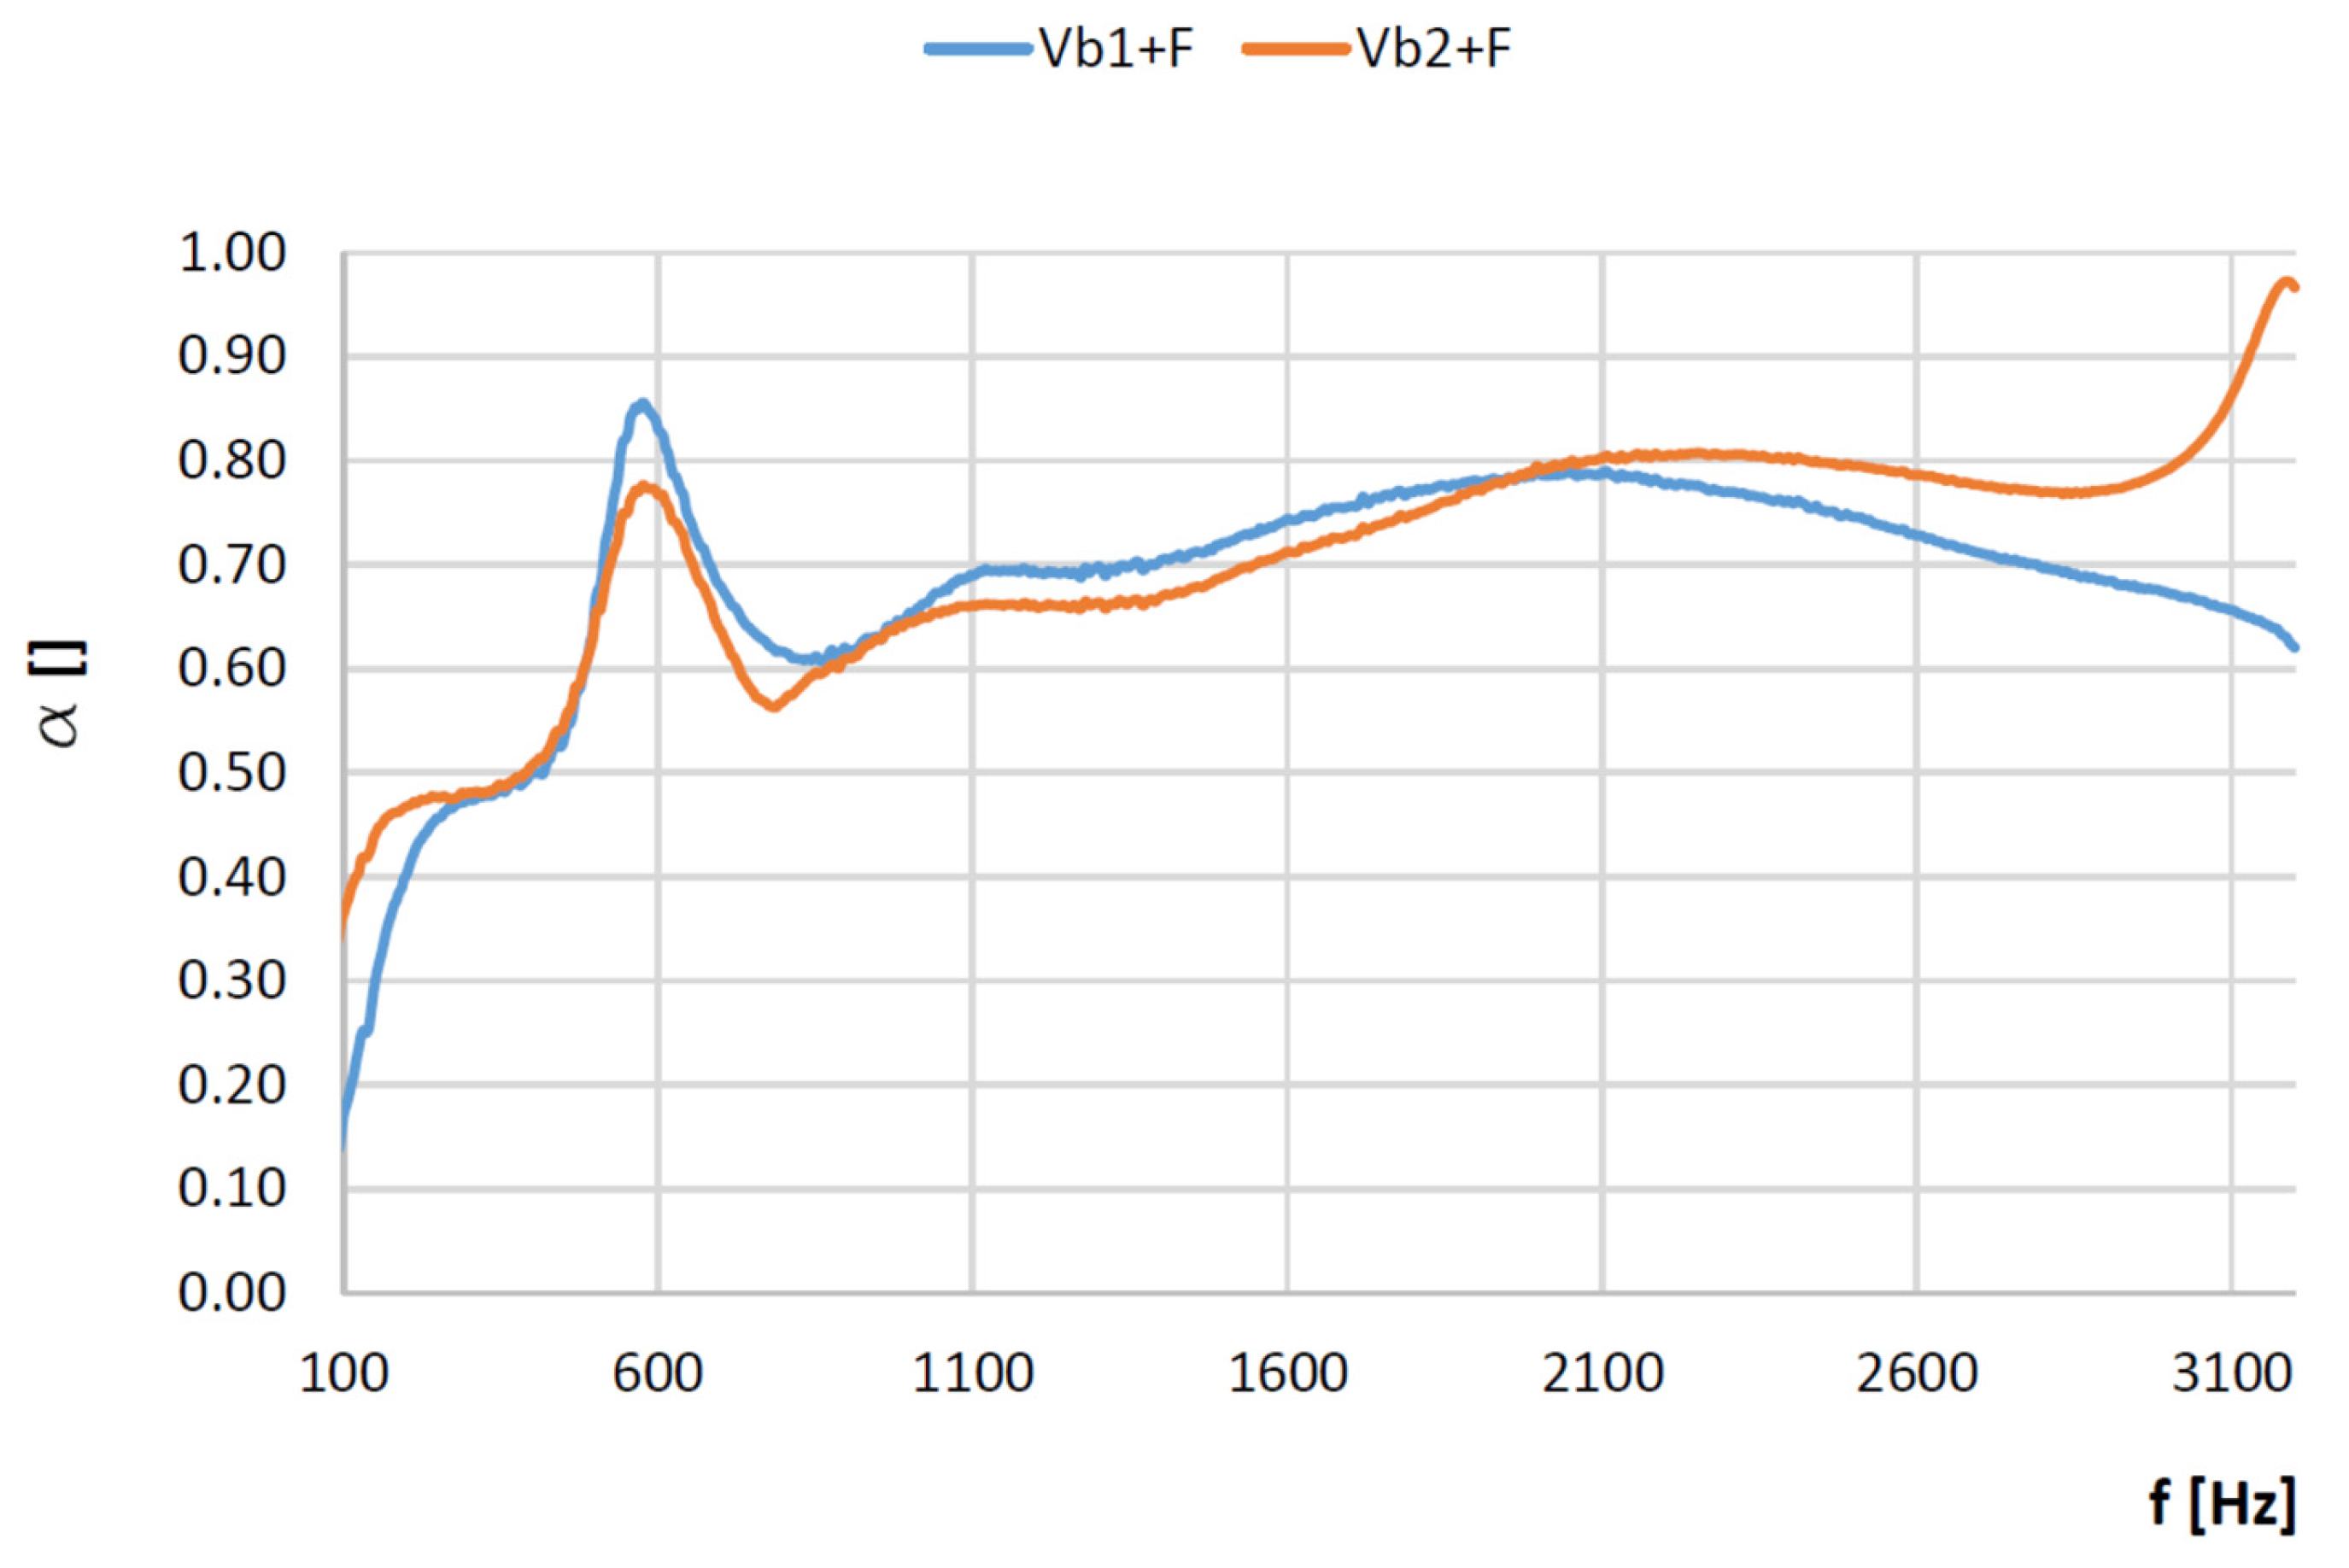
Figure 5 illustrates the comparative results of the absorption coefficient curve for mineral wool boards with a thickness of 50 mm, a polyethylene foil with 2 mm thickness (Vb1+F) and mineral wool boards with a thickness of 100 mm, together with a polyethylene foil (Vb2+F). The face of the interaction considered towards the acoustic source was polyethylene. It is observed that when adding the polyethylene foam foil, which usually has a protective role against water (rain, in the case of outdoor panels), it had a slightly negative influence on the absorption coefficient in the frequency range 500–2000 Hz and a benefic effect in the frequency range 2100–3200 Hz, especially in the range 2600–3200 Hz.
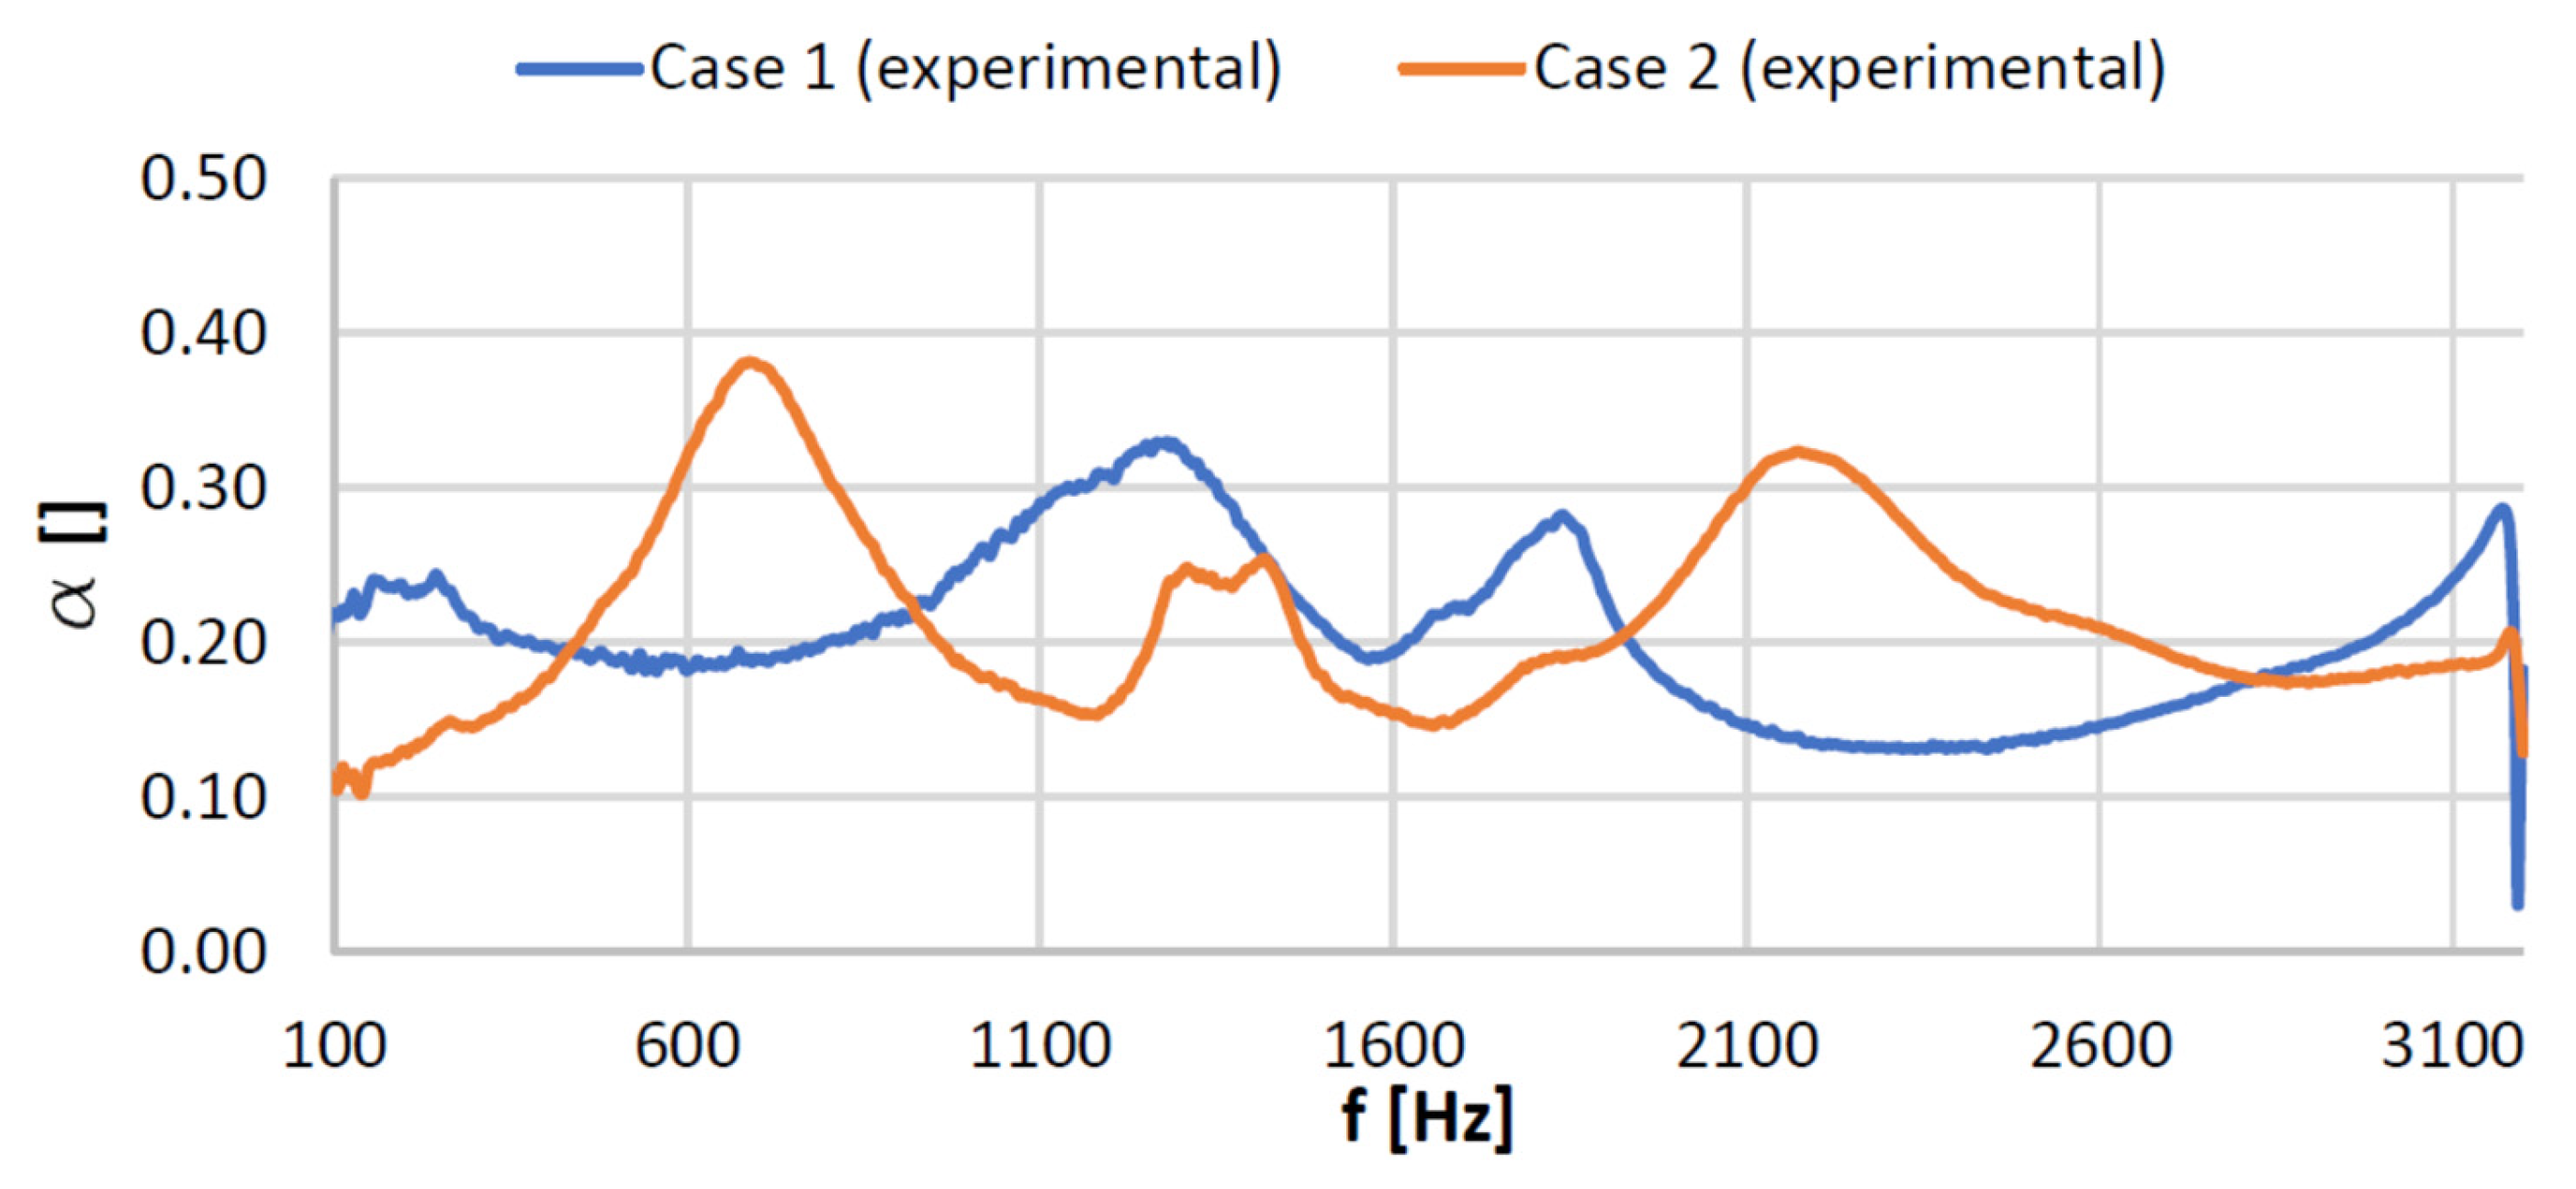
Figure 6 presents the variation of the absorption coefficient for a multilayer structure composed of: a perforated sheet, polyethylene foil, mineral wool, and an unperforated sheet. These are detailed in Figure 1 for Cases 1 and 2, which differed only due to the thickness of the mineral wool. Like the situation analyzed above, the sound absorption decreased considerably by adding polyethylene foil to the addition of perforated sheet. It can be seen that the solution without perforations was better than the solution with perforations. Still, we must also consider the practical aspects of their use on roads, where such sound-absorbing structures can be used, which must also have certain qualities of mechanical strength and protection against rain and snow effects.
From a practical point of view, considering the costs, it can be seen that the two combinations (Case 1 vs. Case 2) have a similar average value in the frequency range of 100–3200 Hz for the absorption coefficient. Therefore, the thickness of the mineral wool layer does not significantly influence the variation of sound absorption. Thus, the cheapest solution is probably the one with a smaller mineral wool thickness, i.e., 50 mm. Of course, the difference in thickness of the mineral wool layer influences the total weight of the structure. It will most likely have a more substantial influence in the case of airborne sound insulation, which is not the subject of this work. The experimental data gave us sufficient information to complete this work with a numerical computing model based on the TMM previously presented as an analytical model provided by Equations (1)–(11). The new method predicts the sound absorption coefficient and is called PSAC-TMM (Prediction Sound Absorption Coefficient-Transfer Matrix Method). Using MATLAB Software, based on PSAC-TMM’s Equations (1)–(11), the sound absorption coefficient was computed considering the following geometric and physical characteristics presented in Table 3.
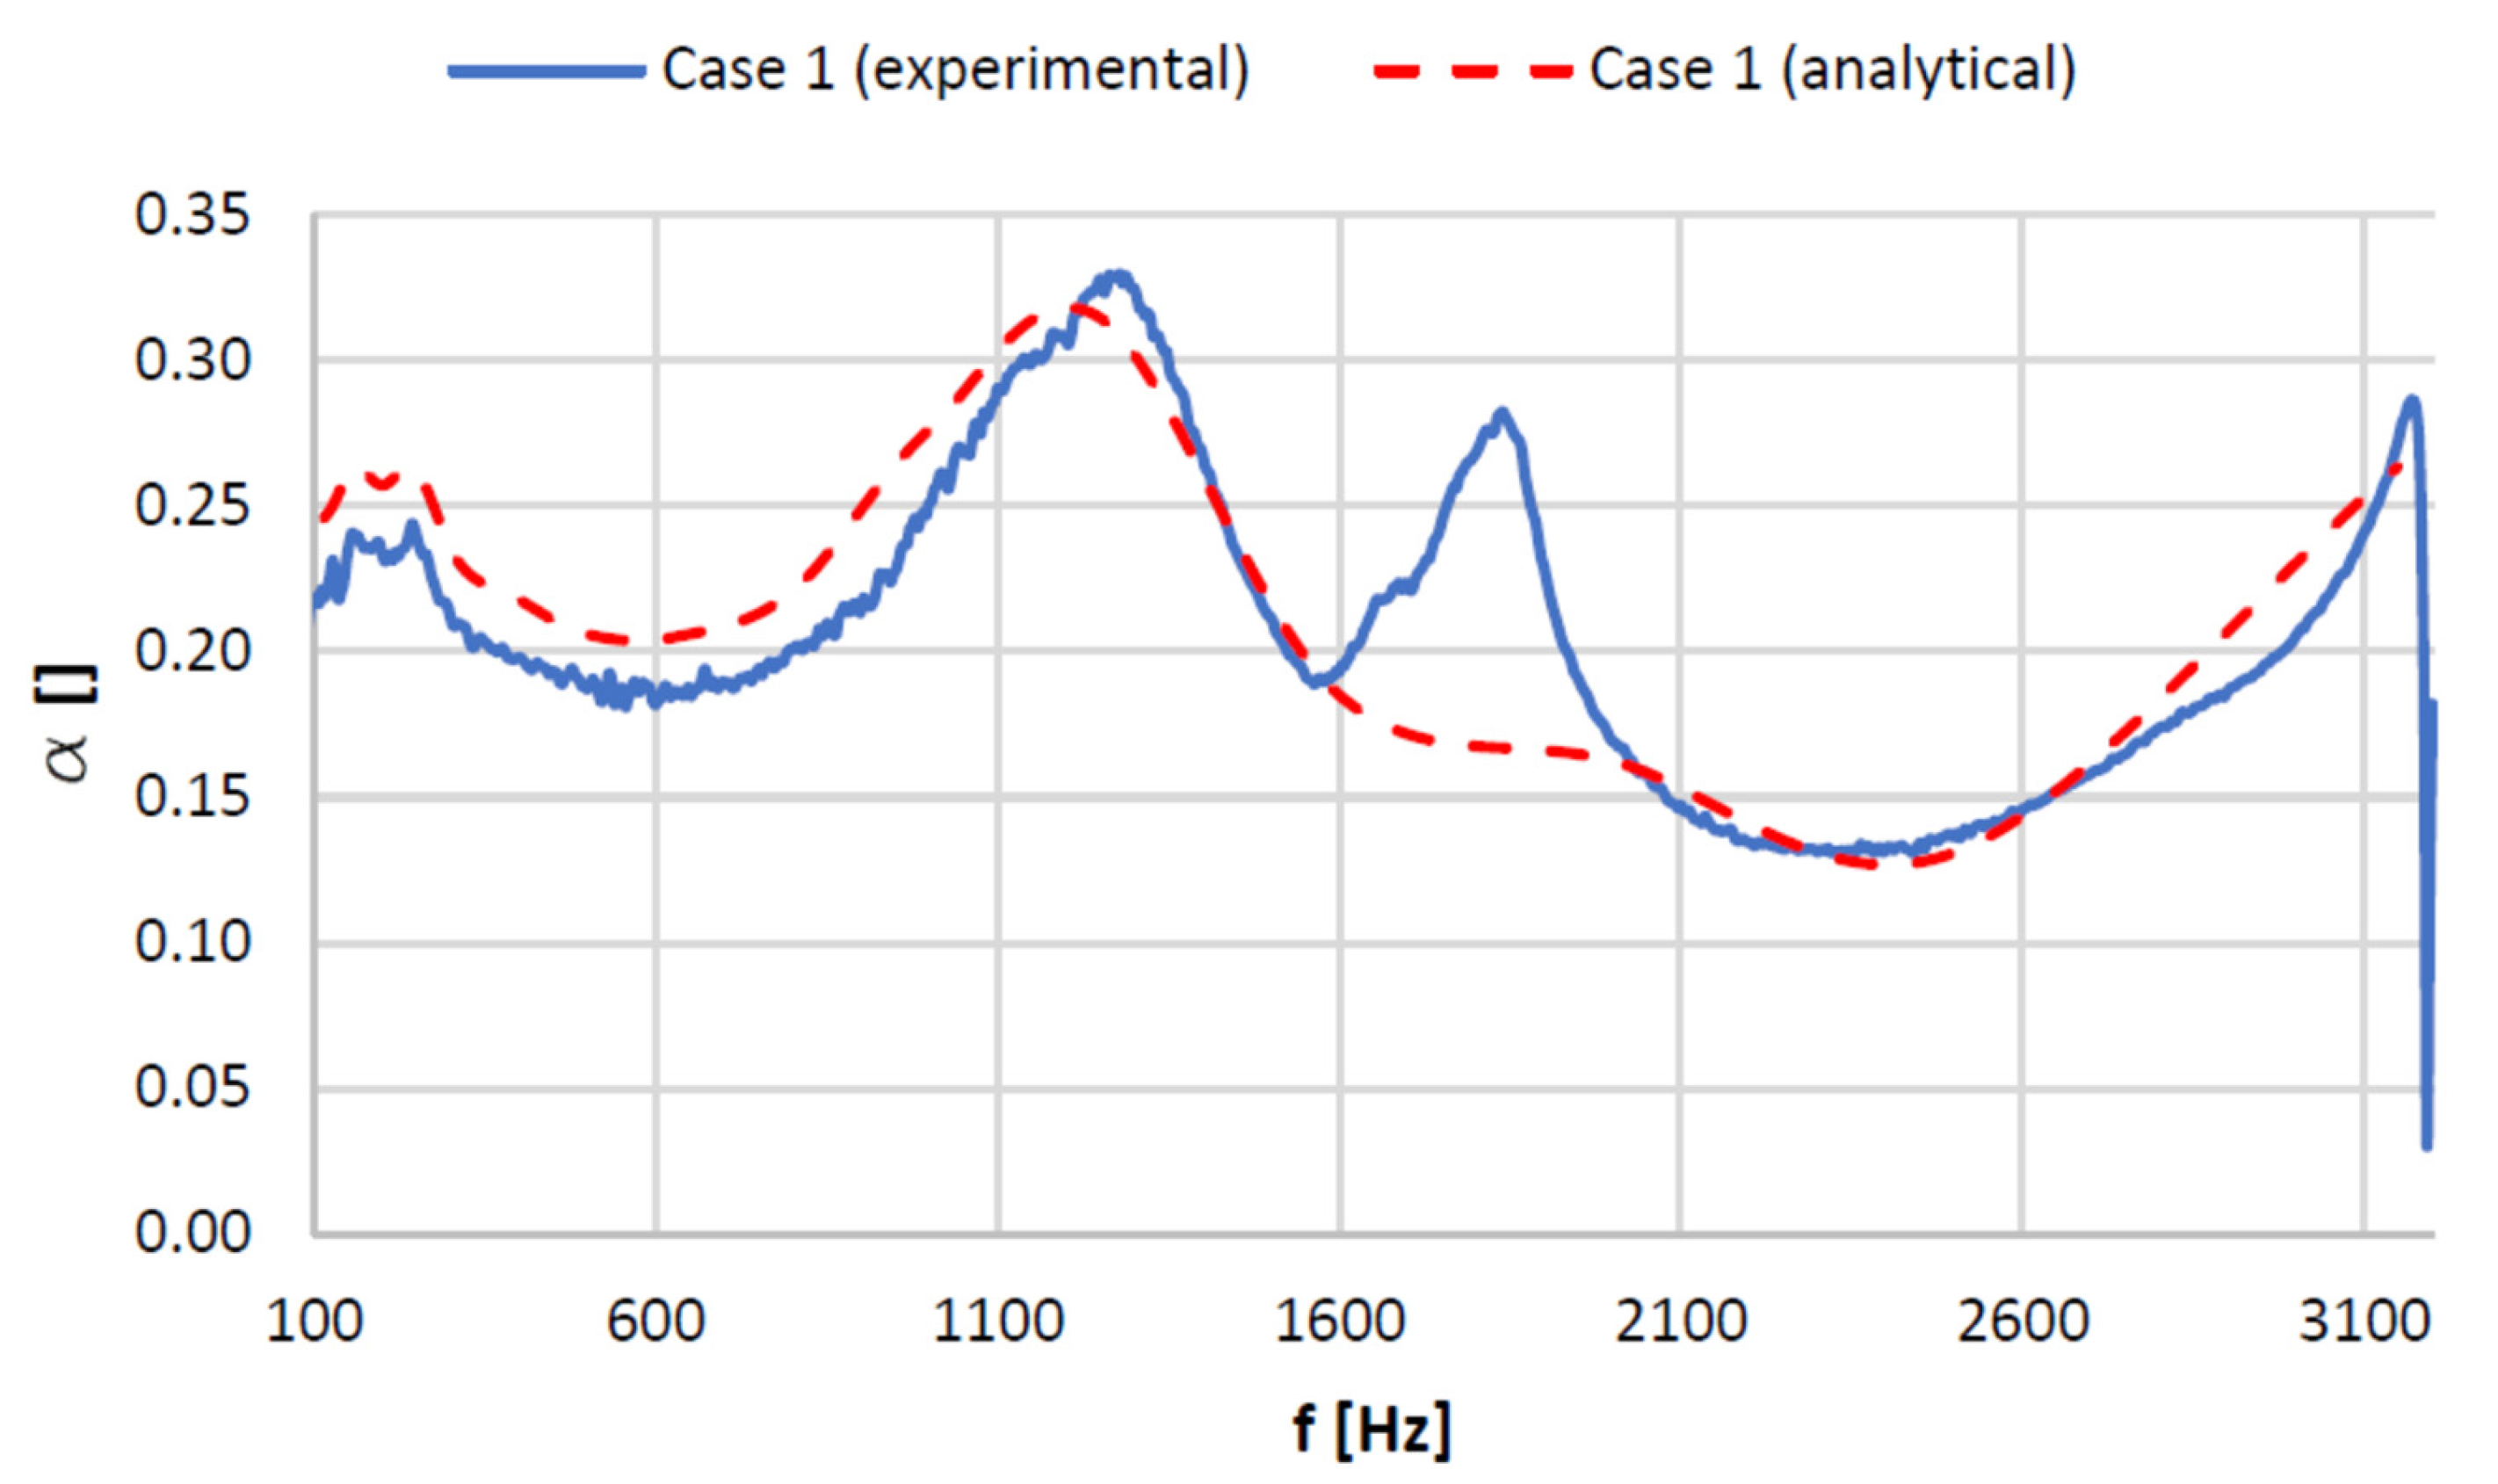
Figure 7 illustrates the comparison between the experimental data and the prediction using the PSAC-TMM, based on analytical Equations (1)–(11), for the sound absorption coefficient for Case 1 in the frequency range 100–3200 Hz. As can be seen from Figure 7, there is a good agreement between the experimental data and the predicted values of the sound absorption coefficient , using PSAC-TMM, in the frequency ranges 100–1600 Hz and 2050–3200 Hz, while in the frequency range 1600–2050 Hz the values are different.
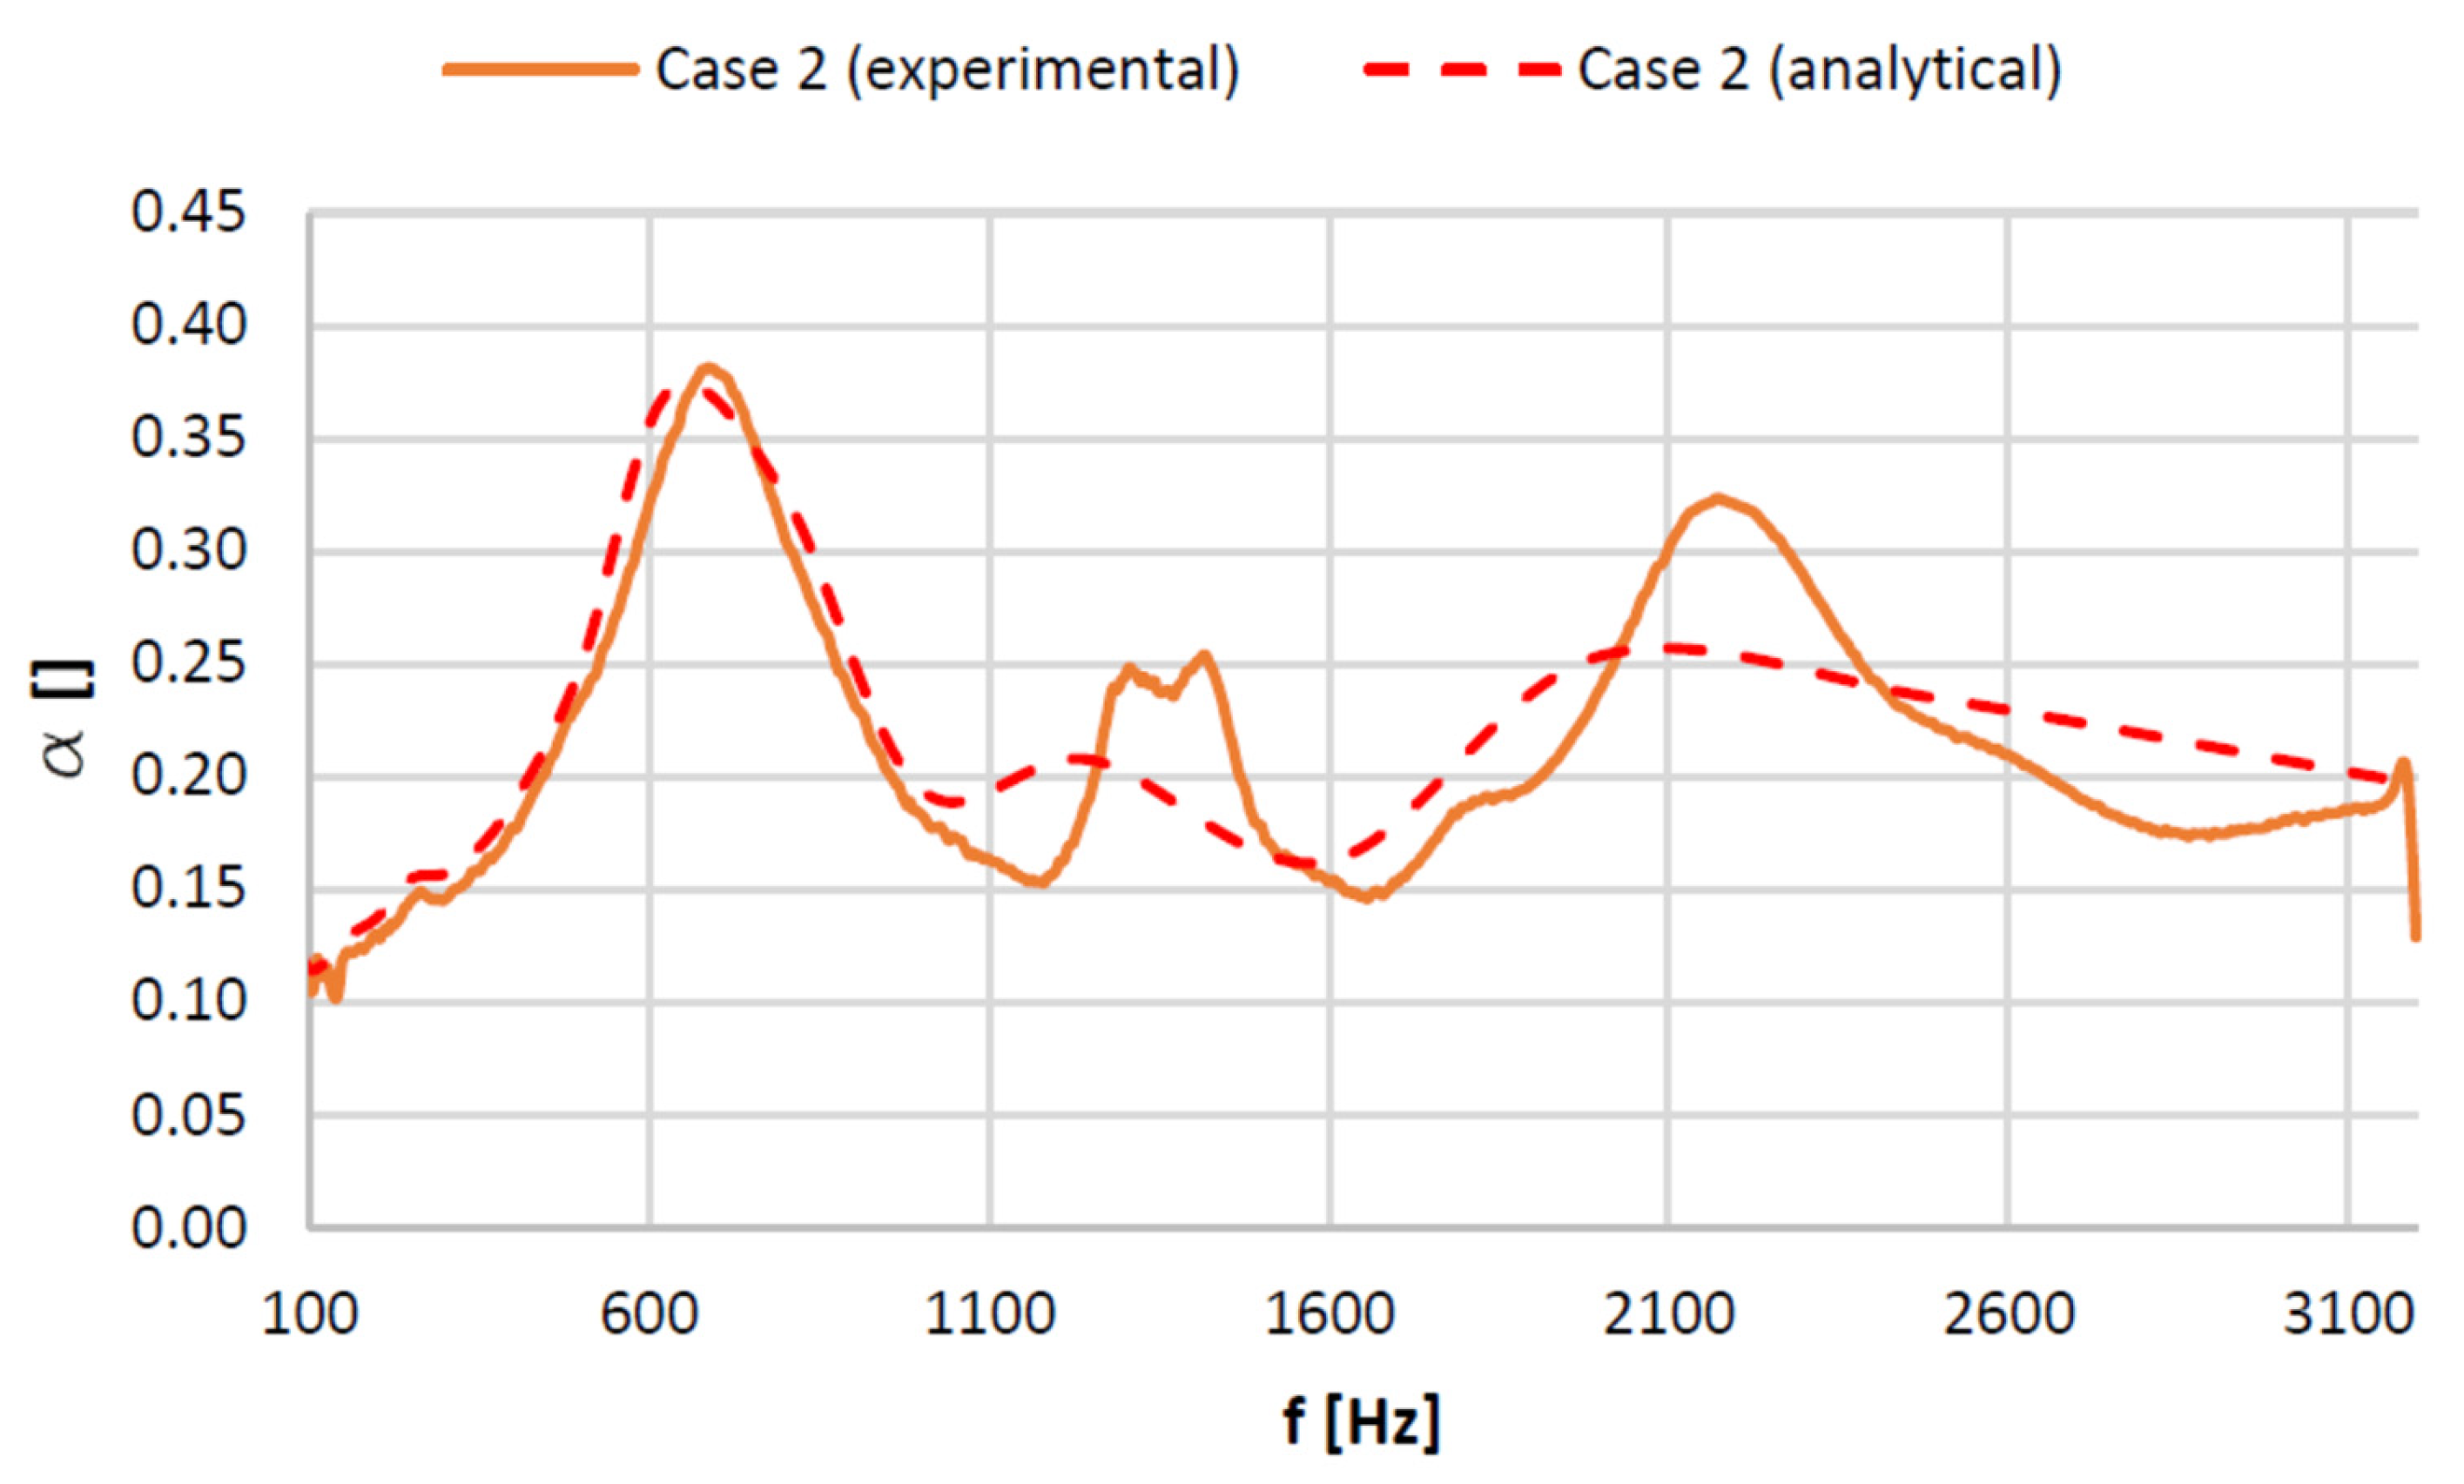
Figure 8 illustrates the comparison between the experimental data and the prediction using the PSAC-TMM, based on analytical Equations (1)–(11), for the sound absorption coefficient for Case 2 in the frequency range 100–3200 Hz. As in the previous case, it can be remarked that a good agreement between the experimental data and the predicted values of the sound absorption coefficient , using PSAC-TMM, in the frequency ranges 100–1200 Hz, 1400–2100 Hz, 2300–3200 Hz, while in the frequency ranges 1200–1400 Hz and 2100–2300 Hz the values are different.
The computed global error of the predicted values of the sound absorption coefficient , using PSAC-TMM, compared with the experimental values over the frequency range 100–3200 Hz, is less than 4.2%, validating the PSAC-TMM as a suitable predicting method of the sound absorption coefficient . The cause of the errors in predicting the sound absorption coefficient using the PSAC-TMM could be the errors induced by the physical characteristics, such as the flow resistivity of the basalt wool, the mass density of the basalt wool, and the mass density of the polyethylene foam foil, used based on the data provided by the manufactures of the materials.
Since the authors followed as detailed an analysis as possible, the analysis in both cases was performed on a linear regression on the frequency range 100–3200 Hz; with a step of 4 Hz, some small peaks appear that have considerable differences in the acoustic absorption values, but they are on very narrow domains. When using octave representation, even very narrow ones such as 1/12 or 1/24 octaves, these peaks decrease so that the prediction values are very close to the experimental values.
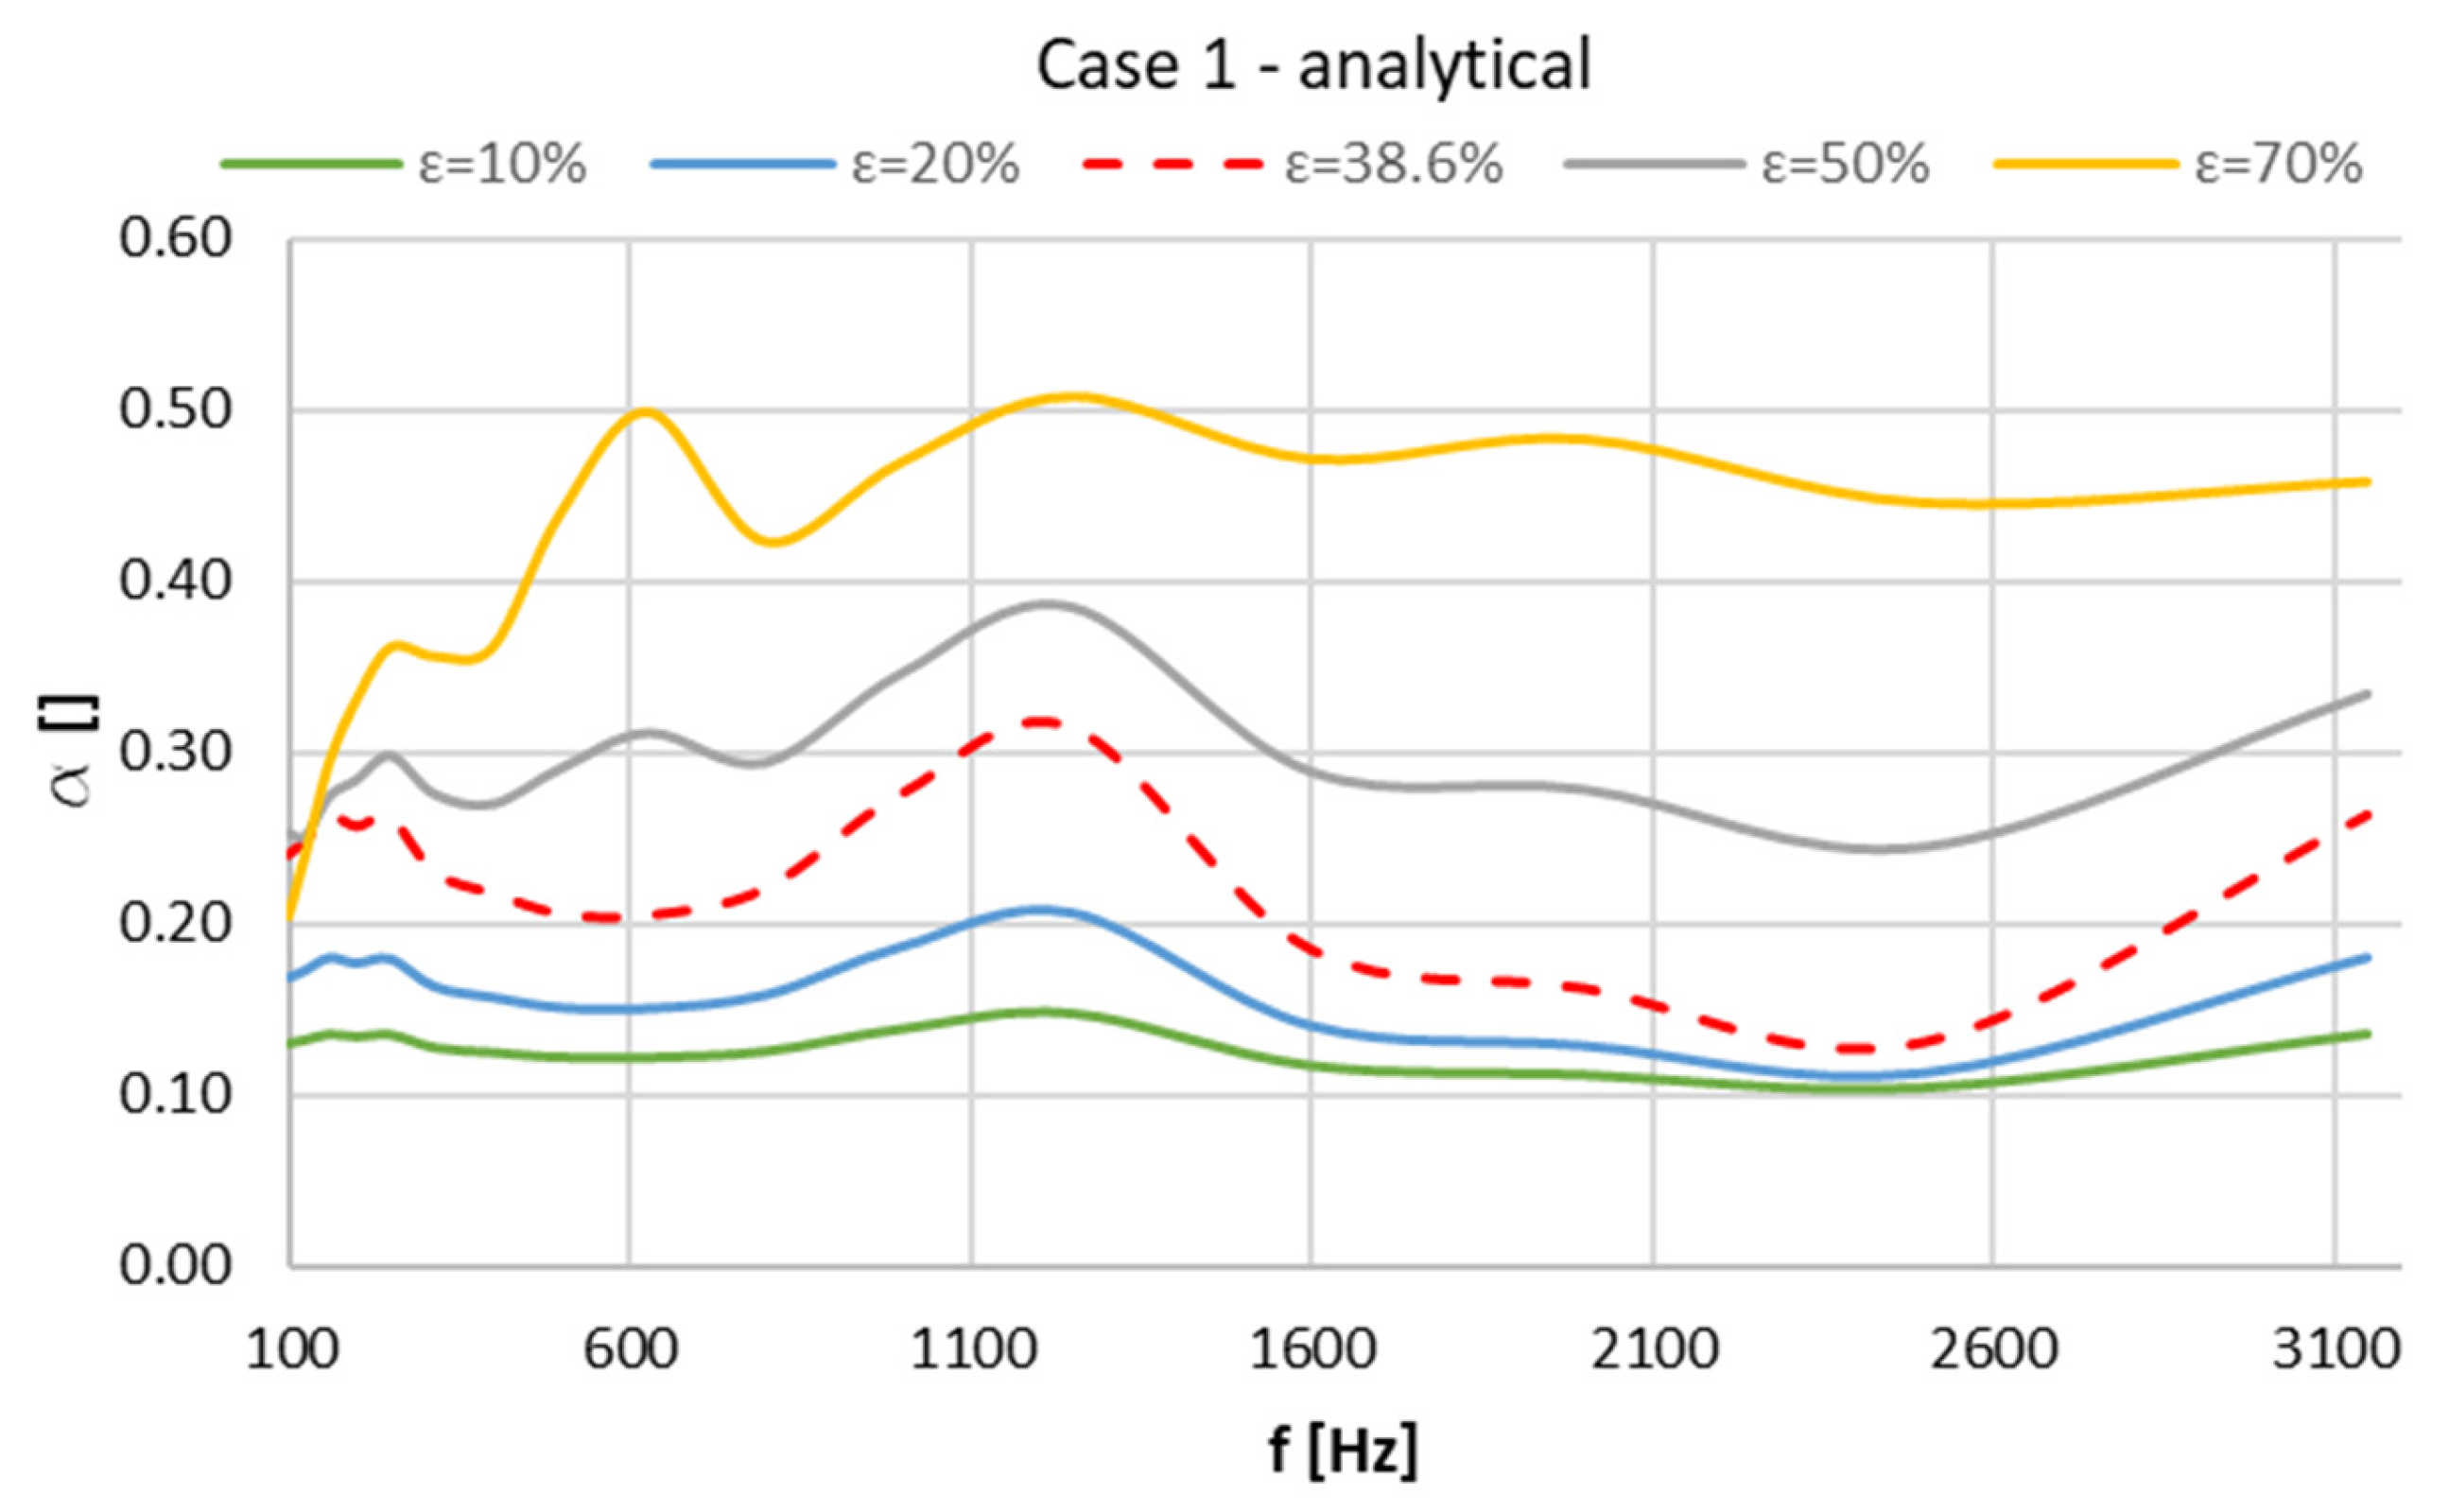
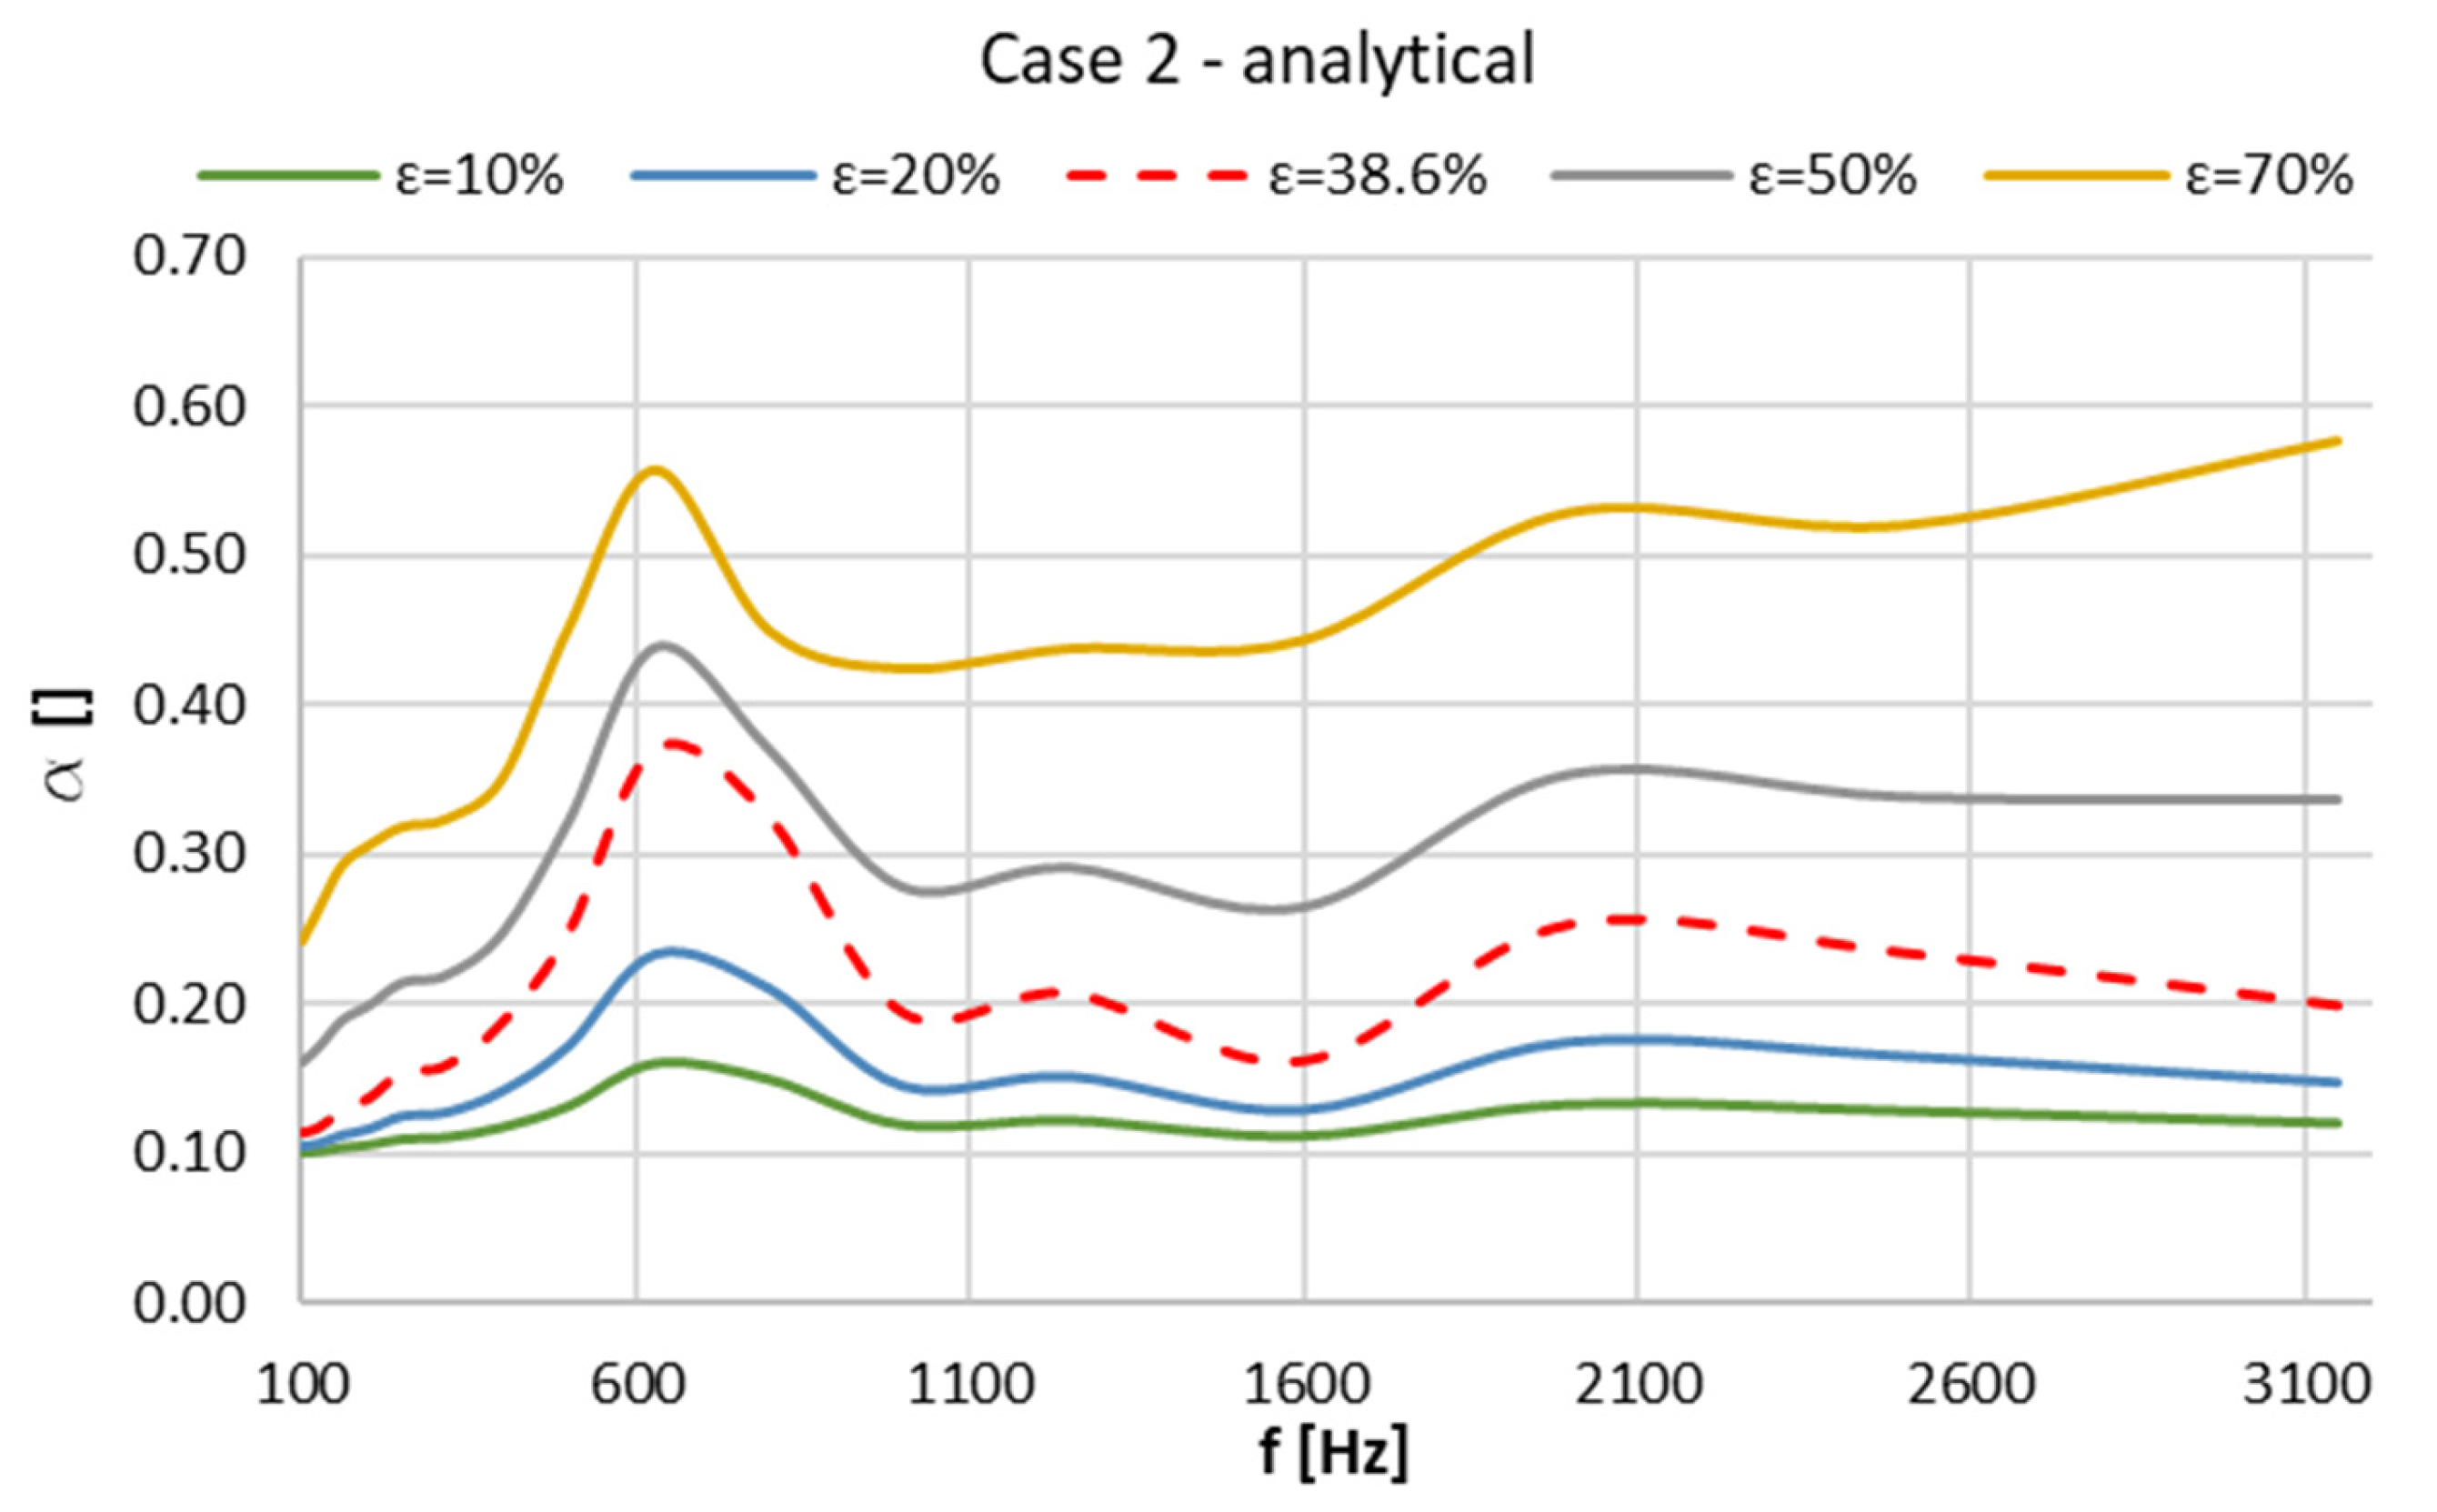
Based on the analytical prediction method PSAC-TMM, developed in this work, the same structure was analyzed where only the porosity factor of the perforations varied between 10–70%. The variation of the acoustic absorption coefficient was studied for both previously studied cases, choosing each two smaller factors , and another two larger factors , compared to the experimentally studied one for (see Figure 9 and Figure 10).
From the figures illustrated above, it can be seen that with the increase of the value of porosity factor of the surface interacting with direct waves, there is an increase in the sound absorption coefficient in most of the frequency range. The increase in the values of the sound absorption coefficient can also be explained due to the increase in the surface area of the perforations, which leads to an increase in the interaction surface with the immediately following layer of the structure: the polyethylene film that covers the mineral wool. It is observed that a reduction of the porosity factor of the perforated surface negatively influences the values of the absorption coefficient.
In future work, we shall refine the PSAC-TMM to obtain the characteristic values of the acoustic materials, tested experimentally at the same time, and not taken from the catalogs given by the material manufacturers because over time, some characteristics may vary.
4. Conclusions
In the present study, starting from two constructive solutions that differed in the thickness of a layer of mineral wool, the method of transfer matrices to predict the sound absorption coefficient was developed.
From an experimental point of view, it has been observed that just changing the thickness of an inner intermediate layer, on average, does not significantly change the values of the absorption curve (see Figure 6).
The TMM absorption coefficient prediction method works well and can be used for multi-layer acoustic panel structures and a perforated outer face (see Figure 7 and Figure 8). The parameters considered in the calculation program, regarding the material characteristics, affect the predicted result obtained. The values used are from the catalogs published by the manufacturers in the online environment. Therefore, we intend to carry out a similar study in the future but based on the experimental determinations of the material characteristics, which refer to density, flow resistivity, etc. Additionally, the influence of the porosity factor on the sound absorption was highlighted, as can be seen from Figure 9 and Figure 10, using the new PSAC-TMM.
Author Contributions
Conceptualization, O.V. and M.B.; methodology, O.V. and M.B.; software, O.V.; validation, O.V. and M.B.; formal analysis, O.V.; investigation, O.V. and M.B.; resources, O.V.; data curation, O.V.; writing—original draft preparation, O.V. and M.B.; writing—review and editing, M.B.; visualization, O.V. and M.B.; supervision, O.V. and M.B.; project administration, O.V. and M.B. All authors have read and agreed to the published version of the manuscript.
Funding
This research received no external funding.
Data Availability Statement
Not applicable.
Acknowledgments
The authors of this article are thankful to the University POLITEHNICA of Bucharest, for providing a serene environment and the facilities to carry out this research work.
Conflicts of Interest
The authors declare no potential conflicts of interest concerning the research, authorship, and/or publication of this article.
Appendix A. The Experimental Evaluation Method with Two Microphones
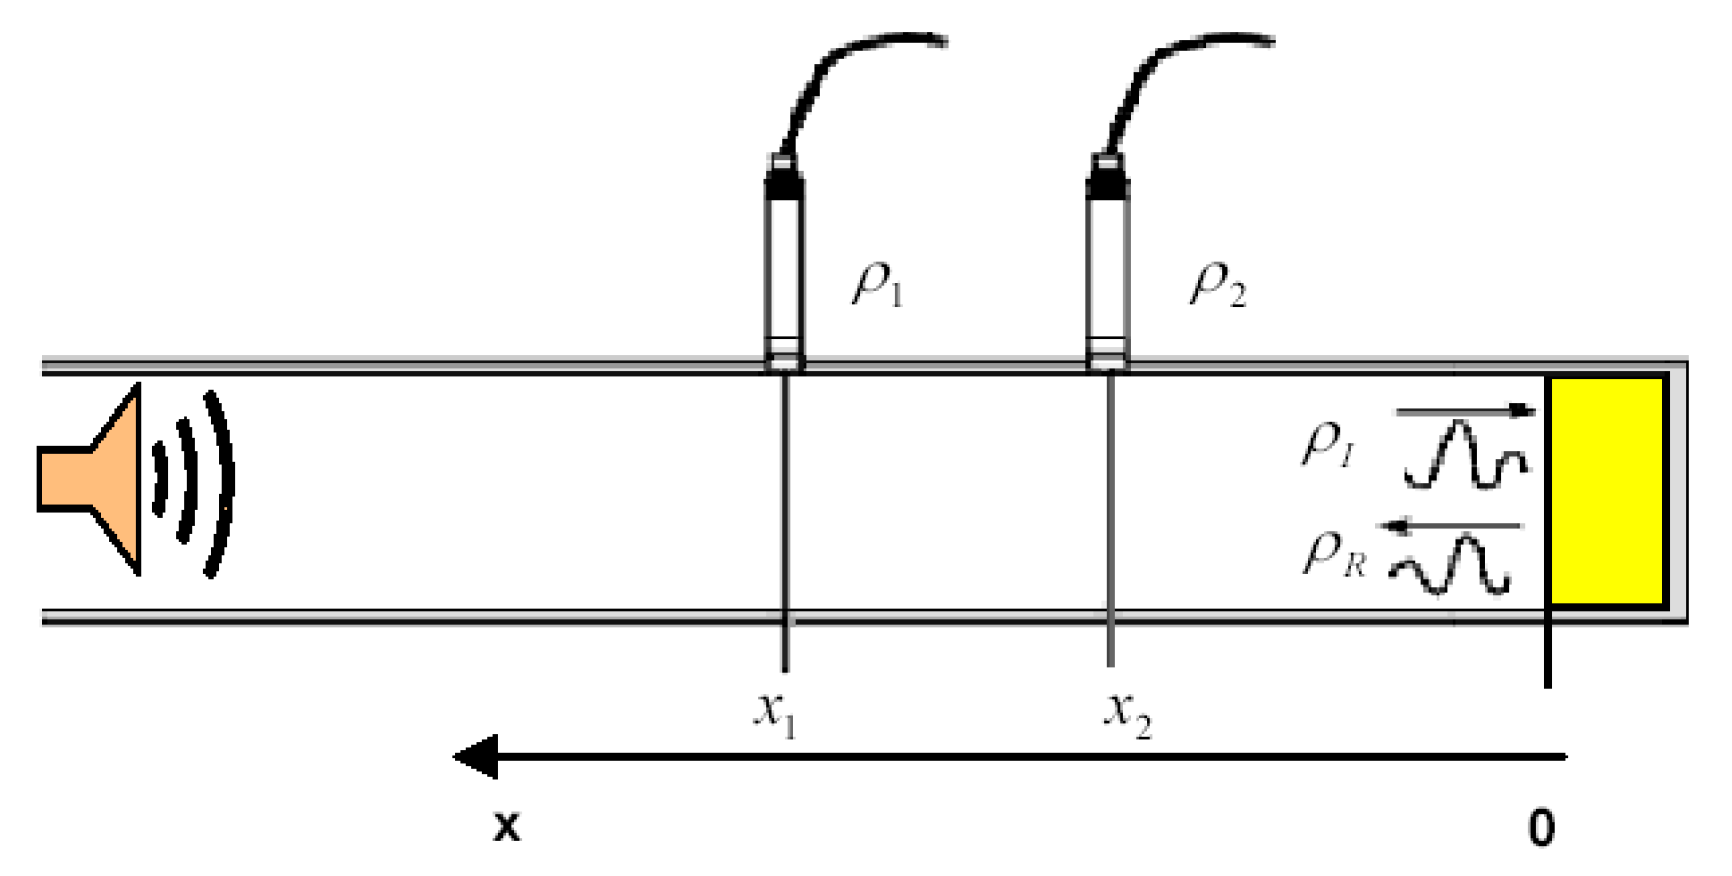
The sound pressure of the incident wave and the reflected wave are, respectively [21,22]
and
where and are the complex magnitudes of and at the reference plane (x = 0) (see Figure A1) and is the complex wave number, where is the real component and is the imaginary component which is the attenuation constant.
Figure A1.
The sound pressure of the incident and reflected wave.

In such a short tube where no real attenuation can be measured, it can be expressed as follows:
where:
- is the angular frequency
- is the frequency
- is the speed of the sound equal to in m/s, where T is the temperature in Kelvin
The sound pressure p1 and p2 at the two microphone positions are:
and
The transfer function H12 for the total sound field between the two microphones may now be obtained by using Equations (A3) and (A4) as follows:
The complex amplitude reflection factor r is the ratio of the complex amplitude of the reflected wave to that of the incident wave at the reference plane wave propagation (normal incidence):
that can be simplified at as
Therefore, Equation (A6) can be expressed as follows:
and transposing (A7) to yield r at as follows:
then:
and then:
This equation can be factorized as follows:
where is the distance between the microphones.
The complex amplitude reflection factor r at the reference plane () can now be determined from the measured functions, the distance of the first microphone, the distance s between the microphones and the complex wave number which may include the tube attenuation constant .
Sometimes Equation (A7) is expressed as follows:
where:
this is the transfer function between the two microphones of the incident wave alone;
and:
this is the transfer function between the two microphones of the reflected wave alone.
Back to Equation (A10), the normal reflection factor r can be expressed as follows [21,22]:
whereas:
- is the real component,
- is the imaginary component,
- is the phase angle of the normal incidence reflection factor.
From Equation (A10) or (A13), the sound absorption coefficient will be calculated as follows [21,22]:
assuming it equal to the complex power-transmitted factor .
The specific acoustic impedance ratio z, sometimes called the “Normalized impedance ratio” can be calculated from (10) or (13) as follows:
whereas
Z is the normal sound incidence impedance defined as follows:
p is the sound pressure at the reference plane ();
u is the sound particle velocity at the reference plane (), and for the propagation of plane waves it is considered normal incidence.
References
- Crocker, J.; Arenas, J.P. Use of Sound-Absorbing Materials. In Handbook of Noise and Vibration Control; Crocker, M., Ed.; John Wiley: New York, NY, USA, 2007; pp. 696–713. [Google Scholar]
- Tiuc, A.E.; Vasile, O.; Usca, A.D.; Gabor, T.; Vermesan, H. The analysis of factors that influence the sound absorption coefficient of porous materials. Rom. J. Acoust. Vib. 2014, 11, 105–108. [Google Scholar]
- Gao, N.S.; Zhang, Z.C. Optimization design and experimental verification of composite absorber with broadband and high efficiency sound absorption. Appl. Acoust. 2021, 183, 108288. [Google Scholar] [CrossRef]
- Wang, X.T.; Ma, L.F.; Wang, Y.S.; Guo, H. Design of multilayer sound-absorbing composites with excellent sound absorption properties at medium and low frequency via constructing variable section cavities. Compos. Struct. 2021, 266, 113798. [Google Scholar] [CrossRef]
- Wang, J.L.; Rubini, P.; Qin, Q. Application of a porous media model for the acoustic damping of perforated plate absorbers. Appl. Acoust. 2017, 127, 324–335. [Google Scholar] [CrossRef]
- Kim, B.S.; Cho, S.J.; Min, D.K.; Park, J. Sound absorption structure in helical shapes made using fibrous paper. Compos. Struct. 2015, 134, 90–94. [Google Scholar] [CrossRef]
- Tamas-Gavrea, D.R.; Istoan, R.; Tiuc, A.E.; Denes, T.O.; Vasile, O.; Constantinescu, H. Development of new composite products based on flax fibers. Coatings 2021, 11, 551. [Google Scholar] [CrossRef]
- Borlea, S.I.; Tiuc, A.E.; Nemes, O.; Vermesan, H.; Vasile, O. Innovative Use of Sheep Wool for Obtaining Materials with Improved Sound-Absorbing Properties. Materials 2020, 13, 694. [Google Scholar] [CrossRef] [PubMed] [Green Version]
- Tamas-Gavrea, D.R.; Denes, T.O.; Istoan, R.; Tiuc, A.E.; Manea, D.L.; Vasile, O. A Novel Acoustic Sandwich Panel Based on Sheep Wool. Coatings 2020, 10, 148. [Google Scholar] [CrossRef] [Green Version]
- Tiuc, A.E.; Vasile, O.; Vermesan, H.; Nemes, O. The use of mathematical models in determining acoustic absorption coefficient of new composite porous materials. Rom. J. Acoust. Vib. 2017, 14, 97–101. [Google Scholar]
- Bugaru, M.; Vasile, O.; Neagoe, M. Recent developments of noise attenuation using acoustic barriers for a specific edge geometry. Computation 2021, 9, 129. [Google Scholar] [CrossRef]
- Bugaru, M.; Vasile, O.; Neagoe, M. Analysis of noise reduction and the influence of wave’s diffraction angle using noise barriers. Acta Tech. Napoc. 2022, 65, 29–36. Available online: https://atna-mam.utcluj.ro/index.php/Acta/article/view/1780/1435 (accessed on 21 November 2022).
- Pereira, A.; Gaspar, A.; Godinho, L.; Mendes, P.; Mateus, D.; Carbajo, J.; Ramis, J.; Poveda, P. On the Use of Perforated Sound Absorption Systems for Variable Acoustics Room Design. Buildings 2021, 11, 543. [Google Scholar] [CrossRef]
- Panneton, R. Comments on the limp frame equivalent fluid model for porous media. J. Acoust. Soc. Am. 2007, 122, EL217–EL222. [Google Scholar] [CrossRef] [PubMed]
- Ramis, J.; Del Rey, R.; Alba, J.; Godinho, L.; Carbajo, J. A model for acoustic absorbent materials derived from coconut fiber. Mater. Constr. 2014, 64, e008. [Google Scholar] [CrossRef] [Green Version]
- Crandall, I.B. Theory of Vibrating Systems and Sound; Van Nostrand: New York, NY, USA, 1926. [Google Scholar]
- Patraquim, R.; Godinho, L.; Tadeu, A.; Amado-Mendes, P. Influence of the presence of lining materials in the acoustic behavior of perforated panel systems. In Proceedings of the 18th International Congress on Sound and Vibration (ICSV 18), Rio De Janeiro, Brazil, 10–14 July 2018; pp. 3054–3061. [Google Scholar]
- Bugaru, M.; Vasile, O. Transfer matrix method for a single-chamber muffler. In Proceedings of the 11th WSEAS International Conference on Applied Mathematics, Dallas, TX, USA, 22–24 March 2007; Available online: https://www.researchgate.net/publication/262216316_Transfer_matrix_method_for_a_single-chamber_Mufflers (accessed on 21 November 2022).
- Mechel, F.P. Formulas of Acoustics, 2nd ed.; Springer: Berlin/Heidelberg, Germany, 2008. [Google Scholar]
- Garai, M.; Pompoli, F. A simple empirical model of polyester fiber materials for acoustical applications. Appl. Acoust. 2005, 66, 1383–1398. [Google Scholar] [CrossRef]
- EN 10534-2:2002; Acoustics—Determination of Sound Absorption Coefficient and Impedance in Impedances Tubes Part 2: Transfer-Function Method. ISO: Geneva, Switzerland, 2002. Available online: https://www.en-standard.eu/une-en-iso-10534-2-2002-acoustics-determination-of-sound-absorption-coefficient-and-impedance-in-impedances-tubes-part-2-transfer-function-method-iso-10534-2-1998/ (accessed on 21 November 2022).
- Vasile, O.; Miculescu, F.; Voicu, S.I. Correlation aspects between morphology, infrared and acoustic absorption properties of various materials. Optoelectron. Adv. Mater. Rapid Commun. 2012, 6, 631–638. [Google Scholar]
Figure 1.
Proposed structures with a perforated sheet (two cases).

Figure 2.
Photo of the measuring system for the acoustic absorption using the TFM.

Figure 3.
Sound-absorbing panel structure (a) Panel section, (b) Detail perforated panel sheet.

Figure 4.
The sound absorption coefficient of mineral wool boards.

Figure 5.
The sound absorption coefficient of mineral wool boards with polyethylene.

Figure 6.
Sound absorption coefficient in both cases.

Figure 7.
Experimental data versus predicted data by PSAC-TMM for Case 1.

Figure 8.
Experimental data versus predicted data by PSAC-TMM for in Case 2.

Figure 9.
Predicted data by PSAC-TMM for in Case 1 for variation of porosity factor .

Figure 10.
Predicted data by PSAC-TMM for in Case 2 for variation of porosity factor .


Table 1.
Environmental settings.
| Samples Tested | Atmospheric Pressure (hPa) | Temperature (°C) | Relative Humidity (%) | Evaluated Parameters | ||
|---|---|---|---|---|---|---|
| Velocity of Sound (m/s) | Density of Air (kg/m3) | Characteristic Impedance of Air (Pa/(m/s)) | ||||
| Vb1 | 1005 | 25.3 | 29 | 346.33 | 1.171 | 405.6 |
| Vb2 | 1005 | 25.4 | 29 | 346.38 | 1.171 | 405.5 |
| Vb1+F | 1005 | 25.3 | 29 | 346.33 | 1.171 | 405.6 |
| Vb2+F | 1005 | 25.5 | 29 | 346.44 | 1.170 | 405.4 |
| Case 1 (Average of 3 tested samples) | 1005 | 25 | 31 | 346.15 | 1.172 | 405.8 |
| Case 2 (Average of 3 tested samples) | 1005 | 25.07 | 30 | 346.19 | 1.172 | 405.7 |
Table 2.
The input data.
| Tube | Characteristics |
|---|---|
| Type | Medium |
| Microphone Spacing | 0.0318 m |
| Distance to Sample from Mic. 2 | 0.0635 m |
| Distance to Source from Mic. 1 | 0.37 m |
| Diameter | 0.0635 |
| Lower Frequency Limit | 100 Hz |
| Generator | |
| Waveform | Random |
| Signal Level | 1.414 Vrms |
| Pink Filter | Off |
| Measurement | |
| Frequency Lines | 800 |
| Frequency Span | 3.2 kHz |
| Frequency Averages | 100 |
| Frequency Resolution | 4.0 Hz |
| Centre Frequency | 1600 Hz |
Table 3.
Geometric and physical characteristics of studied cases used on PSCA-TMM.
| Symbol | Value | Units | |
|---|---|---|---|
| The rigid basalt wool board–rockwool thickness (case 1) | 50 | mm | |
| The rigid basalt wool board–rockwool thickness (case 2) | 100 | mm | |
| The polyethylene foam thickness | 2 | mm | |
| The mass density of the basalt wool | 70 | ||
| The flow resistivity of the basalt wool | 28.4 | ||
| The mass density of the polyethylene foam foil | 18 | ||
| The airflow resistivity of the polyethylene foam foil [20] | 1650 | ||
| The perforated sheet thickness | 0.8 | mm | |
| Diameter of perforations (perforated sheet) | D | 6.5 | mm |
| The radius of perforation (perforated sheet) | r | 3.25 | mm |
| The porosity factor of perforated sheet | 38.6 | % | |
| Density of air | 1.172 | ||
| The velocity of sound (at 25 °C) | 346.17 | m/s | |
| The characteristic impedance of air | 405.7 | Pa/(m/s) | |
| The coefficient of air viscosity |
Disclaimer/Publisher’s Note: The statements, opinions and data contained in all publications are solely those of the individual author(s) and contributor(s) and not of MDPI and/or the editor(s). MDPI and/or the editor(s) disclaim responsibility for any injury to people or property resulting from any ideas, methods, instructions or products referred to in the content. |
© 2022 by the authors. Licensee MDPI, Basel, Switzerland. This article is an open access article distributed under the terms and conditions of the Creative Commons Attribution (CC BY) license (https://creativecommons.org/licenses/by/4.0/).
Share and Cite
MDPI and ACS Style
Vasile, O.; Bugaru, M. Experimental vs. Numerical Computation of Acoustic Analyses on the Thickness Influence of the Multilayer Panel. Computation 2023, 11, 1. https://doi.org/10.3390/computation11010001
AMA Style
Vasile O, Bugaru M. Experimental vs. Numerical Computation of Acoustic Analyses on the Thickness Influence of the Multilayer Panel. Computation. 2023; 11(1):1. https://doi.org/10.3390/computation11010001
Chicago/Turabian StyleVasile, Ovidiu, and Mihai Bugaru. 2023. "Experimental vs. Numerical Computation of Acoustic Analyses on the Thickness Influence of the Multilayer Panel" Computation 11, no. 1: 1. https://doi.org/10.3390/computation11010001
Note that from the first issue of 2016, this journal uses article numbers instead of page numbers. See further details here.