This section presents the edge detection accuracy and noise robustness achieved by the proposed method based on the gradient technique and GT2 FSs (explained in
Section 4) when this is applied on color images in the Lab, HSV, and RGB formats. The experiments were applied on the image database presented in
Table 2 and the performance of the proposed method is compared with two other fuzzy edge detection approaches (T1 and IT2 FSs), and with the two classic methods (Canny and Sobel).
The performance is measured by using the figure of merit of Pratt (Figure of Merit; FOM) [
36]; where the FOM is a useful metric for assessing the quality of edge detectors, which consists of evaluating the distance between two images—the first represents the output edges obtained by the proposed method (GT2 fuzzy edge detector) and the second is a reference image or the ground truth (in
Table 2). The output measure varies in the range [0, 1], where 1 is the optimal value, i.e., the output edges are similar with respect to the reference image.
Fuzzy Edge Detection Method Applied on the Synthetic Color Images
In the first test, the fuzzy edge detection methods based on T1, IT2, and GT2 FSs were applied on the image database presented in
Table 2. These images were converted to the Lab, HSV, and RGB color formats in order to analyze the advantage of using one format color over the others.
In
Table 3 the FOM values achieved by the T1 FSs edge for the Lab, HSV, and RGB formats are presented.
The results achieved by the IT2 fuzzy edge detection for the Lab, HSV, and RGB color format images are shown in
Table 4.
The FOM values achieved by the proposed method based on GT2 FSs are presented in
Table 5.
In
Table 6, a summary of
Table 3,
Table 4 and
Table 5 is presented and we also include the results achieved by the Canny and Sobel edge detection methods. According to these results, we can conclude that the edge detection method based on IT2 FSs achieved better FOM values than the T1 FSs for the three different color formats. Nevertheless, the proposed method based on GT2 FSs improved most of the results in comparison with the IT2 FSs, T1 FSs, Canny, and Sobel methodologies; additionally, we can notice that the FOM values obtained by the Sobel operator are the lowest, followed by those of the Canny method.
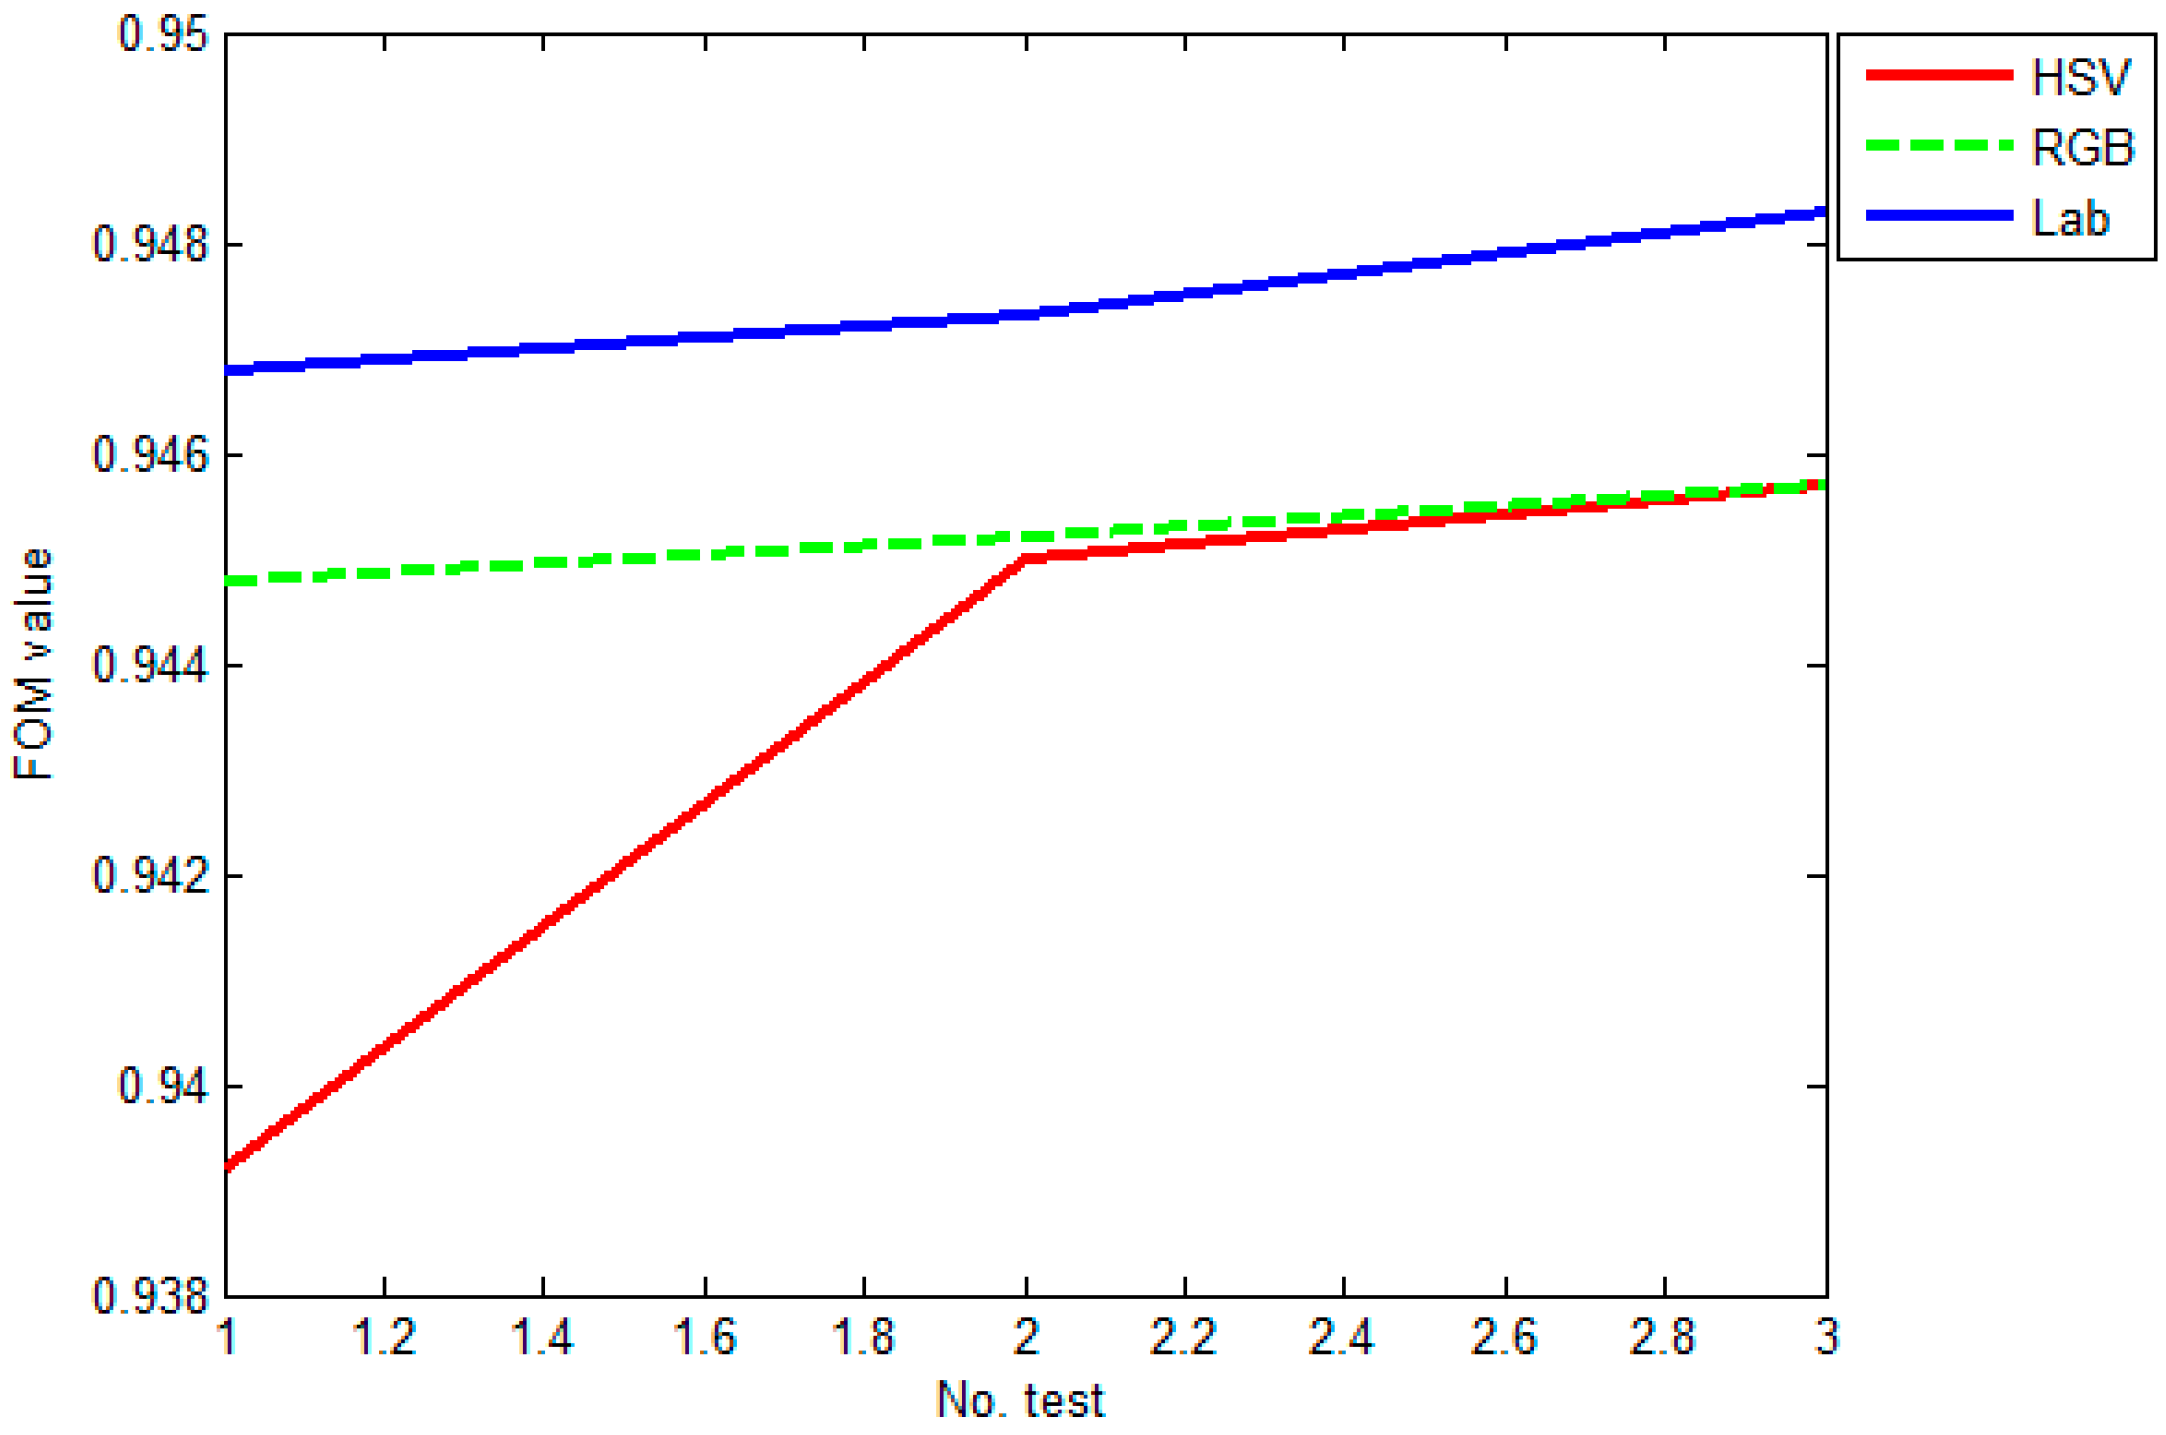
An interesting finding in
Table 6 is that, according to the FOM values, four of the five methods achieved better results when the Lab color format was used; this means that the Lab format provides more information about the image, which is a good point to consider in image processing applications, especially those that work with the edge detection process. In
Figure 7, we present a plot of the FOM values achieved by the three different fuzzy edge detection methods when these are applied over the Lab, HSV, and RGB formats; we can see the advantage of using the Lab color format in this kind of application.
In order to evaluate the ability of the fuzzy techniques to handle the uncertainty (noise) of the images of
Table 2, they were corrupted using Gaussian noise levels (20, 30, 40, and 50 dBi). In
Table 7,
Table 8 and
Table 9 we present the FOM average value achieved by the T1, IT2, and GT2 FSs edge detection after these were applied on Lab, HSV, and RGB images.
From
Table 7 (T1 FSs) we see that for images with Gaussian noise of 20 dBi, the FOM value (0.9367) was better in the HSV color format. For 30 and 40 dBi the FOM values (0.9489, 0.9485) were better with the Lab color format; for 50 dBi the FOM result (0.9457) was higher using the RGB color format.
From
Table 8 (IT2 FSs) we observe that for the images with 20 dBi of Gaussian noise, the HSV color format has a better FOM value (0.9385); however, for 30, 40, and 50 dBi the FOM values were higher in the Lab format.
In
Table 9, the simulation results after applying the GT2 FS edge detection on images with Gaussian noise are presented. In these results we notice that the FOM value (0.9392) was better when the HSV color format was used under a noise level of 20 dBi; for 40 and 50 dBi the FOM values (0.9491, 0.9489) were better using the Lab color format; in this test the RGB format has higher FOM for a noise level of 30 dBi (0.9563).
Finally, we present a comparative analysis in which the results are classified by color format. In
Table 10,
Table 11 and
Table 12 we present the results achieved by the three fuzzy edge detection methods and two traditional methods (Canny and Sobel) when these are applied on Lab, HSV, and RGB color format images, respectively. According to the results of
Table 10, the FOM values were better when the GT2 FS was applied for the different noise levels (20, 30, 40, and 50 dBi). Moreover, in
Table 11 (HSV) and
Table 12 (RGB) we notice that the GT2 FSs also improved the results, obtaining the best FOM accuracy. Additionally, we notice that the Sobel method achieved the lowest results for all the cases, followed by Canny; this means that the traditional methods do not have additional parameters to handle uncertainty, which is the advantage of using fuzzy techniques in this kind of application.
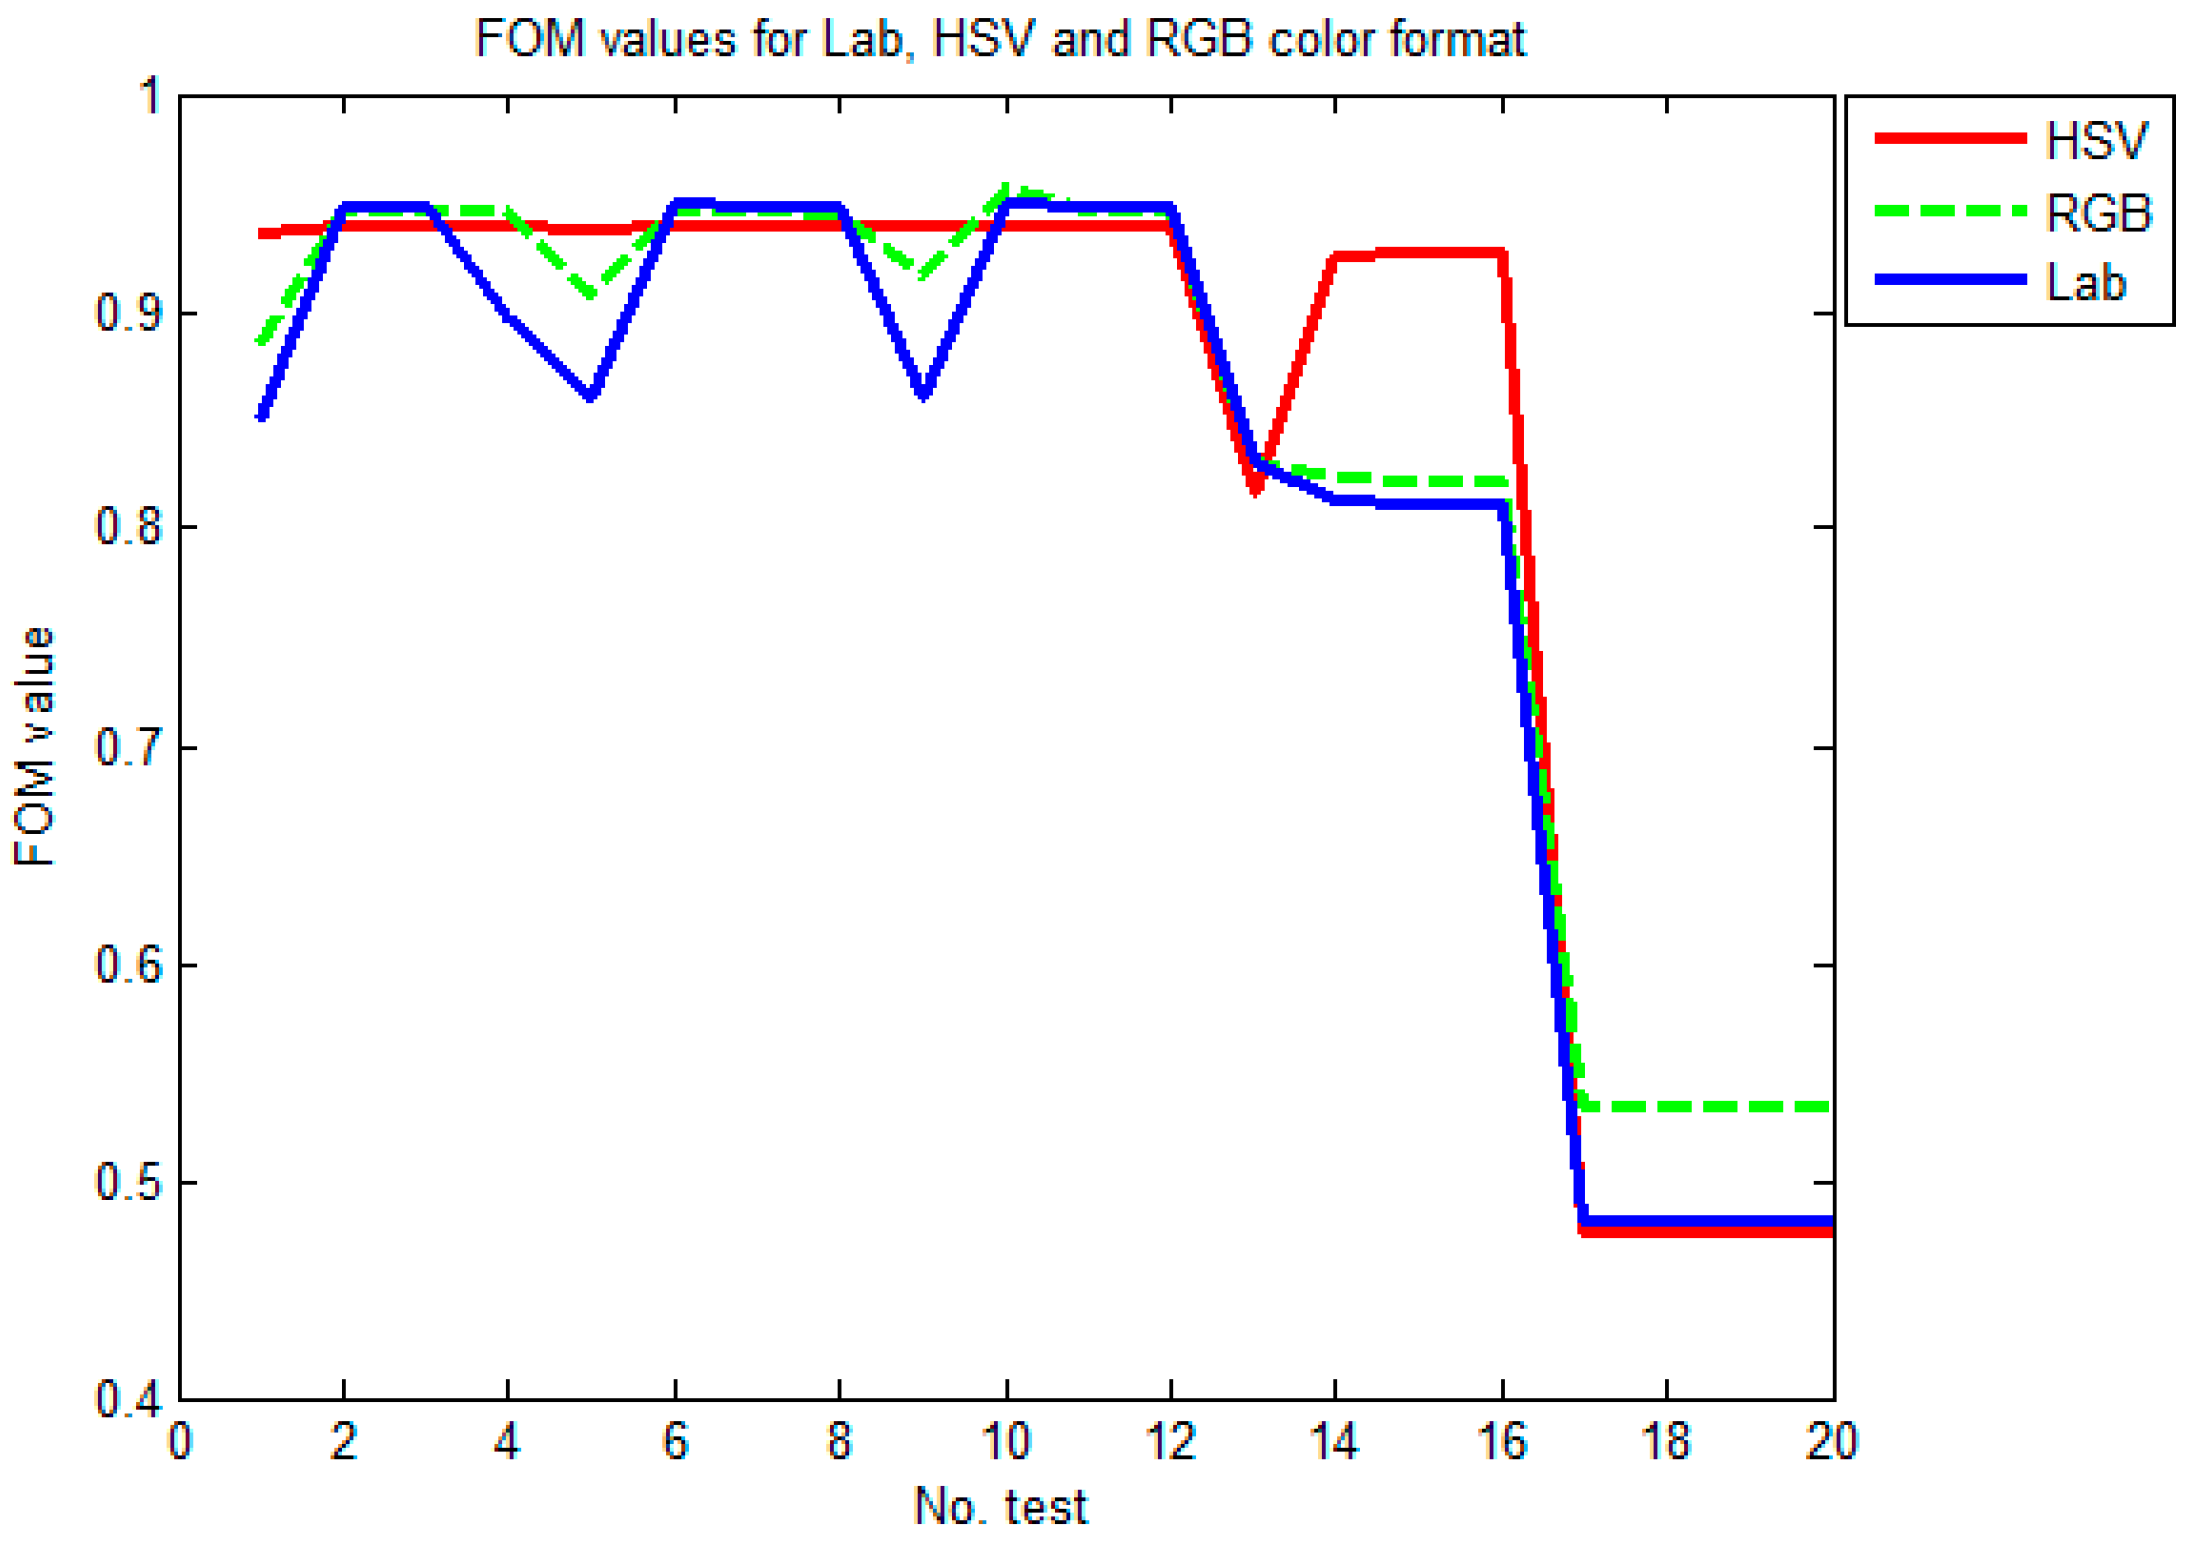
In
Figure 8, we present a plot to illustrate the FOM values by color format obtained by the five edge detection methods when these are applied in images with noise; in this figure we cannot observe clearly the difference, and for this reason we calculate the mean for each format color. For Lab color we obtained a FOM mean of 0.8126, for HSV a FOM mean of 0.8385, and for RGB a mean value of 0.8333. Therefore, for these tests we conclude that when the images are corrupted by noise, the HSV color format represents a good option, followed by the RGB color format.
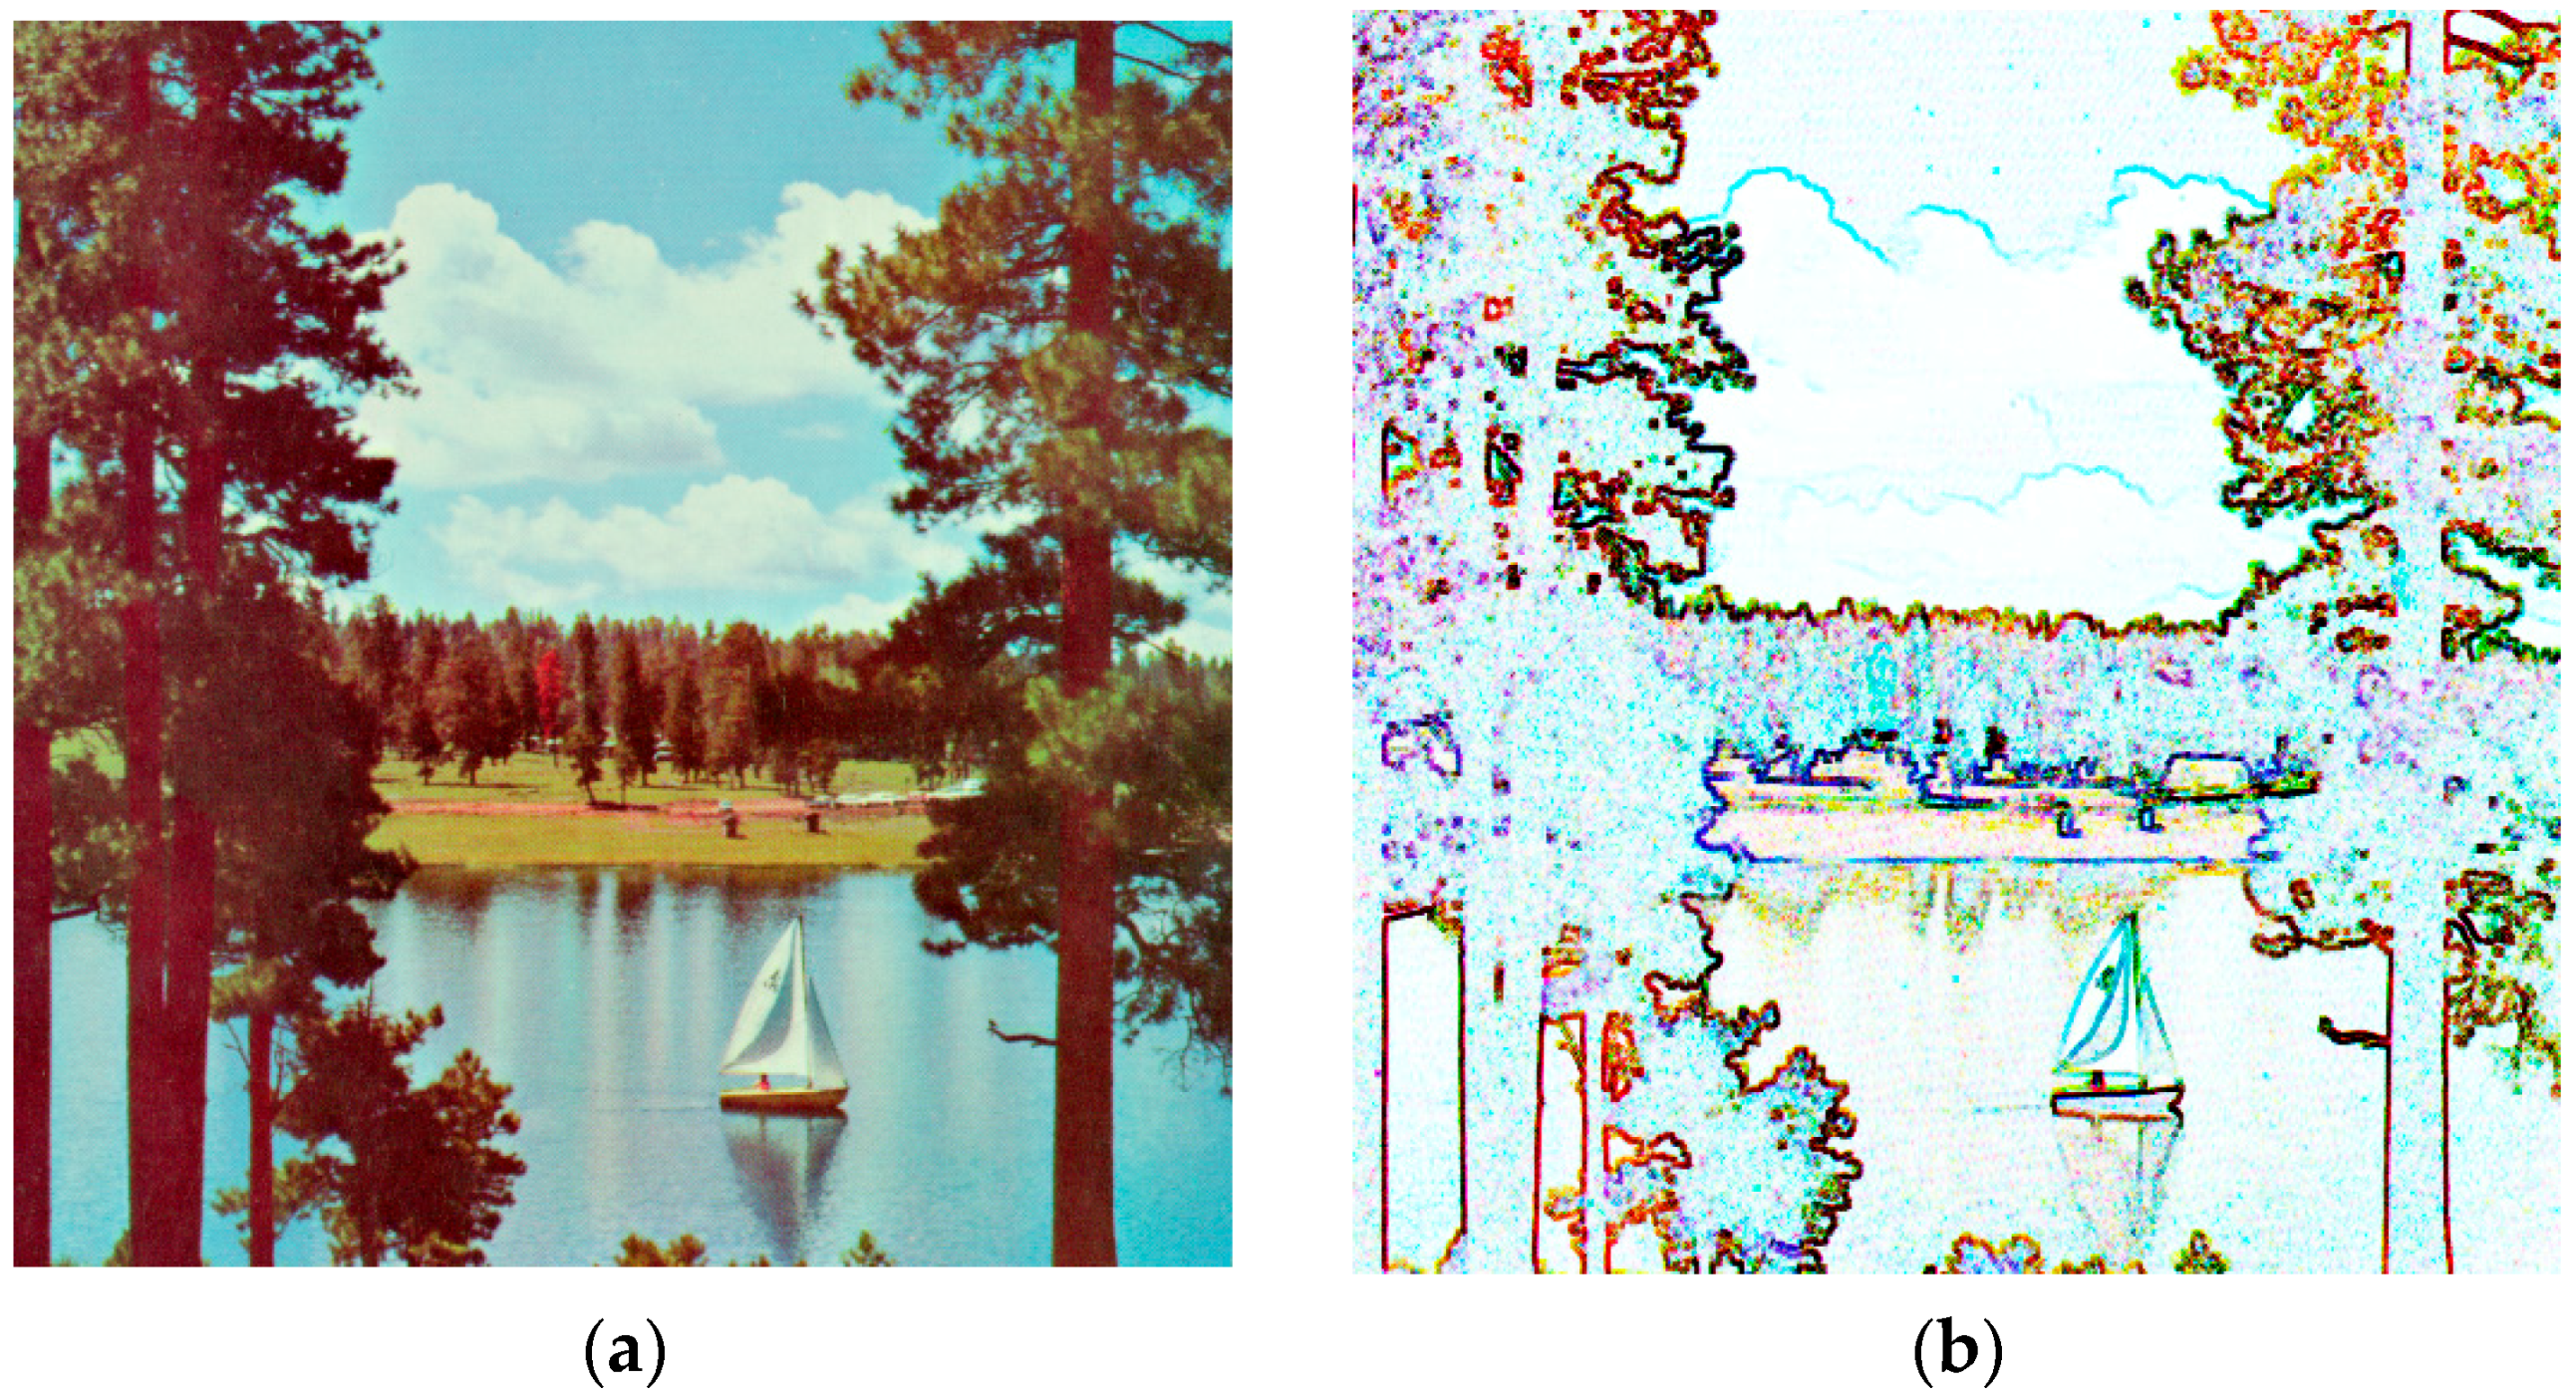
The visual edge detections for T1, IT2, and GT2 FSs are presented in
Table 13. Of course, graphically we cannot clearly appreciate the difference in the detected edges and for this reason the FOM measure was applied, but tests support the conclusion that GT2 FSs can outperform IT2 and T1 in edge detection process.


