Article

A Framework for Measuring Security as a System Property in Cyberphysical Systems

1
Department of Software Engineering, Florida Gulf Coast University, Ft. Myers, FL 33965, USA
2
Department of Math & Computer Science, Fayetteville State University, Fayetteville, NC 28301, USA
3
Air Force Research Laboratory, Rome, NY 13441, USA
4
Department of Electrical, Computer, Software, and Systems Engineering, Embry-Riddle Aeronautical University, Daytona Beach, FL 32114, USA
5
Department of Computer Science, University of Texas at Tyler, Tyler, TX 75799, USA
*
Author to whom correspondence should be addressed.
Information 2016, 7(2), 33; https://doi.org/10.3390/info7020033
Submission received: 15 February 2016 / Revised: 22 May 2016 / Accepted: 3 June 2016 / Published: 17 June 2016
(This article belongs to the Special Issue Evaluating the Security of Complex Systems)

Abstract

:
This paper addresses the challenge of measuring security, understood as a system property, of cyberphysical systems, in the category of similar properties, such as safety and reliability. First, it attempts to define precisely what security, as a system property, really is. Then, an application context is presented, in terms of an attack surface in cyberphysical systems. Contemporary approaches related to the principles of measuring software properties are also discussed, with emphasis on building models. These concepts are illustrated in several case studies, based on previous work of the authors, to conduct experimental security measurements.

1. Introduction

Measuring security, in general, and that of cyberphysical systems, in particular, is a difficult task for a number of reasons including primarily: vagueness of the concept of security itself, and inadequate knowledge of the principles of measurement. Despite multiple publications on the subject, there are no valuable or verified methods that would move the discipline forward. The conjecture of this paper is that measuring security as a system property has to be addressed in a broader context. Useful questions to define precisely what is meant by security as a property, include: What does security really mean in terms of the system? What are the implications for computer security, system security, information security and data security? To define what is meant by the cyberphysical system, a model of the system helps to realize the technical ramifications of design and through simulation answer questions, which determine what is being protected and made secure.
Probably the most important aspect of measuring security is the description of the measurement process itself. What is actually meant by a measurement? Understanding the measurement process is not necessarily the strongest side of security studies or practices. However, the real issue might be how to distinguish between the concepts of metrics and measures.
Accordingly, the objective of the paper is to clarify the concepts and illustrate their meaning through use in several case studies based on previous work of the authors. The paper is structured as follows. Section 2 outlines and advocates one view of security as a system property, Section 3 provides an overview of essential architectures and features of cyberphysical systems, with respect to measuring security, Section 4 presents a discussion of fundamental concepts of measurement theory, and Section 5 discusses five different case studies. The article ends with a conclusion in Section 6.

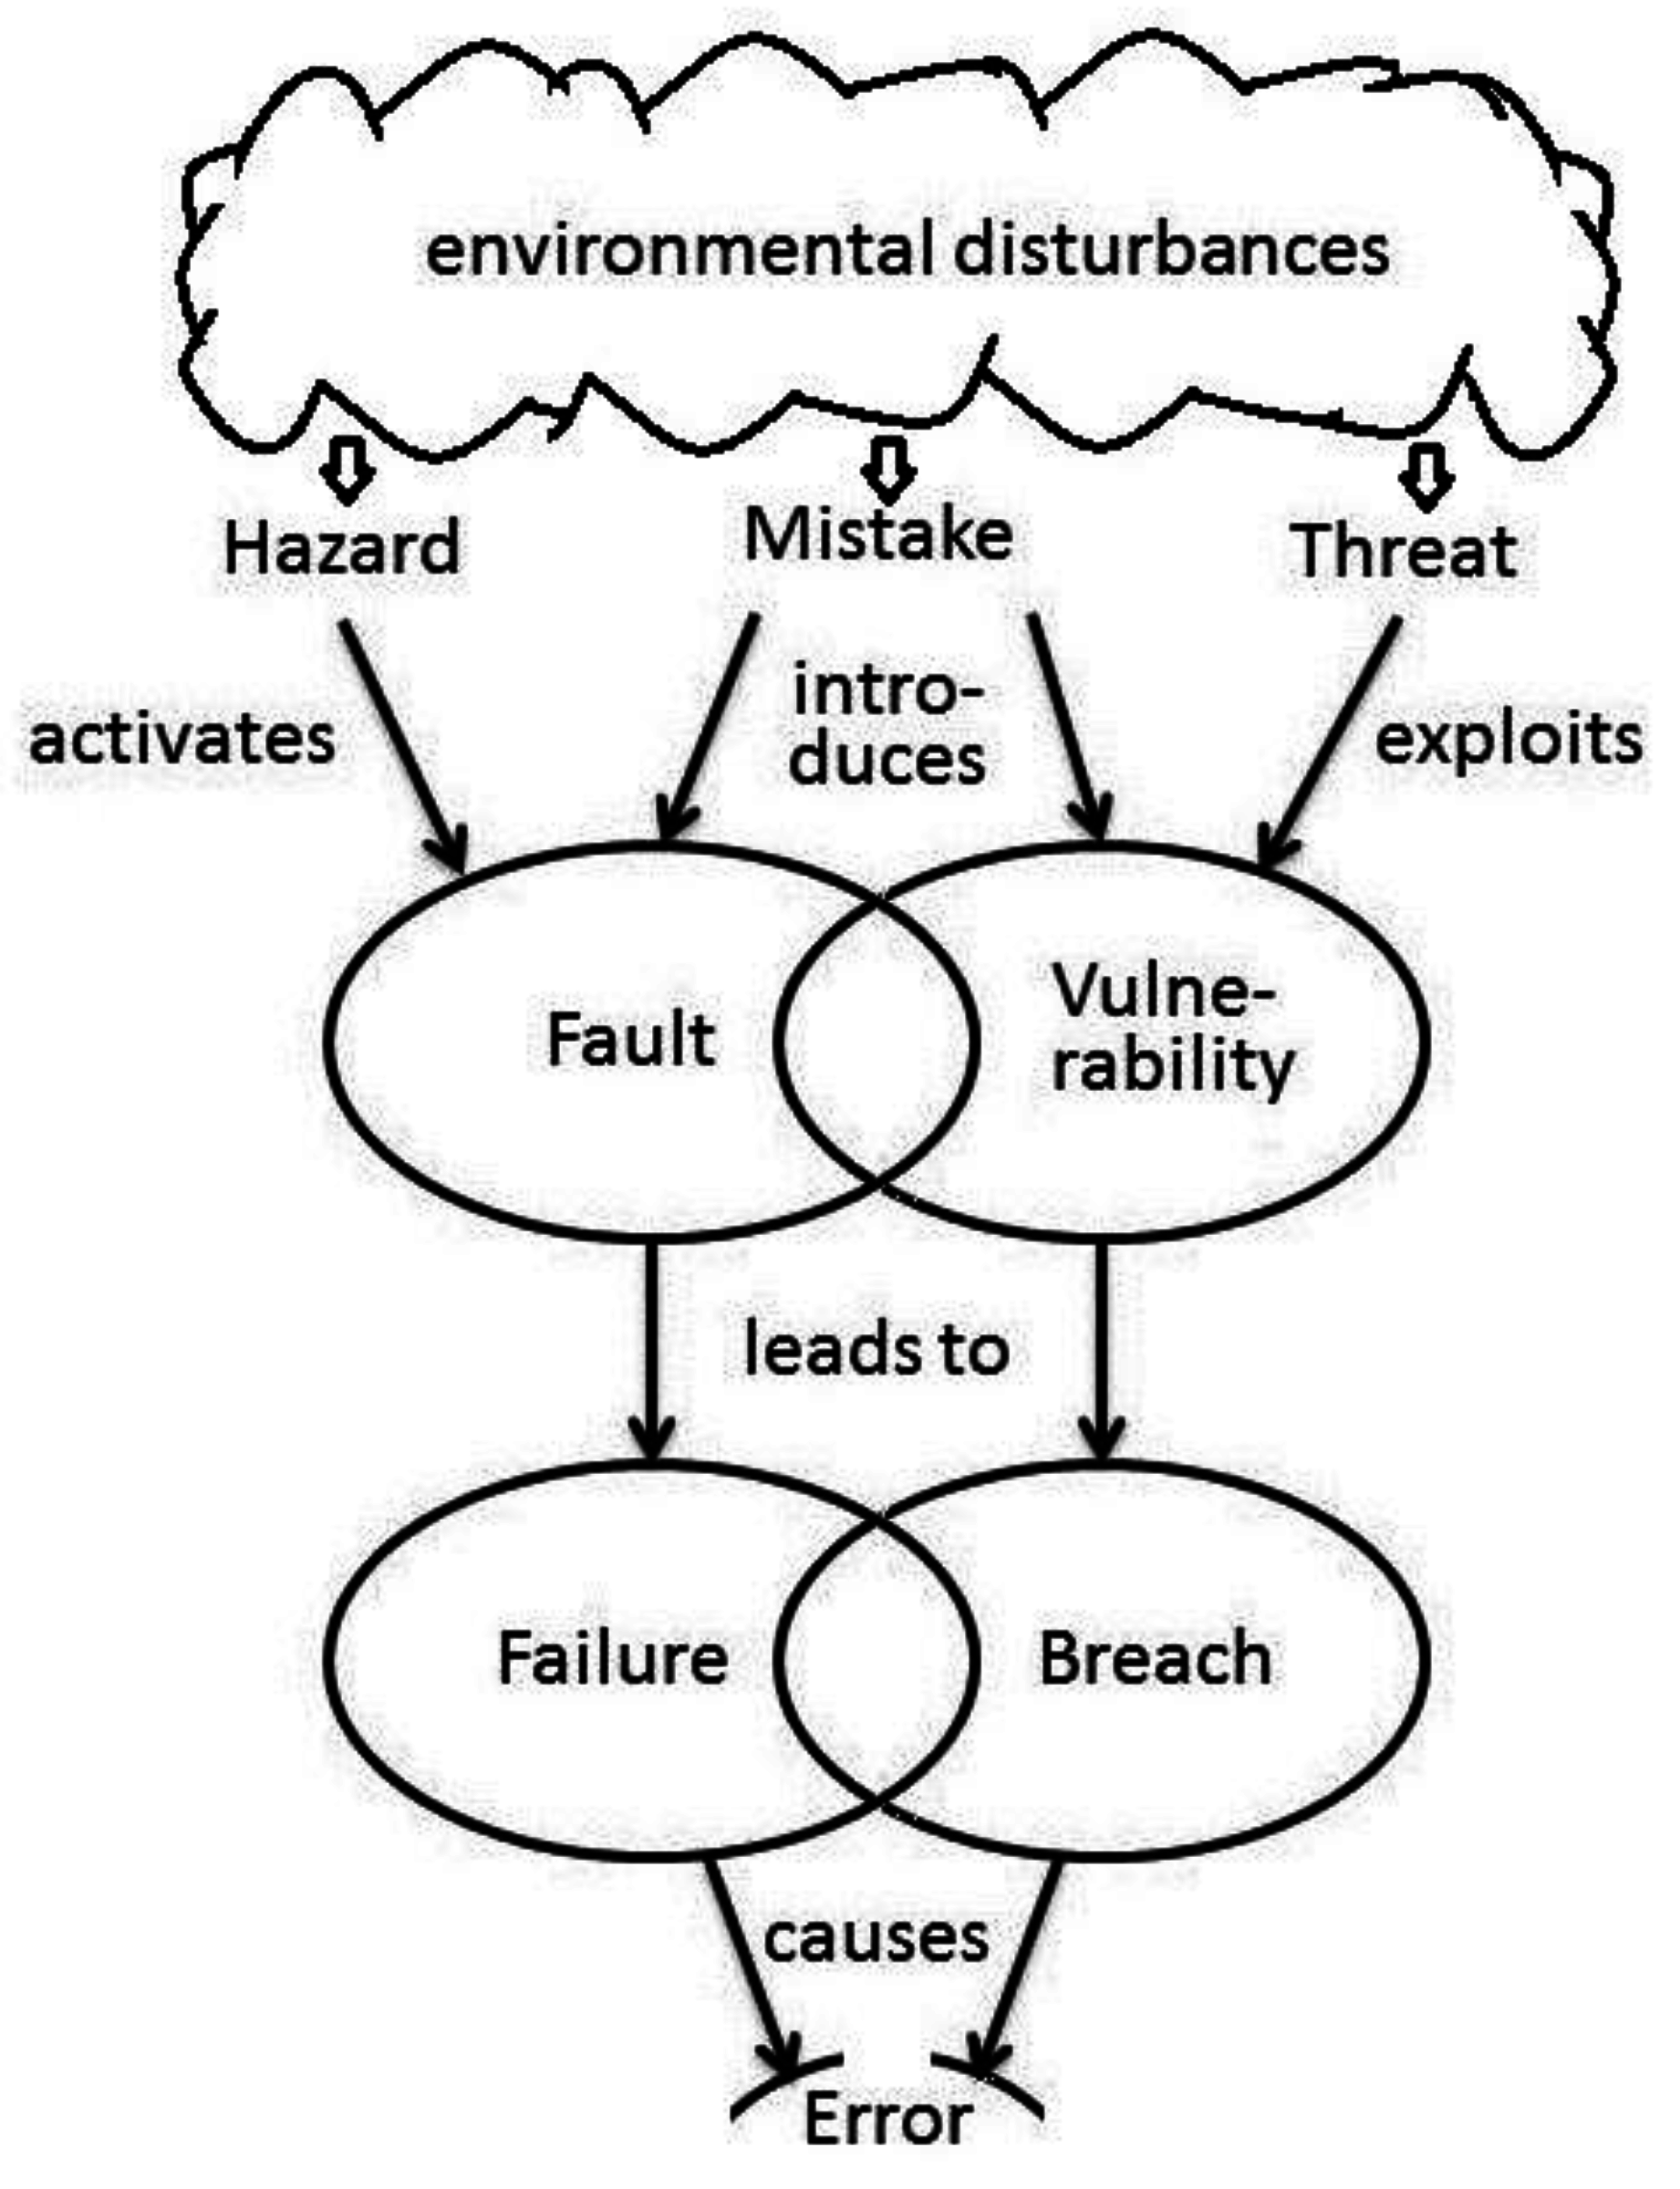
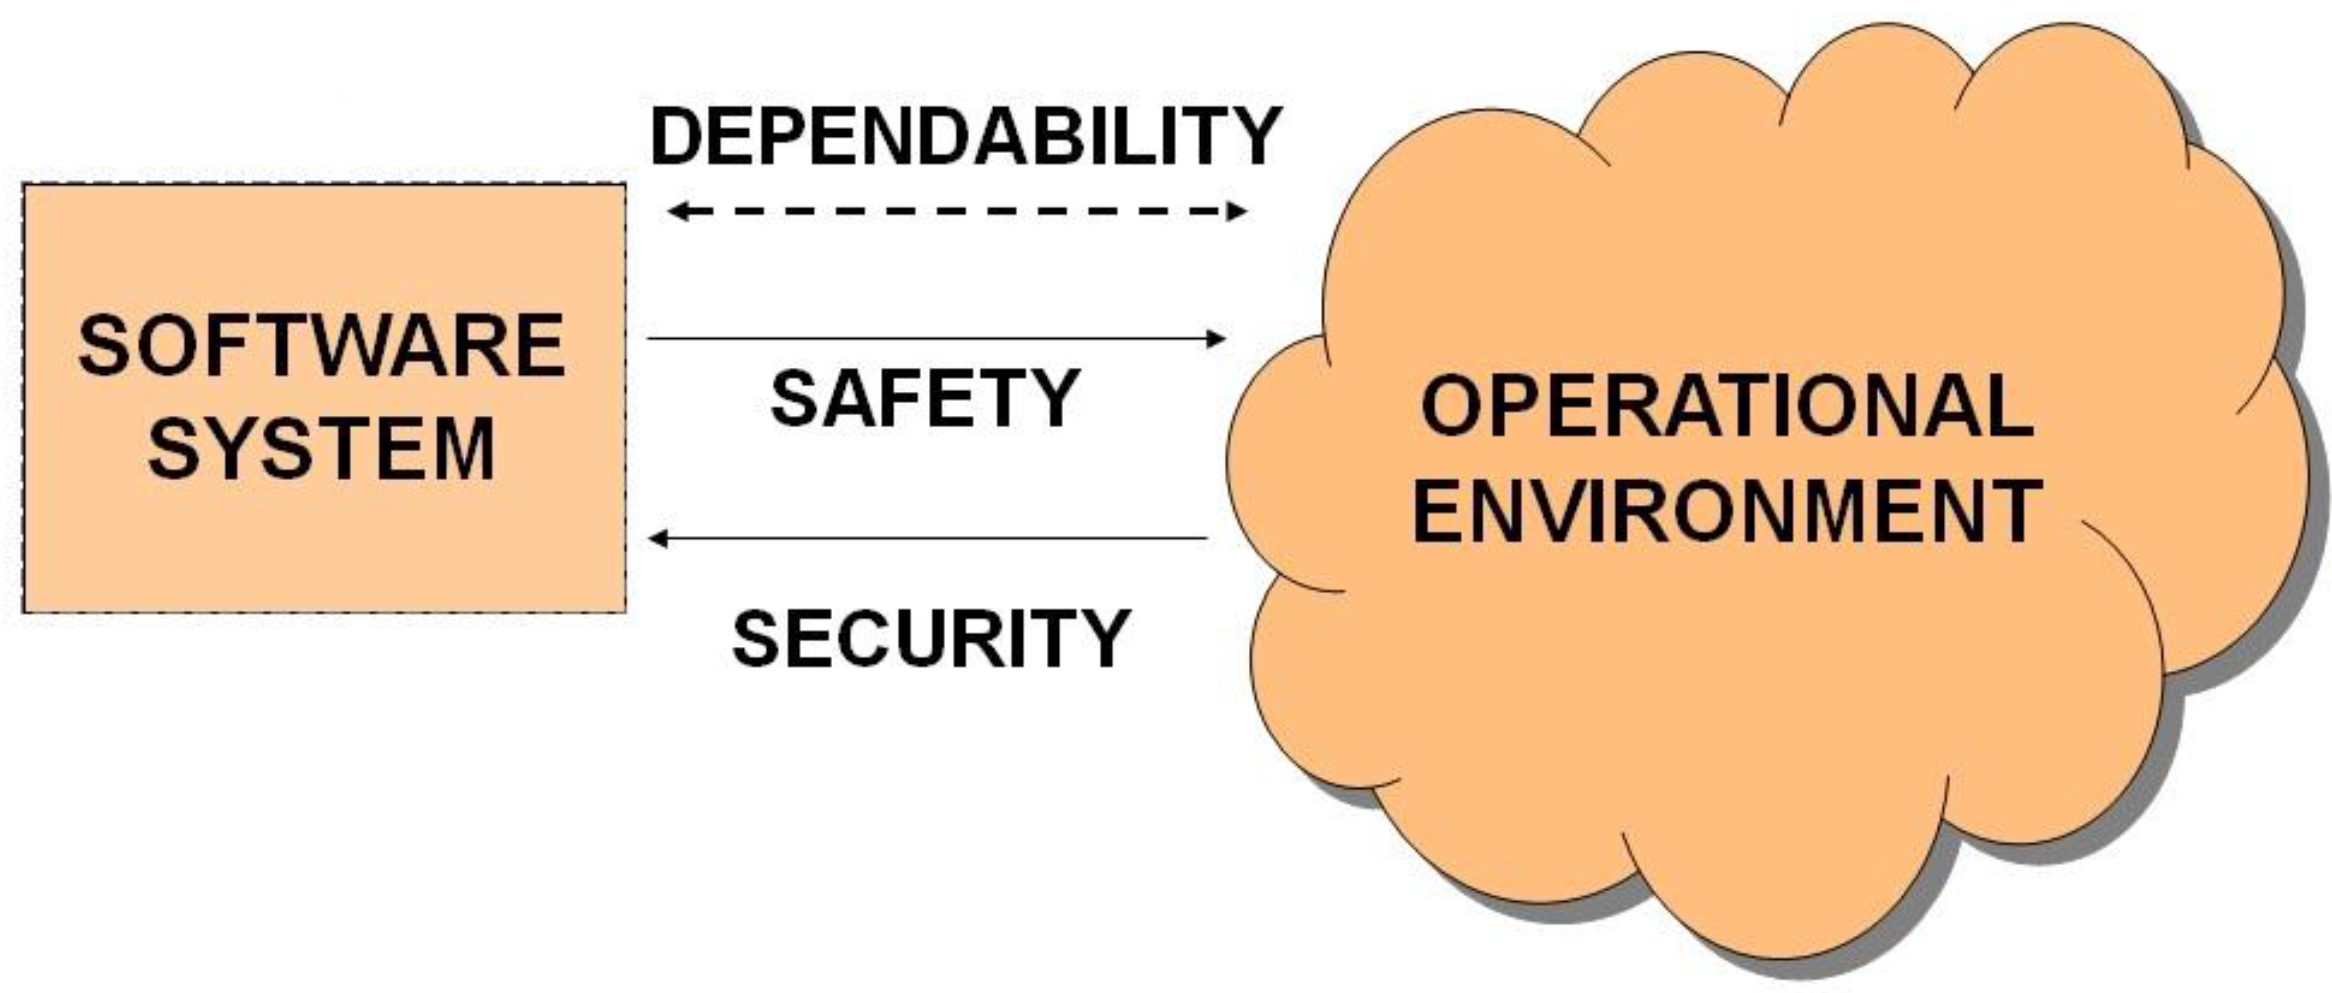
2. Security as a System Property

In a review of measuring security, there have been numerous publications in the last decade on security assessment, including books [1,2], research and engineering papers [3,4], government reports [5,6,7], and Internet sources [8,9], all of them discussing security metrics. However, the vast majority of the references deal with metrics at the management level and have very little to do with measurement in a scientific sense of the term, as developed in measurement theory [10].
What is meant by security and its metrics in these publications is primarily adherence to policy and standards, whether established in industry standards [11,12,13] or internal to the company [14,15], leading to the assessment of how security policies are executed, for example, by implementing respective processes and auditing them. As one paper defines it [16], security metrics mean “the measurement of the effectiveness of the organization’s security efforts over time.” While this method of security assessment is beneficial and productive, means to measure security as a property of a computing system or software are not particularly well developed and documented.
Focus on the quantitative assessment of operational aspects of security has become more popular in recent years. A thorough survey was published in 2009 [17], covering quantitative representation and analysis of operational security since 1981, and addressing the question whether “security can correctly be represented with quantitative information?” The major finding of this study was that “there exists significant work for quantified security, but there is little solid evidence that the methods represent security in operational settings.”
What is of specific interest in the current paper is not security at the enterprise or the organization level, but rather how security as a computer system property or software property can contribute to protecting information and other resources during system’s operation. In this regard, security can be viewed as one specific aspect of system’s dependability, the other two aspects being safety and reliability, with one of the earliest papers addressing this issue published over twenty years ago [18].
One has to remember, however, that security and safety, with reliability in between, are two sides of the same coin, mutually complementary aspects of dependability, as illustrated in Figure 1 and Figure 2. According to the International Electrotechnical Commission (IEC) [19], safety is defined as “freedom from unacceptable risk to the outside from the functional and physical units considered” whereas security is defined as “freedom from unacceptable risk to the physical units considered from the outside.” Translating this into the language used in the current paper:
  • Safety is concerned when a failure leads to severe consequences (high risk) for the operational environment;
  • Security is concerned when a failure to protect assets (a breach) leads to severe consequences (high risk) for the system itself (and potentially to its operational environment).
Looking at definitions of security in established standard glossaries, such as [20] or [21], it becomes immediately clear that in none of these documents is security defined as a system property. For example, one of several definitions in [21] reads as follows: “Protection of information and data so that unauthorized persons or systems cannot read or modify them and authorized persons or systems are not denied access to them” and a corresponding one in [22]: “A condition that results from the establishment and maintenance of protective measures that enable an enterprise to perform its mission or critical functions despite risks posed by threats to its use of information systems.”
Both of these definitions make sense, but not for our purposes, because they both refer to security as a state, as opposed to ability. System state is a discrete entity and can be described, by analogy to a program state, by all its variables and their values at any given time. This implies that a state can change upon applying appropriate inputs, and respective outputs can also be associated with the change of state.
A definition of security as a system property must imply a continuum and an assumption that one can measure it. In this regard, just like for several other properties [20,21], the definition should include a phrase “the extent to which” or “the degree to which”. Consequently, we propose adopting the definition of security from [21], to read as follows: “The extent to which information and data are protected so that unauthorized persons or systems cannot read or modify them and authorized persons or systems are not denied access to them.”
What is additionally important and captured well in [21] is the fact that the secure system must be not only protected against threats but also accessible to those authorized to use it.
Having the definition in place, one needs to figure how to assess “the extent” or “the degree” to which the conditions spelled out in the definition are met. The community has adopted several ways to do it. One view, which gained especially wide popularity, is called the C-I-A triad, where the acronym comes from the first letters of, what are called, Confidentiality, Integrity, and Availability properties [23]. The assessment of the degree to which a system is secure can be based on meeting the three criteria of the C-I-A triad.

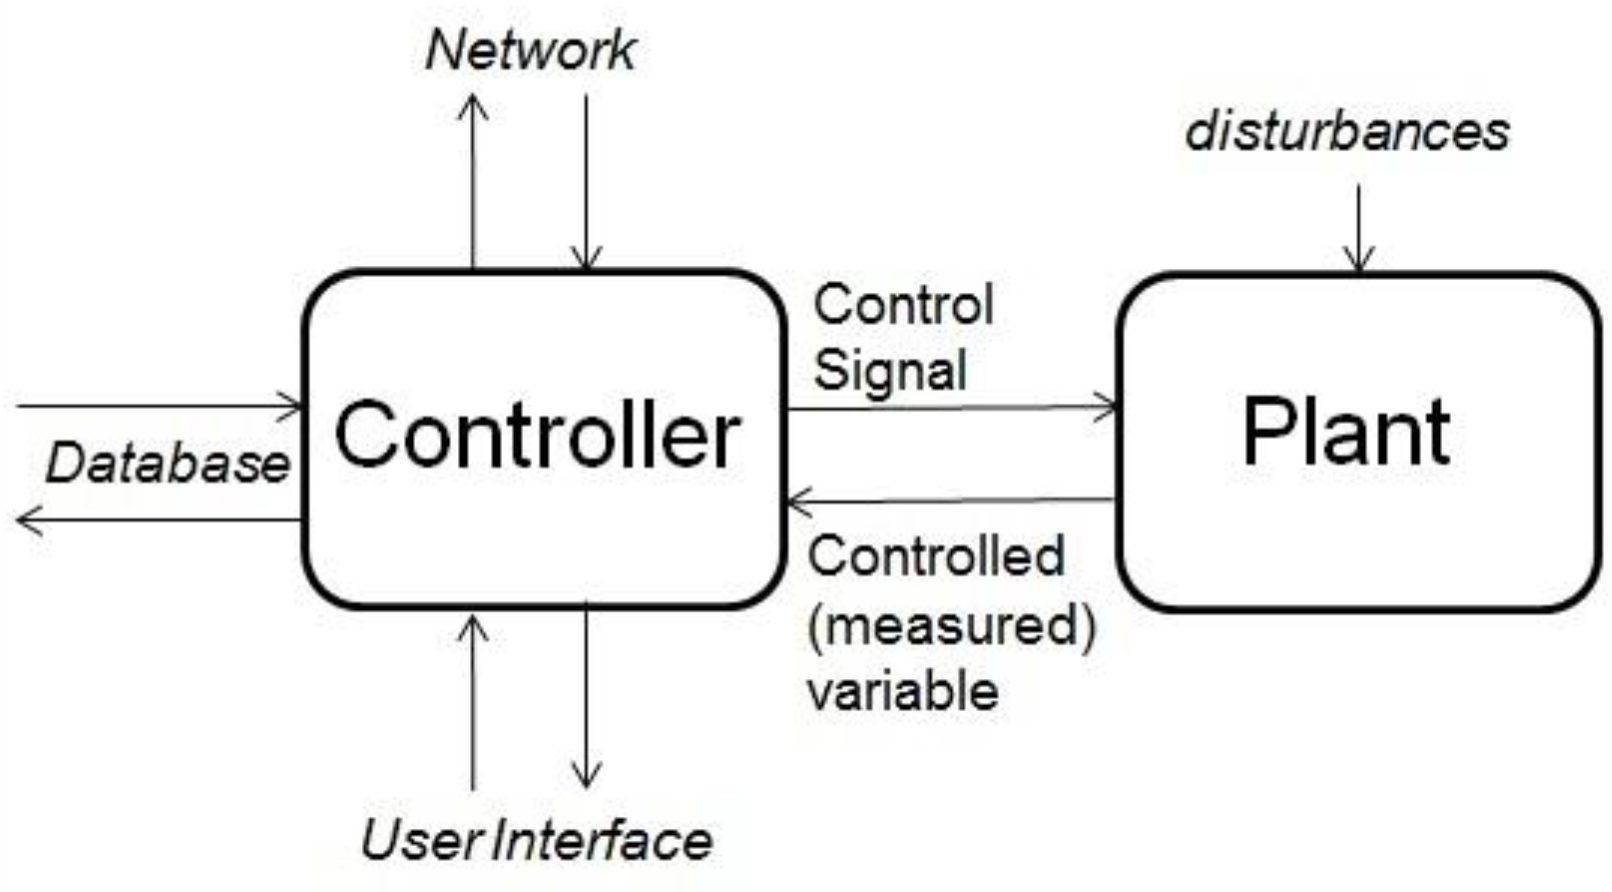
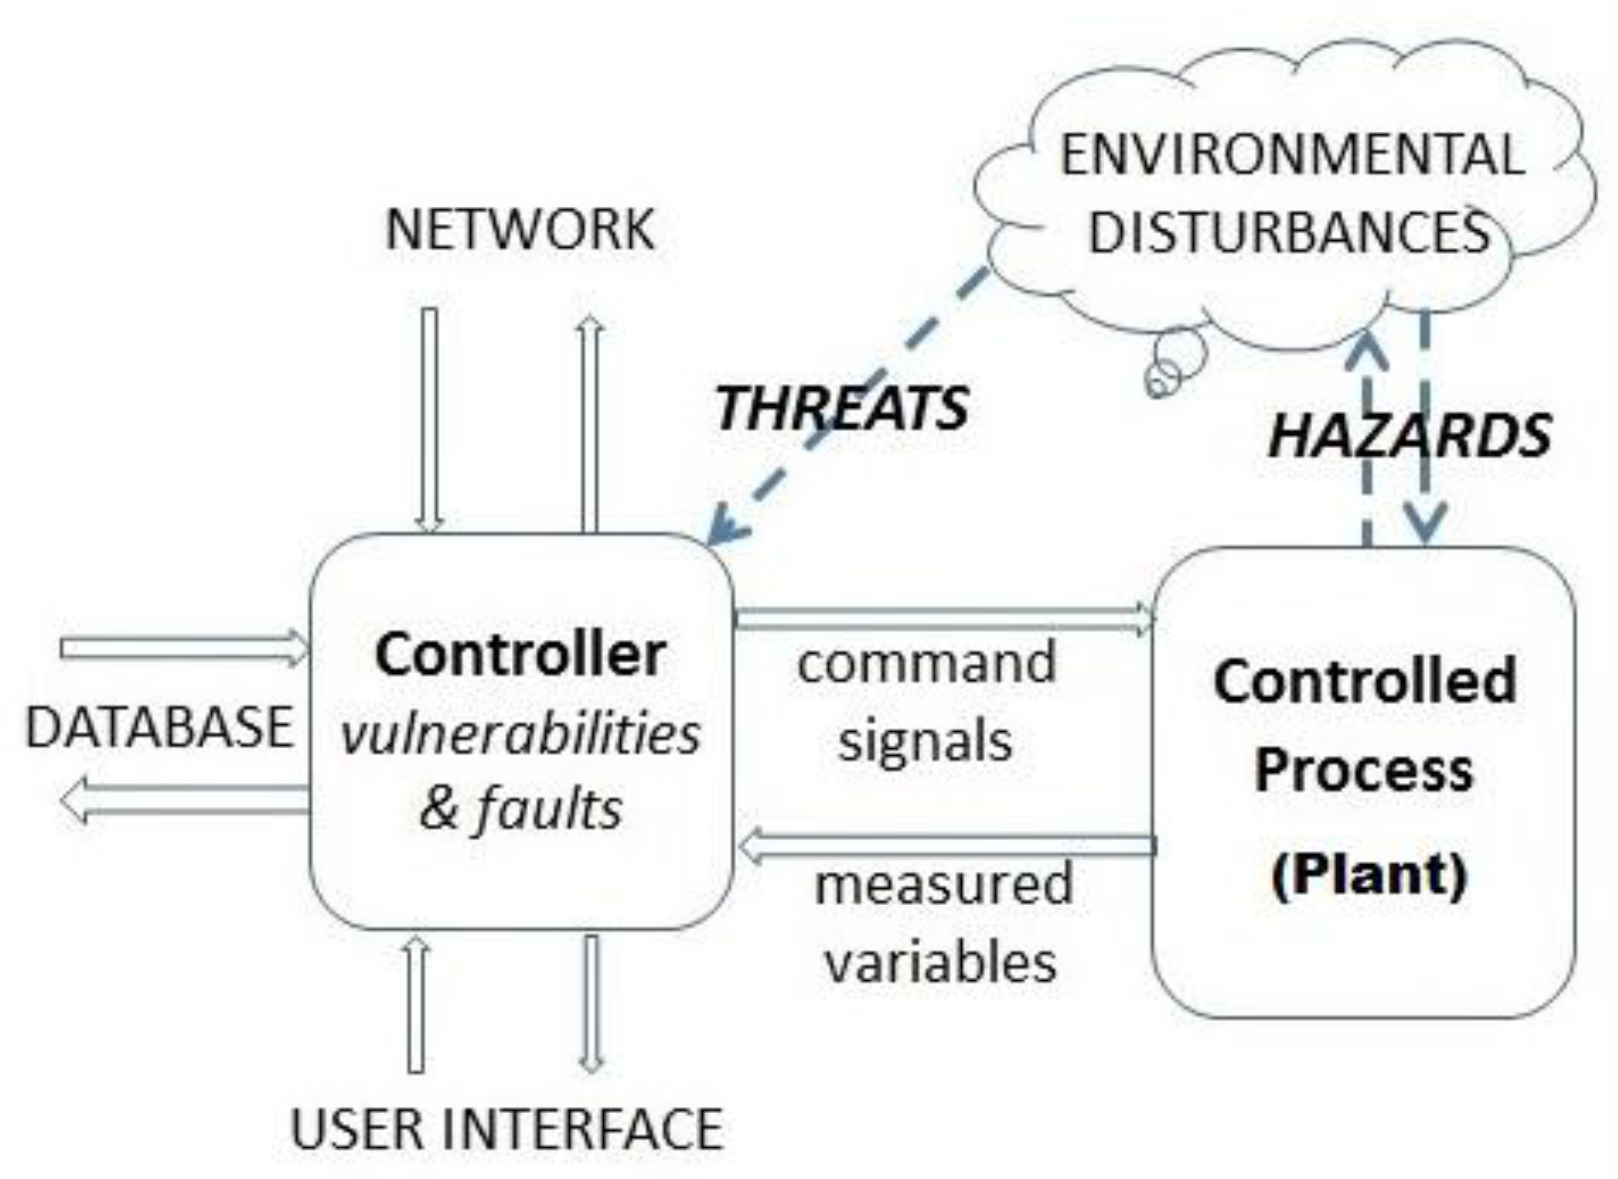
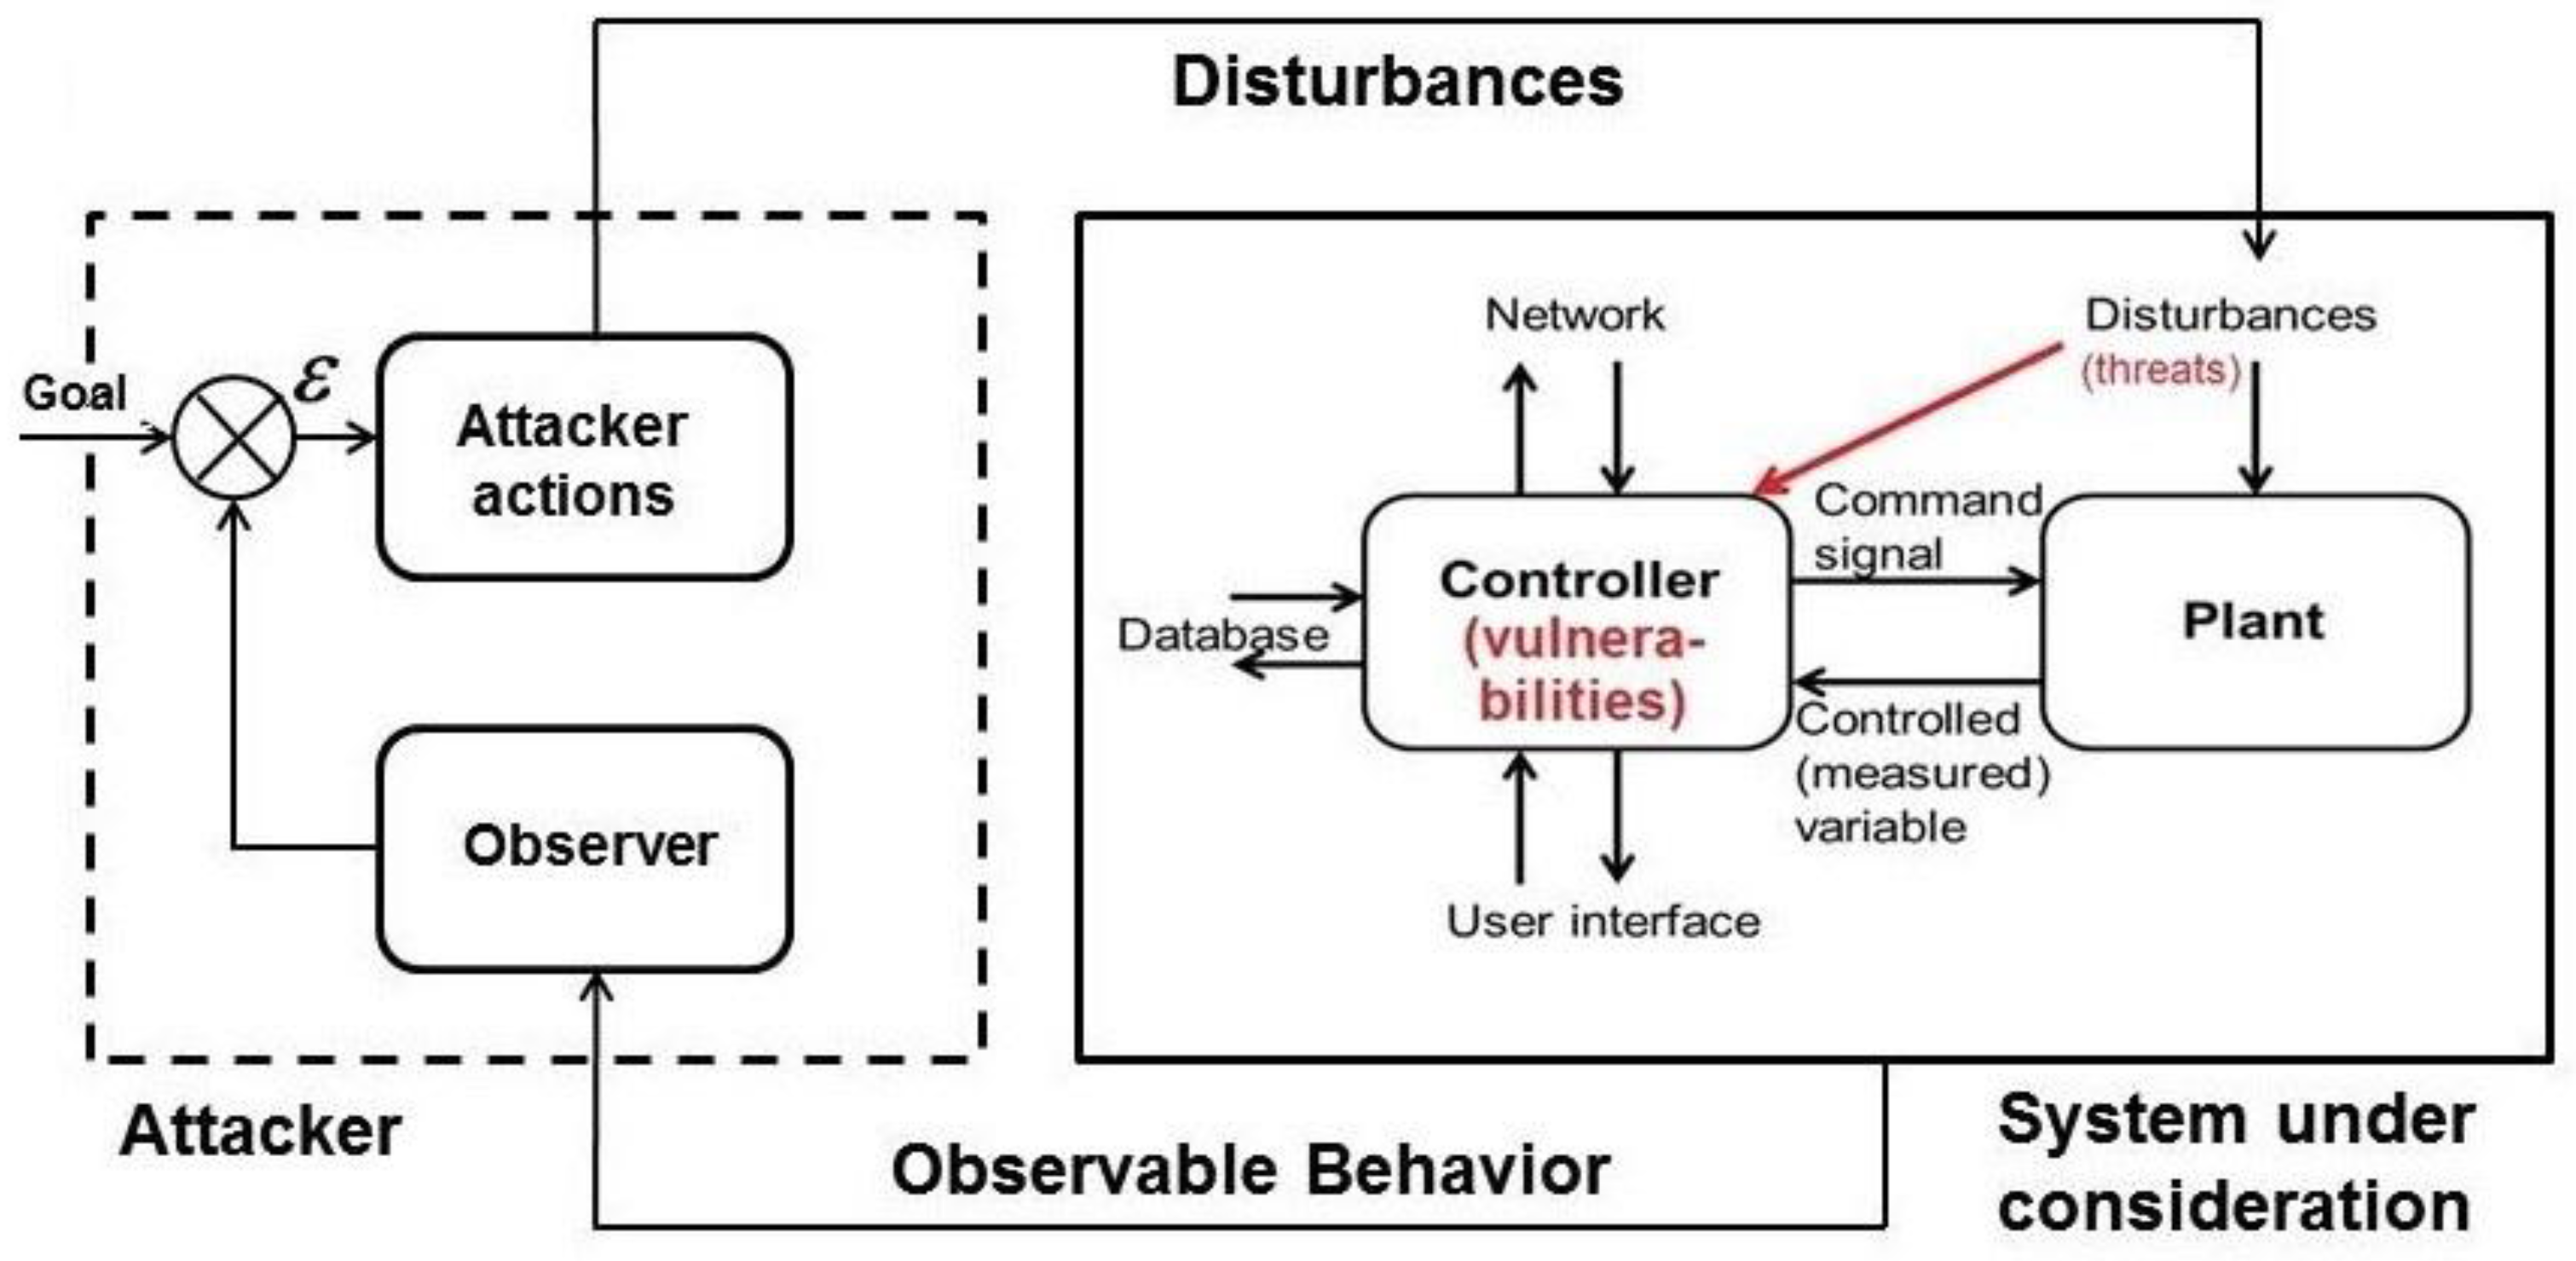
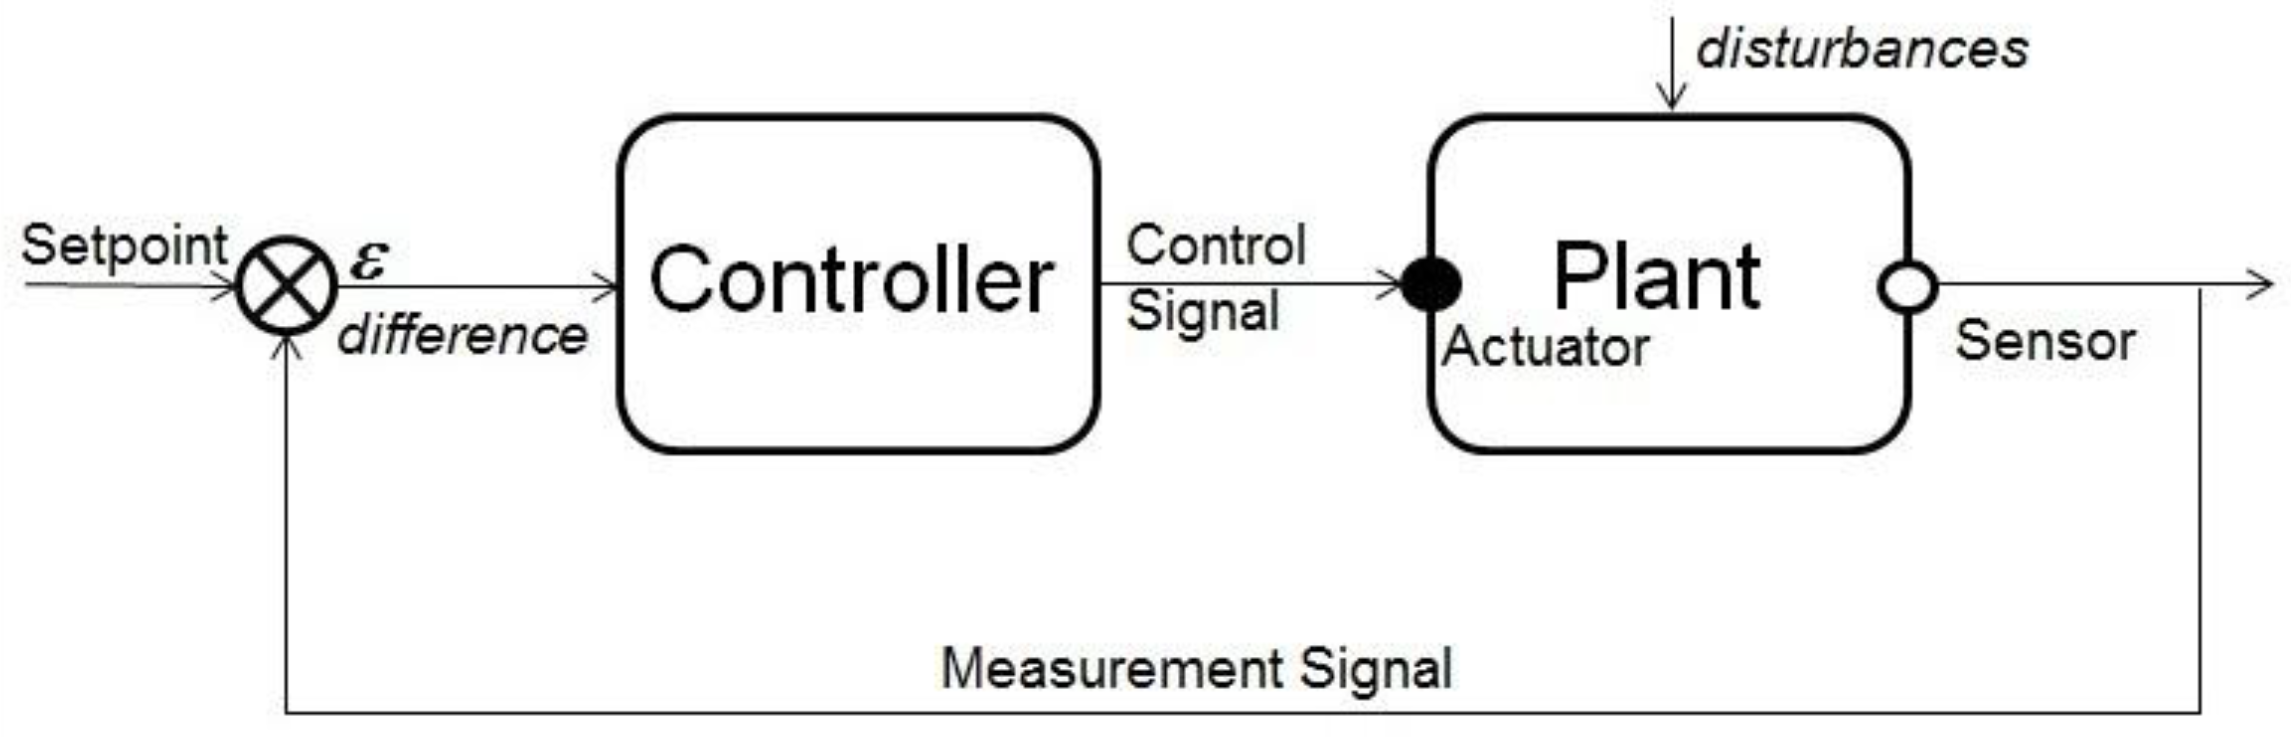
3. Cyberphysical Systems

Cyberphysical systems have their roots in embedded computer systems, which in turn evolved from control systems, long before digital computer control was conceived [24]. The essential structure of a simple control system is widely known, but for completeness is shown in Figure 3. It consists of a controller and a controlled object (commonly termed a plant). The sensor installed on a plant delivers a measurement signal to the controller, which on this basis, and a prescribed plan (setpoint), takes a decision value of a control signal to apply to an object via an actuator, to counteract potential variations in a controlled (measured) variable caused by disturbances.
A typical example of this sort of control system, which we are all familiar with, either from our homes, offices or cars, is a temperature controller, otherwise known as a thermostat. Historically, the oldest known device, which applies this type of control principle, is the Ktesibios water clock (third century B.C. [25]), stabilizing the water level in a tank to let it flow at constant rate, out to another tank at the lower level, to mark the passage of time.
With the development of digital technologies, control systems became miniaturized and directly embedded into plants, that is, controlled objects. At the same time, they were expanded to include operator (user) interface, and their parameter values, such as a setpoint, evolved into more sophisticated data sets, soon to reach the size of true databases. This expanded embedded control system’s structure is shown in Figure 4.
Once it became possible and desirable to implement a network connectivity feature in embedded controllers, a new breed of systems called cyberphysical systems came into being, which are in fact old embedded control systems enhanced by connectivity mechanisms. This is reflected in Figure 4 by a network interface.
Thus, for the purpose of this paper, a cyberphysical system can be defined as a computing system with access to physical measurement and control instruments as well as with connectivity to the Internet. As shown in Figure 4, in addition to a physical process (a plant) and network interfaces, user and database interfaces are also present.
Taking the analogy from control engineering, one would only keep interfaces relevant to security during the system’s operation and, as a result, derive a model of an embedded controller (or more broadly, a cyberphysical system) subject to security threats as shown in Figure 5.
Figure 5 shows that multiple controller interfaces to the process, the operator, the network, and the database, are all subject to security threats, forming the attack surface. More importantly, to take the analogy further, just like control theory assumes that the controlled process (a plant) is subject to disturbances, security theory, if one is developed for this model, could assume that known or unknown threats play the role of disturbances to the controller, via its all interfaces.
In this model, vulnerabilities affecting the controller are understood as a “weakness of an asset or group of assets that can be exploited by one or more threats” [26] or as a “weakness in an information system, system security procedures, internal controls, or implementation that could be exploited by a threat source” [22], while a threat can be defined as “a state of the system or system environment which can lead to adverse effects” [20]. Consequently, the disturbances in Figure 5 are an abstraction incorporating all threats relevant to security and play a role in assessing security.
With this complexity of controller interactions, when designing a Controller one has to take into account the Controller’s internal state, which may be a cause of significant disruptions to the Controlled Process, when a Controller fails. This is the subject of fault tolerance.
Technically, in safety engineering, external disruptions are representing hazards and in the model from Figure 5 can be viewed as affecting the Controlled Process, as specific disturbances. Formally, a hazard is “an intrinsic property or condition that has the potential to cause harm or damage” [21]. To assure dependability, the Controller has to be designed to deal with safety hazards, but they are not always easy to capture and are especially difficult to account for in the case of hardware or software faults.
Pairing this understanding of safety related concepts of Hazards and Faults with security related concepts of Threats and Vulnerabilities, one arrives at the aggregated model suitable for security modeling, as shown in Figure 6, which matches, from a different perspective, the model of Figure 2.

4. Principles of Measurement

With measures we often take things for granted, especially if it concerns such “trivial” quantities as length (distance) and weight (mass), but it has not always been so. As legend has it, it was Henry I, the King of England, who decreed in the first half of the XII-th century that a yard shall be “the distance from the tip of the King’s nose to the end of his outstretched thumb”, proclaiming what is believed to be the first standard of measuring length [27]. It appears that at the current stage of understanding how to measure security as a system property, we are at the point comparable to the early days of attempting to measure length. All methods we have are as vague as the one applied by Henry I in defining the unit of length. This section is devoted to clarification of the basic concepts of measurement and how they can be applied to building a model of security as a system property that could be used to measure security.

4.1. Hermann von Helmholtz’s Concept of Measurement

Although there are several concepts of measurement, they all seem to converge to the idea formulated in the 19-th century by Herman von Helmholtz, in his groundbreaking work “Zählen und Messen” [28], in which Helmholtz says: “The special relation which can exist between the attributes of two objects and which is designated by us by the name equality is characterized by […] Axiom I: If two magnitudes are equal to a third, they are equal to each other.”
This statement, which may seem trivial from today’s perspective, actually is very constructive and quite distinctly sets the stage for conducting measurements in a way that it determines the following:
  • a property (called an attribute by Helmholtz) of an object to be measured;
  • a standard, that is, in Helmholtz’ words, the third magnitude, to which others are compared;
  • implying an existence of a procedure used to make the comparisons between magnitudes.
This procedure is further characterized by von Helmholtz in the same work, as follows: “The procedure by which we put the two objects under proper conditions in order to observe the stated result and to be able to establish its occurrence or its non-occurrence, we shall designate as the method of comparison.”
Defining measurement procedures as a method of comparison, von Helmholtz gives several examples of physical quantities that can be measured, by comparison with a standard, including distance, time, brightness, pitch of tone, and weight, measured with the use of scales, for which he explains the measurement principle further: “… the bodies the weights of which we compare can consist of the most different materials and can be of different form and volume. The weight which we call equal is only an attribute of these bodies discriminated by abstraction.”
To summarize, the contribution of von Helmholtz was to make a clear distinction between three factors necessary for a measurement to make sense: (1) a property to be measured; (2) a standard against which comparisons are made; and (3) a procedure to determine how to make the comparisons. In modern terms, the standard can be viewed as a metric, and the measurement procedure relates to a measure, that is, the measuring instrument.
The contribution of von Helmholtz is significant, in terms of the logic of measurement and the associated theory. However, without questioning his work, newer theories treat the measurement processes as statistical in nature. The principal assumption of the statistical approach to measurements is that due to the inherent uncertainties in the measurement process, the result of a measurement always consists of two numbers: the value of the measured quantity and the estimation of the measurement uncertainty with which this value has been obtained (error).

4.2. Lessons from Measurements in Physics

To help realize the challenge of measuring system properties, one can look closer at the extreme of measuring strictly physical properties (quantities). In addition to length, mentioned above, among physical properties we are most familiar with are time and mass.
The current definition of a second, a metric (unit) of time, involves atomic radiation and reads as follows [29]: “the duration of 9 192 631 770 periods of the radiation corresponding to the transition between the two hyperfine levels of the ground state of the cesium 133 atom.” It must be noticed that this definition, just like the one of a unit of length, evolved historically from much less precise definitions and understanding of respective quantities. A historical background can be found in [29].
The metric of mass (its unit), a kilogram, is currently the only physical unit that officially remains defined based on a physical artifact, a prototype stored in the International Bureau of Weights and Measures. However, there is a substantial push towards defining it more precisely, using the number of atoms in a silicon 28 crystal [30]. Developing this new definition has yet to be fully successful, but (in the context of considering the definition of security) it is worth mentioning, why this is so: “The measurement uncertainty is 1.5 higher than that targeted for a kilogram redefinition […]. The measurement accuracy seems to be limited by the working apparatuses.” Clearly, any measurement of security must involve the use of measuring devices and assessment of their accuracy.
It may be further argued that security is not a physical property and cannot be measured directly, so considering such measurements would make little sense. In physics, however, there are quantities, which do not measure directly certain properties of matter. One such example is temperature, which is essentially a quantity corresponding to and measuring kinetic energy.
It is clear from these lessons that several points have to be taken into consideration, if one is to develop scientifically based security measurements:
  • The process of designing a validated metric of security may take years, if not decades;
  • Any measures of security must be treated as (physical or mental) measurement devices (instruments), to which regular statistical measurement theory applies;
  • Security is likely to be measured only indirectly, possibly via its inherent components.
Following the observation from [31], for the assessment of a value of a system property, where there is no science or theory developed, one could try conducting measurement experiments. Nevertheless, if experimental assessment of a system property quantitatively is impossible, one can apply simulation. As Glimm and Sharp, for example, point out [32]: “It is an old saw that science has three pillars: theory, experiment, and simulation.” This principle is broadly applied in physics, the mother of modern sciences, but it has also been adopted in various ways in computing [33].
However, before any theory, experiment or simulation is developed, putting all of the cards on the table is necessary by developing an initial model of the phenomena whose properties are to be measured. This is the critical first step to conduct the measurement. The authors’ previous work involved building all three types of models: Theory, Experiment, and Simulation, with respective examples in [34] on rough sets vs. Bayesian Belief Networks (BBN’s), [35] on software tools assessment, and [36] on threat modeling.
With respect to theoretical approaches, a combination of basic concepts of BBN’s and rough sets are shown to enhance the process of reasoning under uncertainty in the case of missing values of certain properties of a cyberphysical system [34]. Rough set is a formal approximation of a conventional set, in terms of a pair of sets, which define the lower and upper bounds of the original set. The rough sets theory helps make BBN’s more valuable in the case of the occasional lack of evidence. On the other hand, when supportive theory has not yet been developed, what is left is experimental measurements. To assess the quality of software tools for real-time software development, four metrics and their respective measures were established in [35]: functionality, usability, efficiency, and traceability, and experiments conducted on a specially designed testbed to assess the tools’ quality. In [36], in turn, simulation studies on a remote robotic device have proven to be a valuable aid to the early detection and prevention of potentially serious flaws in the core of a cyberphysical system with the functionality applicable for software-intensive aviation system.

4.3. Defining the Measurement Process

Summarizing the considerations of this section, the critical elements in measurements of any property are the following:
  • Clearly identify the property to be measured. It is at this point where building a model of the phenomenon is necessary. We use the term “property”, which corresponds to von Helmholtz’ “attribute”, although in measurement theory [37], it is called measurand.
  • Establish a metric to quantitatively characterize the property. Ideally, this would be a unit of measurement, but for vaguely defined properties it can be just a standard against which measurements are applied, or a scale against which the property can be evaluated.
  • Develop a measure, which would apply the metric to related objects under investigation. Ideally, this is just a measuring instrument, but for vaguely defined metrics it can be a formula or any other mental device to apply a metric and make comparisons. One important characteristic of a measure should be its linearity, that is, any two identical changes in the property value should be reflected as two identical changes in the measure.
  • Design the measurement process to deliver results. An important part of this process is calibration of the measuring device [37], an activity almost never thought of in soft sciences. Another crucial component of this process is the collection and availability of data.
  • Make sure that each instance of a measurement delivers a result composed of the value of the measurement and the estimate of its accuracy (an error). Alternatively, and consistently with current views in measurement theory, it could be a range of values designating one value as the “measured quantity value” [37].
So, knowing all of this, the question is, are we able to develop a model for security measurement? The model should embrace all important factors regarding this phenomenon.
Thus far, we have determined the model for security assessment for one particular class of systems, cyberphysical systems, and defined security as a term. What is necessary in the next step is developing the measurement process (with metrics and measures) for measuring security in the proposed context. This is, of course, an open question and a tremendous challenge.

4.4. Guidelines for Applying the Process

The model of Figure 5 and Figure 6 forms the basis for building a case study for security assessment, by analyzing threats and vulnerabilities. In this paper, because of the need for a more quantitative approach, a strongly quantitative method is advocated, based on assessing the vulnerabilities as per the Common Vulnerability Scoring System (CVSS) [38].
The following items have to be addressed: a metric, which for CVSS is a continuous numerical scale; a measure, which for CVSS is a set of integrated formulas; and the measurement process, which in this case relies on applying the measures to continuously collected data. With these assumptions, the data can be obtained by online checking of the subject entity (embedded device, server, cyberphysical system, etc., for which security is being measured) for known vulnerabilities, as per the Common Vulnerability Exposure (CVE) database [39]. Calculating the security score based on the CVSS can then be accomplished. Several authors have proposed use of CVE/CVSS data [40] for security measurement purposes, although without theoretical underpinning.
The unpredictable nature of threats remains a challenge. Even if one can design countermeasures for existing threats and assess those, there is high likelihood that new, unknown, threats will eventually appear, so one has to design the security system for the unknown, as well as include this type of unpredictability in the computational model for security assessment. The lack of sufficient information for calculating security values suggests building the model based on one of the theories which deal with uncertainty, for example, Bayesian belief networks or rough sets. The next section presents five case studies that illustrate, from various perspectives, how potential measurement processes can be designed.

5. Case Studies

5.1. Case Study #1: Using Markov Chains

The security model assumed here takes into account availability, as a dominating security component of the C-I-A triad [23]. This case study presents aspects of evaluating security in a cyberphysical system, based on availability assessment with Markov chains. The essential assumption in the approach and the proposed model is that a security breach may cause degradation of the service and ultimately a failure. The security model concentrates on the system’s interaction with the environment via a communication channel. It is based on a previous publication [41].

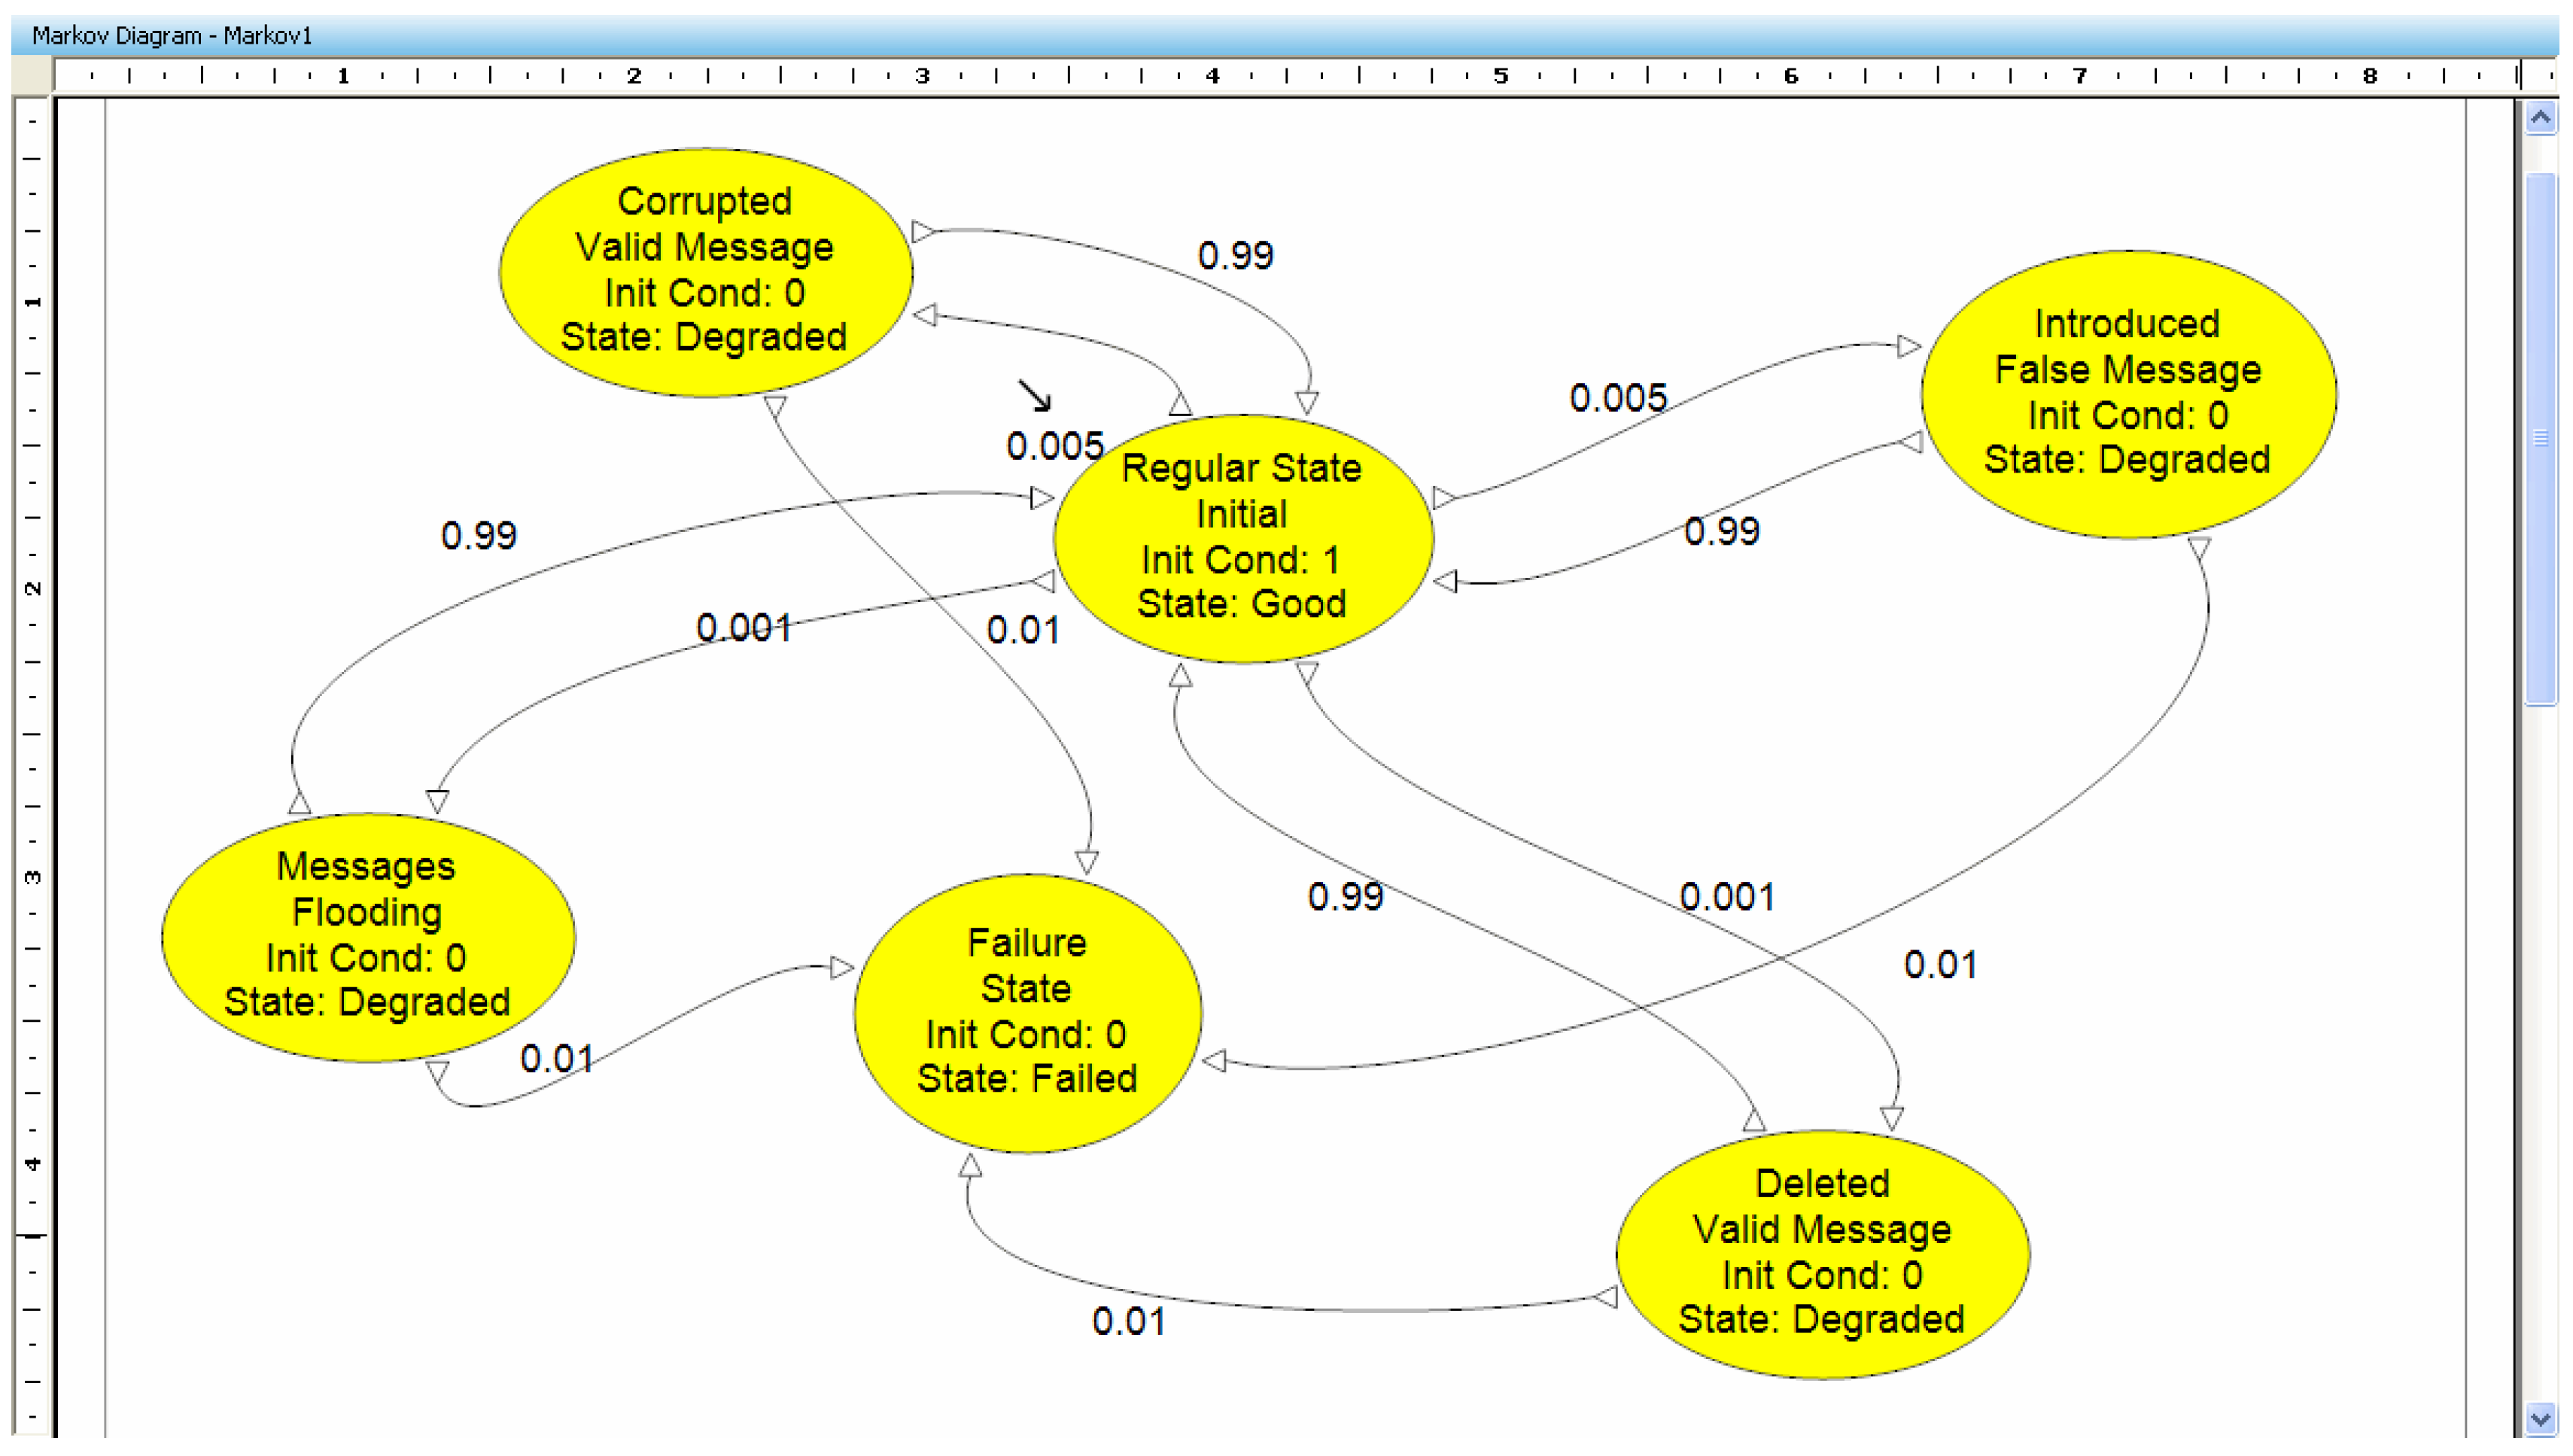
5.1.1. Methodology: Markov Model

The essential assumption in the approach and the model proposed in this case study is that a security breach is not a binary event (full or no security) but that it usually causes degradation of system services and may lead to a failure. Under this assumption, a cyberphysical system working in a 24/7 regime, at any given point in time will be in one of the following states: (1) the normal state; (2) the failure state; or (3) one of the possible intermediate degraded states, depending on the violation of security and the system’s ability to detect and recover from those violations.
Due to the dynamic state transition observed here, we consider a Markov model which typically includes the state with all elements operating and a set of intermediate states representing partially failed conditions, leading to the state in which the system is unable to perform its function. The model may include failure transition paths, as well as repair transition paths. The corresponding failure and repair rates between states can be derived from system analysis. The Markov model equations describe the situation where the transition path between two states reduces the probability of the state it is departing, and increases the probability of the state it is entering, at a specified rate.
A Markov chain may be constructed to model the changes of the system state depending on the probability of certain security vulnerabilities and probabilities that the system can be restored back to the regular state. The transition paths and the probability of transition between the various states define the system equations whose solution represents the time-history of the system. In a regular Markov model, the state is directly visible to the observer, and therefore the state transition probabilities are the only parameters.
In the system where deviations from the regular state are due to potential external attacks, we can identify the attack’s effects and their probabilities (e.g., for a communication system, percentage of messages corrupted, lost, incorrectly inserted, etc.). In turn, the system in such a degraded state can return to the regular state due to application of a mitigation mechanism or fail (also with assumed rate). Even after failure, we can consider a system that can be repaired assuming a certain repair rate. Such a model is useful to quantify how a specific vulnerability, expressed in terms of the probability of potential attacks, affects the system and what is the effective reliability and availability of the system. Respective simulations can give a basis for understanding how effective each mitigation method needs to be in order to ensure that the system meets or exceeds its required level of security.

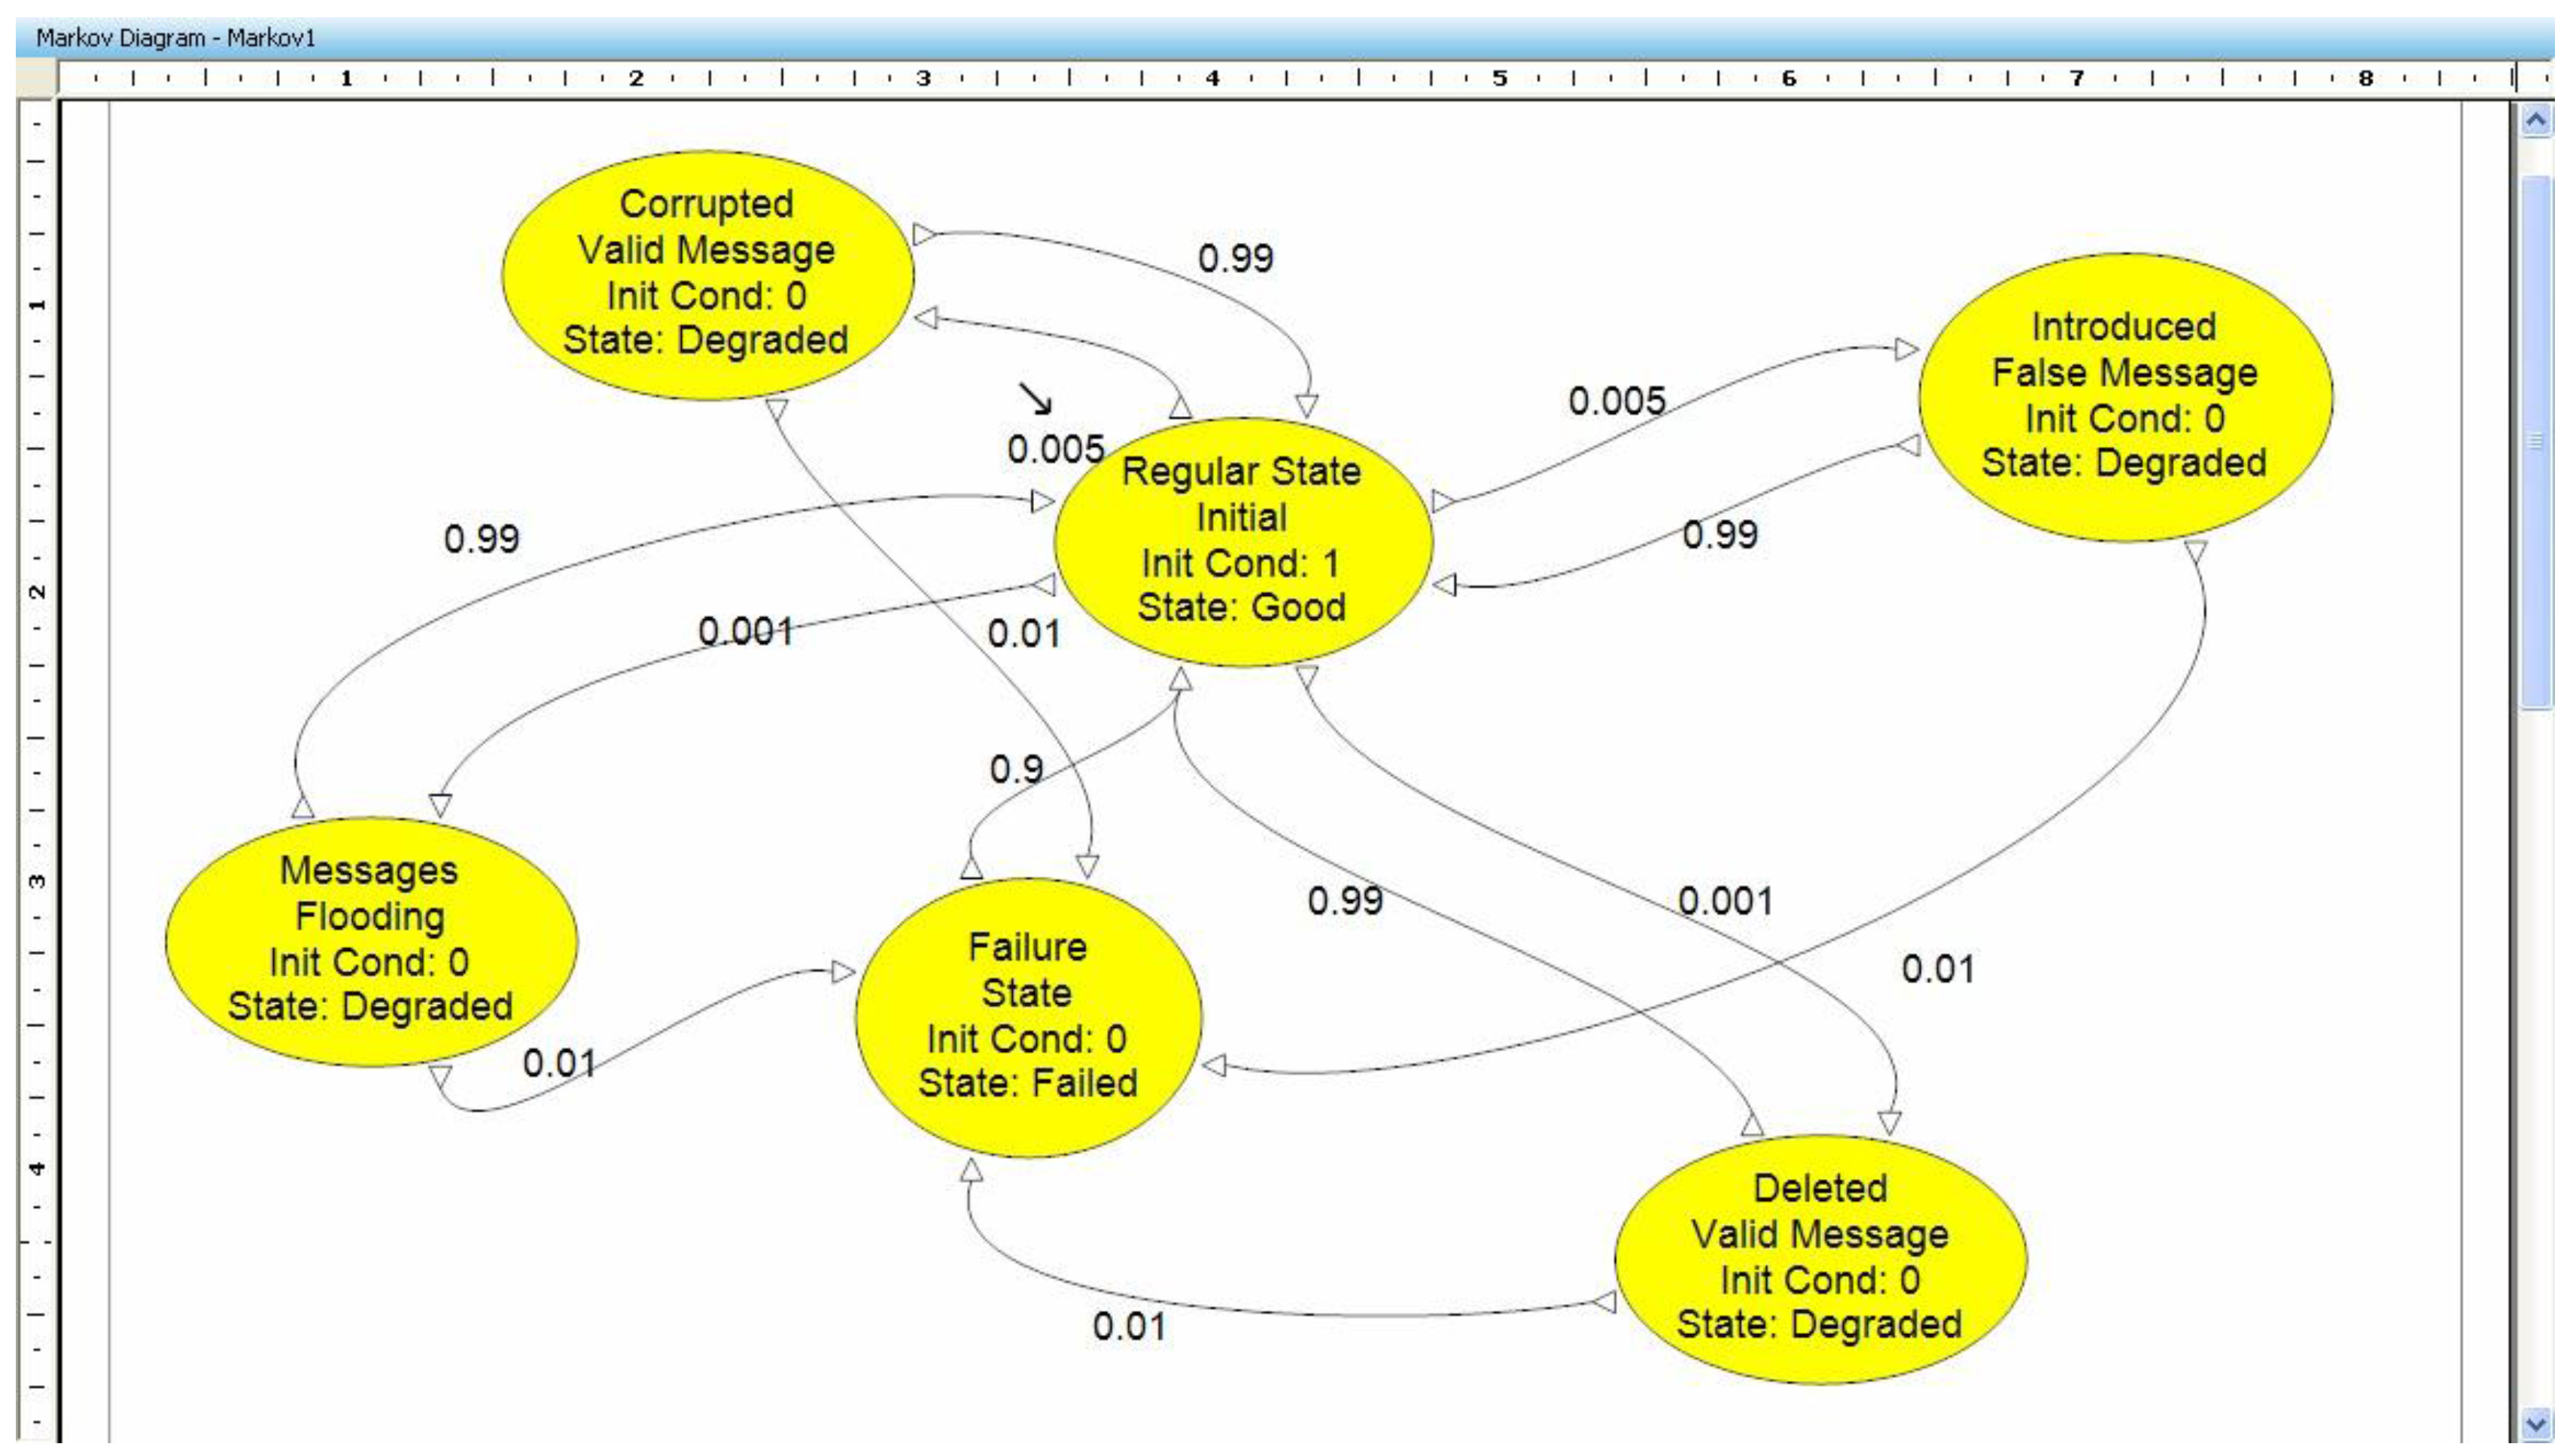
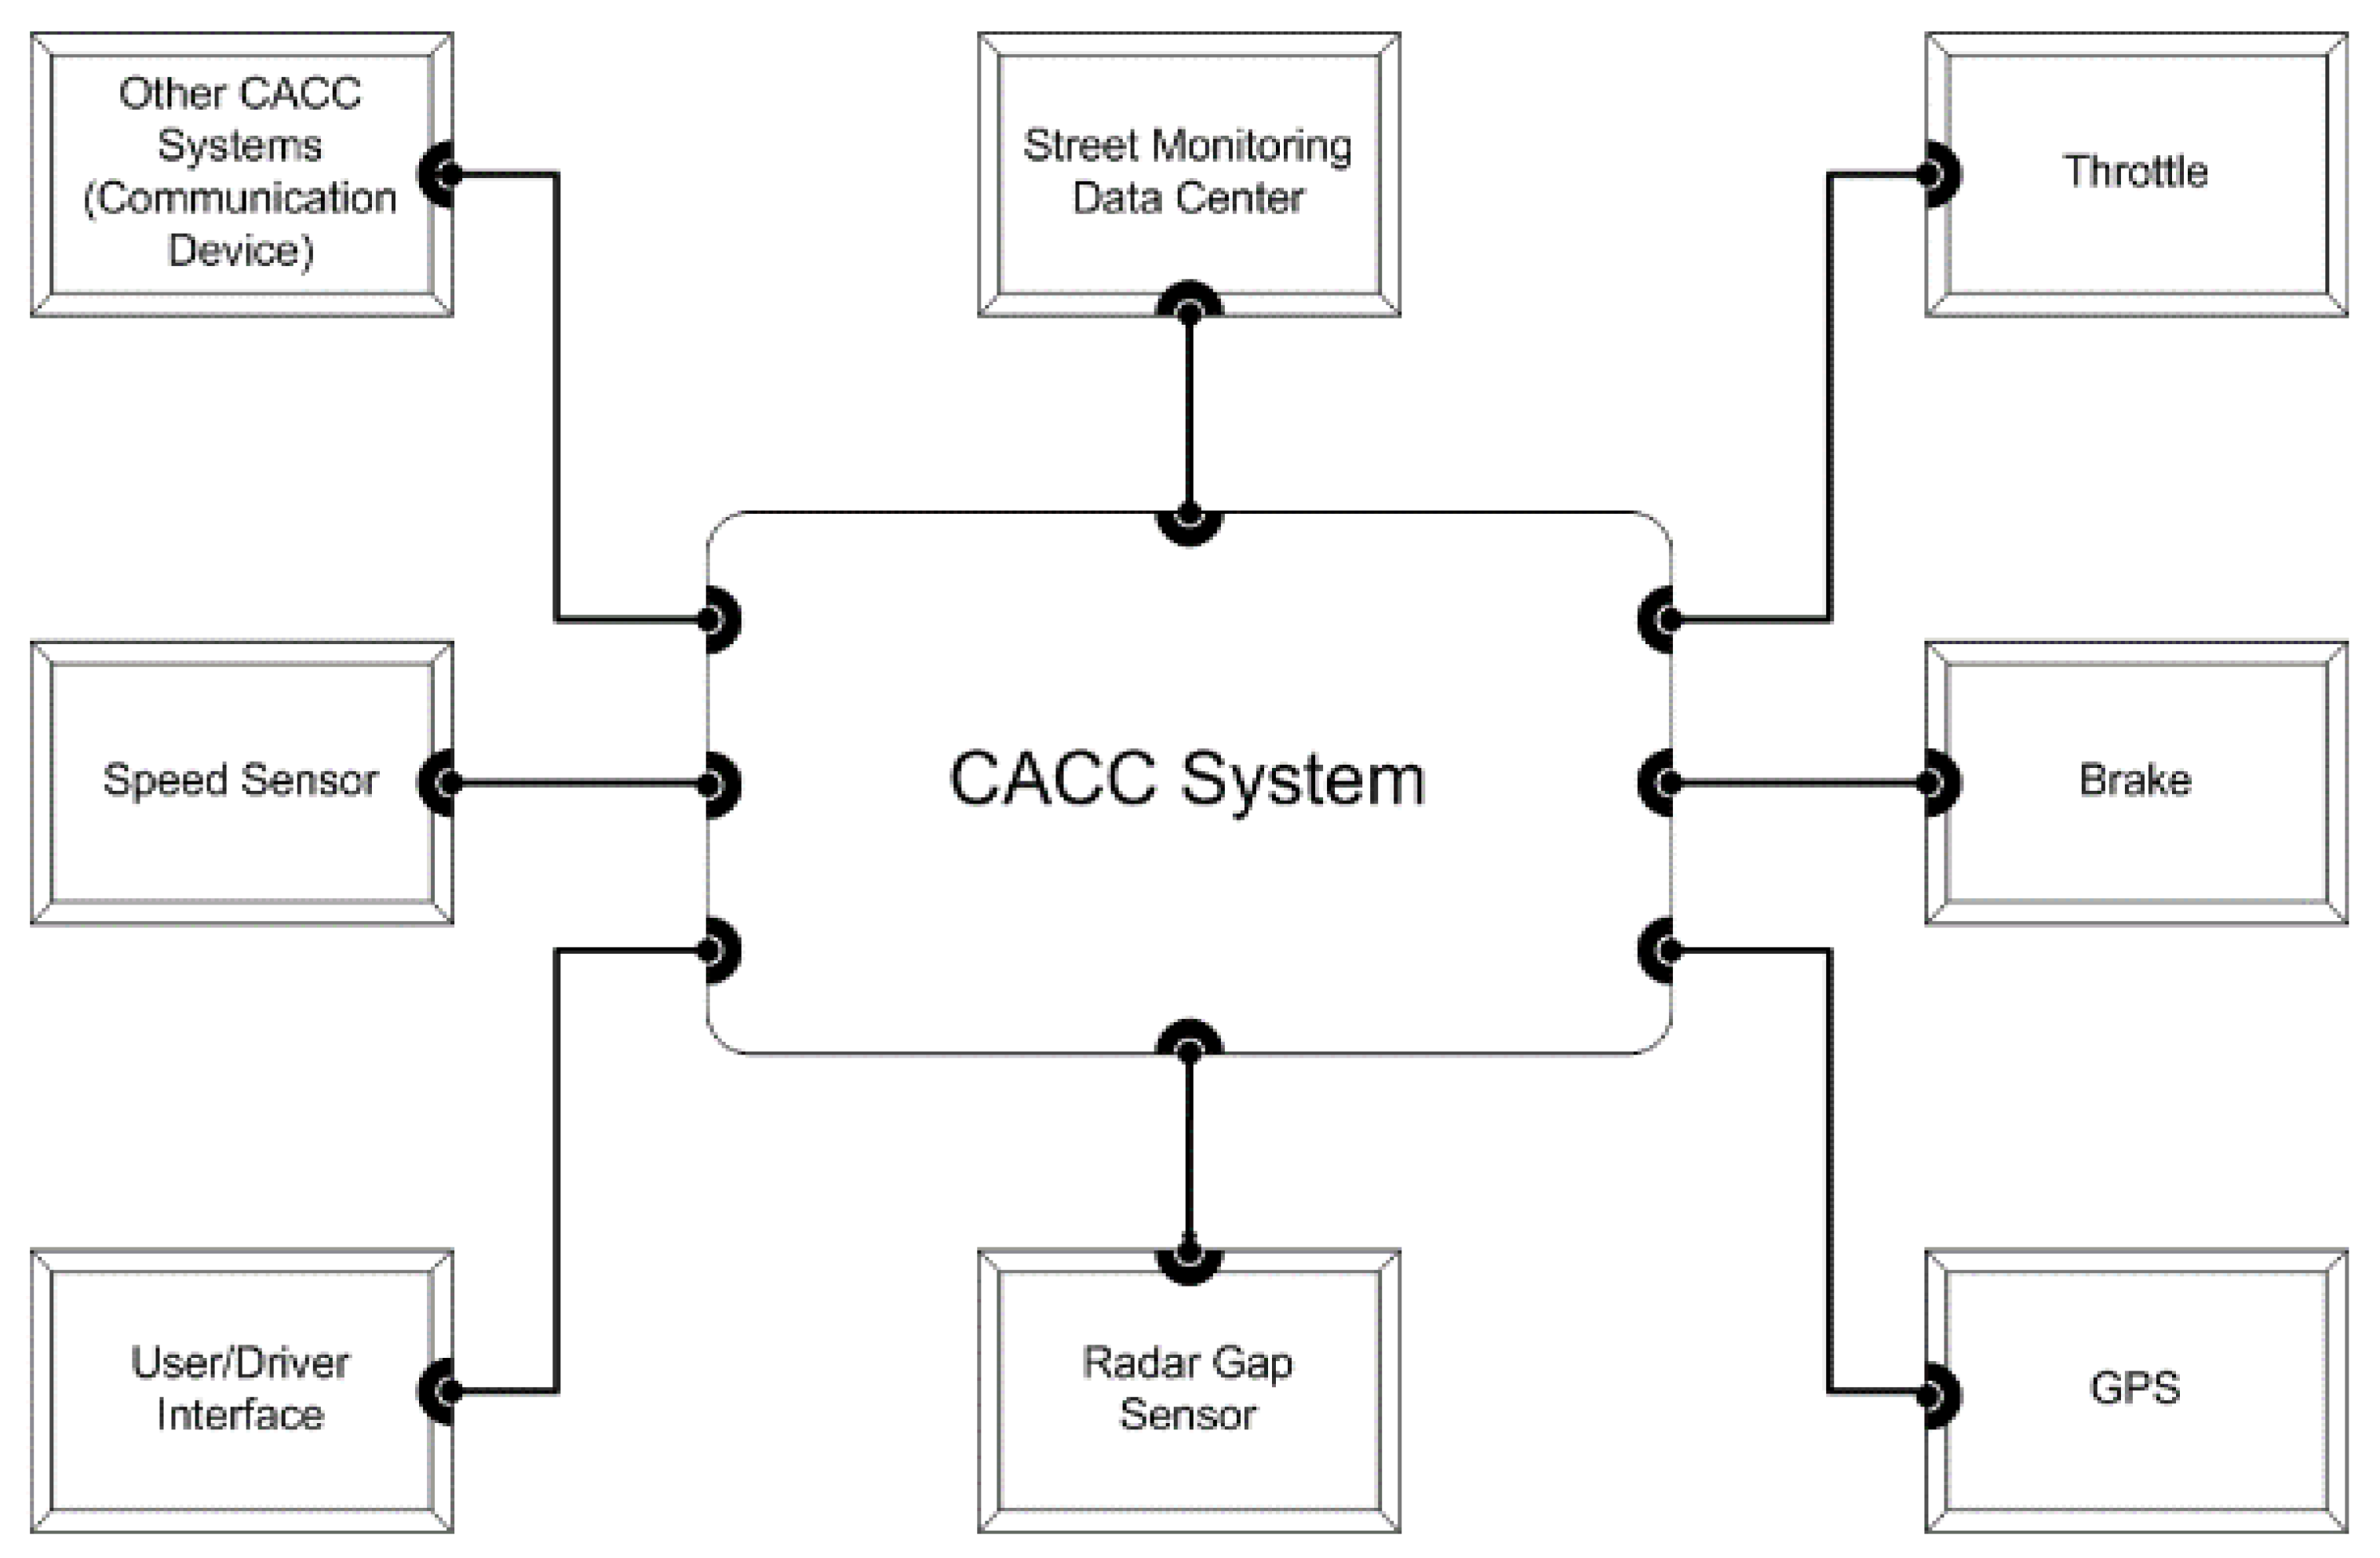
5.1.2. Cooperative Adaptive Cruise Control

The Cooperative Adaptive Cruise Control (CACC) system selected as the case study [42,43] is a cyberphysical system for automobiles which automatically monitors and adjusts a vehicle’s speed according to the traffic conditions in its immediate vicinity.
In the CACC, as shown in Figure 7, to effect a change in the vehicle’s speed, the system issues commands to the throttle device as well as to the brake pedal. The CAAC, in addition to receiving the necessary data it needs from sensors on the vehicle, communicates via a wireless network connection with other vehicles in the vicinity (Other CACC Systems) and with a centralized SMDC (Street Monitoring Data Center). These external interfaces have the highest risk of malicious attack. Security violation can result from external connection, i.e., by incorrect data from SMDC or from unauthorized external communication imitating other CACC equipped vehicle.
The specific vulnerabilities fall into four categories:
  • Message Introduction: an untrue SMDC or Other CACC message is injected.
  • Message Deletion: SMDC or Other CACC System message is not received by CACC.
  • Message Corruption: the contents of an SMDC or Other CACC message are altered before being received by the CACC.
  • Message Flooding: multiple frequent SMDC or Other CACC System messages are received causing the CACC to choke and not perform its required tasks within the deadlines.
To enhance the level of security, changes have been made to the original CACC architectural model by adding authentication and secure communication components. The level of security added will determine the probability with which the state transitions will occur. The probability for detection and recovery increases when the overall reliability of the system increases.
For the presented example, the following assumptions and simplifications were made:
  • It is assumed that only one security breach can occur at any given time.
  • Only one message channel is modeled. To model both the SMDC and the Other CACC channels simultaneously, more states and associated transitions would be required.
  • It is assumed that an undetected or unsuccessfully handled security breach leads to a system failure even though the system may not physically fail.
Relex/Winchill [44] reliability analysis software was used to assess the reliability of the Markov model in Figure 8. Each edge in the state machine has the probability that this transition will occur.

5.1.3. Experimental Results

In this example, the probability of security breaches, i.e., of corruption of a valid message, an injection of a false message, having a message deleted, or getting a flood of false messages, as well as the related attack detection, recovery and the failure probabilities were assumed (Table 1). Case 1 represents low and Case 2 high attack rates.
In the initial Markov model, the failure state was modeled as a terminal state. However, availability of the system could be increased by adding the possibility of a repair. In the CACC system, the monitor process is able to reset the system, if it detects a failure. This would be equivalent to a transition from the failure state back to the normal state.
The updated Markov model is shown in Figure 9. The repair rate of the system is a parameter one would like to explore. Two cases, one with repair rate 0.5 and other with 0.9 were simulated.
The baseline model (Figure 8) does not incorporate a transition from the failure state to the normal state, which corresponds to there being no possibility of repair after it has failed. The resulting reliability is 93.0531% with mean availability of 98.9873%. Since the first time to failure is estimated to be 83.33 h, we can deduce that in such a scenario our system meets the expectations imposed on security. Even though 83.33 h may seem like a low value, one must remember that this is counted for a car, which has been reset and restarted (a car is rarely supposed to run 80 h without a stop).
The results are summarized in Table 2 for two scenarios (low and high attack rate).
It is shown that the addition of repair increases the availability. A higher repair rate results in only a marginal increase in the system availability. For a system with higher attack rate (Case 2), when only half of the attacks are mitigated, introducing 0.9 probability of repair increases availability by 8.56%. Similarly, when up to 90% of the attacks are mitigated, the availability is increased 1.65%. We may infer that not much effort needs be expended in designing a system with a repair capability. For higher attack rates, more value may be obtained in increasing the detection and recovery rates for the specific attacks, i.e., security mitigation rather than expending resources on system repair.
The results in Table 2 show a high correlation between security and availability. Six scenarios (with only three data points) are shown. A linear regression allows computation of the slope and intersection and predicted values show only marginal prediction error. Due to a marginally minimal set of data, the regression holds only in the very near vicinity of the values of the independent variables. However, the results are promising in that the security can be assessed if only the availability of the system, the attack rate frequency, and the repair status and its probability are known.
The presented case study suggests viewing the attacks and related security breaches as a system failure, thus allowing one to reason about security by modeling availability with the existing tools. In general, a probability increase of successful attack detection and mitigation/recovery would result in a decrease in system performance because more effort, and hence execution time, is needed. A tradeoff, therefore, needs to be made, since performance is always an important consideration. For the defined probabilities of attack and the specified probabilities of detecting and handling the attack effects, a Markov model allows estimation of the system availability, providing valuable information on the level of security to be applied and to determine system’s sensitivity to security breaches.

5.1.4. Summary of the Measurement Process

In summary, the following steps of security assessment are identified using the above method, consistent with the outline of security measurement (Section 4.3). Given the attack surface is defined within the framework of a cyberphysical system (Figure 4, Figure 5 and Figure 6), respective steps include: (1) security model restricted to the availability component of the C-I-A triad; (2) metric defined on a probabilistic scale [0,1]; (3) measure defined by the Markov chain computational formula; (4) the measurement process determined by simulation; and (5) accuracy defined statistically as a prediction error.

5.2. Case Study #2: Threat Modeling

This case study analyzes the application of threat modeling to assess quantitative security of a cyberphysical system using an example from the automotive domain: Inter Vehicle Communication (IVC). Threats are modeled using the Threat Modeling Tool [45], generating the Analysis Report from which they are mapped to vulnerabilities, which in terms of DREAD characteristics lead to risk assessment. The description of this case study is loosely based on an earlier publication [46].

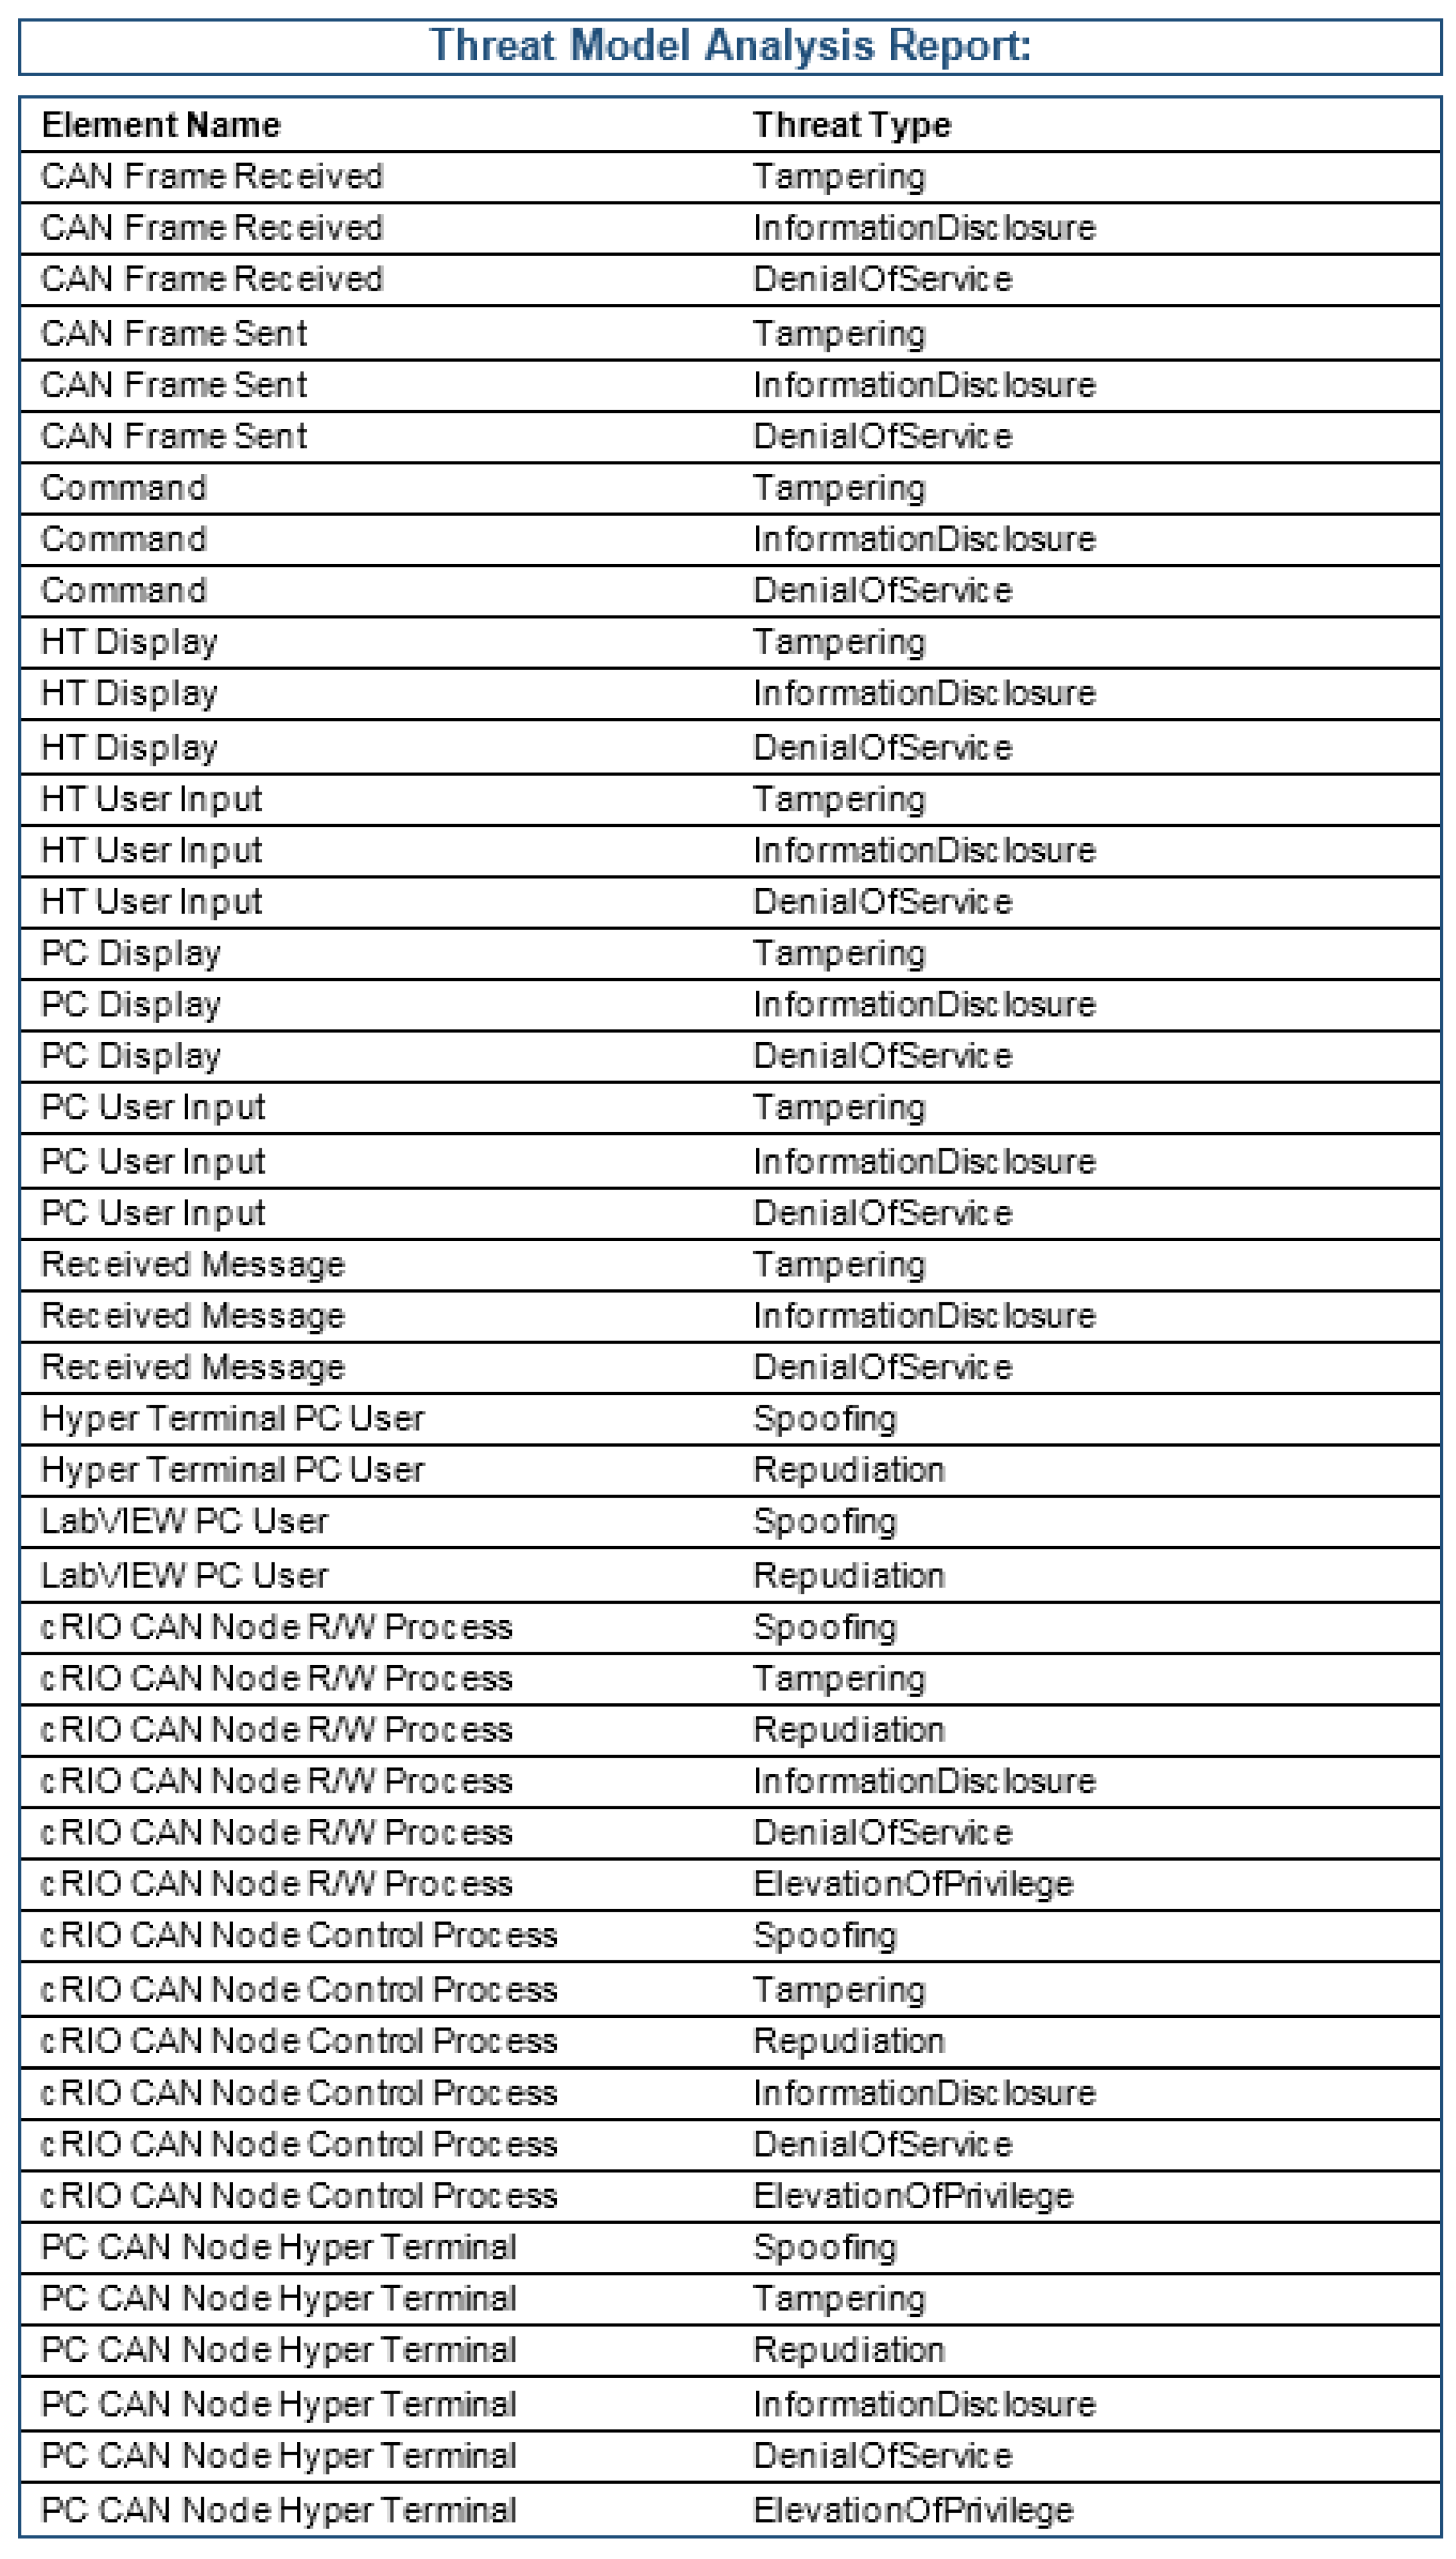
5.2.1. Outline of Threat Modeling

The modeling of threats in computer systems has been used at least since the beginning of this century, and involves a number of techniques. The essential process has been described in [45] and discussed in practice [47], and includes the following five steps: (1) Understand the Adversary’s View; (2) Create a System Model; (3) Determine and Investigate the Threats; (4) Mitigate the Threats; and (5) Validate the Mitigations.
In this work, we are only interested in selecting the right model of the system (Step 2) and determining and investigating the threats (Step 3), since this is sufficient for security assessment. The model of a cyberphysical system assumed, as presented in Figure 3, Figure 4, Figure 5 and Figure 6 (for a generic system and a case study, respectively), maps very nicely onto the thread modeling process discussed in [45,47], which uses data flow diagrams. Principles of creating data flow diagrams correspond nearly identically to our representation of cyberphysical systems and do not need additional discussion.
Regarding Step 3, the traditional way of determining and investigating threats is split into three phases: (1) Identifying/defining threats using the STRIDE method; (2) Using threat trees to assess vulnerabilities; and (3) Characterizing risks associated with vulnerabilities using the DREAD method, where STRIDE, which stands for Spoofing, Tampering, Repudiation, Information disclosure, Denial of service, and Elevation of privilege, and DREAD, which stands for Damage potential, Reproducibility, Exploitability, Affected users, and Discoverability, are relatively well described techniques of dealing with threats and corresponding risks [45,47].
While STRIDE, attack trees, and DREAD are common in general security analysis, in the case of cyberphysical or embedded systems, there are no well-known examples of the application of these techniques for practical security analysis. A thorough literature study for IVC systems revealed only a couple of examples [48,49].

5.2.2. Inter Vehicle Communication (IVC)

Aijaz et al. [48] developed the most complete list of vulnerabilities for IVCs, which correspond partially to and overlap with the CACC system, discussed in Section 5.1. They distinguish four groups of applications that cover the attack surface and form respective subtrees in the global attack tree structure. This includes: car-to-car, car-to-infrastructure, car-to-home, and router-based applications. For the first two groups, which are the only ones of interest in the current project, the following two subtrees, with corresponding leaves are listed:
  • for car-to-car traffic: either disseminate false messages by generating new message, replaying existing message, and modifying a message, or—disturb the system;
  • for car-to-infrastructure applications: either disseminate false messages (in seven different ways), or disturb the system by paralyzing onboard or roadside units, or by affecting the communication channel.
More recently, Vestlund [49] presented a thorough analysis of threats for IVC, but technically used fault tree analysis (FTA) rather than attack trees, defining the difference as follows: “attack trees describe the attacker’s possible method of attack, while FTA describes the system’s vulnerabilities and failure events.” The analysis is both broader than that in [48], because it includes additional groups of applications, and deeper, since it goes into the behaviors at the level internal to a vehicle, including its Electronic Control Units (ECUs) and their interconnection via a message bus, such as Controller Area Network (CAN).
A relatively large number of cases for fault/attack trees have been built by the author [49], but regarding the message communication in IVC, only the following threat classes are important:
  • communication denial
  • modified communication data
  • intercepted communication data
  • falsified communication.
Both studies, [48,49] validate the selection of the CACC model and its respective functionalities, as described in Section 5.1. Following this model, to verify the usefulness of threat modeling for establishing state transition probabilities for the Markov chain (strictly, the Discrete Time Markov Chain—DTMC), an actual example of a message exchange system over the CAN network has been set up. It includes two CAN nodes communicating over the CAN bus, with additional Internet connectivity for both nodes. The arrangement, which imitates part of the functionality of a larger CACC system, is shown implemented in the Microsoft Threat Modeling Tool [45] in Figure 10. The vulnerabilities exist at the inter-node boundaries, where CAN frames are passing between nodes, and where status and command messages are subjected to interference.

5.2.3. Experimental Results

One specific report of interest, which the tool generates, leading to quantitative analysis, is the Threat Model Analysis Report shown, in part, in Figure 11. It connects system components with threat types. With this information on hand, one can extract the parts, which affect communication, and use a DREAD related technique similar to that proposed in [47] to assign numerical values to specific vulnerabilities, which can then be normalized to probabilities. For example, Discoverability, wd, Reproducibility, wr, and Exploitability, we, would denote the likelihood of threats, and Affected users, au, and Damage potential, dp—their severity, leading to a numerical risk assessment, according to the following formula:
risk = (wd + wr + we) * (au + dp)
where au and dp are expressed in financial terms. The intermediate step from STRIDE, as generated by the tool (threat types in Figure 11), to DREAD involves mapping from the threats onto vulnerabilities. Once this is done, assigning values of likelihoods, in the simplest case, can rely on counting the relative frequency of occurrence of threats.
However, this method of quantitatively assessing the risk and corresponding probabilities of security breaches is still vague and requires a significant amount of well-informed judgment in the assessment process to get to numerical values. An alternative approach, based on assessing the vulnerabilities as per the Common Vulnerability Scoring System (CVSS) [38], is more promising since it has specific formulas to calculate risk. Both these methods, however, have been developed for analyzing security of Internet based applications and are not specific to cyberphysical systems, mostly because of a lack of publicly available data for such systems. This situation may change with the recent establishment of a disclosure framework for industrial control systems [50]. Additional work is needed to include the completion of a more extensive IVC model, and involvement of other types of cyberphysical systems, such as SCADA, RFID or time triggered applications.

5.2.4. Summary of the Measurement Process

Threat modeling is not commonly used in cyberphysical systems but this case study proves that the method can be effective, if the attack surface is precisely defined, as in the case of IVC, making the model theoretically valid. The mapping of this method into five steps of security measurement, as outlined in Section 4.3, may look as follows: (1) security property is evaluated by security risk assessment, built around five DREAD characteristics (Discoverability, Reproducibility and Exploitability determining the likelihoods of threats, and Affected users and Damage potential determining the severity of threats); (2) a usually discrete scale, on which risk is assessed, forms the metric; (3) the measure is the risk assessment formula, traditionally understood as the weighted sum of the products of severity of threat (or magnitude of the potential loss) and its likelihood (probability that the loss will occur), for all factors involved, forming the computational procedure construed according to threat modeling principles; (4) the measurement process is defined by the measure and the use of a modeling tool for computations; (5) errors may be introduced in several steps during this process and require separate error analysis, which has not been done in this research.

5.3. Case Study #3: Fault Injection in Time-Triggered Systems

This case study analyzes the application of the fault injection method to assess quantitatively security of a system with Time-Triggered Protocol (TTP), in an automotive application (brake-by-wire system). The security model makes use of a vulnerability as the primary feature to evaluate security, and then applies simulation to uncover security breaches by fault injection. It shows how to assess the extent security is violated by fault injection, thus showing how vulnerable the system is as a whole. It is based on earlier publications [51,52].

5.3.1. Fault Injection Method [52]

Fault injection techniques have been developed by academia and industry for system dependability evaluation identifying fault effects and improving system fault robustness (see [53,54] and references therein).
The fault injection campaign is composed of fault injection experiments related to specific system resources, fault classes, their triggering time and location. In fault injection experiments, we have to specify not only the fault load but also workload in accordance with the analysis goal, e.g., checking fault susceptibility, error detection mechanisms, integrity/security violation, etc. An important issue is to trace fault effect propagation from its source via physical effects (failure) to application level impacts (errors). In this process, we can check the effectiveness of various error detectors. They may relate to low level hardware mechanisms (e.g., segmentation faults, access violation, invalid opcode, parity error—signaled as system exceptions, watchdog timer alarms, etc.) or microkernel mechanisms (alarms related to detected deadline misses, abnormal termination of a system call, exceptions).
Dealing with security problems relying on Denial of Service (DoS) attacks, we should select appropriate fault models directly (e.g., transmission flooding, simulated attacks), or indirectly (simulating internal system errors which can be attributed to external violations). In this process, an important issue is to identify objects susceptible to threats (e.g., access ports), sensitive information within the system and possible paths of accessing or modifying it [55]. We should also take into account the problem of security compromises as a consequence of other faults in the system (e.g., transient disturbances) and checking if they do not increase the probability of security threats, data leakage, open access paths to sensitive data, reveal passwords, create side channels for attacks, etc.
Beyond the classical error detection mechanisms available in commercial systems (invalid opcode, access violation, memory parity, etc.) we may include special software assertions checking program control flow, etc. Moreover, these mechanisms can be supported with on-line monitoring of event or performance logs provided by the system or applications. These logs characterize normal operations so many security DoS attacks may disturb the image of logs (operational profile) and facilitate their detection or threat prediction.
One important problem in security of cyberphysical systems is the definition of their vulnerabilities, which can affect the controller. In order to define them, one first needs to differentiate a cyberphysical system from a traditional computing system. Among typical characteristics of cyberphysical systems, one can find [56]: multiple interacting nodes, incorporation into control systems operating without human intervention, purpose other than general computing and communications, natural or engineered contexts.
Figure 12 shows an example high-level model that takes into account the above system features. This model consists of the following main subsystems, consistent with those presented in Figure 5 and Figure 6: Plant (the controlled process), Controller (main computing device issuing control commands to the Plant), and Observer (implicit, not shown, used to measure plant’s response via its output variables).
The Plant inputs are Controller outputs and environment disturbances (non-malicious and malicious). The malicious disturbances can be modeled as security threats and they affect mainly a controller or plant operation. In modern embedded systems, the controller often interfaces with a network (real-time and non-real-time), database, and a user. These interfaces are not shown in Figure 12 but are implicitly included in the controller.
Security threat models are mostly concerned with network, database and user interfaces because a breach in those can reduce confidentiality, integrity and availability of exchanged information in a cyberphysical system. In this project, we are mainly concerned with network interface security threats. Specifically, in our modeling approach, after [41], we consider: introduction of spurious network messages, message deletion, message corruption, message flooding.

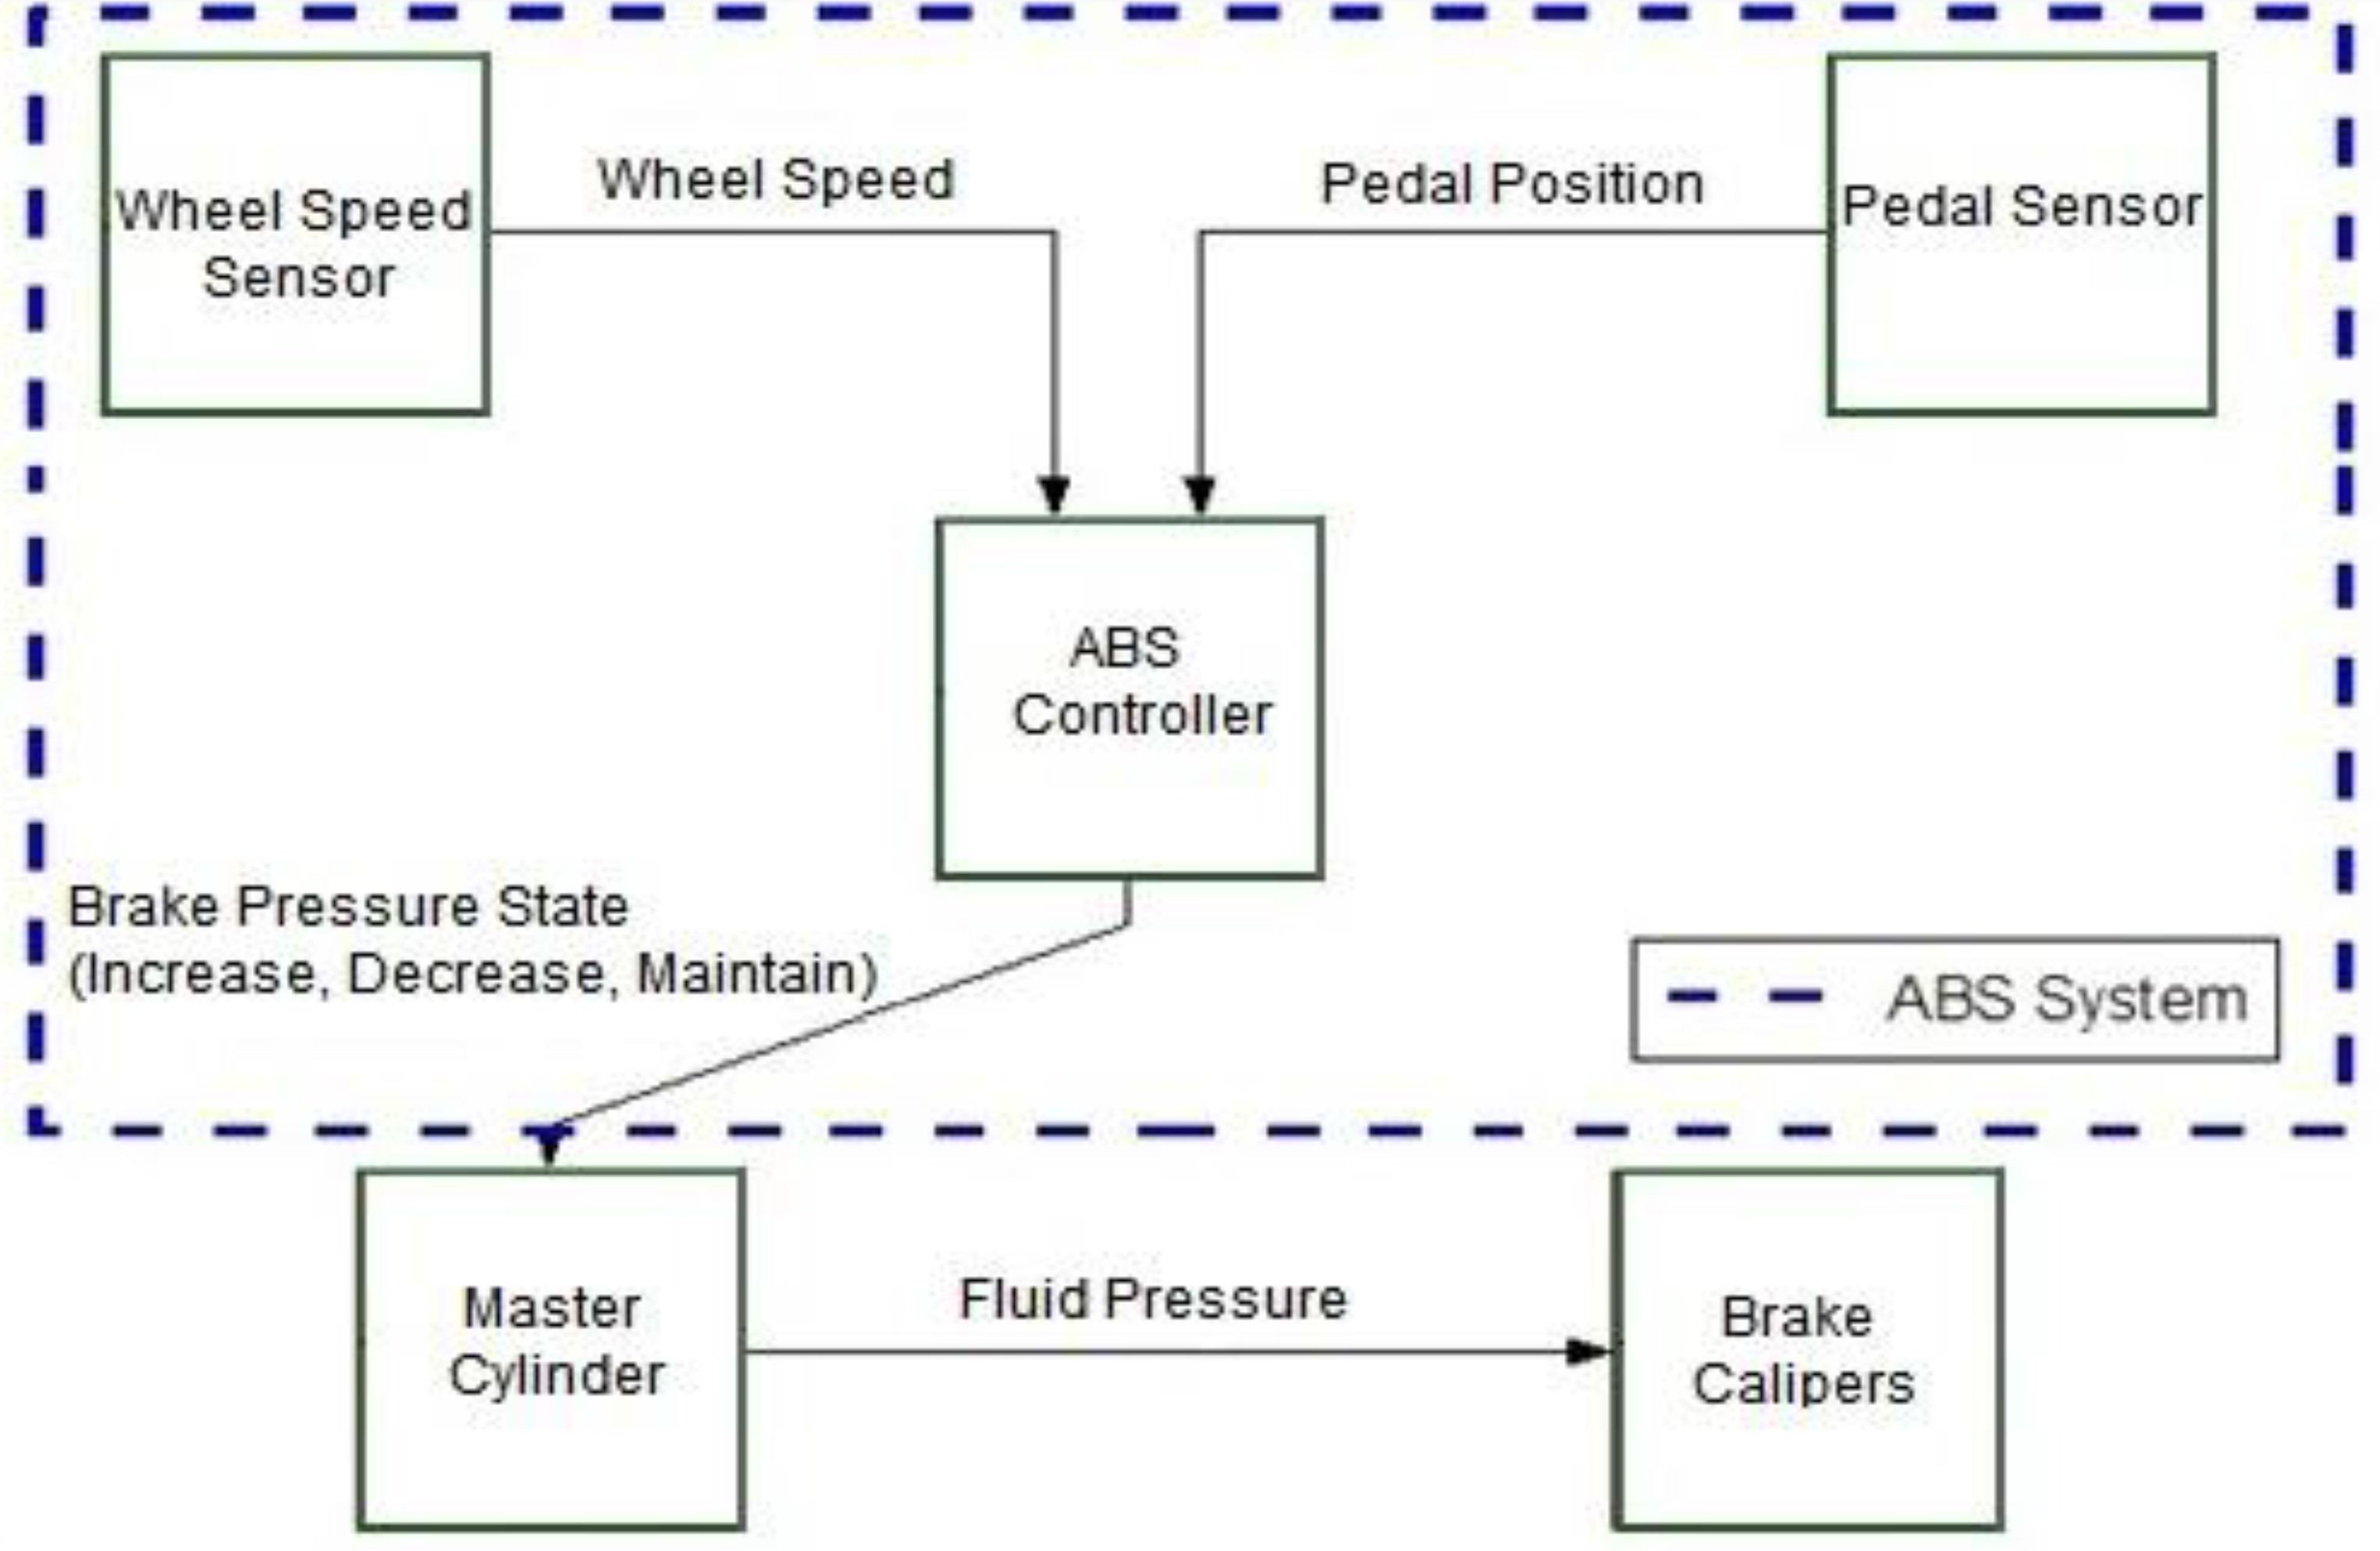
5.3.2. Brake-by-Wire System [51]

To analyze the behavior of time-triggered systems under various faults, an anti-lock braking system (ABS) in a Brake-by-Wire version was chosen as an example. For simulations, a 4-node TTTech development cluster with a disturbance node [57] was used in conjunction with Matlab’s Simulink and Real-Time Workshop [58]. The basic models of anti-lock braking systems were transformed to improve performance under various faults. Models of an ABS system on a single wheel (QVM—Quarter Vehicle Model) and of an entire car (FVM—Four-wheel Vehicle Model) were used in the simulations but to simplify the presentation only single wheel models are described in this paper.
An ABS system serves to prevent the wheel lock. The ability of a vehicle to lock the brakes is related to the fact that the static coefficient of friction between tires and the road surface is much greater than the dynamic coefficient of friction. That is, when the part of the tire in contact with the road is moving relative to the road, it takes less force to continue moving. This results in the wheel lock and increased stopping time and distance traveled by the vehicle between the time of brake application and the end of the vehicle’s movement. Preventing the wheel lock is accomplished by appropriately regulating the application of the vehicle’s brakes.
In a typical ABS system (Figure 13), there are several major components. These are speed sensors, brake (pedal) position sensors, brake line valves to relieve pressure, and the real-time controller. When the operator of a vehicle attempts to apply the brakes, the wheel-speed sensors detect the deceleration of the wheels. If the deceleration on a wheel is too large, the ABS controller forces the appropriate valves to relieve pressure on that wheel’s brake. This decreases the brake-force on that wheel, and decreases the deceleration of the wheel. This is crucial as great deceleration typically leads to wheel-lock. Two preexisting Simulink ABS models were considered in this work: QVM and FVM [51,52].

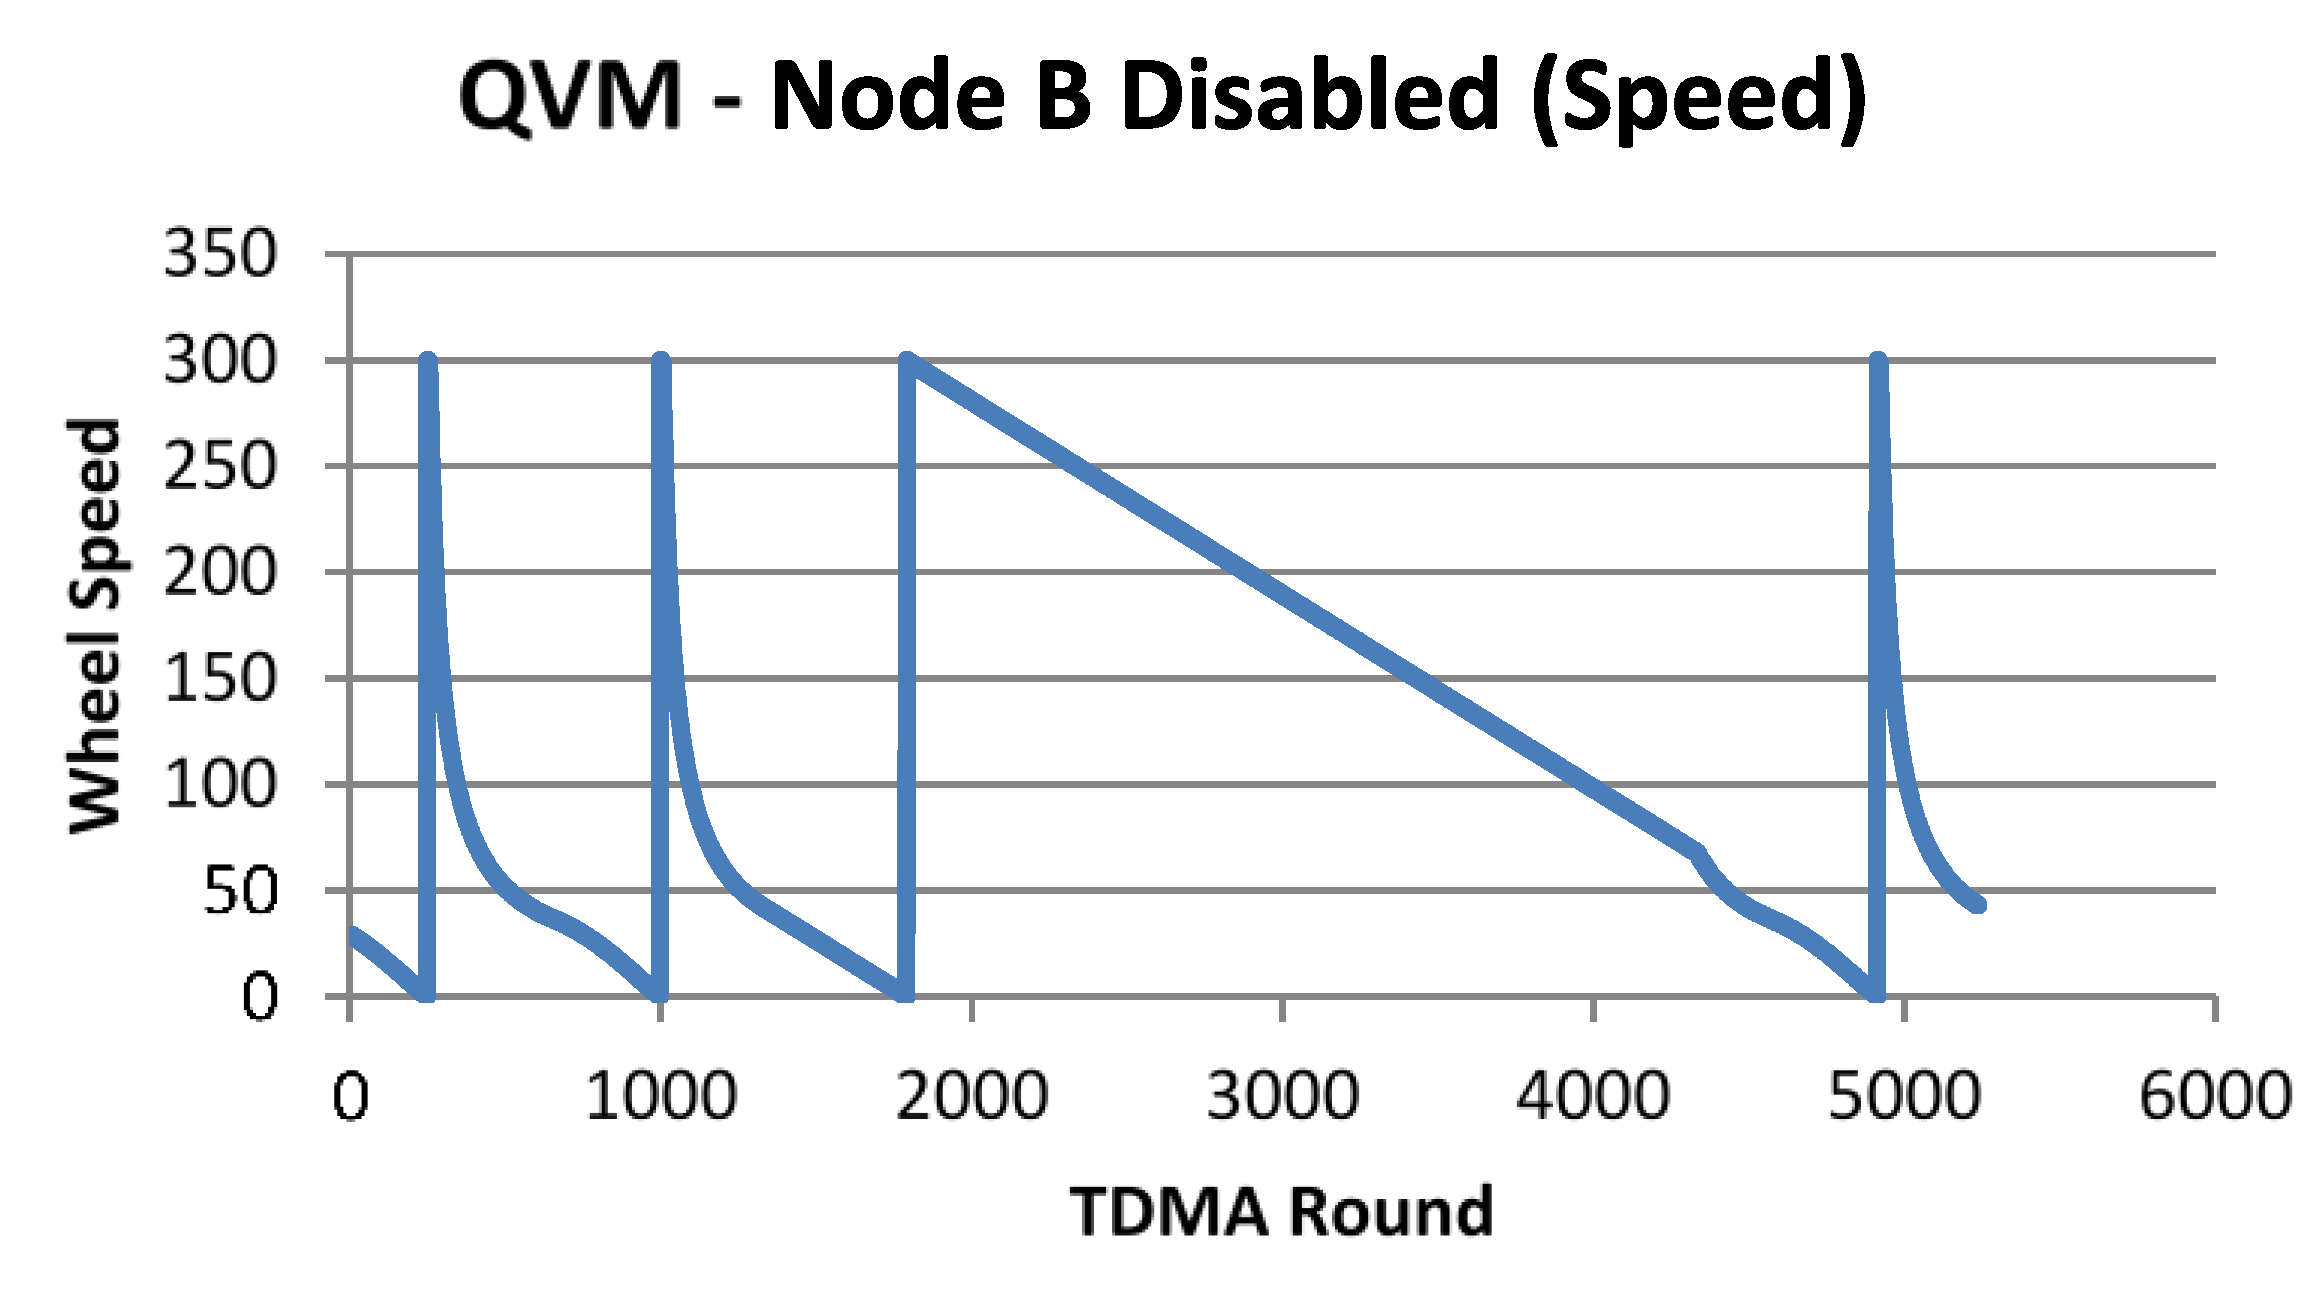
5.3.3. Simulation and Quantitative Analysis

The main emphasis of experiments was to measure the impact of disturbing various components on the simulated system with the presence of specific faults. For illustration of the encountered behavior related to security measurement, all in a 4-node TTTech development cluster [57], let us consider a disturbance scenario where the pedal sensor runs on a separate node (Node D), while the remaining three nodes (Nodes A, B and C) redundantly calculate the brake force. The wheel speed monitor runs on one of the brake force calculating nodes. Similarly, the brake model runs on another node containing the brake force calculation.
Simulation models were tested under individual node disturbance (fault injection) scenarios to simulate component failures. The nodes of the cluster communicated via a dual-channel bus, to which each node is connected, over TTP protocol. The fault injection scenarios specified a particular schedule for the disturbance node to “communicate” on the bus. Essentially, the disturbance node was set to send a high (jamming) signal on the bus at specific time periods for specific lengths of time so as to prevent a specific node from being able to send its messages. In all experiments in the disturbance scenario, execution began between rounds 1100 and 1400 and lasted 3000 rounds.
Different fault models were selected for this and other distributed QVM/FVM simulations. These fault models define the disruption of the communication of individual nodes via the TTTech disturbance node, to simulate component disruption in a manner similar to that which may be observed in a real ABS.
Sample results of the simulation are illustrated in Figure 14. The first cycle shows the ideal characteristics with no disturbance during this time of the simulation. The second cycle shows the ideal characteristics even though disturbance scenario was executed at round 1100; the second cycle simulation ran to completion with no changes. However, the decline of the wheel speed in the third cycle became linear which was incorrect. For such simulations some techniques for multifactor measurements of system vulnerability were developed. In general, the vulnerability to be measured is the range of modification (degeneration) of the ideal time characteristic of the cyberphysical system under various faults. We analyzed various metrics to quantitatively evaluate this characteristic.
We considered both simple and complex metrics. The simple metrics is based on comparing so-called critical points in the ideal time characteristics (ideal, that is, without faults) and the critical points in characteristics obtained under fault. The critical points are related to critical functionality of the controlled device. An example of a critical point in our ABS system was to identify the complete stop time (time for a vehicle to reach speed zero). We could express the corresponding metric as a value between 0 and 1 computed by dividing the ideal duration of the time to stop, td, and the time to stop under the fault, tf.
In the simulation from Figure 14, the second cycle finished unchanged giving the vulnerability metric (1td/tf) = 0 (perfect) for the cycle that already started when the fault was generated. However, for the next cycle where the ideal time to stop, td, was around 800, the delayed time to stop, tf, because of the fault, was around 3000. That gave us the vulnerability metrics equal to value of (1 − 800/3000) = 73%, which practically represents the failure of the system.
A more complex metric is based on comparing complete ideal characteristics and the actual characteristics obtained under fault. For this ABS system, we could express the complex metric also as a value between 0 and 1 but computed by dividing the area below the ideal characteristic and the characteristic under the fault. In our example, the second cycle finished unchanged giving complex vulnerability metric also 0 (perfect) for the cycle that already started when the fault was generated. For the next cycle, the complex metric can be calculated by comparing the areas under both curves.
In summary, for cyclic systems modelled by cyclic simulations, we have to distinguish between modification of ideal characteristics by a fault generated during the current cycle and for the next one. Calculation of simple or complex time characteristics (metrics) can be done and is generally related to a specific model of cyberphysical systems and its functionality. For example, for some devices not the time to stop but reduction of the speed to half might be critical. As a result the vulnerability (and, at the same time, security) measurement is relative to such metrics.
In addition, for cyberphysical systems exhibiting cyclic behavior, the aggregate metrics can be introduced. The aggregate metrics involve counting/averaging across multiple cycles, e.g., taking into account missing or significantly modified spikes. This metric accounts for the loss of functionality in the system for a longer time. Our simulation studies show that, in addition to detecting anomalous time-triggered system behavior related to malicious attacks of network messages in a TTP-based system, it is also possible to calculate a numerical value of the degree of security violations.

5.3.4. Summary of the Measurement Process

The Brake-by-Wire model fits well into a cyberphysical system framework, with its process (sensors and actuators) and network interfaces to represent the attack surface. With this, respective steps in security assessment using fault injection can be mapped onto those from Section 4.3, as follows: (1) The primary feature (attribute), which determines security implications is vulnerability; (2) The metric involves the departure (distance) from the intended behavior and is mapped on the continuous scale for the interval [0,1]; (3) The measure is a related computational formula defined for a particular fault injection method; (4) The measurement process is defined by injecting faults into a pre-built Simulink model (based on differential equations) and observing effects in terms of departure from the standard (prescribed) behavior; (5) Accuracy of the measurement is governed by the error of the simulation process, which includes building the model itself, that may introduce a systematic error.

5.4. Case Study #4. Non-Functional Requirements

This case study examines the application of non-functional requirements (NFR) method to assess quantitatively security of a SCADA system. SCADA stands for Supervisory Control And Data Acquisition and has been heavily used for the last 40+ years in distributed process control of larger plants. It consists of a master unit that controls the working of the entire system by reading sensors and activating actuators throughout a distributed plant. The process for converting non-functional requirements to a quantitative assessment of security is outlined in this section, based on a related earlier publication [59].

5.4.1. Outline of the NFR Approach [59]

The NFR Approach is a goal-oriented method that can be applied to determine the extent to which objectives are achieved by a design—here the objectives are defined as achieving security for a cyberphysical system. NFR considers properties of a system such as reliability, maintainability, flexibility, scalability, etc., and could equally well consider functional objectives. The NFR uses a well-defined ontology for this purpose that includes NFR softgoals, operationalizing softgoals, claim softgoals, contributions, and propagation rules; each of these elements is described briefly below [59]. Furthermore, since strictly quantitative assessment of soft or vaguely defined properties is difficult, the NFR Approach uses the concept of satisficing, a term borrowed from economics, which indicates satisfaction within limits instead of absolute satisfaction of the goal.
NFR softgoals represent NFRs and their decompositions. Elements that have physical equivalents (process or product elements) are represented by operationalizing softgoals and their decompositions. Each softgoal is named using the convention: Type [Topic1, Topic2…], where Type is the name of the softgoal and Topic (could be zero or more) is the context where the softgoal is used. Topic is optional for a softgoal; for a claim softgoal, which is a softgoal capturing a design decision, the name may be the justification itself. Softgoals may be decomposed into other softgoals in two ways: in an AND-contribution satisficing all child softgoals is essential to satisfice the parent; in an OR-contribution satisficing one child softgoal is sufficient to satisfice the parent.
Contributions (MAKE, HELP, HURT, and BREAK) are usually made by operationalizing softgoals to NFR softgoals. Reasons for these contributions are captured by claim softgoals and, in this case, there is a contribution between a claim softgoal and the contribution being justified. Each of the four types of contributions has a specific semantic significance: MAKE contribution refers to a strongly positive degree of satisficing of objectives by artifacts (could be design decisions), HELP contribution refers to a positive degree of satisficing, HURT contribution refers to a negative degree of satisficing, and BREAK contribution refers to a strongly negative degree of satisficing.
Propagation rules propagate labels from a child softgoal to its parent across decompositions, from operationalizing softgoals to NFR softgoals across contributions, and from claim softgoals to contributions; propagation rules aid in the rationalization process of the NFR Approach.
There are four iterative steps for applying the NFR Approach for evaluating security:
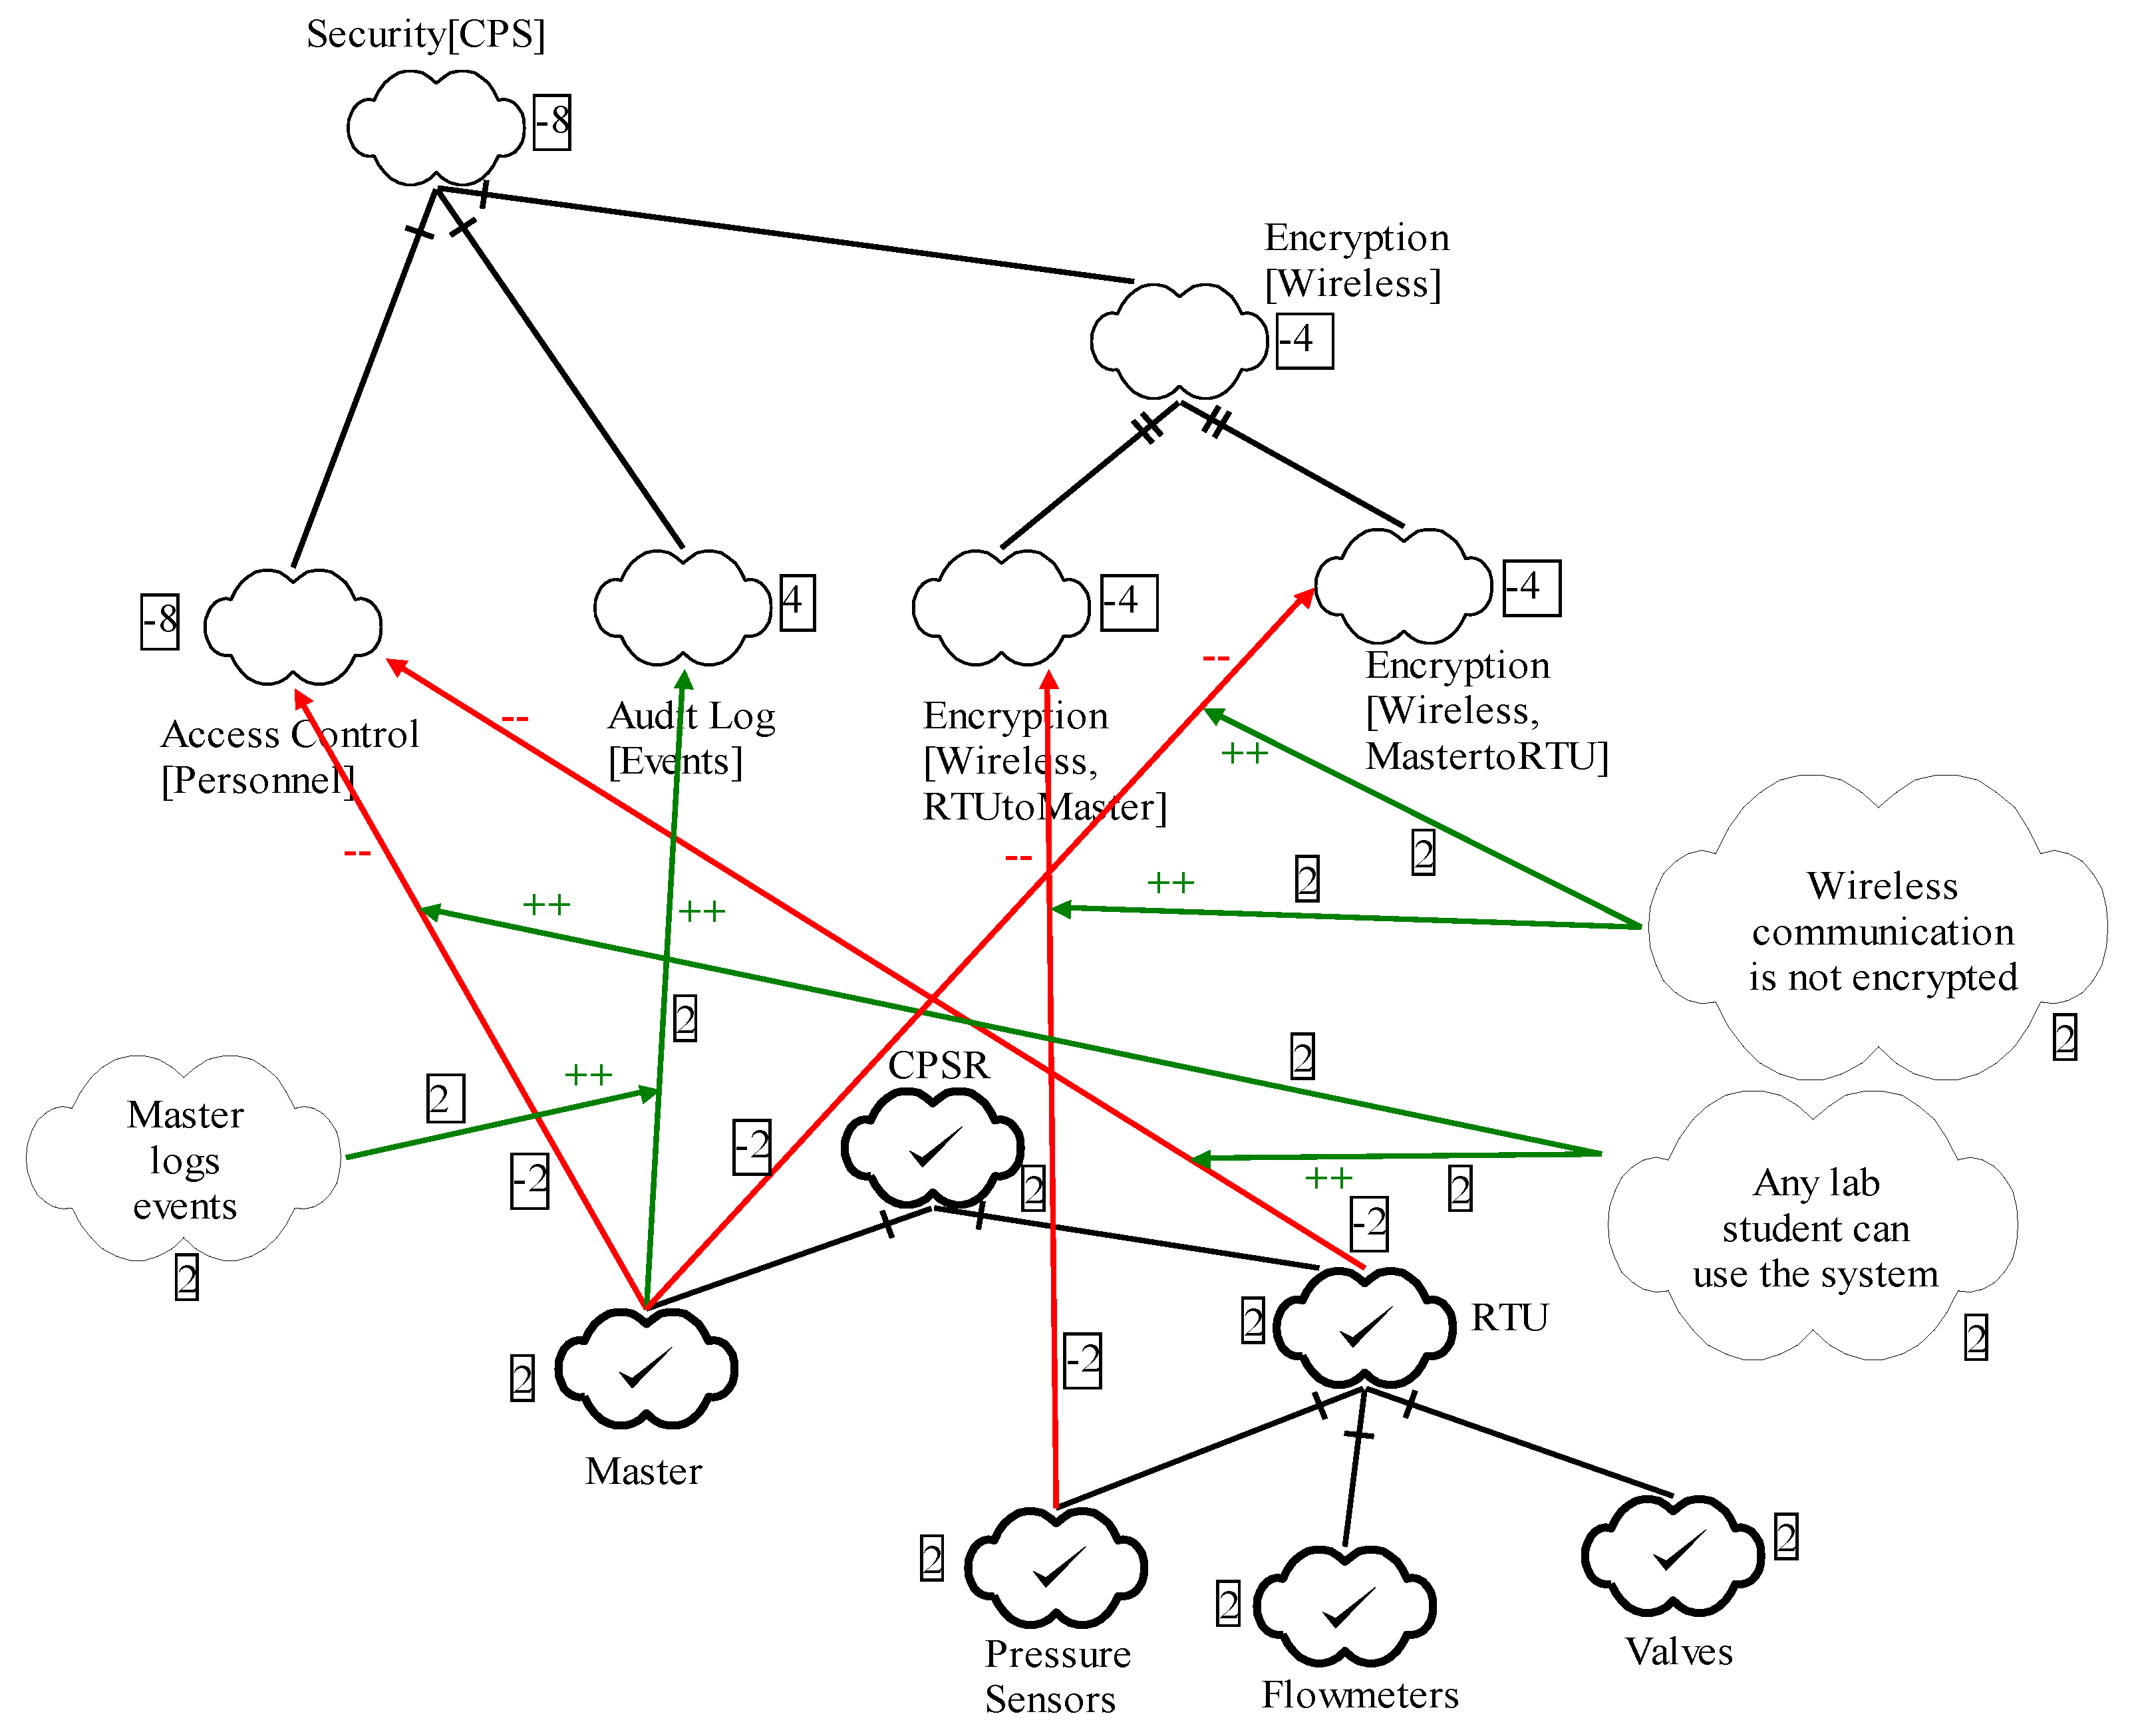
  • Decompose NFR security.
  • Decompose the architecture of the system into its constituent operationalizing softgoals.
  • Determine the contributions made by the operationalizing softgoals to the NFR softgoals.
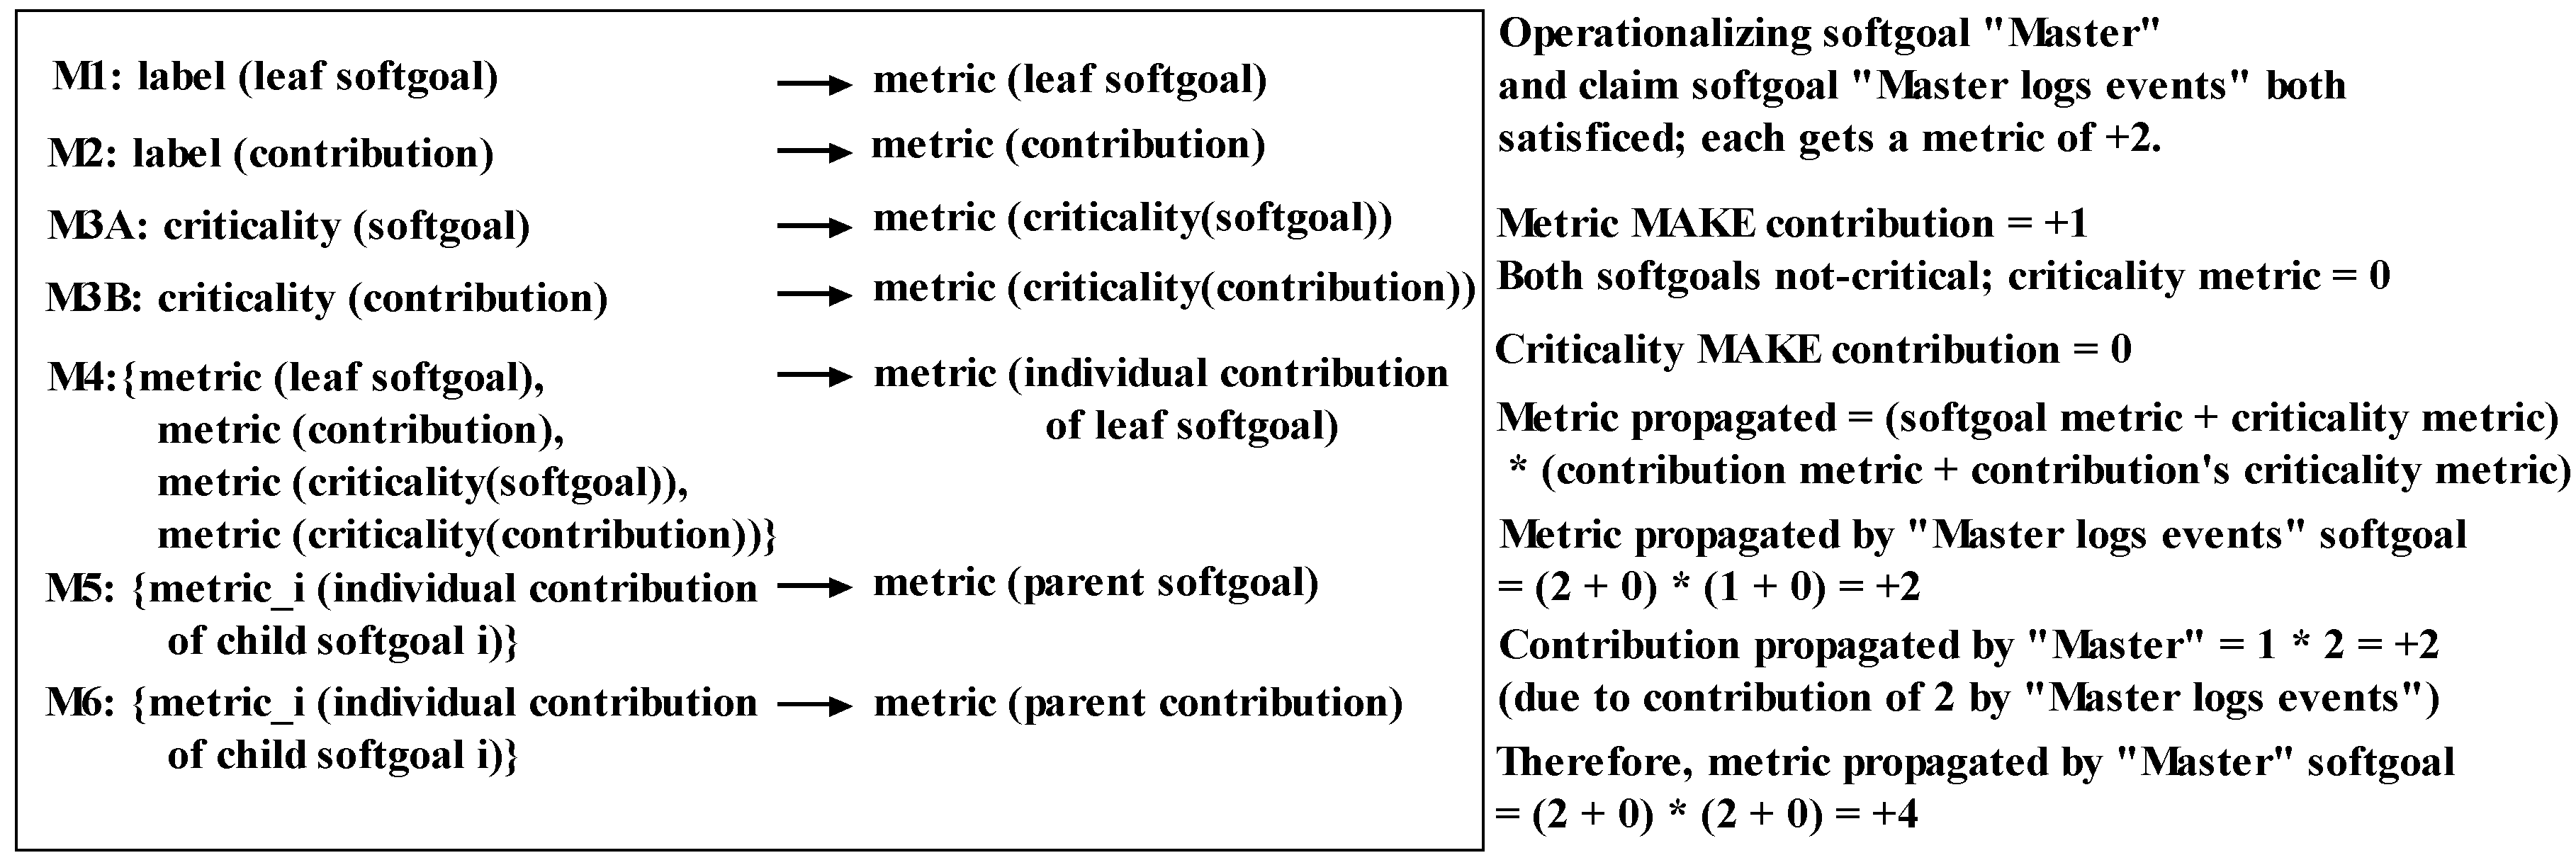
  • Evaluate the overall security by applying the propagation rules and observing the labels propagated to the softgoals.

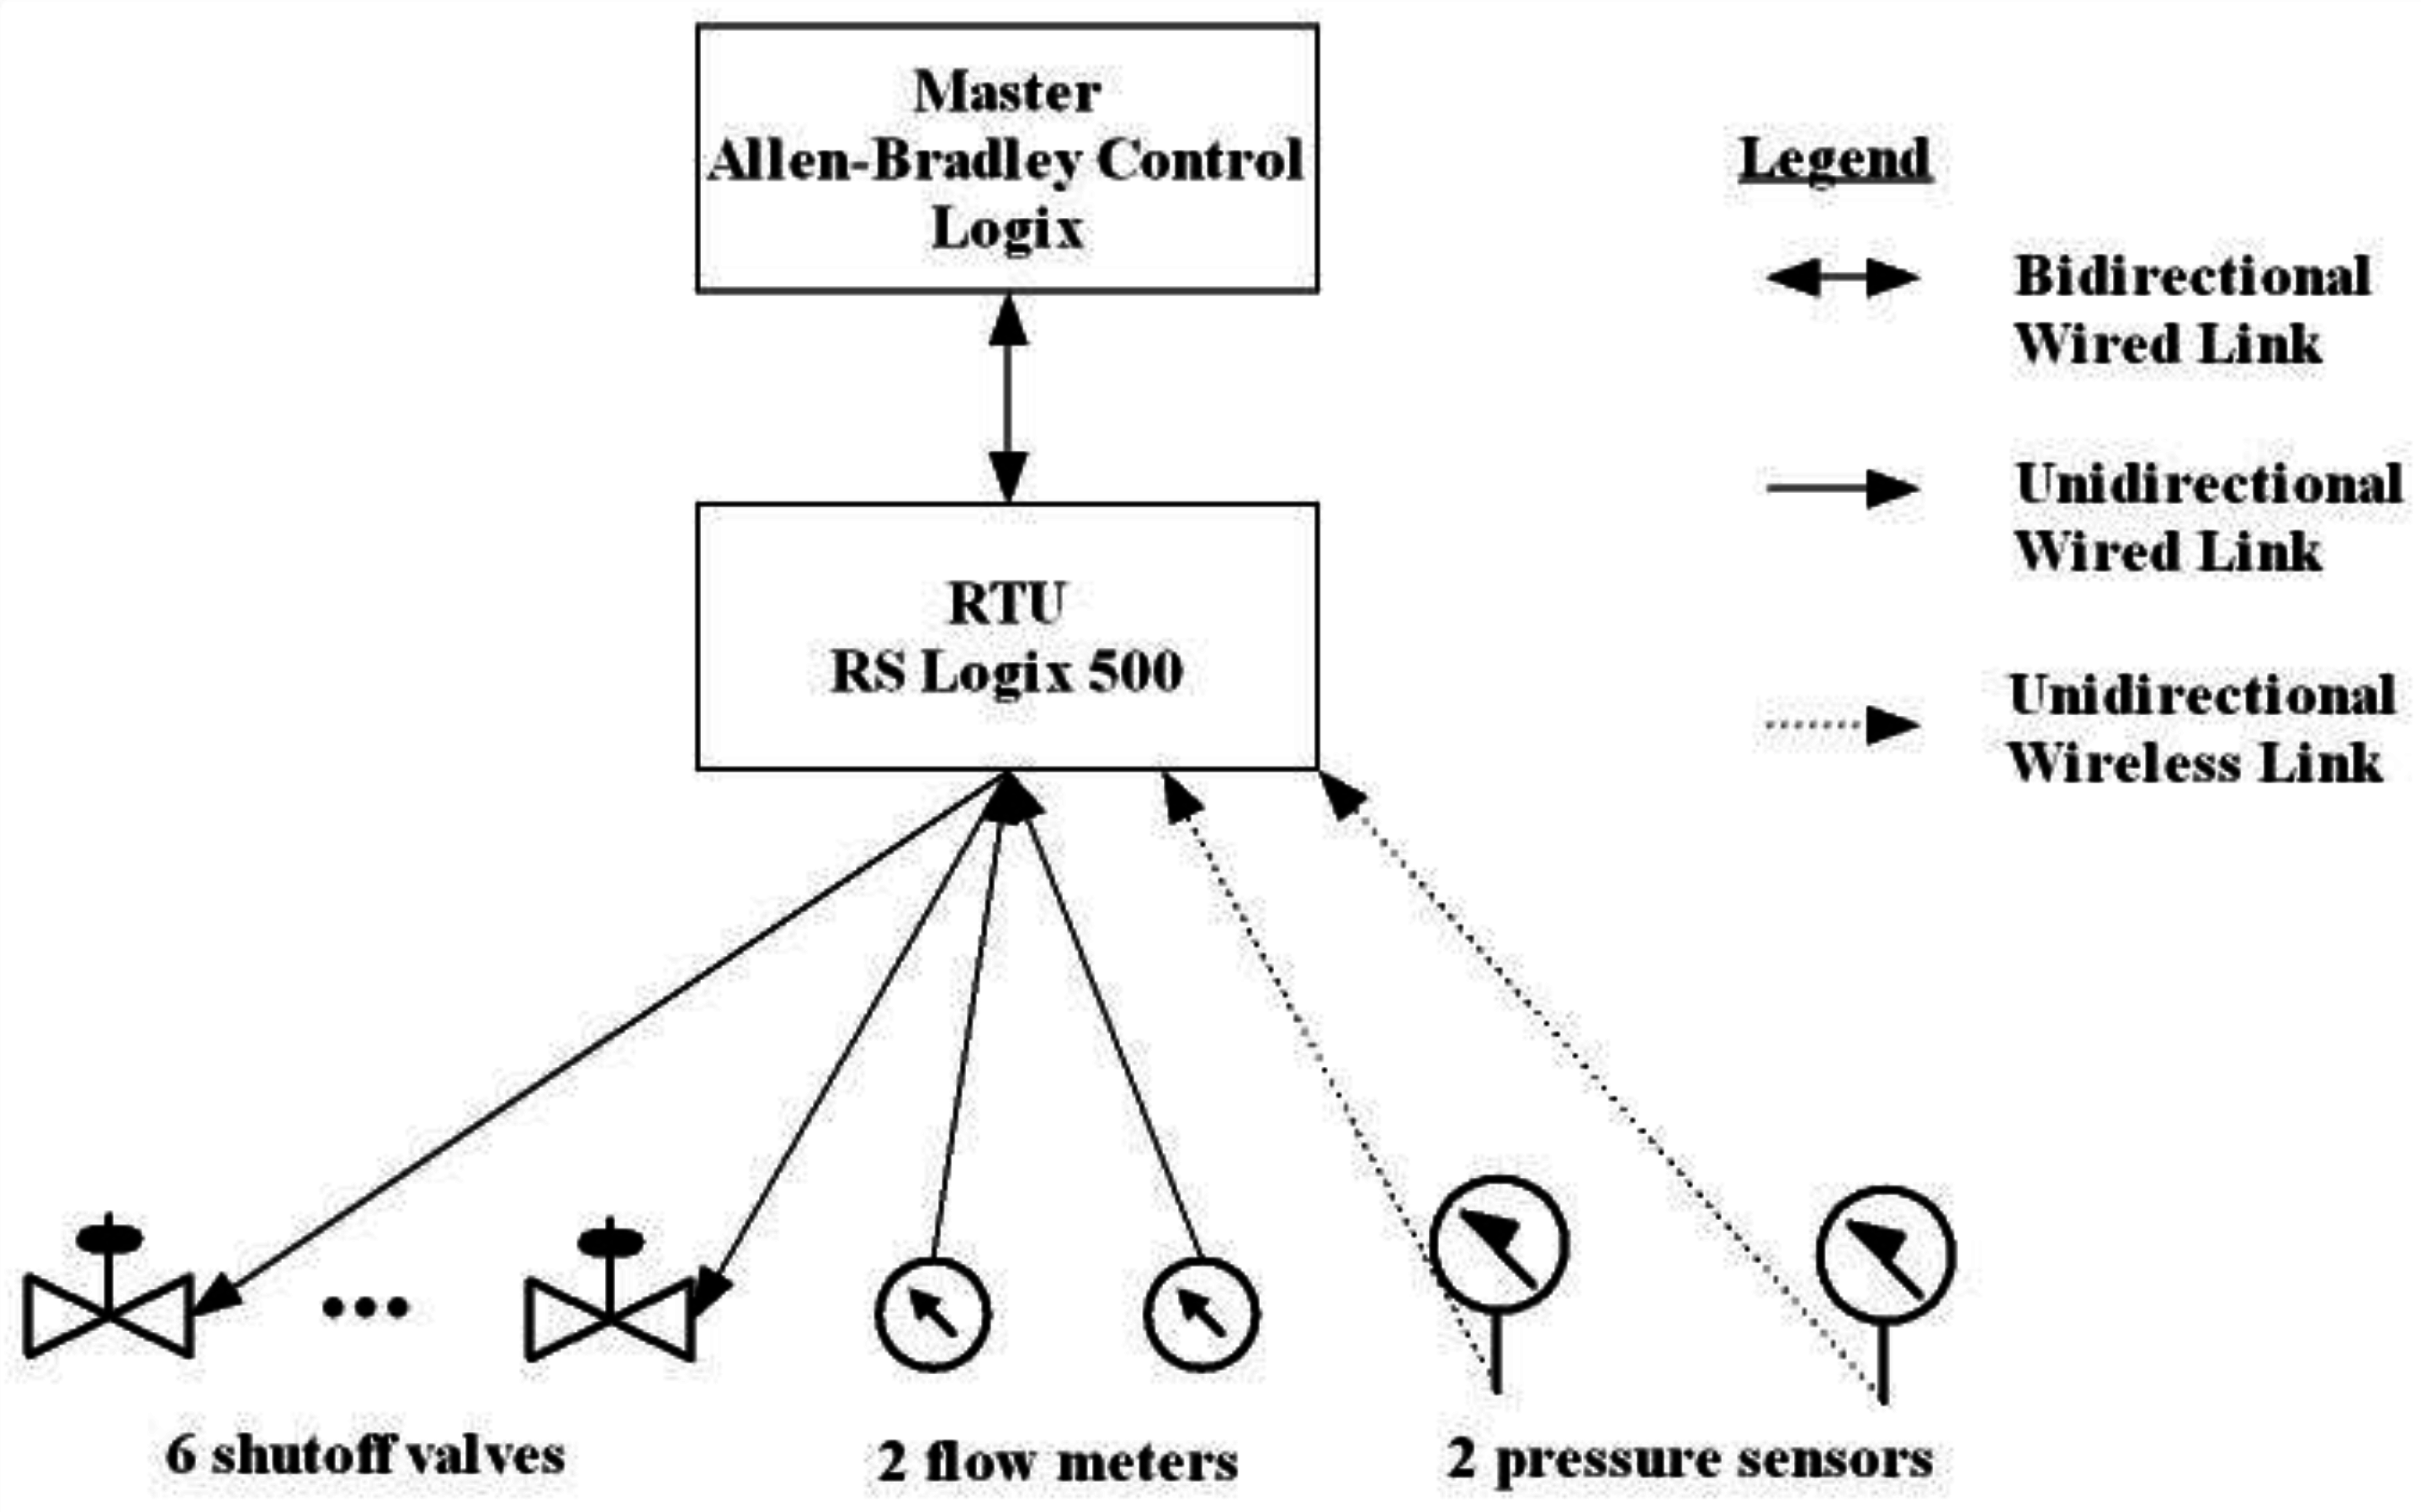
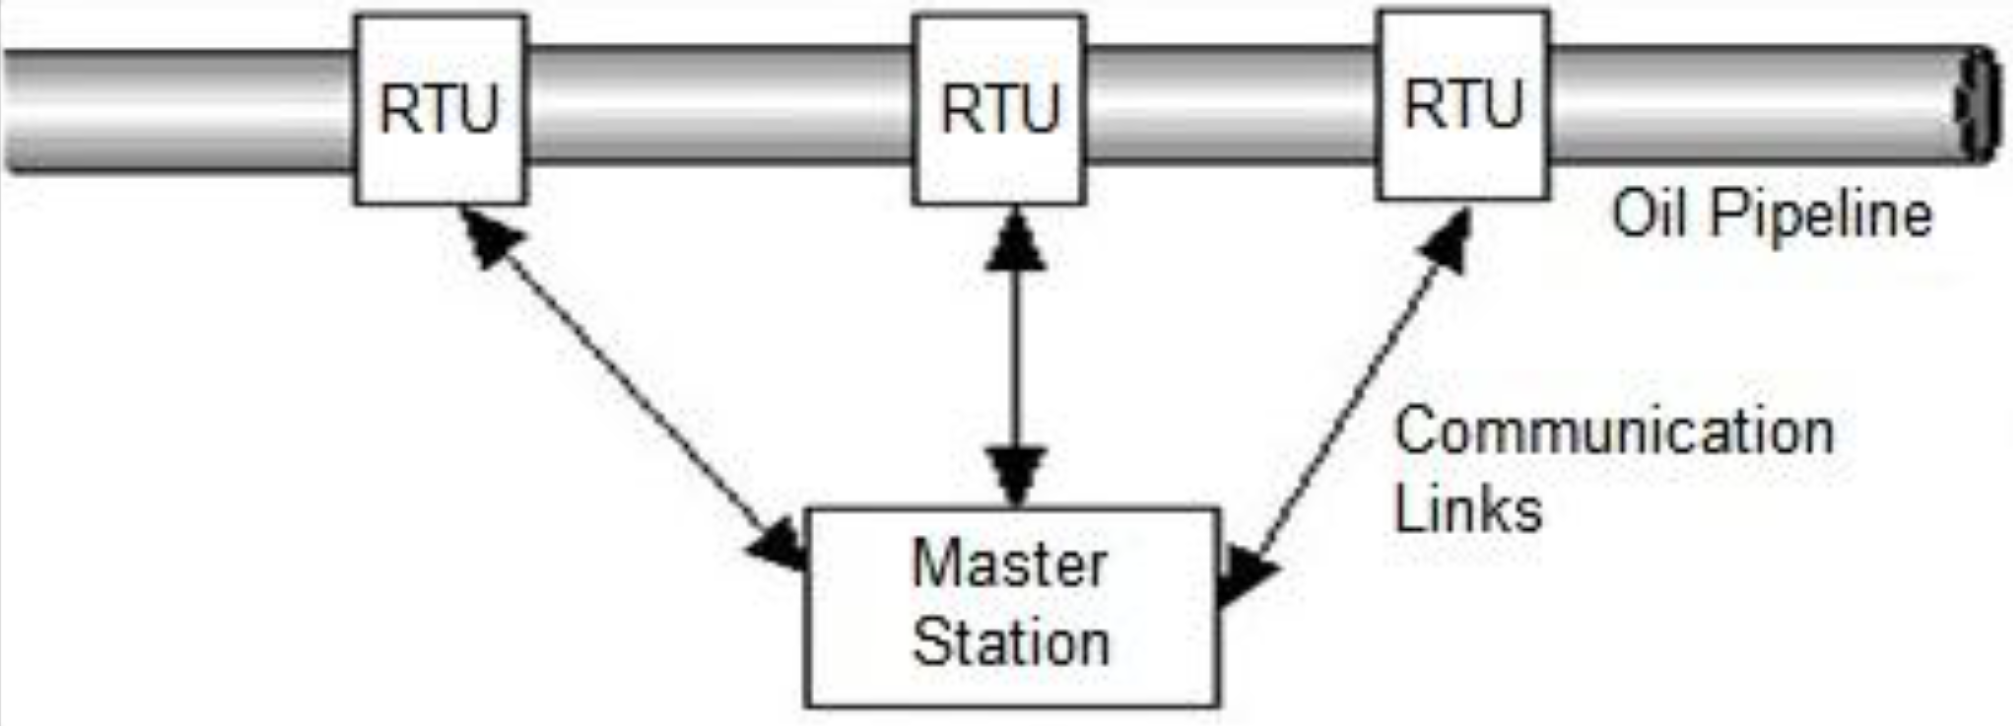
5.4.2. SCADA Installation

The NFR Approach is applied to assess safety and security of control system in oil pipelines, where these two properties are critically important. The system architecture for an oil pipeline SCADA system is shown in Figure 15. A typical oil-pipeline control system has several Remote Terminal Units (RTU’s) that are connected to field instruments that measure physical quantities such as pressure, temperature, or rate of flow of the oil in the pipeline. The field instruments also contain actuators that can affect the state of oil flow such as changing the rate of flow or the pressure. The RTUs communicate with a central master station using communication links such as Ethernet, satellite, cable, cellular, or fiber optic transmission media. The central Master Station gets the complete operational view of the entire system that allows planners to take appropriate actions based on business needs.
The system analyzed for safety and security properties is the SCADA system at the Center for Petroleum Security Research (CPSR) at UT Tyler. The architecture of the CPSR is shown in Figure 16. The system consists of an Allen-Bradley Control Logix (Rockwell Automation, Inc., Milwaukee, WI, USA) that serves as the master and RS Logix 500 units (also from Rockwell) serving as RTUs. The latter controls field equipment such as valves, meters, and sensors.
Security requirements include the following: only authorized personnel control the system, all events are logged for audit, and encrypted data are used for wireless transmissions. The NFR approach is used to evaluate the security of this cyberphysical system, which is addressed in the following section.

5.4.3. Applying the NFR Approach

The Softgoal Interdependency Graph (SIG) for this cyberphysical system is shown in Figure 17. The upper part shows the decomposition of security requirements, while the lower part shows the decomposition of the architecture of CPSR, the example cyberphysical system. The arrows between them show the contributions made by architectural (design) elements to requirements. Justifications for these contributions are captured by the claim softgoals.
NFR security for the system is represented by the softgoal Security [CPS] which is AND-decomposed into softgoals Access Control [Personnel], Audit Log [Events], and Encryption [Wireless], which refer to, respectively, the activities of access control, logging events for audit, and wireless encryption, all three of which help improve security and, therefore, the AND-decomposition of the NFR security.
Wireless encryption can be unidirectional or bidirectional, so softgoal Encryption [Wireless] is OR-decomposed into two NFR softgoals: Encryption [Wireless, RTUtoMaster] and Encryption [Wireless, MastertoRTU], representing the two directions in which wireless encryption can be done (either from RTU to Master or from Master to RTU). The final step in the application of the NFR Approach is to apply the propagation rules, the details of which have been presented in an earlier paper [59].
One of the major benefits of the NFR Approach is that quantitative evaluation of properties is possible. The first step for quantitative analysis is to map qualitative aspects of the SIG into quantitative aspects as shown in Figure 18.
First, as per M1, the label for the leaf softgoals is converted to a corresponding metric; thus, a satisficed leaf softgoal (it could be an operationalizing softgoal, an NFR or a claim softgoal) is converted to a corresponding metric and a denied softgoal is converted to its corresponding metric. Then, as per M2, each contribution (MAKE, HELP, HURT, BREAK) is converted to a corresponding quantitative representation. If either softgoals or contributions have associated criticalities, then we generated metrics for these criticalities (M3A and M3B).
Then, by M4, the quadruple of <leaf softgoal metric, leaf softgoal criticality metric, contribution metric, and contribution criticality metric> is converted into a metric representing the individual contribution of the leaf softgoal to its parent (which could be a softgoal or a contribution). By mapping rule M5, the collection of all individual contributions from child softgoals is converted into a metric for the parent softgoal.
Likewise, by mapping rule M6, the collection of all individual contributions from child softgoals is converted into a metric for the parent contribution. These metrics are then propagated recursively up the SIG, with each newly evaluated softgoal as the next leaf 59. The metrics propagated are indicated inside rectangles in Figure 17.
Any quantitative scheme that satisfies this mapping can be used to calculate safety and security metrics. Example calculations using the single-value scheme are shown in Figure 18 (right). Applying this scheme, we get a metric of −8 for security; details are given in [59]. However, we have the complete rationale for these metrics and more importantly we know how to improve (or even reduce) a desired metric. Also, the SIG maintains the historical record of decisions. Since the metrics trace back to the requirements of the system, we can quickly (re-)calculate the impact of changed requirements on these metrics. Besides deterministic quantitative scheme, the NFR Approach permits probabilistic, fuzzy logic, and other schemes to be used for deriving metrics.

5.4.4. Summary of the Measurement Process

The initial step is to make sure that SCADA fits into the model of a cyberphysical system of Section 3, which it does perfectly with its measurement/control interfaces and network interfaces, defining the attack surface. The following steps summarize how the security assessment process using the NFR approach, as described in details above, follows the security measurement guidelines of Section 4.3. It turns out that the NFR approach fits very naturally into Steps (1)–(5) of the guidelines, namely: (1) security decomposition into individual factors (softgoals) forms a valid model as a basis for assessment; (2) the degrees of satisficing, from strongly positive to strongly negative, form the metric for comparisons; (3) combinations of individual contributions of softgoals constitute an NFR measure; (4) application of propagation rules across the SIG defines the measurement process; and (5) due to the discrete nature of a metric, which is integer, a minimum error in an estimate is determined by the distance between two consecutive values of the metric.

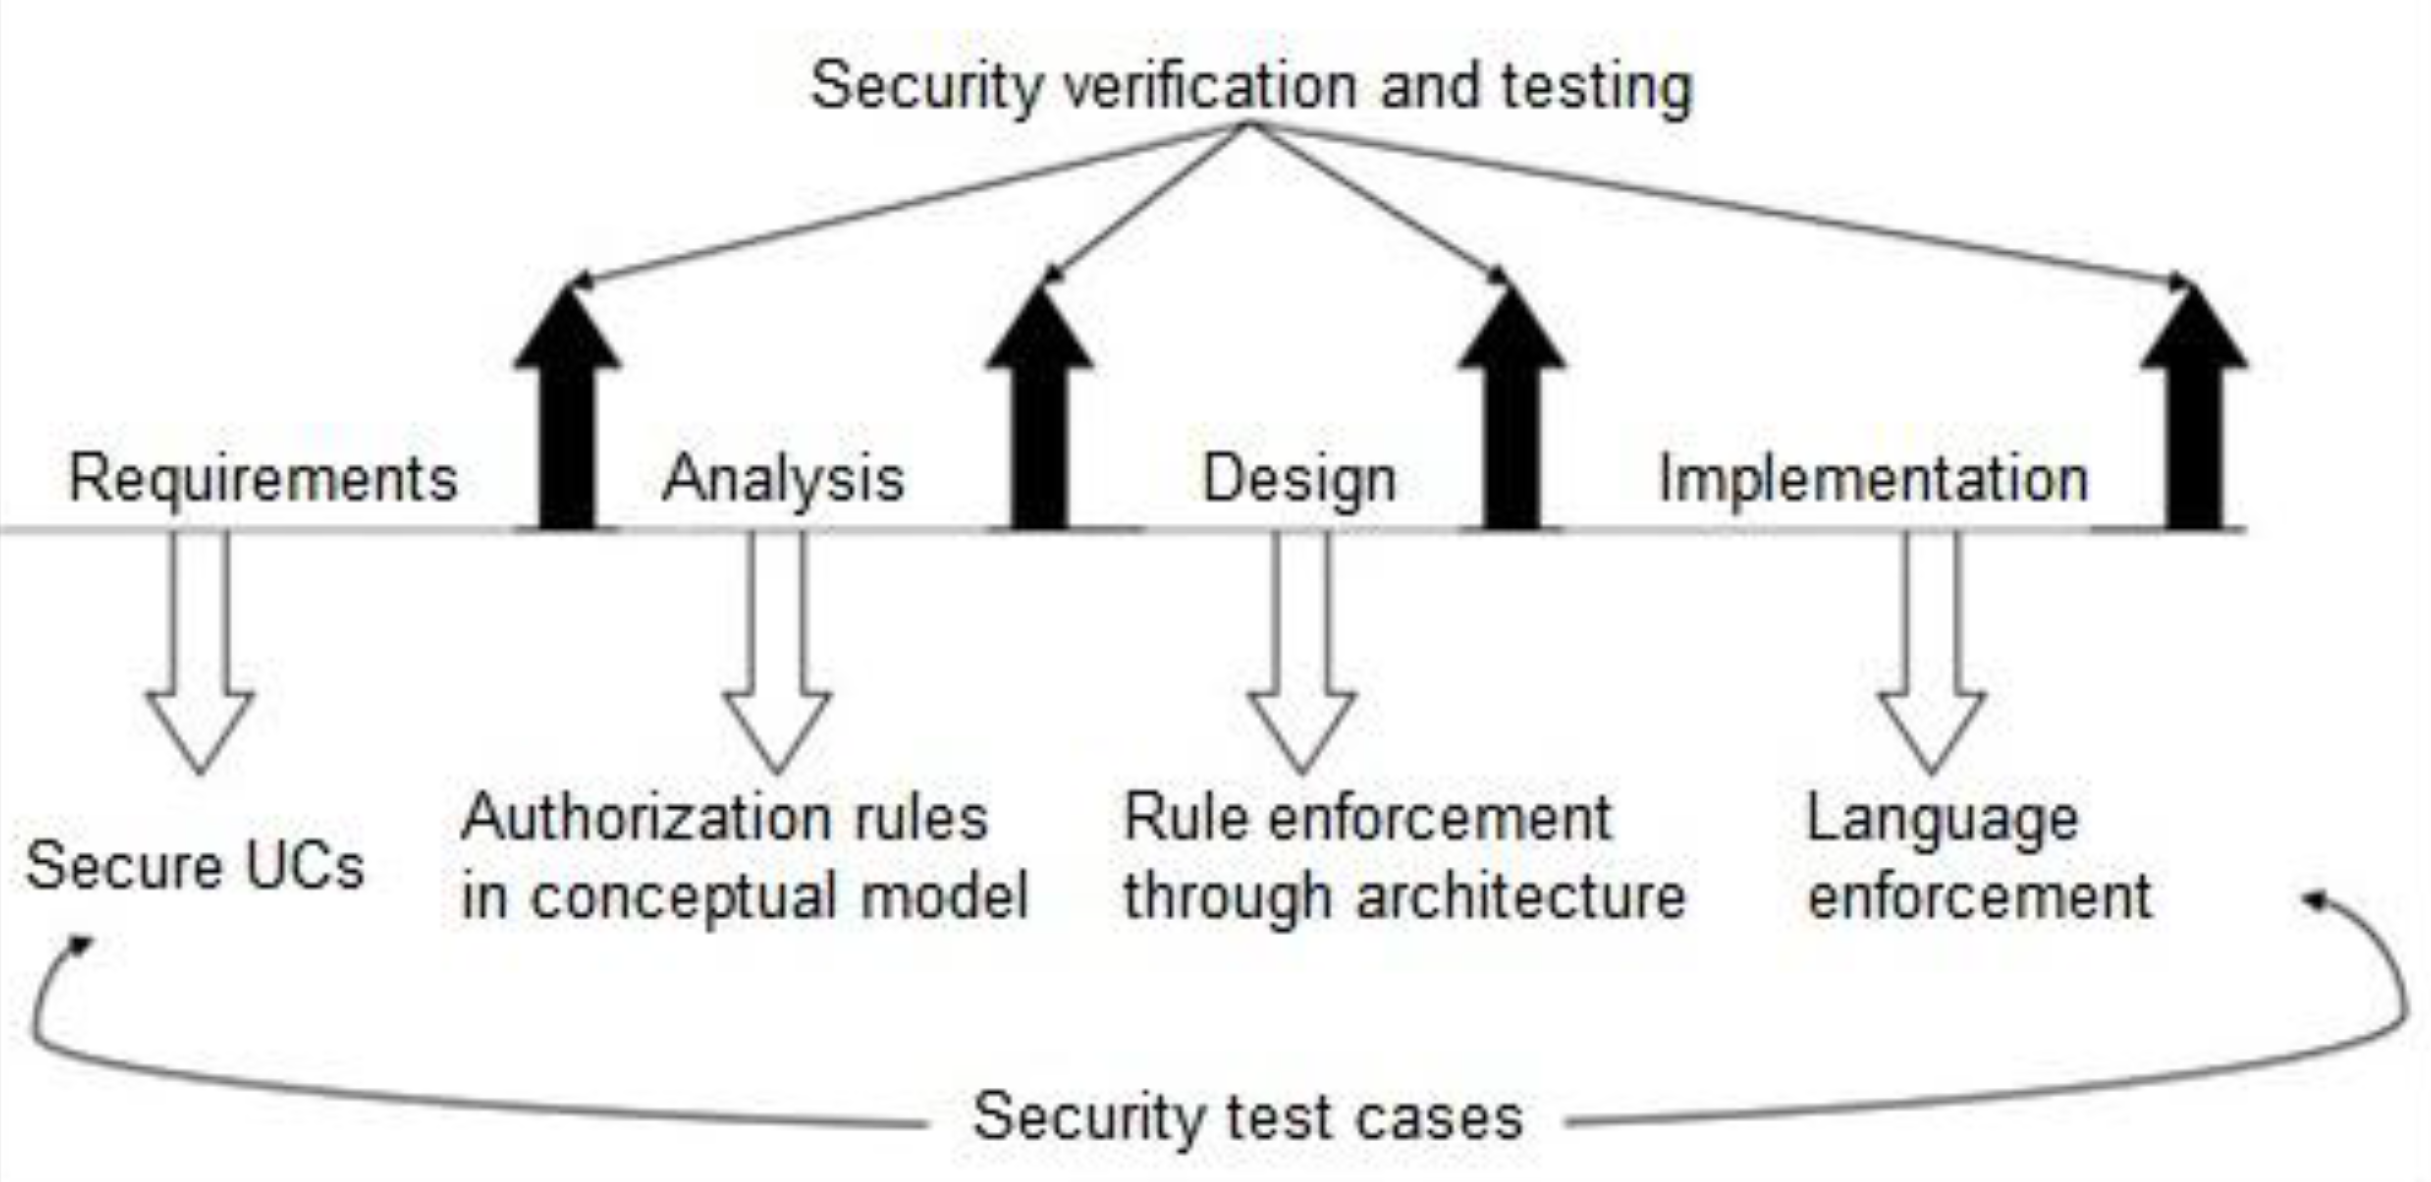
5.5. Case Study #5: Security Patterns

This case study analyzes the application of security patterns to assess quantitatively the security of a cyberphysical system using an example of web services. This is in line with the pervasive nature of the Internet of Things (IoT), which poses new challenges to the developers of cyberphysical systems. This section is based on earlier publications [60,61]. In subsequent subsections, we describe an approach to measuring security with security patterns indirectly, using the following features: complexity, usability, ease of implementation and efficiency of the pattern.

5.5.1. Overview of Security Patterns

A pattern is a recurring combination of meaningful units that occurs in some context and which embody expert experience and good design practices within the field. Patterns provide a systematic approach to building systems that possess non-functional properties such as security, safety or reliability. The use of patterns is fairly new to software development, however, their use and application have provided significant benefits to the quality of software systems [62,63].
Security patterns, in particular, provide a solution to a security problem within a given context. The Pattern Oriented Software Architecture (POSA) template [64] defines a systematic way to describe patterns. It consists of a number of units, each describing one aspect of a pattern, and is designed to capture the experience of professionals that have solved common problems.
The previous work by one of the co-authors [61], and summarized elsewhere [63], introduces two comprehensive methodologies for integrating security properties during system development with the use of security patterns. In these approaches, a specific security problem is mapped to a given security policy which is realized with the use of a security pattern as a solution. The security pattern describes the countermeasures and defenses that should be implemented to handle a particular security problem. In other words, these approaches inform how to develop a system from inception through to implementation stage that meticulously considers security at each stage.
In essence, each security requirement is tested and compared to the actual results obtained on a set of defined threats that the system is supposed to protect against. Figure 19 shows a secure software lifecycle, indicating where security can be applied (white arrows) and where to audit for compliance with security principles and policies (dark arrows). A security test case is an implementation that realizes a security requirement and, when it is executed, we can determine if the expected result of the security requirement is the same as to the actual result obtained from the test case.
Moreover, software testing tools such as Eclipse, JUnit and Maven allow for detail unit, component, system level testing [65], and test coverage for each security test case to further allow for verification of the expected security requirements. These tools provide useful information that includes: the time it takes for a threat to be handled and the type of failure that occurs if the threat is not mitigated as expected. These test results can be easily measured quantitatively based on the implementation of a particular method that implements security and one that does not. Coverage is an important factor that is measurable; and with the use of tools it is easier to determine what percentage of a system passes or fails for each security test case.
Other system properties that affect security directly, such as safety and reliability, can be easily integrated and evaluated using patterns. Work in [60,61] provides several hybrid patterns for integrating security and reliability during system development. In general, security patterns provide a versatile yet effective means of integrating security at a granular level throughout the entire system development cycle that can be measured at each stage.

5.5.2. Example of Web Services

Unhandled faults and vulnerabilities in software development can have catastrophic consequences. When a fault manifests itself and is not contained, it can result in a failure, which indicates that the system is not following the specifications. A policy can avoid or handle a failure or a threat. A pattern realizes the policy that can handle the fault and vulnerability. By enumerating all the faults and vulnerabilities starting at the requirements stage and having appropriate patterns to handle them, one can build secure and reliable systems.
Security and reliability aspects in a computer system are expressed differently at different architectural layers (levels) and stages of the software development process. Case in point, web services are widely used in the software units of cyberphysical systems with the adoption of the Service-Oriented Architecture (SOA) and the Cloud Architecture. Assessing the level of security and reliability in such services may not always be straightforward. Typically, vendors are not forthcoming in sharing the security countermeasures and defenses they utilize in their web services. Figure 20 illustrates a solution that integrates both security and reliability properties in a web service [61]. The solution utilizes a role-based access control defense, which ensures that only authorized users can access a service. This protects the confidentiality and integrity of the web service.
Figure 20 shows a class diagram for the Secure Reliability pattern that implements authorization for each user that wishes to access a service. It also guarantees reliability by ensuring that the service has redundancy, so that if it fails, it is immediately replaced by another service that will carry out the exact same operation. As shown in Figure 20, every user is a member of a role, and each role has specific rights associated with it. The service entity implements a strategy pattern, which chooses a software or hardware service, depending on the needs of the application. The reference monitor enforces the authorized use of the service. One approach to assess a web service is with the use of security and reliability certificates [60] as outlined in the next sub-section.
The security defenses, such as authorization via RBAC (Role Based Access Control), which are implemented using the pattern described above can be assessed using our security assessment approach and, based on the weighted average, we can determine whether or not the security pattern will be feasible and meet the expected security needs.

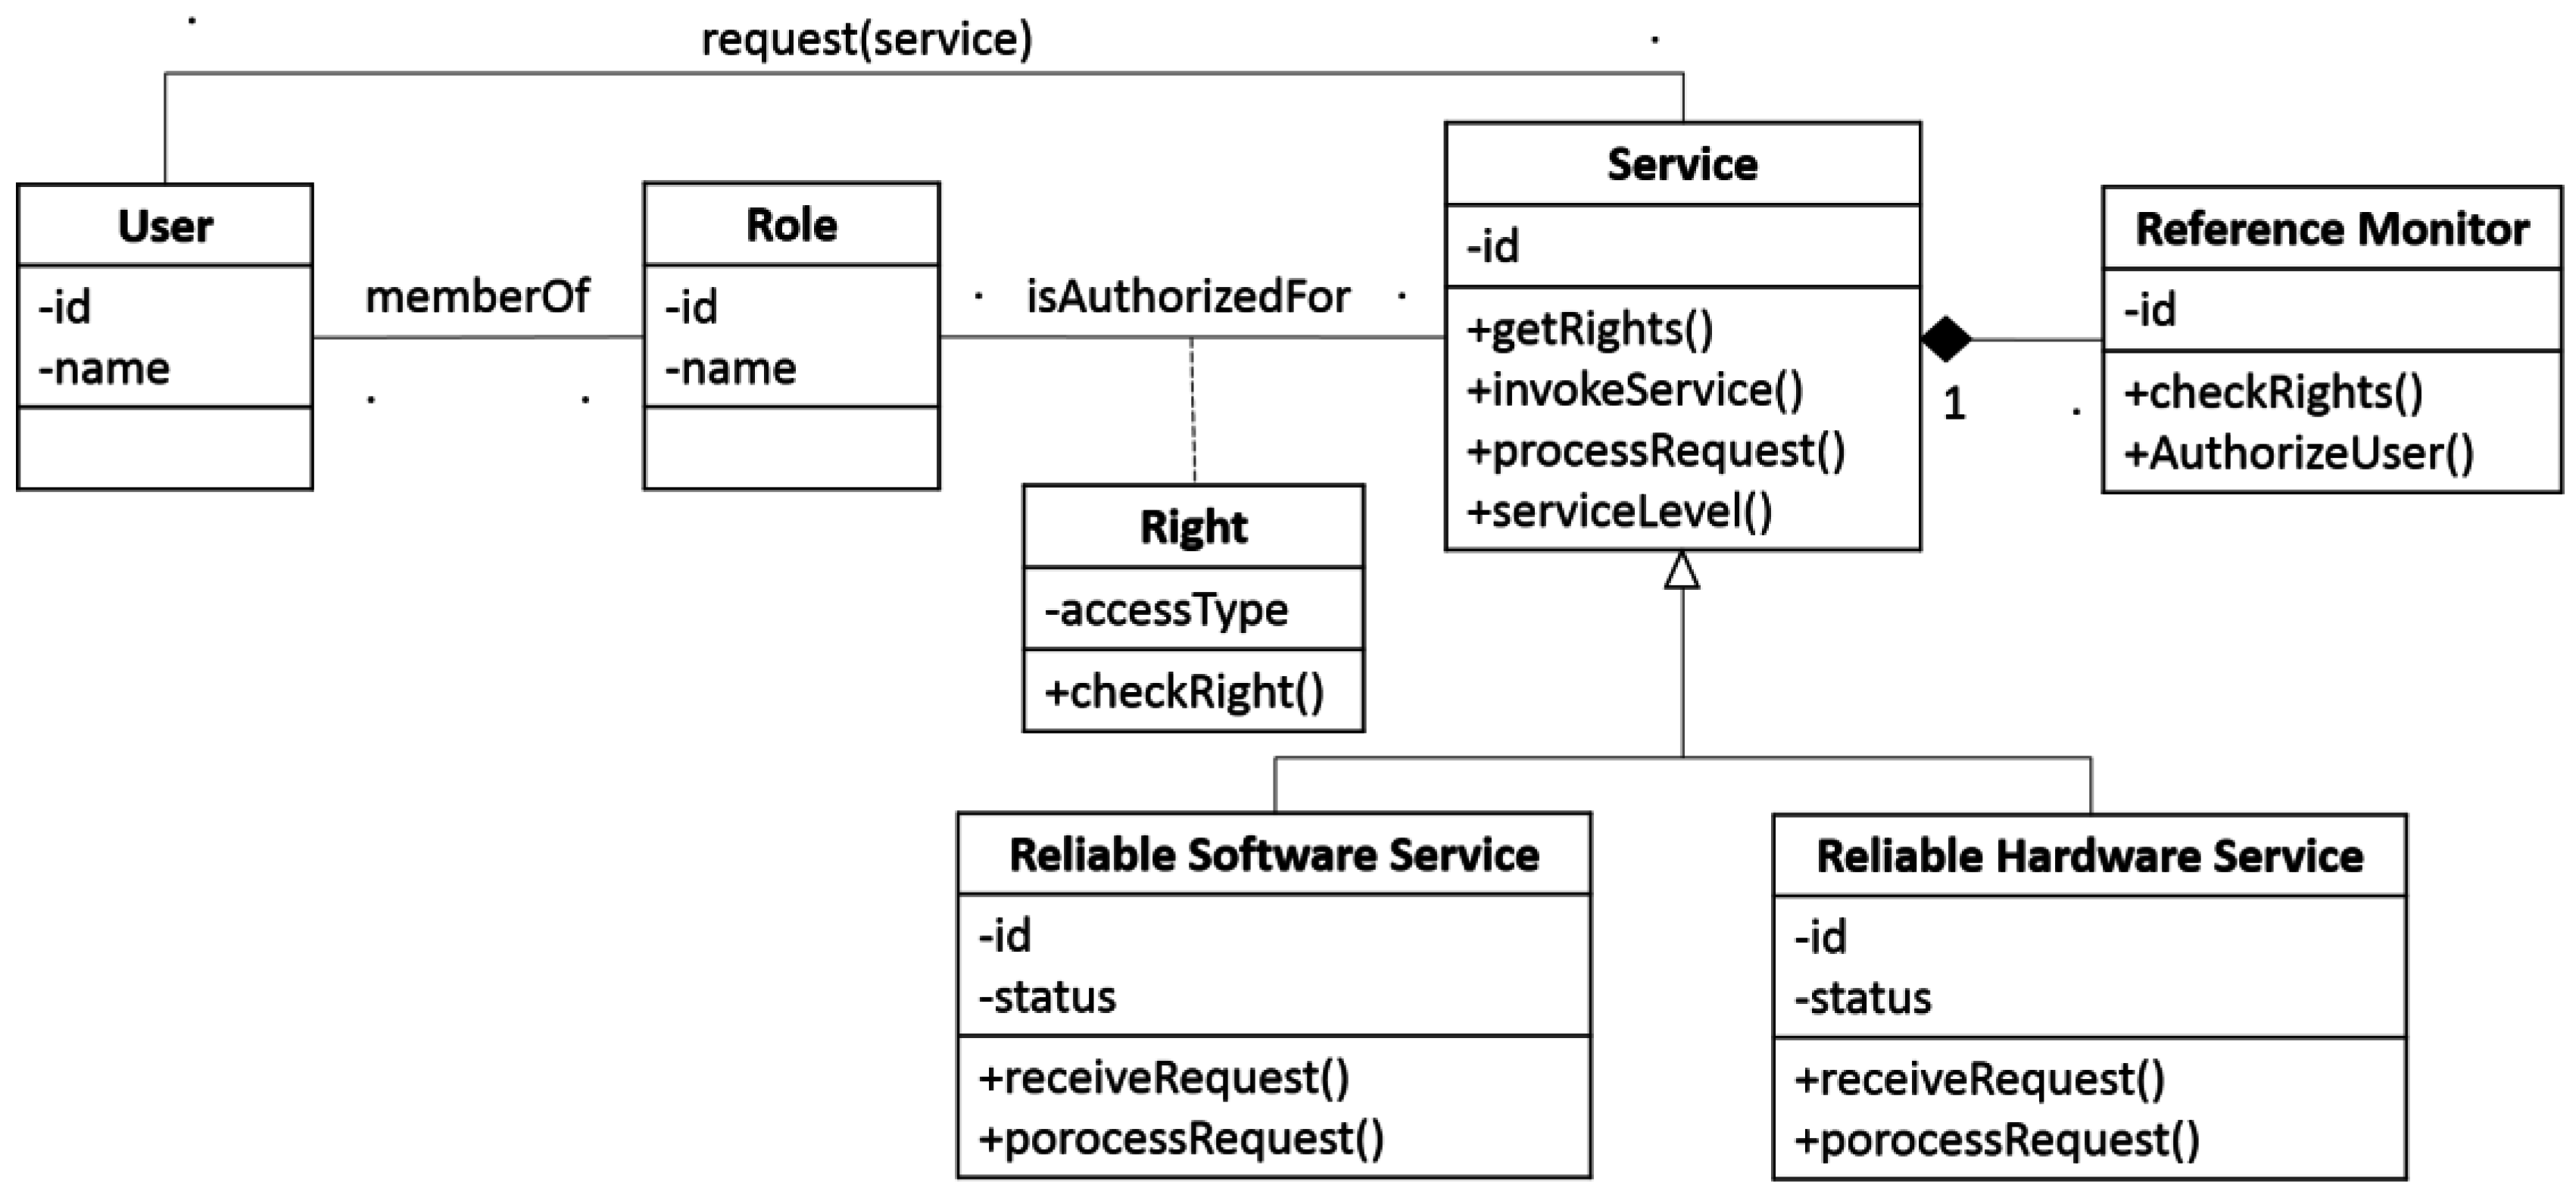
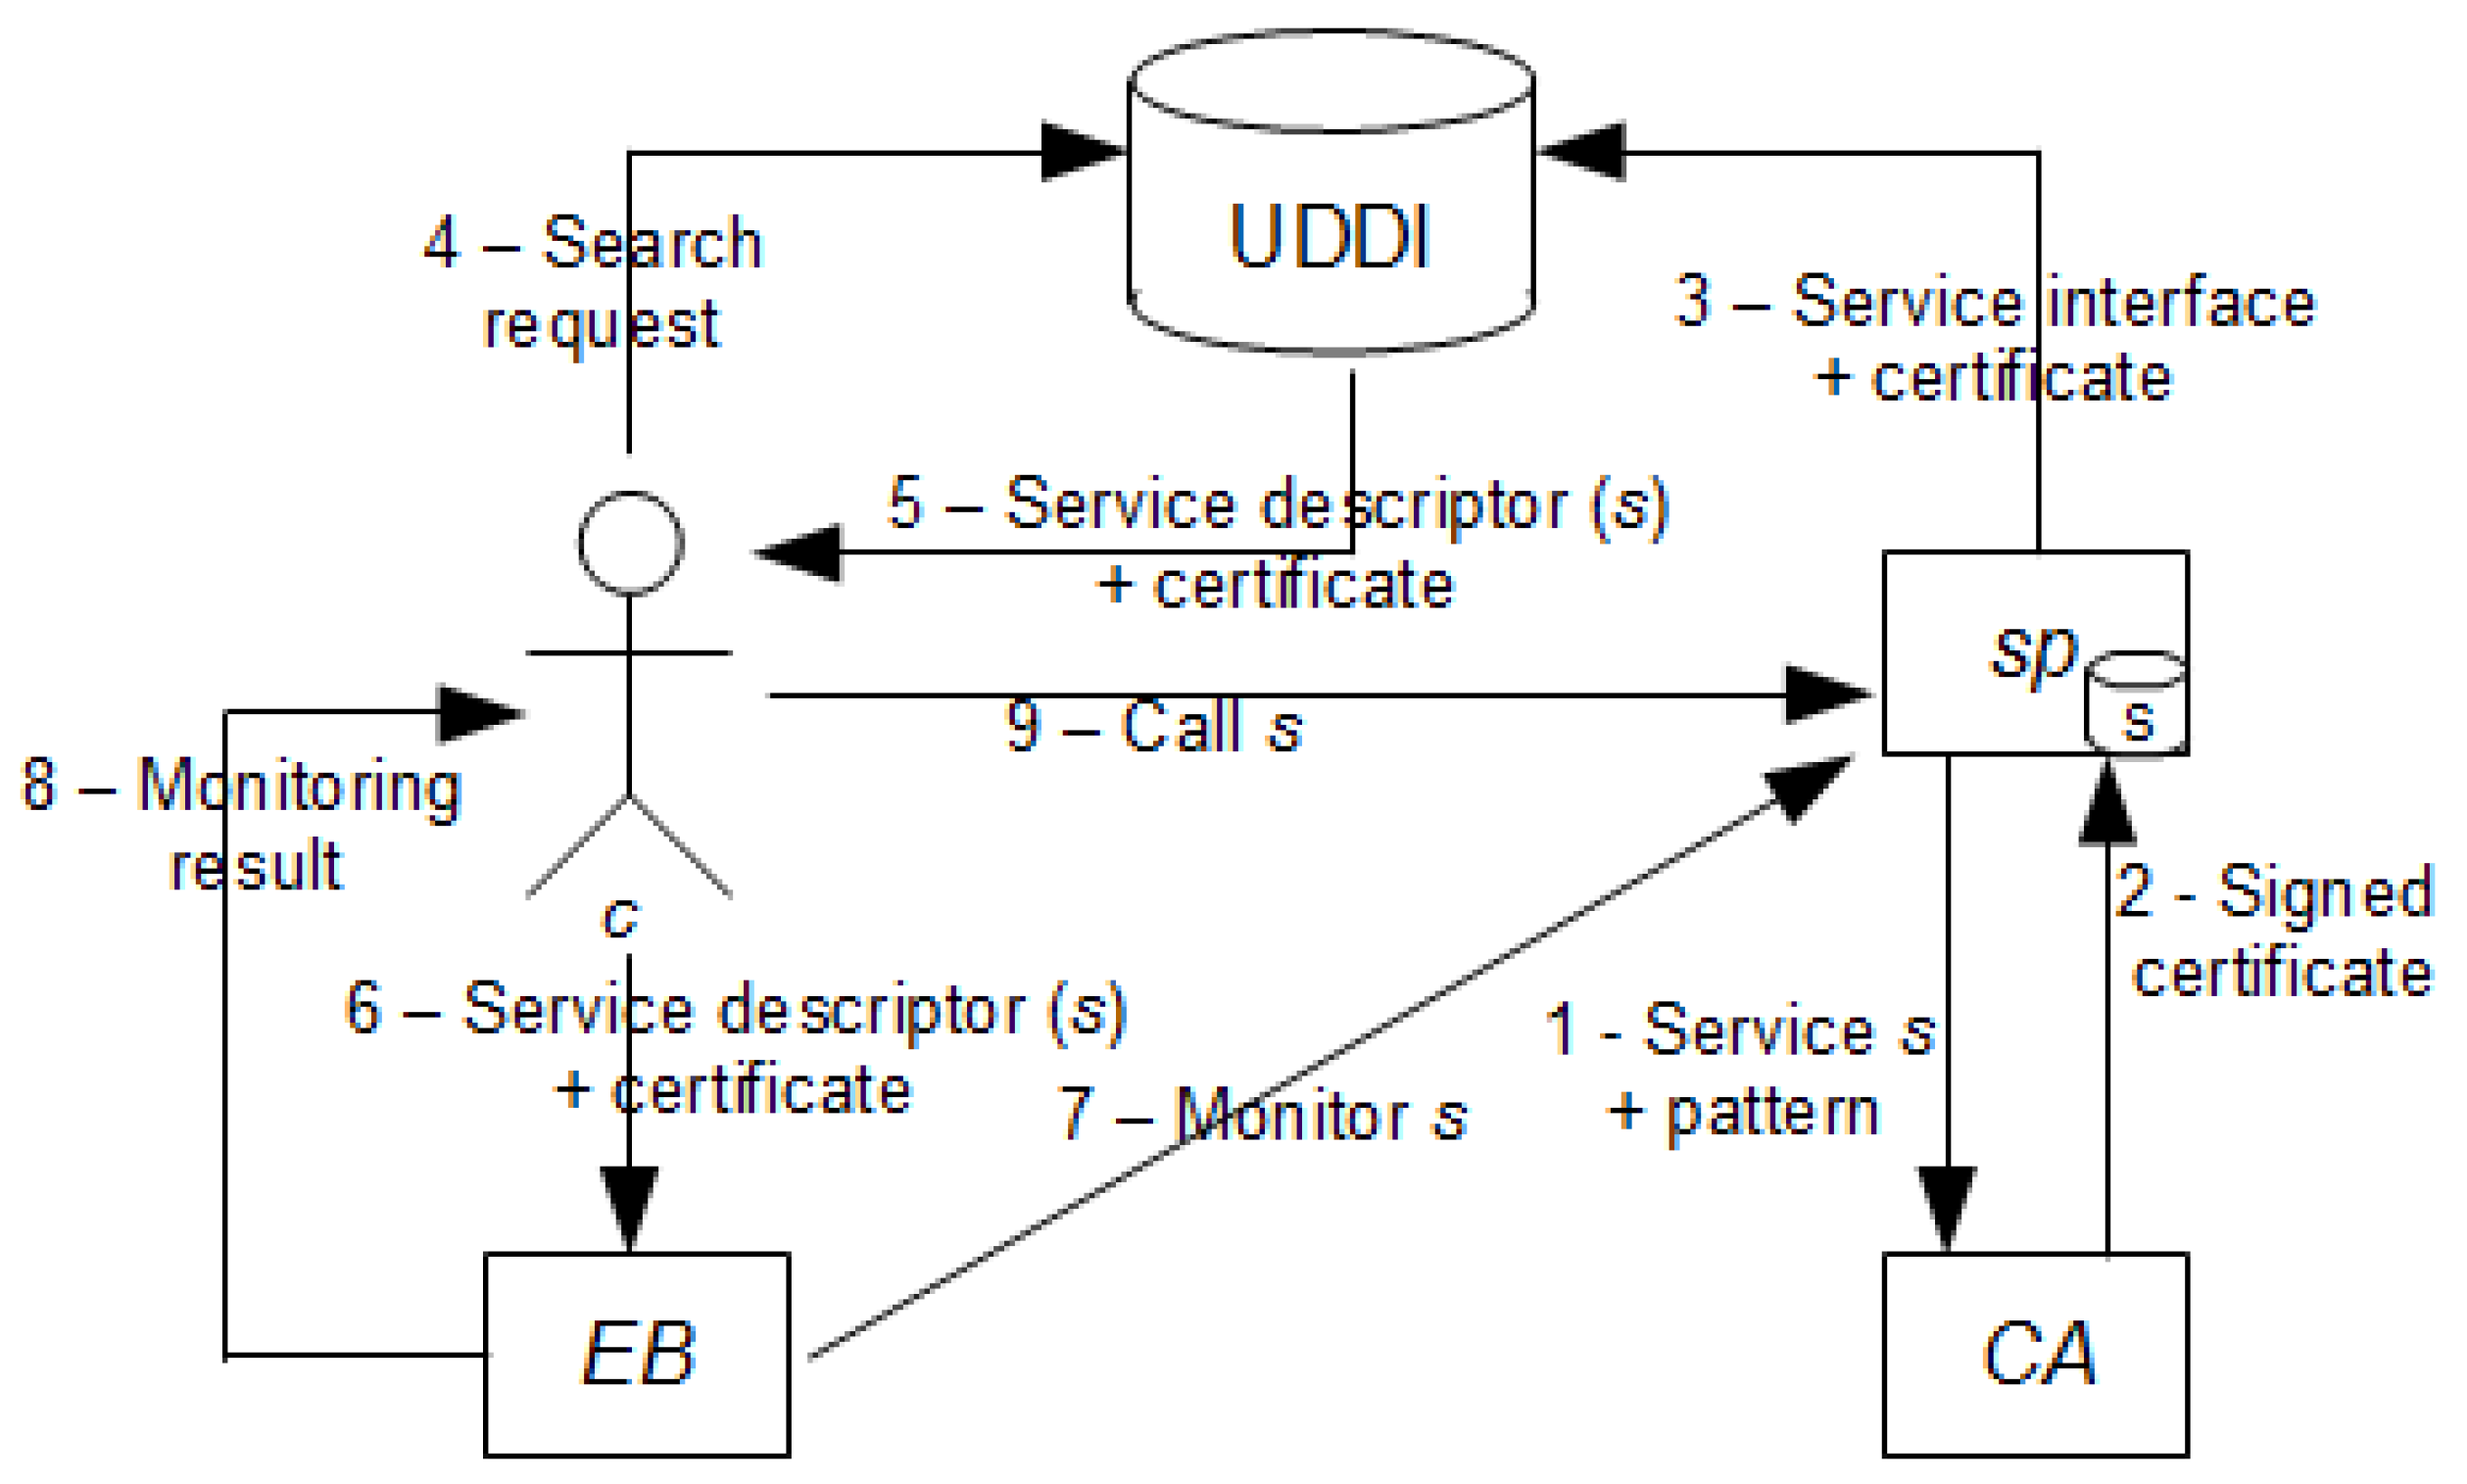
5.5.3. Security and Reliability Certificates Checking

Assessing security and reliability properties can be achieved with the use of machine-readable certificates. Let us consider the following example (Figure 21), given an enhanced SOA infrastructure composed of the following main parties [60]:
  • Client (c)—the entity that needs to select or integrate a remote service based on its reliability and security requirements. Here, the Client is a user who would be authorized by the reference monitor defense depicted in Figure 20.
  • Service provider (sp)—the entity implementing remote services accessed by c.
  • Certification Authority (CA)—an entity trusted by one or more users to assign certificates.
  • Evaluation Body (EB)—an independent, trusted component carrying out monitoring activities. EB is trusted by both c and sp to correctly check the certificate validity on the basis of the monitoring rules and metrics.
  • Service Discovery (UDDI)—a registry of services enhanced with the support for security and reliability certificates. Universal Description, Discovery, and Integration (UDDI) is an XML-based standard for describing, publishing, and finding web services. It is a specification for a distributed registry of web services that is a platform-independent, open framework.
The service invocation process enhanced with certification [60] is composed of two main stages, illustrated in Figure 21. First (Steps 1–2), CA grants a reliability certificate to a service provider, sp, based on a service implementation and a security and reliability pattern. Then (Steps 3–9), upon receiving the certificate for the service, s, sp publishes the certificate together with the service interface in a service registry. Next, the client, c, searches the registry and compares the certificates of the available services. Once the client has chosen a certificate, it will ask the trusted component, EB, to confirm its validity. EB checks that the monitoring rules hold and returns a result to c. If the result is positive, c proceeds to call the service. The SOA paradigm supports runtime selection and composition of services, which makes it difficult to guarantee a priori the security and reliability of a process instance.
The technique described above is based on machine-readable certificates that use reliability and security patterns to conduct a posteriori evaluation of web services. When an assessment of the security pattern using our security pattern assessment approach is completed, the weighted average is then used to determine whether or not a security pattern is certifiable. Pattern properties are assessed using the following features:
  • Complexity: The feature which refers to the number of security defenses that the pattern provides. For example, one pattern may only provide monitoring while another may conduct monitoring, authentication and authorization of users.
  • Usability: The feature which refers the ease with which the user can apply the pattern to solve a problem.
  • Ease of Implementation: This feature ties back to the template used to describe a security pattern. Some patterns do not provide enough relevant information to be useful to the user. Here, ease of implementation is measured by how comprehensive the security pattern description is.
  • Efficiency: This feature is measured using the degree of the side effects and consequences that is introduced by implementing the security pattern.
Each of the four features described above is evaluated using the following scale: Low—has a value weight of 1; Medium—has a value weight of 3; High—has a value weight of 5. Each of these four properties may be given a different weight, for example, usability is subjective and may not carry the same weight as efficiency or complexity.
Figure 21 illustrates the assessment process via interactions within the SOA enhanced with security and reliability certificates [60]. The primary interaction that realizes security is with the use of a reference monitor pattern and reliability patterns which satisfy the four security properties described above. The reference monitor pattern is written as outlined in the POSA template [62,63]. This pattern is widely accepted and utilized as an effective security control that directly satisfies security properties 2 and 3. Additionally, the reference monitor utilized in Figure 21 affords three pertinent security controls—that is, monitoring, authorization and authentication—and is further enhanced with reliability. Reliability here is realized in the form of redundancy patterns to ensure that, if any of the security controls fail, a backup is immediately invoked to seamlessly carry out the required security functionality, thereby satisfying properties 1 and 4.
There are many degrees to which redundancy can be implemented in the certificates described in Figure 21, whether by N-modular, dual-modular redundancy, triple-modular redundancy or N-Version programming [65]. Similarly, additional security controls can be added to the reference monitor such as a secure communication channel to further increase the security of the enhanced SOA certificates, however this decision must be made by the developer, to decide what degree of security and reliability is feasible depending on the nature of system being designed. Depending on the exact implementation of security and reliability, their value can be assessed using the scale of low, medium, or high within each of the four security features and an appropriate corresponding ranking value (1–5) can be determined to assess the degree of security that is achieved with the use of these certificates. Thus, the security and reliability patterns offer effective and systematic solution toward achieving increased security and reliability in cyberphysical systems that are measureable.

5.5.4. Outline of the Measurement Process

The SOA architecture and related patterns fall within the framework of a cyberphysical system at the higher level through the concept of Internet of Things (IoT), which allows access to low-level measurement and control devices via networks and related protocols that resemble an attack surface. To assess information security in this arrangement, a pattern can be evaluated according to the measurement process outlined in Section 4.3, as follows: (1) the property is split into four characteristics, including complexity, usability, ease of implementation, and efficiency; (2) a metric is defined as non-numerical scale of at least three levels (High, Medium, and Low); (3) a measure is defined by a formula composed of a linear combination of the assessment of all four features characterizing security patterns; (4) the measurement process follows principles of collecting data on patterns from industry and government sources and via expert interviews, and then applying the measure; (5) the accuracy of the measurement involves the concept of trustworthiness and is the subject of current research.

6. Conclusions

This paper discussed issues relevant to measuring security as a system property in cyberphysical systems. After introducing a definition of security as a property, placed in the context of cyberphysical systems, principles of measurement were presented, based on the modern view of measurement theory. It relies on defining the attack surface, first, then decomposing security into constituent features (attributes). This is followed by defining a metric as a scale, and a measure, which is a computational formula to evaluate security on the scale. The measurement process involves application of respective techniques using the measure to find a quantitative or qualitative estimate of security, and determine the accuracy or trustworthiness of the result.
Within this framework, five case studies taking diverse approaches to security assessment and measurement are discussed, based on, respectively: Markov chains, threat modeling, fault injection, non-functional requirements, and security patterns. Each approach is applied to a corresponding example of a cyberphysical system, and attempts to quantify the results in respective experiments.
In this view, results of this work can be summarized as follows:
  • Markov chains are an effective tool for modeling degradation of services due to security threats, and allow for an efficient assessment of security in cases when probabilities of state transitions can be reasonably determined;
  • threat modeling is useful in investigating system behavior at boundaries forming an attack surface, and—given the tool support—results in analysis of possibilities, which can negatively affect security, thus facilitating use of respective methods for quantitative evaluation of risks;
  • fault injection allows introducing deliberate disturbances to a cyberphysical system by distorting messages or message flow in the system; experiments with time-triggered protocol revealed that it is possible to quantify the extent of damage caused by security lapses;
  • non-functional requirements approach adds to the spectrum of quantitative evaluation methods the ability to evaluate designs; this capability is crucial in the development of cyberphysical systems, since it enables Design for Security, rather than security assessment as an afterthought;
  • security patterns by their very nature allow developing preventive security measures and their quantitative assessment; it makes them a very important tool for software designers, who may not be experts in security.
Each of the case studies presented here uses some security defense, such as: monitoring, failure or threat detection and various countermeasures to mitigate those threats and failures. However, not all defenses are equally effective. It is therefore imperative that the defenses, which are utilized in cyberphysical systems, actually work well. This gives rise to an important question: how can these defenses be evaluated and their effectiveness measured?
At present, there is no way to determine if a system is more or less secure when one adds or subtracts a particular application. Current approaches to evaluating security are policy based, assuring that certain procedures have been followed. However, this does not tell us if one design is more “secure” than another or if adding or subtracting a component strengthens or weakens the system.
Given that system developers are not typically experts in security, it makes sense to place greater emphasis on these aspects, and the presented techniques may serve as useful solutions to this problem. Security patterns, in particular, can be integrated in every stage of the software development life cycle as a defense mechanism, to ensure that the implementation is sound and that it will effectively protect the cyberphysical system from attacks.
Overall, the authors believe that this research is a step forward towards clarification of what is needed to assess and measure security as a system property. As they say “there is no one size that fits all”, the presented case studies shed some light on the subject by addressing the issue from a variety of viewpoints. It is also clear that there is a need to create a better database to keep track of the security problems we encounter, since way too often the problems are not being disclosed for a variety of business or political reasons. While addressing most of these issues and finding answers to similar questions are still the subject of intense research, this paper provides some uniformity in treating the area of security measurement and can serve as a framework for further studies.

Acknowledgments

Janusz Zalewski acknowledges the 2015 Air Force Summer Faculty Fellowship at Rome Labs. Part of this project was funded under a grant SBAHQ-10-I-0250 from the U.S. Small Business Administration (SBA). SBA’s funding should not be construed as an endorsement of any products, opinions or services. Thanks are due to Dawid Trawczynski for educating the authors about fault injection methods. Eduardo Fernandez is gratefully acknowledged for his role in straightening the authors’ understanding of security patterns.

Author Contributions

All authors made significant contributions to the paper. Janusz Zalewski conceived the concept, oversaw the development of case studies, and led the writing process. Ingrid Buckley conceived and designed the security patterns; Bogdan Czejdo contributed to evaluation of time-triggered systems; Steven Drager contributed to threat modeling; Andrew Kornecki was instrumental in conducting the availability case study; Nary Subramanian proposed and applied the NFR approach. All authors have read and approved the final manuscript.

Conflicts of Interest

The authors declare no conflict of interest. Cleared for public release on 29 February 2016: Reference No. 88ABW-2016-0922. Any opinions, findings and conclusions or recommendations expressed in this material are those of the author(s) and do not necessarily reflect the views of AFRL.

References

  1. Herrmann, D.S. Complete Guide to Security and Privacy Metrics: Measuring Regulatory Compliance, Operational Resilience and ROI; Auerbach Publications: London, UK, 2011. [Google Scholar]
  2. Brotby, W.K.; Hinson, G. Pragmatic Security Metrics: Applying Metametrics to Information Security; CRC Press: Boca Raton, FL, USA, 2013. [Google Scholar]
  3. Atzeni, A.; Lioy, A. Why to Adopt a Security Metric? A Brief Survey. In Quality of Protection: Security Measurements and Metrics; Gollmann, D., Massacci, F., Yautsiukhin, A., Eds.; Springer: New York, NY, USA, 2006; pp. 1–12. [Google Scholar]
  4. Bayuk, J.; Mostashari, A. Measuring Systems Security. Syst. Eng. 2013, 16, 1–14. [Google Scholar] [CrossRef]
  5. Performance Measurement Guide for Information Security; National Institute of Standards and Technology: Gaithersburg, MD, USA, 2008.
  6. Jansen, W. Directions in Security Metrics Research; National Institute of Standards and Technology: Gaithersburg, MD, USA, 2009. [Google Scholar]
  7. Barabanov, R.; Kowalski, S.; Yngström, L. Information Security Metrics: State of the Art; Swedish Civil Contingencies Agency: Stockholm, Sweden, 2011. [Google Scholar]
  8. A Community Website for Security Practitioners. Available online: http://www.securitymetrics.org (accessed on 7 June 2016).
  9. Hinson, G. Seven Myths about Security Metric. Available online: http://www.noticebored.com/html/metrics.html (accessed on 7 June 2016).
  10. Laird, L.M.; Brennan, M.C. Software Measurement and Estimation: A Practical Approach; John Wiley & Sons: Hoboken, NJ, USA, 2006. [Google Scholar]
  11. Department of Defense Trusted Computer Systems Evaluation Criteria; DoD 5200.28-STD; Department of Defense: Washington, DC, USA, 1985.
  12. Common Criteria for Information Technology Security Evaluation, Parts 1–3. Documents No. CCMB-2012-09-001, 002 and 003. Available online: http://www.commoncriteriaportal.org/cc/ (accessed on 7 June 2016).
  13. ISO/IEC. ISO/IEC 15408 Information Technology—Security Techniques—Evaluation Criteria for IT Security—Part 1: Introduction and General Models; ISO/IEC: Geneva, Switzerland, 2009. [Google Scholar]
  14. Bartol, N.; Bates, B.; Goertzel, K.M.; Winograd, T. Measuring Cyber Security and Information Assurance; Information Assurance Technology Analysis Center (IATAC): Herndon, VA, USA, 2009. [Google Scholar]
  15. Software Security Assessment Tools Review; Booz Allen Hamilton: McLean, VA, USA, 2009.
  16. Chapin, D.A.; Akridge, S. How Can Security Be Measured? Inf. Syst. Control J. 2005, 2, 43–47. [Google Scholar]
  17. Verendel, V. Quantified Security Is a Weak Hypothesis. In Proceedings of the NSPW’09, New Security Paradigms Workshop, Oxford, UK, 8–11 September 2009; ACM: New York, NY, USA, 2009; pp. 37–50. [Google Scholar]
  18. Littlewood, B.; Brocklehurst, S.; Fenton, N.; Mellor, P.; Page, S.; Wright, D.; Dobson, J.; McDermid, J.; Gollmann, D. Towards Operational Measures of Computer Security. J. Comput. Secur. 1993, 2, 211–229. [Google Scholar] [CrossRef]
  19. International Electrotechnical Commission (IEC). Electropedia: The World’s Online Electrotechnical Vocabulary; IEC: Geneva, Switzerland; Available online: http://www.electropedia.org/ (accessed on 7 June 2016).
  20. ISO/IEC/IEEE. 2476-2010 Systems and Software Engineering—Vocabulary; ISO/IEC: Geneva, Switzerland, 2011. [Google Scholar] [CrossRef]
  21. IEEE Software and Systems Engineering Vocabulary. Available online: http://computer.org/sevocab (accessed on 7 June 2016).
  22. National Information Assurance (IA) Glossary. Available online: https://www.ncsc.gov/nittf/docs/CNSSI-4009_National_Information_Assurance.pdf (accessed on 7 June 2016).
  23. Standards for Security Categorization of Federal Information and Information Systems; National Institute of Standards and Technology: Gaithersburg, MD, USA, 2004.
  24. Zalewski, J. Real-Time Software Architectures and Design Patterns: Fundamental Concepts and Their Consequences. Ann. Rev. Control 2001, 25, 133–146. [Google Scholar] [CrossRef]
  25. Mayr, O. Zur Frühgeschichte der technischen Regelungen; Oldenburg Verlag: München, Germany, 1969; (English translation: The Origin of Feedback Control; MIT Press: Cambridge, MA, USA, 1970). [Google Scholar]
  26. ISO/IEC. 27005-2011 Information Technology—Security Techniques—Information Security Risk Management; International Organization for Standardization: Geneva, Switzerland, 2011. [Google Scholar]
  27. National Physical Laboratory. History of Length Measurement; Teddington: Middlesex, UK; Available online: http://www.npl.co.uk/educate-explore/posters/history-of-length-measurement/ (accessed on 8 June 2016).
  28. Von Helmholtz, H. Zählen und Messen: Erkentnisstheoretisch betrachtet. In Philosophische Aufsätze: Eduard Zeller zu seinem fünfzigjährigen Doctorjubiläum gewidmet; Fues Verlag: Leipzig, Germany, 1887; pp. 17–52, (English translation: Counting and Measuring; Van Nostrand: New York, NY, USA, 1980). [Google Scholar]
  29. Definitions of the SI Base Units; National Institute of Standards and Technology: Gaithersburg, MD, USA. Available online: http://physics.nist.gov/cuu/Units/current.html (accessed on 8 June 2016).
  30. Andreas, B.; Azuma, Y.; Bartl, G.; Becker, P.; Bettin, H.; Borys, M.; Busch, I.; Fuchs, P.; Fujii, K.; Fujimoto, H. Counting the Atoms in a 28Si Crystal for a New Kilogram Definition. Metrologia 2011, 48, S1–S13. [Google Scholar] [CrossRef]
  31. Evans, D.; Stolfo, S. The Science of Security. IEEE Secur. Priv. 2011, 9, 16–17. [Google Scholar] [CrossRef]
  32. Glimm, J.; Sharp, D.H. Complex Fluid Mixing Flows: Simulation vs. Theory vs. Experiment. SIAM News 2006, 39, 12. [Google Scholar]
  33. Longman, R.W. On the Interaction Between Theory, Experiments, and Simulation in Developing Practical Learning Control Algorithms. Intern. J. Appl. Math. Comput. Sci. 2003, 13, 101–111. [Google Scholar]
  34. Zalewski, J.; Kornecki, A.J.; Wierzchon, S. Reasoning under Uncertainty with Bayesian Belief Networks Enhanced with Rough Sets. Int. J. Comput. 2013, 12, 135–146. [Google Scholar]
  35. Kornecki, A.J.; Zalewski, J. Experimental Evaluation of Software Development Tools for Safety-Critical Real-Time Systems. Innov. Syst. Softw. Eng. A NASA J. 2005, 1, 176–188. [Google Scholar] [CrossRef]
  36. Baquero, A.; Kornecki, A.J.; Zalewski, J. Threat Modeling for Aviation Computer Security. CrossTalk J. Def. Softw. Eng. 2015, 28, 21–27. [Google Scholar]
  37. International Vocabulary of Metrology—Basic and General Concepts and Associated Terms (VIM), 3rd ed.; Report JCGM 200:2012; BIPM Joint Committee for Guides in Metrology: Sèvres, France, 2012.
  38. Mell, P.; Scarfone, K.; Romanosky, S. (Eds.) CVSS—A Complete Guide to the Common Vulnerability Scoring System; Version 2.0.; National Institute of Standards and Technology: Gaithersburg, MD, USA, 2007; Available online: http://www.first.org/cvss/cvss-guide (accessed on 8 June 2016).
  39. National Vulnerability Database; Version 2.2; National Institute of Standards and Technology: Gaithersburg, MD, USA. Available online: http://nvd.nist.gov/ (accessed on 8 June 2016).
  40. Wang, J.A.; Wang, H.; Guo, M.; Xia, M. Security Metrics for Software Systems. In Proceedings of the ACM-SE ’09, 47th Annual Southeast Regional Conference, Clemson, SC, USA, 19–21 March 2009. Article No. 47.
  41. Kornecki, A.J.; Zalewski, J.; Stevenson, W. Availability Assessment of Embedded Systems with Security Vulnerabilities. In Proceedings of the SEW-34, 2011 IEEE Software Engineering Workshop, Limerick, Ireland, 20–21 June 2011; pp. 42–47.
  42. Cooperative Adaptive Cruise Control (CSE491–602 Class Projects), 2006. Available online: http://www.cse.msu.edu/~chengb/RE-491/Projects/cacc_msu-ford.pdf (accessed on 8 June 2016).
  43. Stevenson, W. Evaluating the Impact of Adding Security to Safety Critical Real-Time Systems; Graduate Research Project, Embry-Riddle Aeronautical University: Daytona Beach, FL, USA, 2010. [Google Scholar]
  44. Relex/Windchill Reliability Prediction Tool; PTC Product Development Company: Needham, MA, USA; Available online: http://www.ptc.com/products/relex/reliability-prediction (accessed on 8 June 2016).
  45. Swiderski, F.; Snyder, W. Threat Modeling; Microsoft Press: Redmond, DC, USA, 2004. [Google Scholar]
  46. Zalewski, J.; Drager, S.; McKeever, W.; Kornecki, A. Threat Modeling for Security Assessment in Cyberphysical Systems. In Proceedings of the CSIIRW 2013, 8th Annual Cyber Security and Information Intelligence Workshop, Oak Ridge, FL, USA, 8–10 January 2013. Article No. 10.
  47. Ingalsbe, J.A.; Kunimatsu, L.; Baten, T.; Mead, N.R. Threat Modeling: Diving into the Deep End. IEEE Softw. 2008, 25, 28–34. [Google Scholar] [CrossRef]
  48. Aijaz, A.; Bochow, B.; Dötzer, F.; Festag, A.; Gerlach, M.; Kroh, R.; Leinmüller, T. Attacks on Inter Vehicle Communication Systems—An Analysis. In Proceedings of the WIT2006, 3rd International Workshop on Intelligent Transportation, Hamburg, Germany, 14–15 March 2006; pp. 189–194.
  49. Vestlund, C. Threat Analysis on Vehicle Computer Systems. Master’s Thesis, Linköping University, Linköping, Sweden, 2010. [Google Scholar]
  50. Common Industrial Control System Vulnerability Disclosure Framework, 2012. Available online: http://www.us-cert.gov/ (accessed on 8 June 2016).
  51. Czejdo, B.; Zalewski, J.; Trawczynski, D.; Baszun, M. Designing Safety-Critical Embedded Systems with Time-Triggered Architecture. Technol. Railw. Transp. (TTN—Technika Transportu Szynowego, Poland) 2013, 19, 2265–2276. [Google Scholar]
  52. Trawczynski, D.; Zalewski, J.; Sosnowski, J. Design of Reactive Security Mechanisms in Time-Triggered Embedded Systems. SAE Intern. J. Passeng. Cars Electron. Electr. Syst. 2014, 7, 527–535. [Google Scholar] [CrossRef]
  53. Arlat, J.; Crouzet, Y.; Karlsson, J.; Folkesson, P. Comparison of Physical and Software-Implemented Fault Injection Techniques. IEEE Trans. Comput. 2003, 52, 1115–1133. [Google Scholar] [CrossRef]
  54. Trawczynski, D. Dependability Evaluation and Enhancement in Real-Time Embedded Systems. Ph.D. Thesis, Warsaw University of Technology, Warsaw, Poland, 2009. [Google Scholar]
  55. Rothbart, K.; Neffe, U.; Steger, C.; Weiss, R. High Level Fault Injection for Attack Simulation in Smart Cards. In Proceedings of the ATS 2004, 13th IEEE Asian Test Symposium, Kenting, Taiwan, 15–17 November 2004; pp. 118–121.
  56. Computer Science and Telecommunications Board. Embedded Everywhere: A Research Agenda for Networked Systems of Embedded Computers; National Research Council: Washington, DC, USA, 2001. [Google Scholar]
  57. TTTechComputertechnik AG. TTP-Powernode—Development Board. Product Description. Available online: http://www.tttech.com/products/ttp-product-line/ttp-powernode (accessed on 8 June 2016).
  58. MathWorks. Simulink. Product Description. Available online: http://www.mathworks.com/products/simulink/ (accessed on 8 June 2016).
  59. Subramanian, N.; Zalewski, J. Quantitative Assessment of Safety and Security of System Architectures for Cyberphysical Systems Using the NFR Approach. IEEE Syst. J. 2016, 10, 397–409. [Google Scholar] [CrossRef]
  60. Buckley, I.A.; Fernandez, E.B.; Anisetti, M.; Ardagna, C.A.; Sadjadi, M.; Damiani, E. Towards Pattern-based Reliability Certification of Services. In Proceedings of the DOA-SVI’11, 1st International Symposium on Secure Virtual Infrastructures, Hersonissos, Greece, 17–21 October 2011; Lecture Notes in Computer Science 7045, Part II. Springer: Berlin/Heidelberg, Germany, 2011; pp. 558–574. [Google Scholar]
  61. Buckley, I.A.; Fernandez, E.B. Patterns Combing Reliability and Security. In Proceedings of the Third International Conference on Pervasive Patterns and Applications, Rome, Italy, 25–30 September 2011.
  62. Schmidt, D.; Stal, M.; Rohnert, H.; Buschmann, F. Pattern-Oriented Software Architecture. In Patterns for Concurrent and Networked Objects; John Wiley & Sons: New York, NY, USA, 2000; Volume 2. [Google Scholar]
  63. Fernandez, E.B. Security Patterns in Practice: Designing Secure Architectures Using Software; John Wiley & Sons: New York, NY, USA, 2013. [Google Scholar]
  64. Buschmann, F.; Meunier, R.; Rohnert, H.; Sommerlad, P.; Stal, M. Pattern-Oriented Software Architecture: A System of Patterns; John Wiley & Sons: New York, NY, USA, 1996; Volume 1. [Google Scholar]
  65. Buckley, I.A.; Fernandez, E.B. Enumerating software failures to build dependable distributed applications. In Proceedings of the HASE 2011, 13th IEEE International Symposium on High Assurance Systems Engineering, Boca Raton, FL, USA, 10–12 November 2011; pp. 120–123.
Figure 1. Relationship between safety and security with the environment.
Information 07 00033 g001
Figure 2. Impact and relationships of hazards and threats.
Information 07 00033 g002
Figure 3. Illustration of a control system influenced by disturbances.
Information 07 00033 g003
Figure 4. Illustration of interactions in a modern control system.
Information 07 00033 g004
Figure 5. Illustration of basic terms and an attack surface.
Information 07 00033 g005
Figure 6. Modern cyberphysical system: disturbances and attacks.
Information 07 00033 g006
Figure 7. Context diagram of the CACC design.
Information 07 00033 g007
Figure 8. Markov model of the CACC system (no repairs). Init Cond: is 1 (true) for the initial state and 0 (false) for non-initial state (it is just a notation of the used tool).
Information 07 00033 g008
Figure 9. CACC Markov model showing repair from the failure state.
Information 07 00033 g009
Figure 10. Representation of a CAN example in the modeling tool.
Information 07 00033 g010
Figure 11. Example of an analysis in the modeling tool.
Information 07 00033 g011
Figure 12. System view of the security monitoring in a cyberphysical system.
Information 07 00033 g012
Figure 13. Illustration of an ABS system operation (brake-by-wire).
Information 07 00033 g013
Figure 14. Results of disabling Node B of QVM. TDMA stands for Time Division Multiple Access method of multiple nodes to the bus, while TDMA Round is a duration of a single experiment.
Information 07 00033 g014
Figure 15. Typical oil pipeline control system.
Information 07 00033 g015
Figure 16. CPSR system architecture.
Information 07 00033 g016
Figure 17. SIG for evaluating security of the cyberphysical system and phase 1 in the NFR approach.
Information 07 00033 g017
Figure 18. Mapping qualitative aspects of SIG to a quantitative evaluation scheme (left) and example of single-value quantitative scheme calculation (right).
Information 07 00033 g018
Figure 19. Overview of security verification over the life cycle.
Information 07 00033 g019
Figure 20. Class diagram for the Secure Reliability Pattern.
Information 07 00033 g020
Figure 21. An SOA enhanced with security and reliability certification.
Information 07 00033 g021
Table 1. Probabilities of transitions.
ProbabilityAssigned Values
Corrupted Valid MessageCase 1: 0.005/Case 2: 0.05
Introduced False MessageCase 1: 0.005/Case 2: 0.05
Deleted Valid MessageCase 1: 0.001/Case 2: 0.01
Message FloodingCase 1: 0.001/Case 2: 0.01
Return to Regular (security mitigation works)0.99/0.9/0.5
Failing Return to Regular (security mitigation fails)0.01/0.1/0.5
Return from Fail to Regular (repair rate)0 (no repair)/0.5/0.9
Table 2. Simulation results.
AvailabilitySecurityCorrelationSlopeInterceptPredicted SecurityPrediction Error (%)
case 1: low attack rate/no repair
97.7408500.999999639.324−3793.51050.0050.010%
98.757290-39.324−3793.51089.973−0.030%
98.987399-39.324−3793.51099.0220.022%
case1: low attack rate/0.5 repair probability
98.3877500.999999880.005−7821.54950.0030.007%
98.887490-80.005−7821.54989.982−0.020%
99.000399-80.005−7821.54999.0150.015%
case1: low attack rate/0.9 repair probability
98.5872500.9999998117.478−11531.82950.0030.007%
98.927590-117.478−11531.82989.981−0.021%
99.004499-117.478−11531.82999.0150.015%
case 2: high attack rate/no repair
80.4847500.99995464.822−338.06450.0520.104%
88.712790-4.822−338.06489.730−0.301%
90.680499-4.822−338.06499.2180.220%
case 2: high attack rate/0.5 repair probability
85.7505500.99998239.736−784.80650.0320.064%
89.838590-9.736−784.80689.831−0.187%
90.794399-9.736−784.80699.1370.138%
case 2: high attack rate/0.9 repair probability
87.3755500.999987714.214−1191.91750.0270.053%
90.177990-14.214−1191.91789.859−0.156%
90.82999-14.214−1191.91799.1140.115%

