
On-Body Smartphone Localization with an Accelerometer


Department of Computer and Information Sciences, Tokyo University of Agriculture and Technology, 2-24-16 Naka-cho Koganei, Tokyo 184-8588, Japan
Information 2016, 7(2), 21; https://doi.org/10.3390/info7020021
Submission received: 17 November 2015
/
Revised: 7 March 2016
/
Accepted: 10 March 2016
/
Published: 29 March 2016
(This article belongs to the Special Issue Future Information Technology and Intelligent Systems)
Abstract
:A user of a smartphone may feel convenient, happy, safe, etc., if his/her smartphone works smartly based on his/her context or the context of the device. In this article, we deal with the position of a smartphone on the body and carrying items like bags as the context of a device. The storing position of a smartphone impacts the performance of the notification to a user, as well as the measurement of embedded sensors, which plays an important role in a device’s functionality control, accurate activity recognition and reliable environmental sensing. In this article, nine storing positions, including four types of bags, are subject to recognition using an accelerometer on a smartphone. In total, 63 features are selected as a set of features among 182 systematically-defined features, which can characterize and discriminate the motion of a smartphone terminal during walking. As a result of leave-one-subject-out cross-validation, an accuracy of 0.801 for the nine-class classification is shown, while an accuracy of 0.859 is obtained against five classes, which merges the subclasses of trouser pockets and bags. We also show the basic performance evaluation to select the proper window size and classifier. Furthermore, the analysis of the contributive features is presented.
1. Introduction
Mobile phones are getting smarter due to the advancement of technologies, such as microelectromechanical systems (MEMS), high performance and low power computation, also called a smartphone. Various sensors are embedded in or attached to a device, and a wide variety of contextual information can be extracted, which is about the user, the device and/or the environment. These sensors are (or will) not only utilized for explicit usage of the terminal’s functionalities, like user authentication [1], display orientation change and backlight intensity control [2], but also for activity recognition [3,4], indoor person localization [5,6], pedestrian identification [7], environmental monitoring [8,9], etc. A phone carrying survey revealed that 17% of people determine the position of storing a mobile phone based on contextual restrictions, e.g., no pocket in the T-shirt, too large a phone size for a pants pocket, comfort for an ongoing activity [10]. These factors are variable throughout the day, and thus, users change their positions in a day. This suggests that the context, on-body device position, has great potentials for improving the usability of a smartphone and the quality of sensor-dependent services, facilitating human-human communication, the reduction of unnecessary energy consumption, etc. In this article, we deal with nine popular storing positions for a smartphone, including four types of bag. We attempt to find a set of features that can characterize and discriminate the motion of a smartphone during walking, using an embedded accelerometer. The contributions of the paper are as follows:
- Recognition features are analyzed from a microscopic point of view, in which a systematic feature selection specified 63 classifier-independent features that are more predictive of classes and less correlated with each other. Especially, we found that: (1) features derived from the y-axis are the most contributive; (2) the correlation between the y-axis and the magnitude of three axes, i.e., the force given to the device, might be useful to capture the characteristics of the propagated ground reaction force within nine storing positions; and (3) the selected features were also effective at classifying three additional classes, i.e., wrist, upper arm and belt.
- A “compatibility” matrix is introduced and showed the possibilities of improving the accuracy by removing a “noisy” dataset of particular persons from a training dataset and training a classifier using a dataset with similar characteristics of the acceleration of a device during walking.
- The high precision against “neck” and “trouser pocket” under leave-one-subject-out cross validation (0.95) allows reliable placement-aware environmental risk alert.
The rest of the article is organized as follows: Section 2 presents the importance of on-body position recognition with examples in three categories, and a literature survey is shown in Section 3. Section 4 describes our approach, followed by the performance evaluation in Section 5. Discussions based on the evaluation are presented in Section 6. Finally, Section 7 concludes the article.
2. Importance of On-Body Position Recognition
In this section, the importance of taking into account the on-body position of a device as the context of a system is presented.
2.1. Device Functionality Control
In our preliminary study, an audio notification is perceived with significantly smaller sound volume when a smartphone is hanging from the neck, compared to the case of putting it into a trouser pocket and a jacket pocket. This may also be experienced by a number of people. The case with a chest pocket comes in the middle of “neck” and “trouser pockets”. One static solution is to set an audio level sufficiently high, so that a user could perceive it at any storing position; however, it is annoying in the vicinity when the smartphone is hanging from the neck, because a user can notice it with an even lower audio level at the position. Therefore, the audio volume can be adjusted at a minimum level by the information of the storing position, so that only the user can receive the notification, as Diaconita et al. intended [11,12]. Other functionalities, such as a display component and a keypad, can be controlled to avoid power drain due to an invisible display, as well as accidental inputs when a smartphone is inside a bag or pocket [13].
2.2. Accurate Activity Recognition
A context-aware system does not work as designed when the context is not correctly recognized. In the work on activity recognition using body-mounted sensors, including smartphones, the sensing device is often assumed to be at the intended positions [3,4,14]. Pirttikangas et al. showed that an accelerometer hanging from the neck had contributed to discriminate certain kinds of movement of the upper body, such as brushing teeth and sitting while reading a newspaper [4]. Atallah et al. showed the variations in activity recognition performance by the position of body-worn sensor [15], in which sensors placed on the wrist and the chest had contributed to discriminate medium level activities, such as walking in a corridor and vacuuming. These findings imply that particular activities are not recognized accurately when the sensor is removed from the contributive position to another. In such a case, by utilizing the positional information, a system can ask a user to keep putting a smartphone into a chest pocket or turn the sensing component off to avoid noisy measurement based on application requirements.
2.3. Reliable Environmental Sensing
Smartphone-based environmental sensing is getting attention due to the popularity of smartphones and the existence of communication infrastructure [8,16], by which dense environmental information is easily collected without deploying a dedicated sensing system from scratch. The storing position of a smartphone is regarded as a key element of reliable measurement in such human-centric sensing, because the measurements are affected by storing positions [16,17,18]. Especially, “outside a container” is important in such a case of noise sensing [9] and humidity/temperature sensing [18]. In [18], a difference in the readings from a relative humidity sensor and a thermometer is observed due to the effect of body heat propagation. Furthermore, the positioning information on the Earth, e.g., latitude, longitude and the orientation, is usually captured by a GPS receiver, magnetometer and gyroscope along with the target sensor measurement. Vaitl et al. [19] and Blum et al. [20] report that even these sensors are affected by the storing position. In these cases, storing positional information can be utilized to build and select models to correct the measurement or notify a user of the state of storing into unintended positions, which is required to offer reliable sensing results.
3. Related Work
On-body position sensing is getting the attention of researchers in machine learning and ubiquitous computing communities [21,22,23], which starts from the work of Kunze et al. [24]. Table 1 summarizes the comparison of the major work on on-body device localization with our work regarding the target positions, sensor types, evaluation method, number of subjects and position recognition accuracy.
The research direction is on the type of device that is actually realized or intended to be utilized in the future as a wearable device [23,24,25] or a smartphone [11,12,13,17,22,26,27,28,29]. The type of device relates to the selection of target positions. In the wearable device approach, the target positions range from the head to the ankle, including fine-grained discrimination, such as upper arm vs. forearm and shin vs. thigh [23]. A device is usually attached firmly using a belt or a special mounting fixture. This indicates that the direction of the device might not change so irregularly within a specific activity in a frequent manner, given that small displacement might occur during activities [30]. By contrast, a smartphone terminal is usually stored into containers, such as the pockets of a jacket, chest and trouser pockets and a wide variety of bags, as well as in a user’s hand, hanging from the neck and on a table, as surveyed in [10,27]. In this case, the degree of freedom of irregular movement in a large container, e.g., jacket pocket or handbag, would increase. In this article, we focus on the smartphone localization in nine storing positions on the body and carrying items, i.e., bags. We equally collect data from four types of bags, which is a unique aspect of our work. In existing work, the type of bag is not clearly defined [27] or limited to a backpack [11] and messenger bag [29]. Therefore, the trained classifier has a bias on the collected types of bags.
Another aspect is the modality of sensing, in which an accelerometer is dominant due to its low power operation and the availability in most commercial smartphones and wearable devices. Shi et al. [22], Alanezi et al. [28] and Incel [29] utilized a gyroscope in combination with an accelerometer, in which the combined approach slightly improved the accuracy [28,29]; however, considering the power-hungry nature of a gyroscope [31], the improvement would not be the reason for utilizing a gyroscope. Harrison and Hudson [13] utilized a multispectral light sensor to discriminate the device position based on light components. Although the recognition system was tested with a wide variety of positions, i.e., 27, from 16 people, the robustness on real-world usage seems to be still an issue. For example, a bag with cellular fabric might pass light inside, which may have similar light components even with active sensing. Active sensing methods were also utilized in [11,12] to regulate the environment that sensors capture. However, as pointed out by Jung and Choi [32], a vibration motor is a relatively high power component in a smartphone. Frequent activation, like a sliding-window approach, is not a practical solution; however, activation on receiving a phone call could work well as intended by Diaconita et al. [11,12]. An advantage of an active sensing approach seems that the classification performance might not be so influenced between individuals, rather by the materials around. We consider that this helps the data collection tasks that need great human, time and monetary resources, although data collection from many variations of material is still required.
In this article, we extend our previous work [26], while utilizing the same dataset, by: (1) introducing the magnitude of three axes of acceleration as an axis for feature calculation (Section 4.4) that is found to be effective; (2) providing an analysis of contributive features from a microscopic point of view (Section 5.3); and (3) discussing the possibility of classifier-tuning based on the analysis of the compatibility of the dataset among people (Section 5.5). Recent work by Incel [29] shows an extensive study on acceleration-based phone localization, which proposes recognition features that represent the movement, rotation and orientation of devices during diverse activities of a person, e.g., walking, sitting, biking. Furthermore, Wiese et al. [27] and Diaconita et al. [12] trained and tested with a dataset from various users’ conditions in addition to walking. By contrast, as outlined in Section 4.3, we primarily recognize the device position when a person is walking based on the thought that walking is the most frequent and consistent activity throughout the day. We have a mechanism of identifying the period of walking using constancy detection, which is intended to be applied before classification. Leave-one-subject-out (LOSO) cross-validation was carried out against an integrated dataset from 35 persons in total in [29]; however, the number of persons varies between positions (35 persons for trouser pocket, 25 for backpack, 15 for hand and 10 for messenger bag, jacket, belt and wrist), and the average number is 15.6. On the other hand, we tested with LOSO-CV with 20 persons who equally provided data from all target positions. By comparing to our previous work [26], the accuracy with the new set of features is much better, by six points, while still lower than the work by Incel [29], although it is hard to compare directly because of the difference in the target position and evaluation method, as well as the number of subjects.
4. On-Body Smartphone Localization Method
In this section, the method of localizing a smartphone on the body is described.
4.1. Target Positions
Nine popular positions shown in Figure 1 are selected as the targets of recognition: (1) around the neck (hanging); (2) chest pocket; (3) jacket pocket (side); (4) front pocket of trousers; (5) back pocket of trousers; (6) backpack; (7) handbag; (8) messenger bag; and (9) shoulder bag. People often carry smartphones in their hands during texting, calling, etc. We consider that such states could be detected by the application logging information of the terminal more precisely. Therefore, we excluded them in this study.
Including a bag as a storing position is technically challenging due to its diverse shape and the carrying style; however, as the survey [10] shows, a bag is a major location for storing a smartphone, especially for women (about 60%), and about 50% of them do not notice incoming calls/messages in their bags, which motivated us to detect a situation of carrying a smartphone in a bag. The four types of bags were specified as popular ones based on our observations on streets in Tokyo. We determined to recognize these types separately, rather than handle them as one single type of “bag”. This is because the movement patterns that we utilize in recognizing a storing position are very different from each other, as shown in Table 2. Therefore, we considered it difficult to find powerful features to describe a general “bag”. Instead, the result of fine-grained recognition can later be merged into one class “bag”.
4.2. Sensor Modality
A three-axis accelerometer is utilized to obtain signals that characterize the movement patterns generated by dedicated storing positions while a person is walking. As surveyed in Section 3, accelerometer-based on-body device localization is popular. By contrast, although Shi et al. showed the effectiveness of a gyroscope in storing position recognition, a gyroscope is a more power hungry sensor than an accelerometer [31] and not popular for low-end terminals; other multi-sensor approaches, e.g., [27], may also encounter similar issues. A vibration motor-based active sensing-based approach, such as [11,12], is not suitable for continuous position sensing due to the power consumption of a vibration motor, although a microphone and an accelerometer are available in today’s smartphones. Typical raw acceleration signals from the target positions are shown in Figure 2. Note that the x-, y- and z-axes of the accelerometer in the terminal (NexusOne) are set to the direction of , and in portrait mode, respectively, as shown in Figure 3.
4.3. Flow of Localization
Figure 4 illustrates the data processing flow from sensor readings to an event of placement change. The localization is carried out window-by-window to recognize the class of a position from the nine candidate positions based on the similarity of the patterns of the acceleration signals. Our approach primarily recognizes the storing position of a device while a person is walking. This is in line with the principles of Vahdatpour et al. [23] and Mannini et al. [25], which are based on the thoughts that walking is the most frequent and consistent activity throughout the day. Nevertheless, non-periodic motions, such as jumping and sitting, can be included in the stream of the acceleration signal. Such states are eliminated based on the constancy of the acceleration signal, as proposed in [33]. The storing position of a previous recognition result is carried over against a window that is judged as “not walking”.
Once a window contains a period of walking, a feature vector is obtained, in which features are calculated against linear acceleration signals. Linear acceleration is obtained by removing gravity components from the measured signals. Sophisticated linear acceleration signal estimation methods have been proposed by combining the gyroscope and magnetometer, e.g., [34]; however, we utilize only the accelerometer for the same reason as the choice of an accelerometer as a modality of storing position recognition. We adopted the method proposed by Cho et al. [35], in which the gravity components are approximately removed from the raw acceleration signals by subtracting the mean of accelerations in a window (Formula (1)), where and indicate the i-th component of a dedicated axis of the linear acceleration signal and the raw acceleration signal, respectively. Furthermore, denotes the mean raw acceleration signals of the x-, y- and z-axes in a window.
A feature vector is then given to a nine-class classifier, which is modeled by a machine-learning technique in advance. Temporal smoothing is carried out to reject a different pulsed output, since an output of the classifier is window based. Here, majority voting is applied among successive outputs. In this way, one position recognition is performed. We have already implemented the entire process on an Android platform and confirmed that the walking detection works pretty well; however, in this article, we focus on recognition features from a microscopic point of view, and the classification against single windows is performed, in which a dataset obtained during walking is utilized in an offline manner.
4.4. Recognition Features
We take the approach of listing candidates of features from the literature and the observation of waveforms (Figure 2), as well as selecting relevant and non-redundant features based on a machine learning technique. In addition to the three axes, i.e., x, y and z, utilized in our previous work [26], we introduce the magnitude of the acceleration signal (m) as the forth dimension (Formula (2)).
We systematically calculate the candidates of features from a window of a four-dimensional vector of linear acceleration signals by the combination of feature types and the axes. In total, 182 features are obtained (38 types × 4 axes for individual axes and 5 types × 6 pairs for correlation-based features). The feature selection is described in Section 5.3.
Table 3 shows the features calculated from the four axes individually. The time domain features, except for the binned distribution, are basic and popular ones in acceleration-based activity recognition. The binned distribution, however, is defined as follows: (1) the range of values for each axis is determined by subtracting the minimum value from the maximum one; (2) the range is equally divided into 10 bins; and (3) the number of values that fell within each of the bins is counted [3].
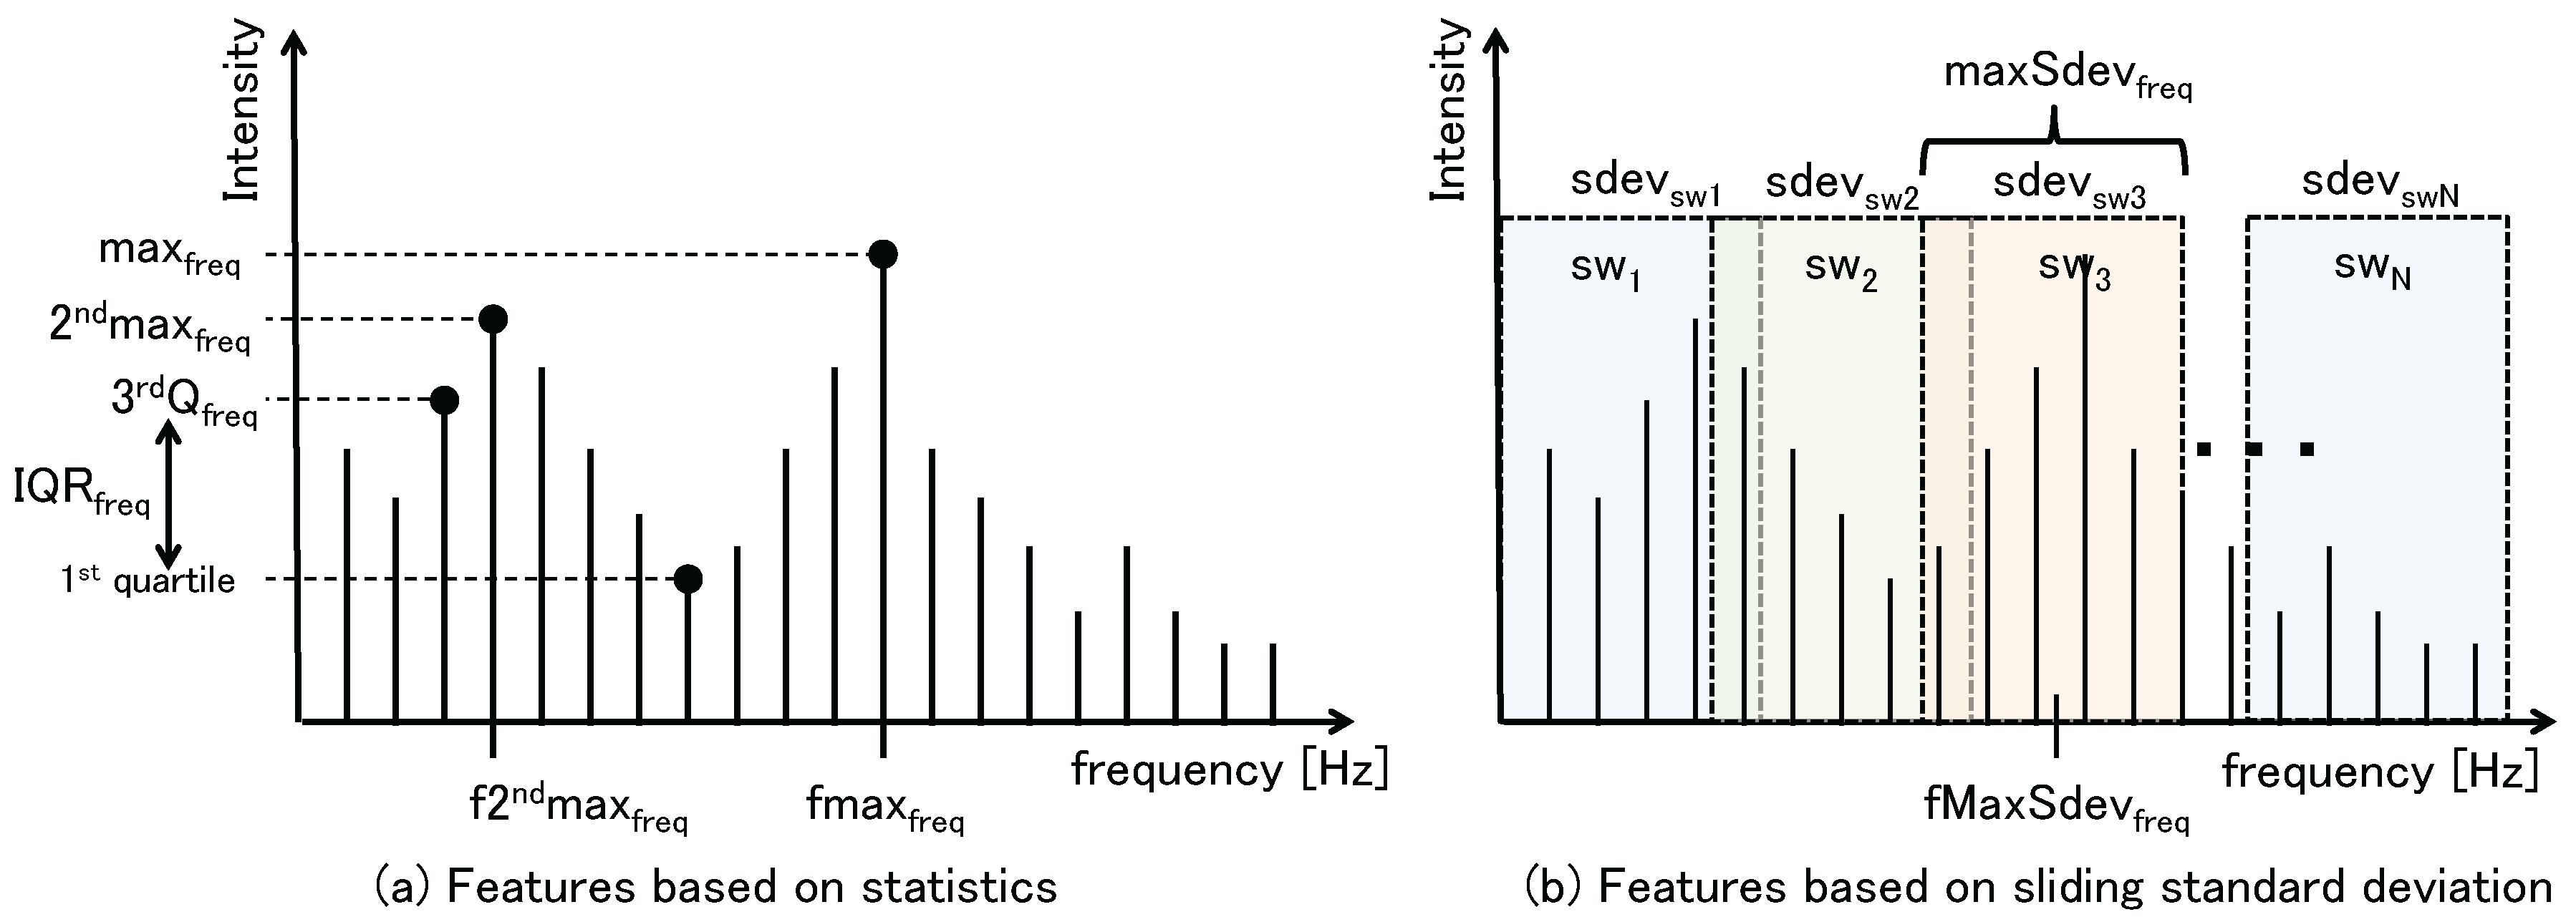
Regarding the frequency domain features, , , , , and are specified to represent the shape of the frequency spectrum, as shown in Figure 5a. The feature is obtained in a way similar to “sliding window average”; a subwindow with a 2.9 Hz range is created in an entire frequency spectrum to calculate the standard deviation (); the subwindow is slid by 0.1 Hz throughout the frequency spectrum; and the maximum is found. is the central frequency of a particular subwindow that gives . An example is shown in Figure 5b, where the third subwindow () gives the largest standard deviation in N-frequency subwindows as , and the central frequency for subwindow corresponds to . The size and sliding width (0.1 Hz) of the subwindow were heuristically determined. A feature calculated as the sum of squared values of frequency components (Formula (3)) is (also know as “Fast Fourier Transform (FFT) energy” in [26]) [14]. The FFT entropy () is then calculated as the normalized information entropy of FFT component values of acceleration signals (Formula (4)), which represents the distribution of frequency components in the frequency domain [14]. Note that the frequency spectrum is equally divided into three “frequency ranges” and assigned subscripts , and , which correspond to 0.0–4.2 Hz, 4.2–8.4 Hz and 8.4–12.5 Hz, respectively. In addition, the subscript indicates the entire frequency range of 0.0–12.5 Hz.
Table 4 shows the features regarding the correlation of two axes, i.e., the correlation coefficient. The correlation coefficient is represented by Formula (5), where s and t represent two axes of time series data in the time domain or those of frequency spectra in the frequency domain, and M indicates the number of samples. We expected that (positively or negatively) high correlation indicates the characteristics of rotation in a particular storing position.
5. Experiment
5.1. Dataset
Unlike in well-established areas, such as machine vision [36] and speech recognition [37], reference dataset, i.e., the corpus, has not yet been recognized in on-body device localization. Combining datasets from different device localization projects is an option to cover a wide variety of storing positions and the diversity of people; however, this approach makes it difficult to separate the dataset for each person and, thus, to carry out LOSO-CV. Furthermore, we could find a very limited number and types of datasets publicly available for device localization [38]. Therefore, we utilized the dataset collected in our previous study [26], which was performed as summarized in Table 5. Twenty graduate/undergraduate students (2 females and 18 males) participated to the experiment, in which they were asked to walk about 5 min (30 s/trial × 10 trials) for each storing position. We asked the participants to walk as usual, so that the data could be collected from a naturalistic condition, and no special instruction about the orientation of the device was given. They wore their own clothes; we only lent them clothes in the case that they did not have clothes with pockets. Regarding bags, we utilized one typical bag for each type of category of bag, and we asked the participants to carry bags as designed; that is, for example, carrying the handbag with one hand, not slinging it over the shoulder like a “shoulder bag”. In total, we obtained about 150,000 samples per position. The applicability to other dataset in terms of different activities and other positions will be examined in Section 5.6 and Section 5.7 using a dataset [38].
5.2. Basic Performance Evaluation
We compared the combinations of the window size and the classifier (classification algorithm), which are important tuning parameters in the recognition task.
5.2.1. Method
Three classes of window size were tested, i.e., 128, 256 and 512, which correspond to 5.12, 10.24 and 20.48 s, respectively. A window is generated by sliding 25 samples (1.00 s) in the data sequences. Regarding the classifier, we utilized five types of classifiers: (1) J48 tree as a decision-tree method; (2) naive Bayes as a Bayesian method; (3) a support vector machine (SVM) classifier; (4) multi-layer perceptron (MLP) as an artificial neural network-based method; and (5) RandomForest as an ensemble learning method. Here, the number of trees in RandomForest was set to 50. Ten-fold cross-validation (10-fold CV) was utilized to understand the basic classification performance, which is often utilized except for the active sensing approach (see Table 1) [13,17,22,23,24,28]. The Weka machine learning toolkit (version 3.6.9, University of Waikato, Hamilton, New Zealand) [39] was utilized, and the specific parameters for classifiers in Weka are summarized in Table 6.
Note that, prior to the evaluation, feature selection was performed to reduce the number of features for high generalization (avoiding overfitting to the training data) and lightweight computation. The number of selected features is 62, 63 and 61 among 182 features for window sizes of 128, 256 and 512, respectively. This means that the feature dimension was reduced to 1/3 of the original feature set. The details of the feature selection are described in Section 5.3.
5.2.2. Results and Analysis
Table 7 summarizes the classification accuracy for each window size and classifier. Here, the classification accuracy is defined by Formula (6). From the table, we can understand that the accuracy basically gets higher as the window size grows and that the SVM and RandomForest classifiers performed the best at high accuracy, i.e., 0.999. By taking into account the ease of parameter tuning and the processing speed, we determine to utilize RandomForest in later experiments. Regarding the window size, it seems that the accuracy of the RandomForest classifier was saturated up to 256. The window size has an impact not only on the computational cost of features, but also on the reactivity to signal changes. That is, the classifier may fail to decide the correct class on a window if a position change is detected in a window; the duration of incorrect classification depends on the size of the window, i.e., the smaller window makes a duration in which the mixed patterns appear shorter. Therefore, we take 256 as the window size for the later experiment, which is 10.24 s.
5.3. Feature Selection
In this section, we describe the method of feature selection, in which the result is focused on the window size of 256.
5.3.1. Method
We utilized a correlation-based feature selection (CFS) [40]. CFS has a heuristic evaluation function merit, which can specify the subset of features that are highly correlated with classes, i.e., more predictive of classes, but uncorrelated with each other, i.e., more concise. As described in Section 4.4, a large number of features were listed up, which may contain redundant features. Therefore, we considered that the capability of CFS was suitable for this problem. The forward selection algorithm was utilized to generate a ranking on feature subsets, which begins with no features and greedily adds features one by one. Note that CFS is a classifier-independent method of feature selection.
In the feature selection process, the window sliding width was set to 64 samples, while the other evaluations (Section 5.2 and Section 5.4) were carried out with the sliding width of 25. This indicates that the evaluations were fairer than an experiment that utilizes the same sliding width as the one at feature selection. This is because the values of calculated features were almost different from each other.
5.3.2. Results and Analysis
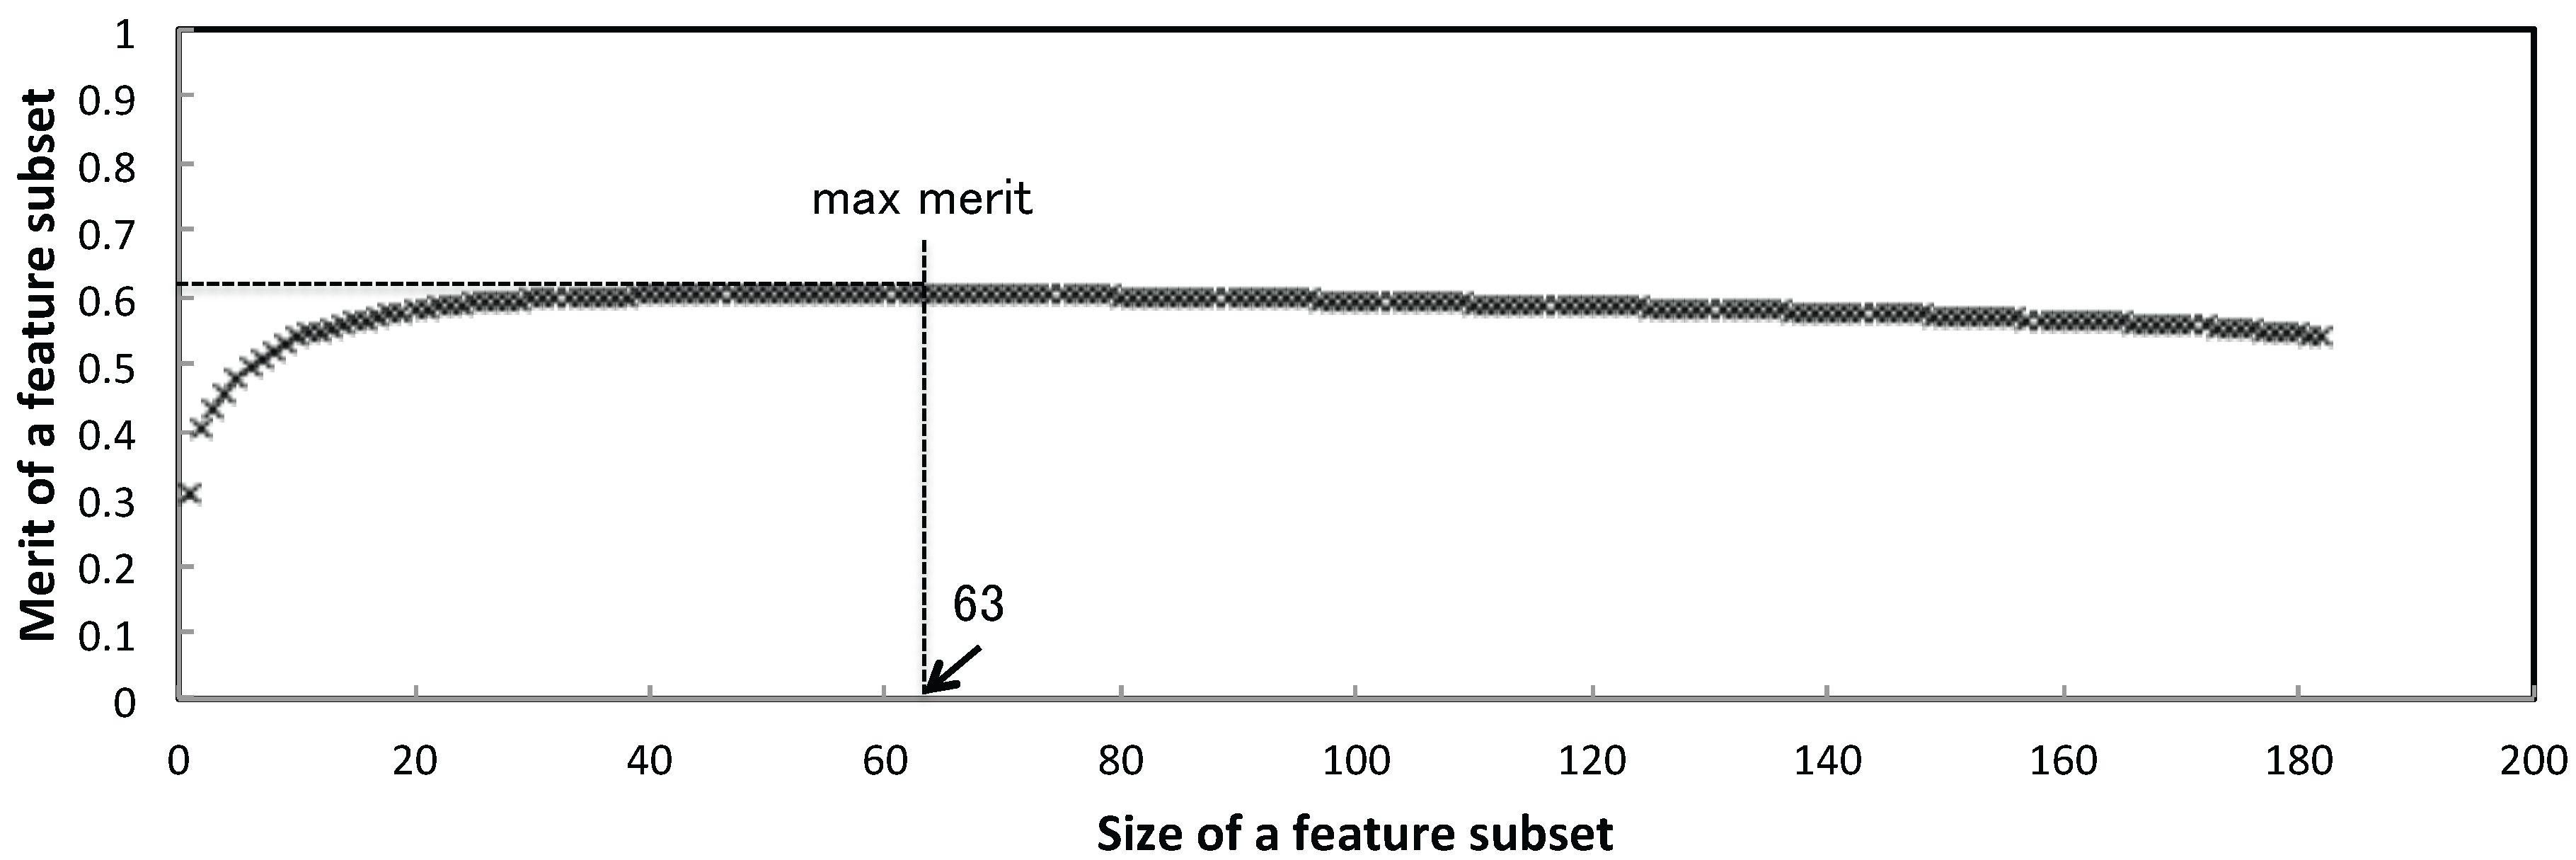
Figure 6 shows the relationship between the size of the feature subset and the merit score of the feature subset. From the figure, three phases in the relationship are found: (1) the quick increase with up to 10 features; (2) the slight increase up to 63 features; and (3) gradual degradation to the end. Therefore, we specified a feature subset with 63 features that provides the highest merit score. Table 8 summarizes the list of selected features, in which rank-N indicates the order of participation in the selected feature subset. Furthermore, to summarize the contribution of categories, such as axis and domain from Table 8, the medians of the rank are shown in Table 9.
With respect an individual axis, the y-axis is most contributive to classification. We consider that this is because a ground reaction force mainly influences the vertical direction, which is the y-axis in the usual cases of neck, chest pocket and trouser pockets. The propagated ground reaction force may have different acceleration patterns in such storing positions.
The correlation-based features () generally performed well, as shown in Table 9, i.e., the rows of the “median of rank” in the upper part (26.5) and the “proportion of definition” in the lower part (more than 0.4). The effectiveness of the correlation between the magnitude of linear acceleration m and the other axes, e.g., , indicates that the force is dominantly given to the axis. A scatter plot in Figure 7a shows the distribution of the value of , in which (1) “neck” and (2) “chest pocket” have a clear negative and/or positive correlation between the y- and m-axes. We consider that this is because a smartphone stored in these positions basically faces toward the front in the portrait orientation and moves up-and-down due to the strong influence of the ground reaction force. By contrast, the high correlation between the x-, y- and z-axes represents rotational motions. For example, the high correlation between the x- and y-axes indicates a motion around the yaw angle when a smartphone is placed in portrait orientation. We consider that such a yaw angle motion might be well observed when a terminal is put in the trouser pocket, because a terminal in portrait orientation swings with the motion of the legs. We also consider that this is a reason why a weak correlation is observed in positions, except for “neck” and “chest pocket”, in Figure 7a. Similarly, there might be a particular linear and rotational motion patterns in each storing position. The effectiveness of rotational elements is consistent with the findings in [29], in which rotational information, i.e., pitch and roll, was calculated per sample, and some features, such as “mean” and “root mean square”, were calculated in a window of such rotational information. In this case, the degree of rotational change is utilized to characterize the storing positions. We consider that our correlation-based features represent the level of dominance of the rotational axis in a window for specific storing positions, which is regarded as another aspect of the classification feature.
Regarding the comparison with the domains, 44 out of 63 features were originated from the frequency domain, which indicates that the features obtained from the frequency domain are contributive. Especially, eight out of the top 10 features are frequency domain-originated ones, as shown in Table 8, in which three “sum of power ()” and two “frequency entropy ()” were ranked within the top 10. As described in Section 4.4, represents the intensity of movement in a certain time window, while is a measure of the frequency distribution of the frequency components. The difference of the ground reaction force propagated through the body and the container of a smartphone might have different intensities. Figure 7b shows the distribution of the value of , where large values can be found in (4) the trouser front pocket and (5) the trouser back pocket. We consider that this is because the ground reaction force is directly transmitted to the trouser pockets. Regarding entropy, Figure 7c is an example (), where the frequency entropy of “neck” is relatively high. This might indicate that the signal obtained from the z-axis at the “neck” contains diverse frequency components with relatively uniform power. As inferred above, the y-axis is the dominant axis at the “neck”, and conversely, the z-axis is subject to disordered force.
5.4. Evaluation with Unknown Subjects
5.4.1. Method
The performance evaluation based on n-fold CV shows an optimistic result because of data from each person are included in the training dataset in theory, and hence, the classifier mostly “knows” about the subjects in advance. To see the capability of the robustness of the recognition system between individuals, we carried out LOSO cross-validation with the same dataset as 10-fold CV. LOSO-CV is carried out by testing a dataset from a particular person with a classifier that is trained without a dataset from the person. The result of the LOSO test can represent the performance in a realistic situation, such that a person purchases an on-body placement-aware functionality from a manufacturer or a third-party, because the data from a particular person are not utilized to train the classifier. Therefore, LOSO-CV is regarded as a fairer and practical test method, which has recently been getting attention [26,27,28,29].
5.4.2. Results and Analysis
Table 10 summarizes the confusion matrix of the average number of classified results per person. Here, recall and precision are defined by Formula (7) and Formula (8), respectively. The average accuracy per person is 0.805 with a maximum of 0.977, a minimum of 0.610 and a median of 0.828. By comparing to the work [26], which does not contain the m-axis and utilized a different classifier, i.e., SVM, the average accuracy was improved by 0.059 (5.9 points in percentage). “Neck” was classified very accurately, while “jacket” was the most difficult case. The shape and the size of jacket pockets are relatively diverse and large. Furthermore, the bottom of a jacket sometimes flaps as a person walks, which makes the movement of a smartphone diverse. We consider that this is a reason why the recall of “jacket” is low, i.e., 0.633. Additionally, the positions on the body are similar to each other in the case of “jacket” and “shoulder bag”, as shown in Figure 1. Such similarity of position might cause the wrong determination of the movement of a smartphone.
Moreover, the table shows two groups of frequent misclassification, i.e., (1) trouser front and back pockets and (2) backpack, handbag, messenger bag and shoulder bag. By taking into the semantic similarity between “trouser front pocket” and “trouser back pocket”, these two classes are merged into a higher level of positional context “trousers (pockets)”. Similarly, the four types of bag are integrated into “bags”. Table 11 shows the confusion matrix by the merge operation, in which the merged rows and columns were averaged. As a result, the accuracy was improved to be 0.859.
Let us analyze the variation of classification performance in individuals. Figure 8 shows the sorted individual accuracy. Based on the fact that the median accuracy of the 9-class classification is larger than the averaged accuracy, we consider that there are some persons whose accuracies are very low. The figure implies that the classification for 6 persons, i.e., Persons J, M, D, T, G and B, degraded the overall accuracy. The common characteristics of these 6 persons are basically consistent with what was described above, i.e., large confusion within “bags” and “trousers”, as well as confusion between “jacket” and “bags”.
5.5. Compatibility Analysis
The compatibility of the classifier among subjects was analyzed.
5.5.1. Method
Classifiers are trained per individuals, and a particular classifier was tested with the datasets from the remaining persons, which was repeated with all persons.
5.5.2. Results and Analysis
Table 12 shows the “compatibility matrix”. The number placed in a cell with row i and column j is the averaged accuracy against the dataset from person j that is tested with a classifier trained with the dataset from person i. For example, the value 0.69 at (A, E) means that the dataset from Person E was classified with an accuracy of 0.69 by a classifier trained by Person A. An exception is the values on the diagonal line, in which training and testing were carried out against the dataset from the same person by 10-fold CV. Therefore, the case is considered to be an ideal case, in which a classifier is personalized for the person. In the table, the values 0.0 and 1.0 are white and black, and the other values ranges are grayscale colors.
The rightmost column is the average of the values on each row, which indicates how well a classifier trained by the dataset from a particular person fits to other persons. Therefore, the value can be referred to as “average fitness”. Here, a classifier by Person A’s dataset is the best fit one, i.e., 0.58 on average, while the average fitness of Person G is the least suitable one (0.35). In training a classifier, reducing the weight on the dataset from persons whose average fitness is low, e.g., Persons C, D and G, would improve LOSO-CV accuracy by a single classifier.
By contrast, the analysis of the averages per column suggests the possibility of selective classifier tuning. The undermost row is the average on each column, which represents the generality of the dataset from a person. The best-classified dataset on average is the one from Person E (0.57), and Person J’s dataset failed to be classified well on average with classifiers by the dataset from others (0.37). The classifiers trained by the datasets from Persons B, I and L did not perform well against the dataset from Person J with an accuracy of 0.18, 0.21 and 0.22, respectively. By contrast, classifiers trained by the datasets from Persons A, N and S classified Person J’s dataset relatively well (0.54, 0.62 and 0.51, respectively). This suggests that the LOSO-CV accuracy might be improved if a classifier can be tuned for a person using datasets from others who have similar characteristics.
5.6. Robustness of Selected Features against New Positions
In Section 5.3, 63 features were selected for what are less redundant and more predictive of 9 classes defined in Section 4.1. In this section, the applicability of the feature set to other storing positions is examined.
5.6.1. Method
A dataset collected in [38] was utilized. The dataset was collected from four positions of 10 people, i.e., “trouser front pocket”, “wrist”, “upper arm and belt”, using a Samsung Galaxy SII smartphone during seven activities of “walking”, “jogging”, “biking”, “upstairs”, “downstairs”, “standing” and “sitting”, among which, we picked the data from “wrist”, “upper arm” and “belt” during walking. Therefore, the classification targets increased to 12 positions. The data were down-sampled by 1/2, so that the sampling rate could be consistent with ours, i.e., 25 Hz, since the data were sampled at 50 Hz. The data were then merged into our original dataset, and a 10-fold CV using a RandomForest classifier was carried out.
5.6.2. Results and Analysis
The F-measure of the 10-fold CV of 12-class classification was proven to be at the same level of that of the 9-class classification, i.e., 0.999 (see Table 7 for the 9-class classification). Notably, the F-measures for the added classes were 1.00. We consider that “wrist” and “upper arm” had quite different movements from other positions, as pointed out by Incel [29]. Regarding the position of “belt”, we consider that a device on a belt should have a certain degree of uniqueness, because it is fixed, i.e., not stored in a free-moving position, such as a jacket pocket and a backpack, and placed between the lower and upper body.
5.7. Storing Position Recognition during Periodic Motions other Than Walking
In this article, we focused on the recognition of the storing position of a device during walking based on the thought that walking is the most frequent and consistent activity throughout a day. As described in Section 4.3, a preprocessing was employed to pass through a segment of periodic motion that we regard as a walking period. However, due to the characteristics of the algorithm, other periodic motions, such as “jogging” and “biking”, could still be passed through. To understand the robustness of the recognition against such accidental cases, a small-scale experiment was carried out.
5.7.1. Method
A classifier was trained by our original dataset (see Section 5.1) with the selected 63 features, which was obtained from 20 people during walking. As a dataset for testing during other activities, the dataset collected in [38] was again utilized. We removed “standing” and “sitting” because these two non-periodic activities can be easily filtered out at the preprocessing based on constancy detection. In addition, although the dataset were collected from four positions, i.e., “trouser front pocket”, “upper arm”, “wrist” and “belt”, we only utilized “trouser front pocket”, because it was included in the original dataset. Classification was carried out per person, and the recalls (Formula (7)) were averaged.
5.7.2. Results and Analysis
Table 13 summarizes the recalls for “trouser front pocket” and the names of the most confused classes with their recalls.
A window obtained from “trouser front pocket” during biking was misrecognized as “jacket” with a recall of 0.321. We consider that this is because the jacket hem in which the device is stored touches the thigh during biking and that this made the movement of the device in the trouser front pocket similar to that of the jacket. Regarding stepping up and down activities, “downstairs” was pretty low with a recall of 0.150, while that of “upstairs” was relatively high with a recall of 0.815. We consider that the difference comes from the impact with the ground. The motion of stepping down looks relatively different from walking compared to stepping up due to the strong downward force, which might have made the recognition difficult.
6. Discussions
6.1. Improving the Recognition Performance against an Unknown Person
The compatibility matrix presented in Section 5.5 suggests that the LOSO-CV accuracy might be improved if a classifier can be tuned for a person using datasets from others who have similar characteristics. The selection needs not to be person based. Instead, tuning a classifier based on the selection of an appropriate subset from all data might work better. In either case, the dataset for tuning a classifier needs to be identified when a person starts utilizing the system for the first time, which is a challenging issue, because no label to a class, i.e., storing position, is given for the first time usage. We will examine the possibility of identifying an appropriate dataset based on the position-independent variables, such as walking frequency.
6.2. Storing Position Recognition during Various Activities
As described in Section 4.3, when non-periodic motions, such as “standing” and “sitting”, are detected, a previous decision during a periodic motion is carried over. Therefore, an issue to be considered is the occurrence of periodic motions other than the original “walking”, although we take a stance that walking is the most frequent and consistent activity throughout the day. In Section 5.7, the data labeled as “trouser front pocket” were utilized to evaluate if they are correctly recognized during various periodic motions. The result showed that “biking” and “stepping down stairs” were difficult to handle when a device is put into the trouser front pocket.
The functionality of filtering out the period of biking activity needs to be investigated by paying attention to the key difference between a biking activity and the other “walking”-related activities. We consider that the key difference is the existence of the influence of the ground reaction force. Once the period of biking activity is identified, it can be handled in the same way as other non-periodic motions, i.e., carrying over the previous decision. Note that, we can ignore the case with upper body positions, because a device stored in a chest pocket, for example, moves less periodically than in a trouser pocket, which is easily filtered out by the current preprocessing.
Regarding stepping up and down activities, especially in the case of “downstairs”, the difference in acceleration from “walking” might not be so large as in “biking”. Therefore, it might be difficult to filter out; however, a workaround is to apply temporal smoothing from the long-term point of view, because the stepping up and down activities keep up for a couple of minutes at most.
6.3. Valid Applications with the Current Recognition Performance
The importance of on-body position recognition is described in Section 2. As shown in Table 11, “neck” and “trouser pockets” were classified very well, which is suitable for a class of applications that monitor environmental conditions, such as temperature and humidity. The measurement from the neck often differs from the trouser pockets due to the effect of body heat and sweat [18]. An application can take an appropriate action, e.g., correction to the value assumed to be measured outside and alerting a user, when a monitoring device (smartphone) is inside a trouser pocket. Furthermore, a placement-aware audio volume adaptation would work well.
Moreover, the high precision for “neck” allows a sensor placement-aware activity recognition to recognize activities related to the upper part of the body, e.g., brushing teeth [4]. A position-specific activity recognizer might be chosen in the case that the position recognition result is reliable, i.e., a position with high precision, such as the “neck”; by contrast, a common recognizer can be utilized against positions with low precision, such as “jacket” and “bag”, in order to avoid significant degradation of the recognition due to the wrong choice of a recognizer.
7. Conclusions
In this article, we proposed a method of localizing a smartphone on the body. An accelerometer is utilized to recognize the storing position from nine candidate positions based on the similarity of acceleration patterns during walking. We systematically defined 182 features calculated from the axes of an accelerometer, including the magnitude of the x-, y- and z-axes. As a result of correlation-based feature selection, 63 contributive features were selected that are more predictive and less redundant features than the remaining 119 features. Through the analysis of the contribution of each feature, we found that: (1) the features originated from y-axis are the most contributive; (2) the features calculated based on the correlation between two axes generally performed well compared to single-axis-originated ones, and the correlation between the magnitude axis and one of the other three axes is especially powerful; and (3) the features in the frequency domain are more powerful than the ones in the time domain; especially the sum of the power and frequency entropy are powerful. These findings would contribute to defining other features to accomplish the position recognition performance. Furthermore, the selected features were proven to be effective against new activities, i.e., “wrist”, “upper arm” and “belt”, which were not considered during the selection process.
The LOSO-CV evaluation with 20 subjects showed that the accuracy of nine-class classification was 0.801. Meanwhile, the accuracy against merged-class classification was 0.859, in which trouser front and back pockets were integrated into one category of “trouser pocket”, and four types of bags were merged into “bag”. Although a fair comparison among existing work is not practical due to the diversity of the system and environmental parameters, we consider that the accuracy falls into the category of being good. The “compatibility matrix” showed the possibilities of improving LOSO-CV accuracy by selecting an appropriate dataset prior to training a single classifier or customizing a classifier for each unknown user on the fly. In addition, we need to make the system robust against various activities that appear in daily life to improve the accuracy of recognition.
Acknowledgments
This work was supported by Ministry of Education, Culture, Sports, Science and Technology (MEXT) Grants-in-Aid for Scientific Research (A) No. 23240014.
Conflicts of Interest
The author declares no conflict of interest.
References
- Okumura, F.; Kubota, A.; Hatori, Y.; Matsumoto, K.; Hashimoto, M.; Koike, A. A Study on Biometric Authentication based on Arm Sweep Action with Acceleration Sensor. In Proceedings of the International Symposium on Intelligent Signal Processing and Communications (ISPACS ’06), Yonago, Japan, 12–15 December 2006; pp. 219–222.
- Gellersen, H.; Schmidt, A.; Beigl, M. Multi-Sensor Context-Awareness in Mobile Devices and Smart Artifacts. J. Mob. Netw. Appl. 2002, 7, 341–351. [Google Scholar] [CrossRef]
- Kwapisz, J.R.; Weiss, G.M.; Moore, S.A. Activity recognition using cell phone accelerometers. SIGKDD Explor. Newsl. 2011, 12, 74–82. [Google Scholar] [CrossRef]
- Pirttikangas, S.; Fujinami, K.; Nakajima, T. Feature Selection and Activity Recognition from Wearable Sensors. In Proceedings of the International Symposium on Ubiquitous Computing Systems (UCS 2006), Seoul, Korea, 11–13 October 2006; pp. 516–527.
- Blanke, U.; Schiele, B. Sensing Location in the Pocket. In Proceedings of the 10th International Conference on Ubiquitous Computing (Ubicomp 2008), Seoul, Korea, 21–24 September 2008.
- Rai, A.; Chintalapudi, K.K.; Padmanabhan, V.N.; Sen, R. Zee: Zero-effort Crowdsourcing for Indoor Localization. In Proceedings of the 18th Annual International Conference on Mobile Computing and Networking (MobiCom 2012), Istanbul, Turkey, 22–26 August 2012.
- Sugimori, D.; Iwamoto, T.; Matsumoto, M. A Study about Identification of Pedestrian by Using 3-Axis Accelerometer. In Proceedings of the IEEE 17th International Conference on Embedded and Real-Time Computing Systems and Applications (RTCSA), Toyama, Japan, 28–31 August 2011; pp. 134–137.
- Goldman, J.; Shilton, K.; Burke, J.; Estrin, D.; Hansen, M.; Ramanathan, N.; Reddy, S.; Samanta, V.; Srivastava, M.; West, R. Participatory Sensing: A Citizen-Powered Approach to Illuminating the Patterns that Shape Our World. Available online: https://www.wilsoncenter.org/sites/default/files/participatory_sensing.pdf (accessed on 23 March 2016).
- Stevens, M.; D’Hondt, E. Crowdsourcing of Pollution Data using Smartphones. In Proceedings of the 1st Ubiquitous Crowdsourcing Workshop, Copenhagen, Denmark, 26–29 September 2010.
- Cui, Y.; Chipchase, J.; Ichikawa, F. A Cross Culture Study on Phone Carrying and Physical Personalization. In Proceedings of the 12th International Conference on Human-Computer Interaction, Beijing, China, 22–27 July 2007; pp. 483–492.
- Diaconita, I.; Reinhardt, A.; Englert, F.; Christin, D.; Steinmetz, R. Do you hear what I hear? Using acoustic probing to detect smartphone locations. In Proceedings of the IEEE International Conference on Pervasive Computing and Communication Workshops (PerCom Workshops), Budapest, Hungary, 24–28 March 2014; pp. 1–9.
- Diaconita, I.; Reinhardt, A.; Christin, D.; Rensing, C. Inferring Smartphone Positions Based on Collecting the Environment’s Response to Vibration Motor Actuation. In Proceedings of the 11th ACM Symposium on QoS and Security for Wireless and Mobile Networks (Q2SWinet 2015), Cancun, Mexico, 2–6 November 2015.
- Harrison, C.; Hudson, S.E. Lightweight material detection for placement-aware mobile computing. In Proceedings of the 21st annual ACM symposium on User interface software and technology (UIST 2008), Monterey, CA, USA, 19–22 October 2008.
- Bao, L.; Intille, S.S. Activity recognition from user-annotated acceleration data. In Proceedings of the 2nd International Conference on Pervasive Computing (Pervasive 2004), Linz/Vienna, Austria, 18–23 April 2004.
- Atallah, L.; Lo, B.; King, R.; Yang, G.Z. Sensor Placement for Activity Detection Using Wearable Accelerometers. In Proceedings of the 2010 International Conference on Body Sensor Networks (BSN), Singapore, 7–9 June 2010; pp. 24–29.
- Lane, N.D.; Miluzzo, E.; Lu, H.; Peebles, D.; Choudhury, T.; Campbell, A.T. A survey of mobile phone sensing. IEEE Commun. Mag. 2010, 48, 140–150. [Google Scholar] [CrossRef]
- Miluzzo, E.; Papandrea, M.; Lane, N.; Lu, H.; Campbell, A. Pocket, Bag, Hand, etc.-Automatically Detecting Phone Context through Discovery. In Proceedings of First International Workshop on Sensing for App Phones (PhoneSense 2010), Zurich, Switzerland, 2 November 2010.
- Fujinami, K.; Xue, Y.; Murata, S.; Hosokawa, S. A Human-Probe System That Considers On-body Position of a Mobile Phone with Sensors. In Distributed, Ambient, and Pervasive Interactions; Streitz, N., Stephanidis, C., Eds.; Springer: Berlin/Heidelberg, Germany, 2013; Volume 8028, pp. 99–108. [Google Scholar]
- Vaitl, C.; Kunze, K.; Lukowicz, P. Does On-body Location of a GPS Receiver Matter? In International Workshop on Wearable and Implantable Body Sensor Networks (BSN’10); IEEE Computer Society: Los Alamitos, CA, USA, 2010; pp. 219–221. [Google Scholar]
- Blum, J.; Greencorn, D.; Cooperstock, J. Smartphone Sensor Reliability for Augmented Reality Applications. In Mobile and Ubiquitous Systems: Computing, Networking, and Services; Zheng, K., Li, M., Jiang, H., Eds.; Springer: Berlin/Heidelberg, Germany, 2013; Volume 120, pp. 127–138. [Google Scholar]
- Fujinami, K.; Jin, C.; Kouchi, S. Tracking On-body Location of a Mobile Phone. In Proceedings of the 14th Annual IEEE International Symposium on Wearable Computers (ISWC 2010), Orlando, FL, USA, 9–14 July 2010; pp. 190–197.
- Shi, Y.; Shi, Y.; Liu, J. A rotation based method for detecting on-body positions of mobile devices. In Proceedings of the 13th International Conference on Ubiquitous Computing, ACM (UbiComp ’11), Beijing, China, 17–21 September 2011; pp. 559–560.
- Vahdatpour, A.; Amini, N.; Sarrafzadeh, M. On-body device localization for health and medical monitoring applications. In Proceedings of the 2011 IEEE International Conference on Pervasive Computing and Communications, Seattle, WA, USA, 21–25 March 2011; pp. 37–44.
- Kunze, K.; Lukowicz, P.; Junker, H.; Tröster, G. Where am I: Recognizing On-body Positions of Wearable Sensors. In Proceedings of International Workshop on Location- and Context-Awareness (LoCA 2005), Oberpfaffenhofen, Germany, 12–13 May 2005; pp. 264–275.
- Mannini, A.; Sabatini, A.M.; Intille, S.S. Accelerometry-based recognition of the placement sites of a wearable sensor. Perv. Mob. Comput. 2015, 21, 62–74. [Google Scholar] [CrossRef] [PubMed]
- Fujinami, K.; Kouchi, S. Recognizing a Mobile Phone’s Storing Position as a Context of a Device and a User. In Mobile and Ubiquitous Systems: Computing, Networking, and Services; Zheng, K., Li, M., Jiang, H., Eds.; Springer: Berlin/Heidelberg, Germany, 2013; Volume 120, pp. 76–88. [Google Scholar]
- Wiese, J.; Saponas, T.S.; Brush, A.B. Phoneprioception: Enabling Mobile Phones to Infer Where They Are Kept. In Proceedings of the SIGCHI Conference on Human Factors in Computing Systems (CHI ’13), Paris, France, 27 April–2 May 2013.
- Alanezi, K.; Mishra, S. Design, implementation and evaluation of a smartphone position discovery service for accurate context sensing. Comput. Electr. Eng. 2015, 44, 307–323. [Google Scholar] [CrossRef]
- Incel, O.D. Analysis of Movement, Orientation and Rotation-Based Sensing for Phone Placement Recognition. Sensors 2015, 15, 25474–25506. [Google Scholar] [CrossRef] [PubMed]
- Kunze, K.; Lukowicz, P. Dealing with Sensor Displacement in Motion-based Onbody Activity Recognition Systems. In Proceedings of the 10th International Conference on Ubiquitous Computing (UbiComp ’08), Seoul, Korea, 21–24 September 2008.
- Zhang, L.; Pathak, P.H.; Wu, M.; Zhao, Y.; Mohapatra, P. AccelWord: Energy Efficient Hotword Detection Through Accelerometer. In Proceedings of the 13th Annual International Conference on Mobile Systems, Applications, and Services (MobiSys’15), Florence, Italy, 19–22 May 2015.
- Jung, J.; Choi, S. Perceived Magnitude and Power Consumption of Vibration Feedback in Mobile Devices. In Human-Computer Interaction. Interaction Platforms and Techniques; Jacko, J., Ed.; Springer: Berlin/Heidelberg, Germany, 2007; Volume 4551, pp. 354–363. [Google Scholar]
- Murao, K.; Terada, T. A motion recognition method by constancy-decision. In Proceedings of the 14th International Symposium on Wearable Computers (ISWC 2010), Seoul, Korea, 10–13 October 2010; pp. 69–72.
- Hemminki, S.; Nurmi, P.; Tarkoma, S. Gravity and Linear Acceleration Estimation on Mobile Devices. In Proceedings of the 11th International Conference on Mobile and Ubiquitous Systems: Computing, Networking and Services (MobiQuitous 2014), London, UK, 2–5 December 2014; pp. 50–59.
- Cho, S.J.; Choi, E.; Bang, W.C.; Yang, J.; Sohn, J.; Kim, D.Y.; Lee, Y.B.; Kim, S. Two-stage Recognition of Raw Acceleration Signals for 3-D Gesture-Understanding Cell Phones. In Proceedings of the Tenth International Workshop on Frontiers in Handwriting Recognition, La Baule, France, 23–26 October 2006.
- Li, F.-F.; Fergus, R.; Perona, P. One-shot learning of object categories. IEEE Trans. Pattern Anal. Mach. Intell. 2006, 28, 594–611. [Google Scholar]
- Paul, D.B.; Baker, J.M. The Design for the Wall Street Journal-based CSR Corpus. In Proceedings of the Workshop on Speech and Natural Language, Pacific Grove, CA, USA, 19–22 February 1991; pp. 357–362.
- Shoaib, M.; Bosch, S.; Incel, O.D.; Scholten, H.; Havinga, P.J.M. Fusion of Smartphone Motion Sensors for Physical Activity Recognition. Sensors 2014, 14, 10146–10176. [Google Scholar] [CrossRef] [PubMed]
- Weka 3—Data Mining with Open Source Machine Learning Software in Java; Machine Learning Group at University of Waikato: Hamilton, New Zealand. Available online: http://www.cs.waikato.ac.nz/ml/weka/ (accessed on 15 March 2016).
- Hall, M.A. Correlation-Based Feature Selection for Machine Learning. Ph.D. Thesis, The University of Waikato, Hamilton, New Zealand, 1999. [Google Scholar]
Figure 1.
Target storing positions.
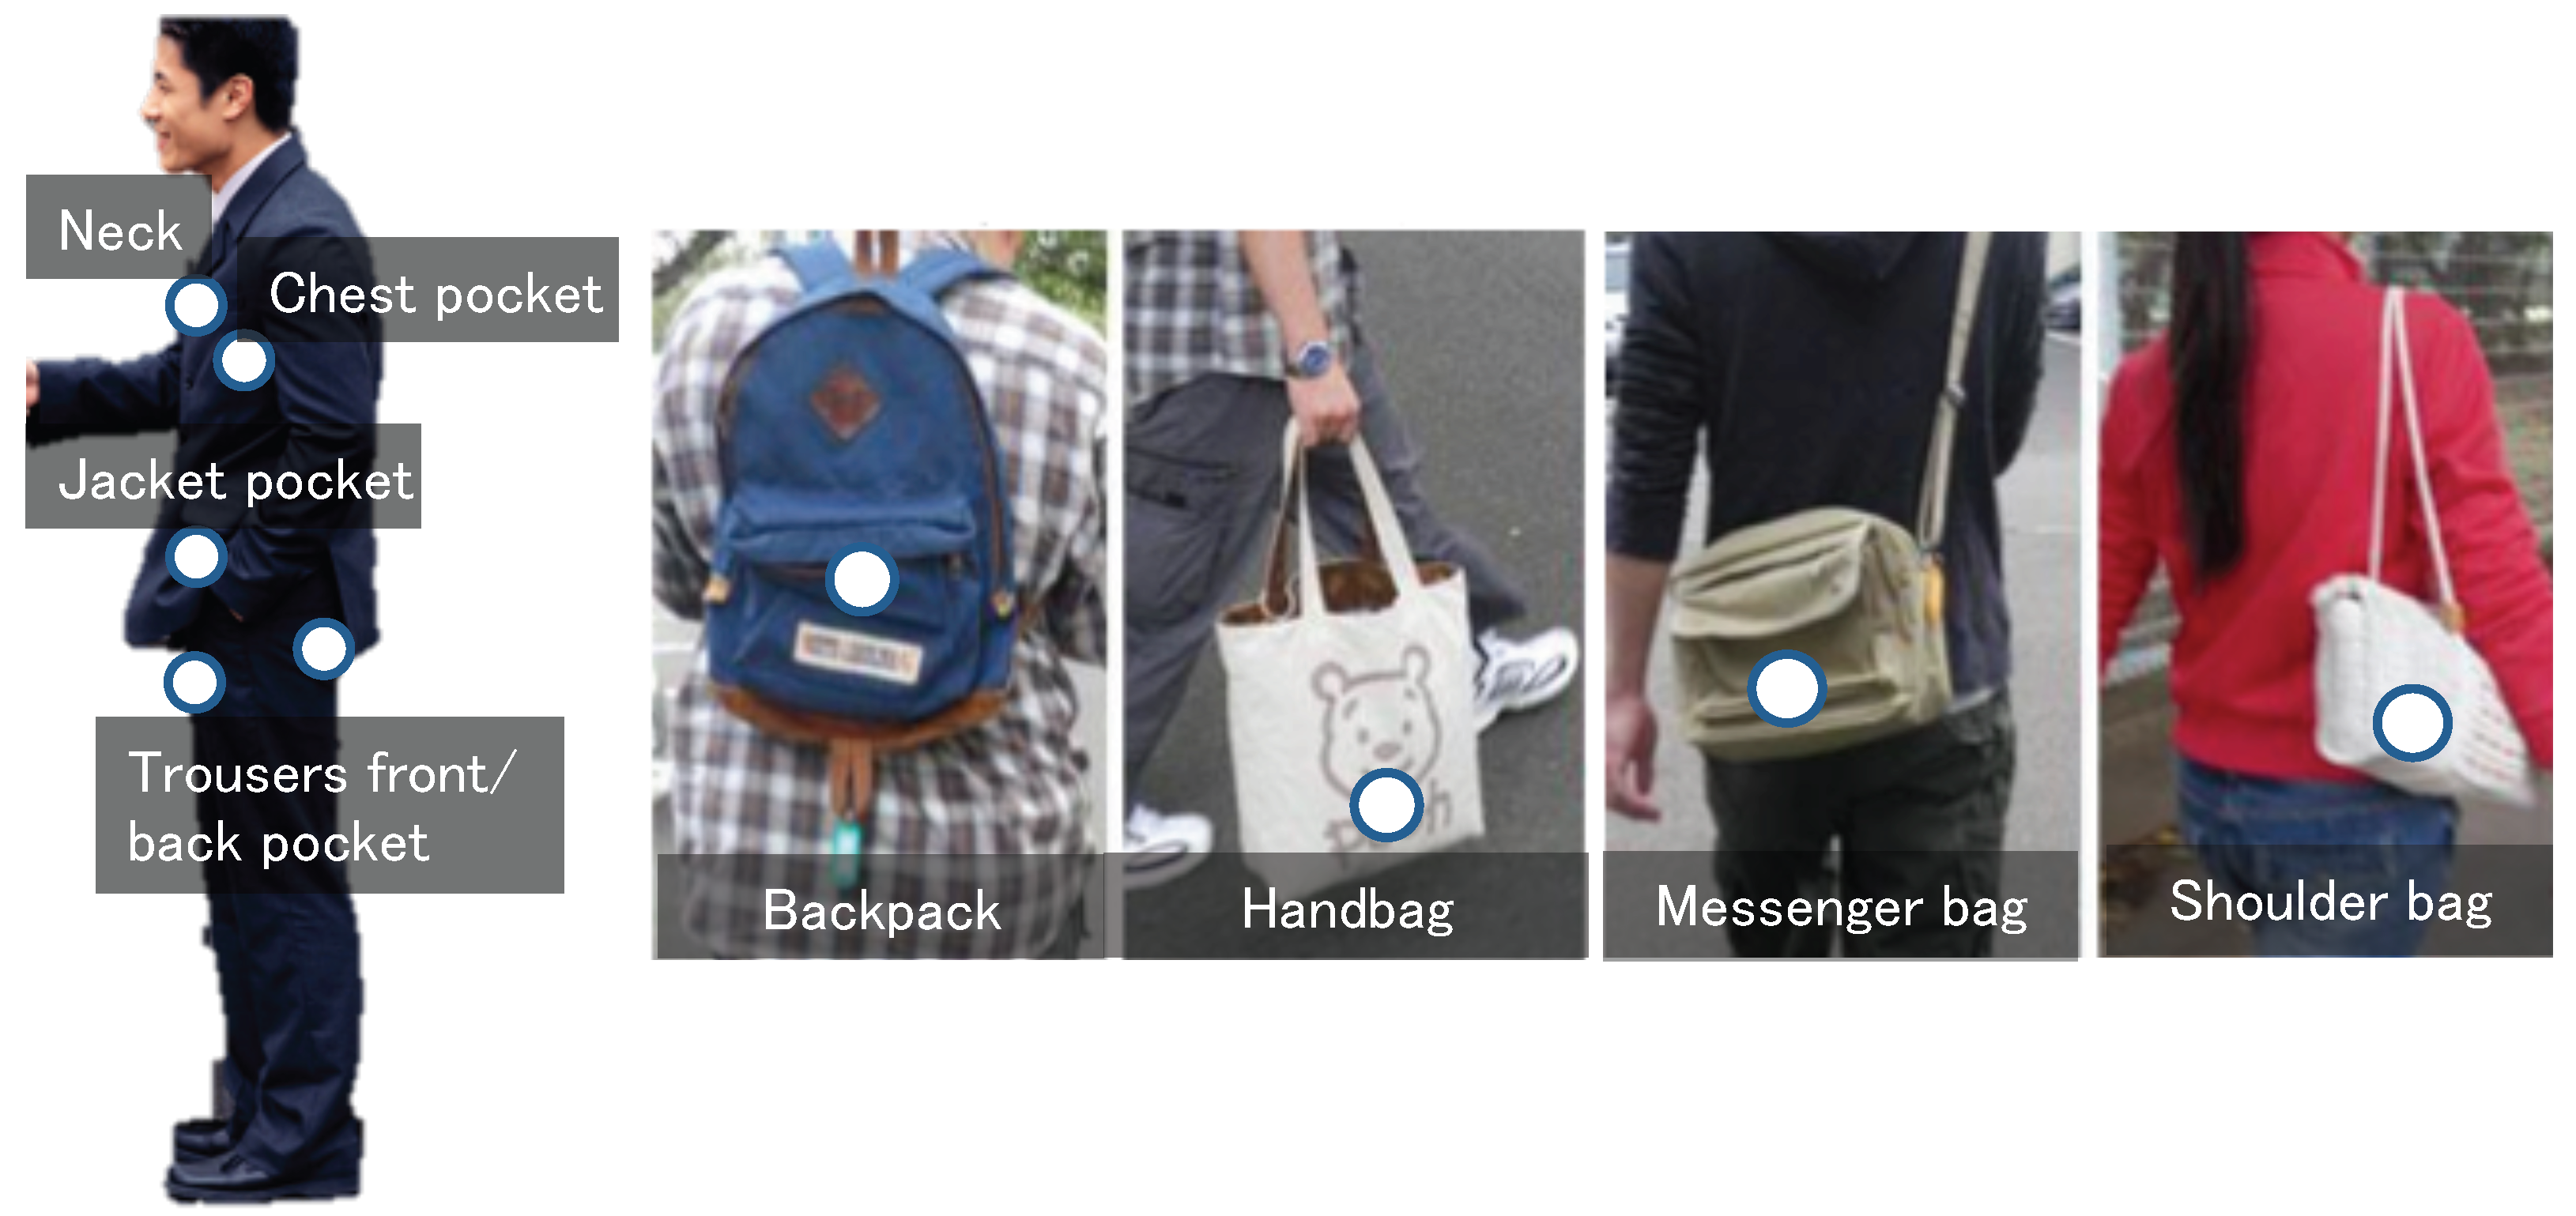
Figure 2.
Raw acceleration signals from the nine target positions of a person during walking.
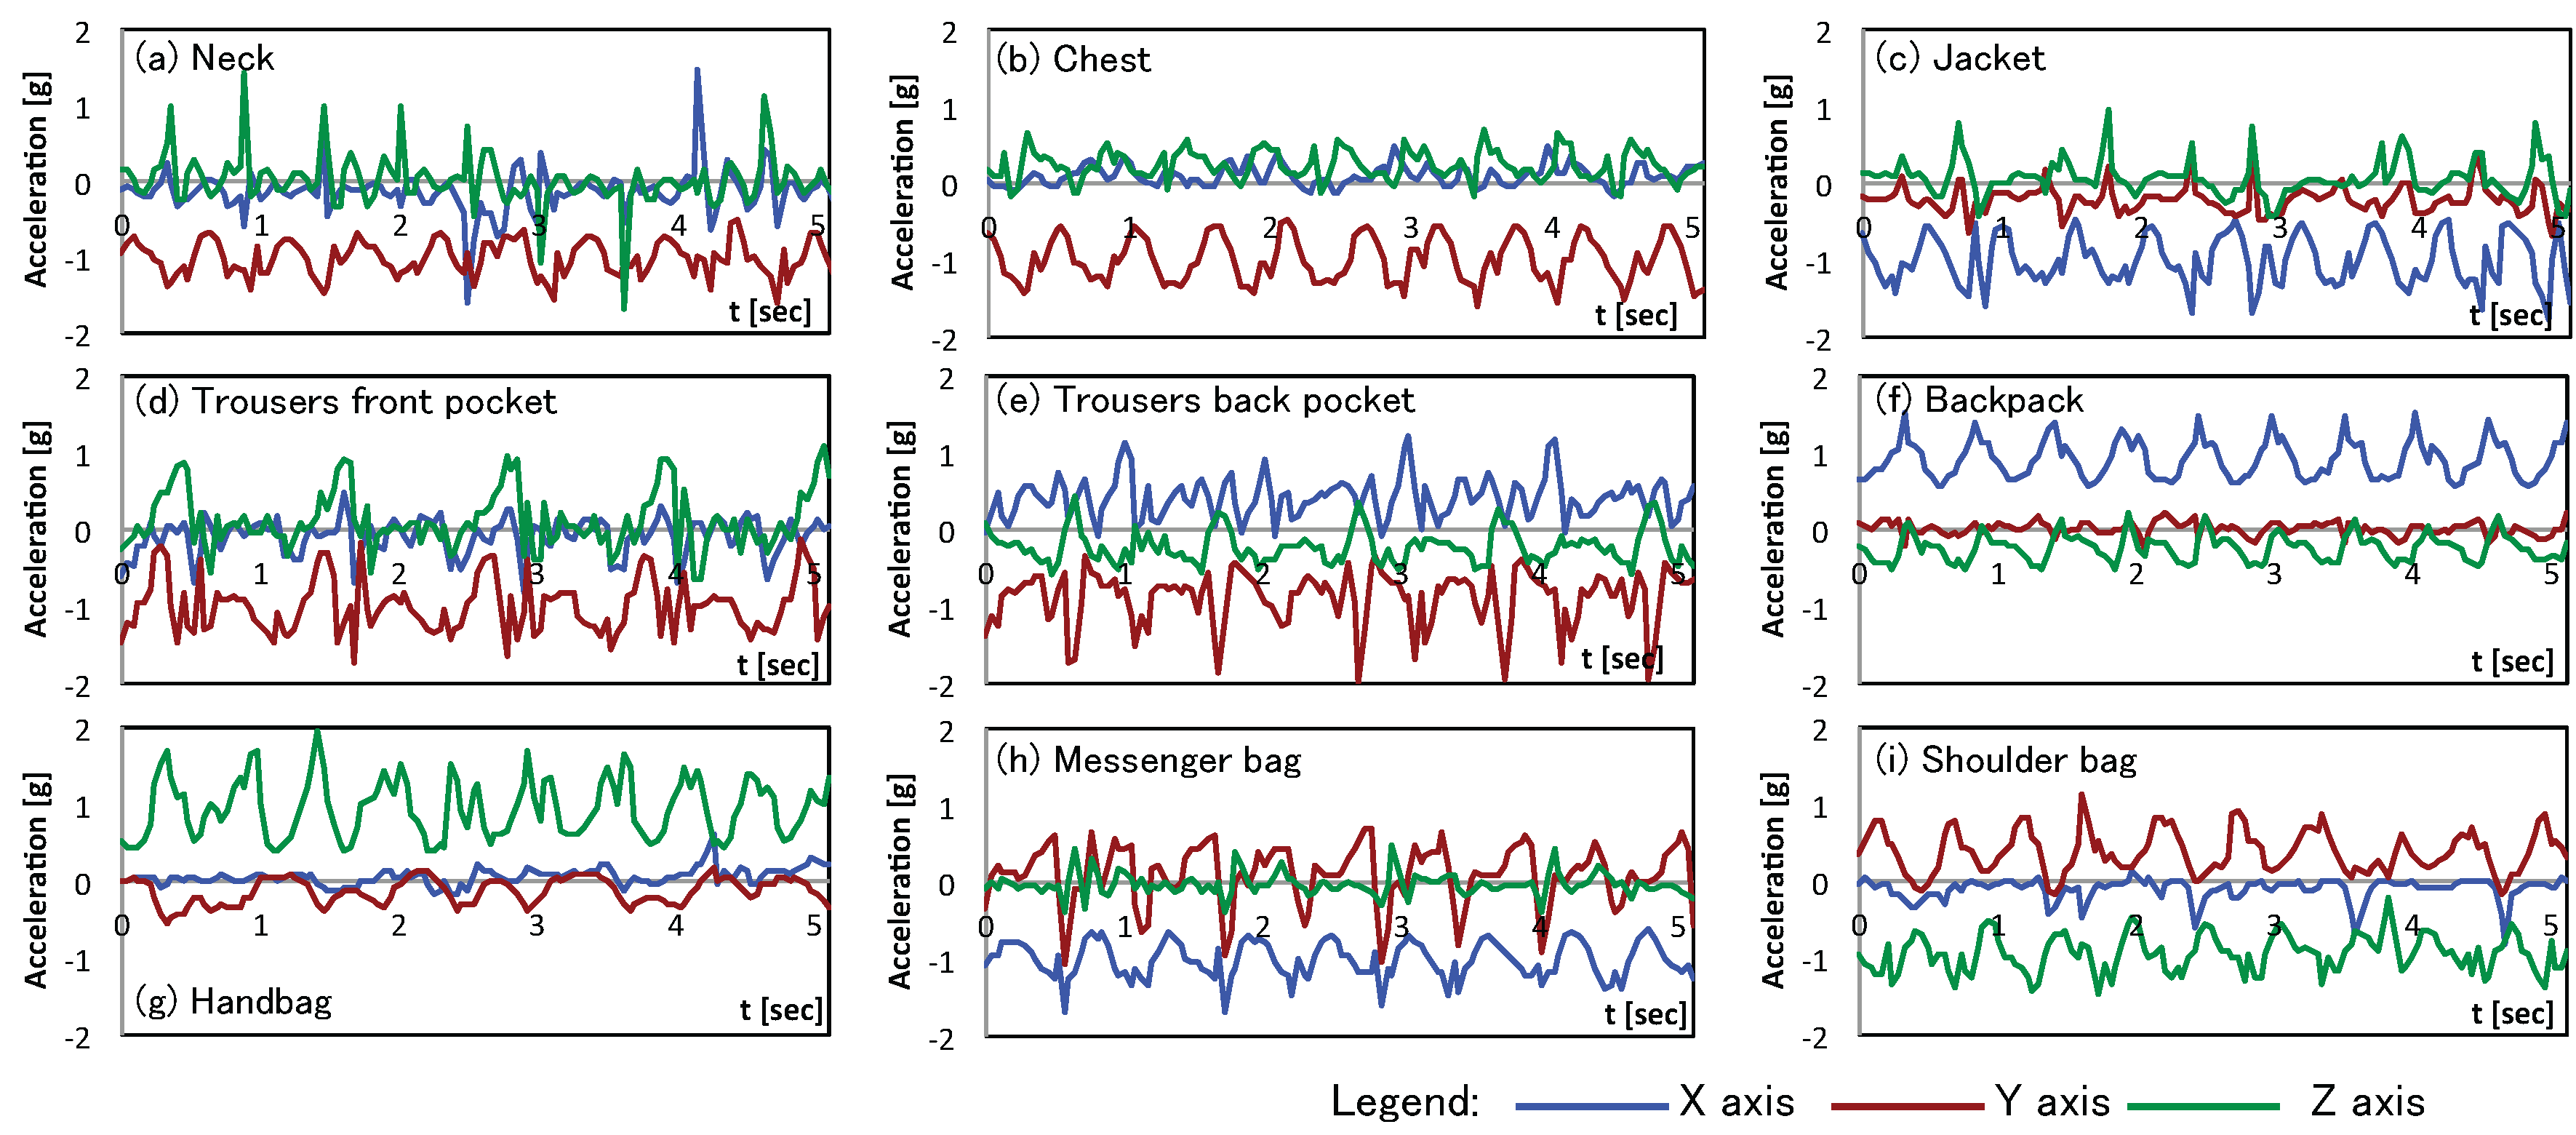
Figure 3.
The definition of the axes of an accelerometer in an Android smartphone.

Figure 4.
Localization process: the components with a dotted-line have been implemented, but are not the focus of this article.
Figure 4.
Localization process: the components with a dotted-line have been implemented, but are not the focus of this article.
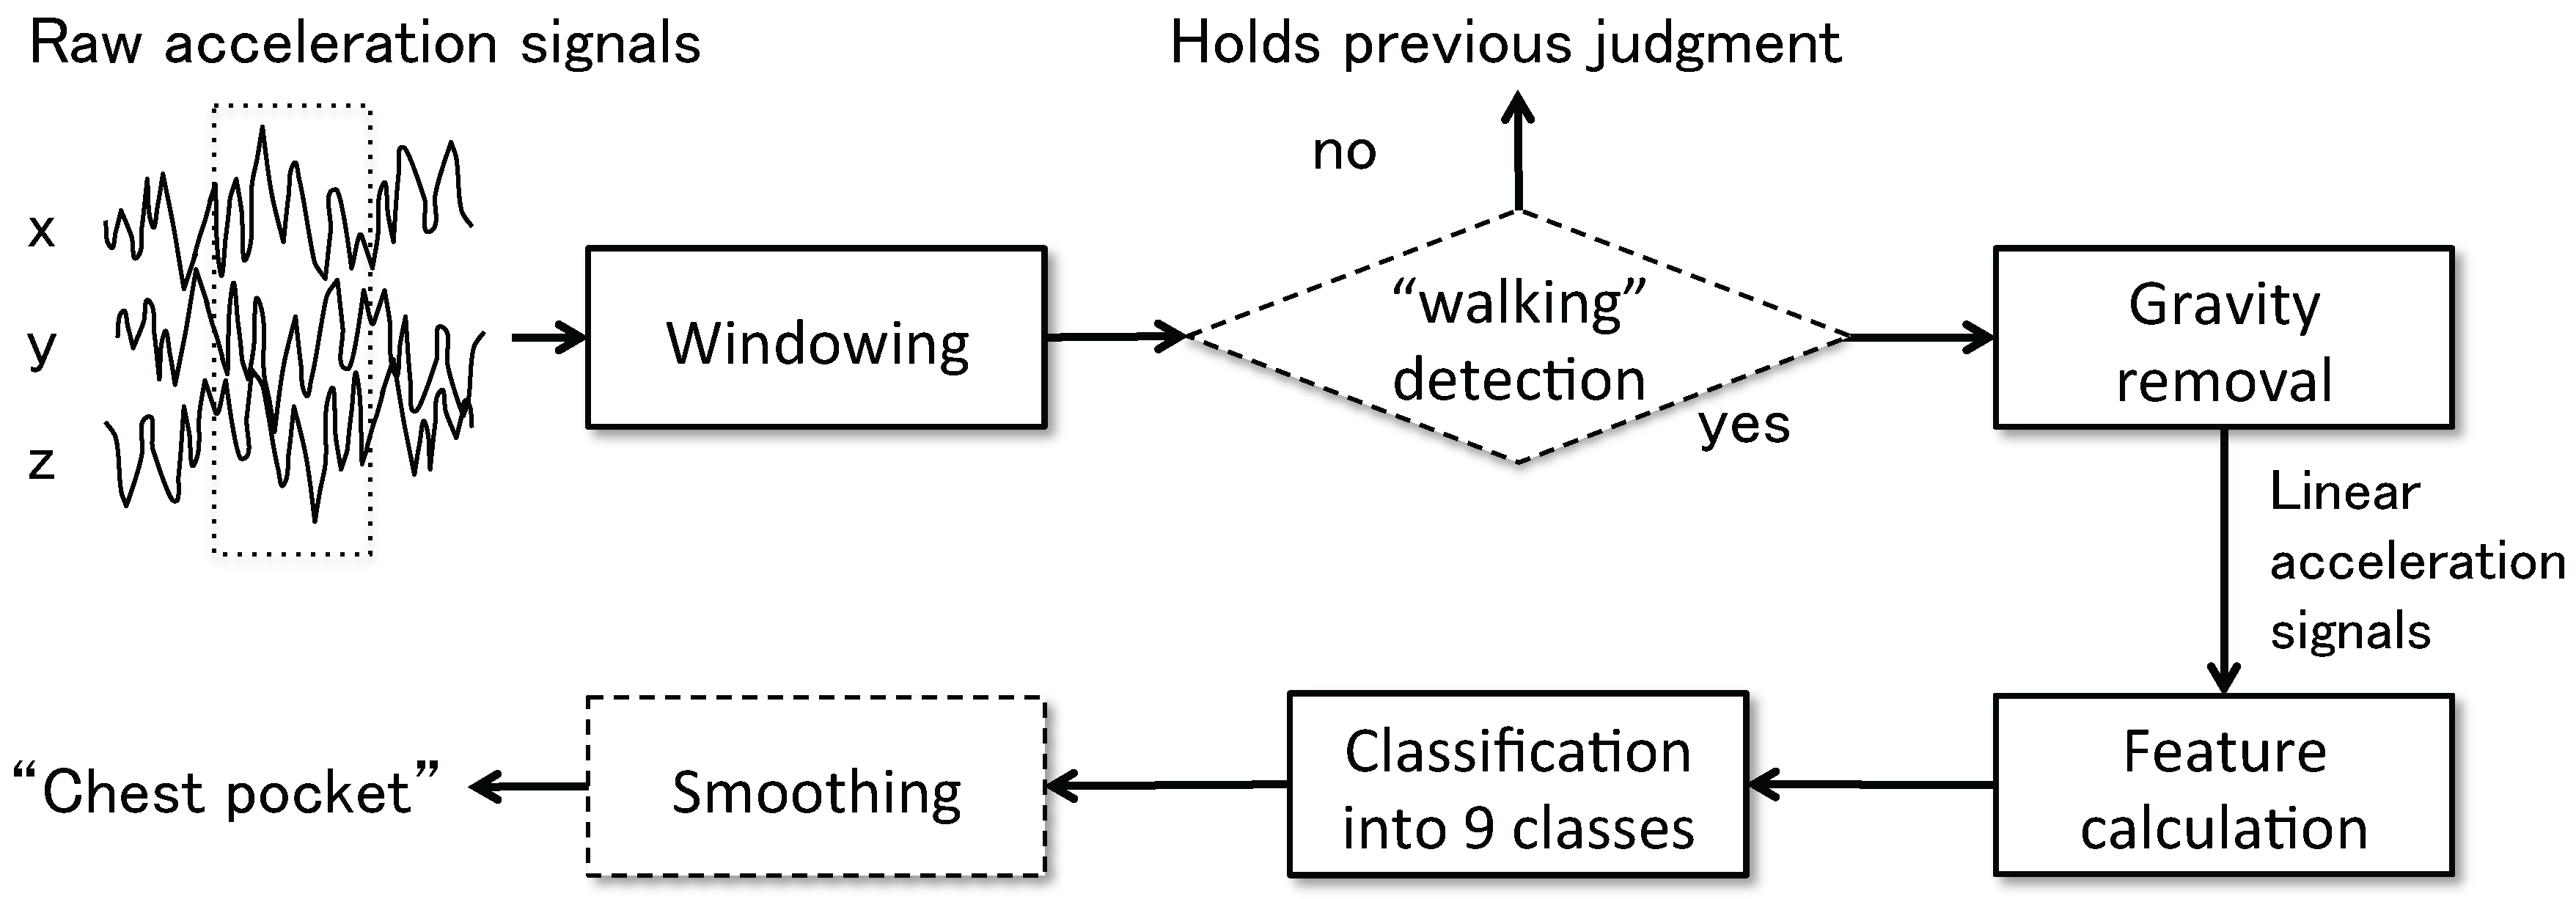
Figure 5.
Features obtained in the frequency domain.

Figure 6.
The relationship between the size of the feature subset and the merit score (window size: 256).
Figure 6.
The relationship between the size of the feature subset and the merit score (window size: 256).

Figure 7.
Scatter plot of the distribution of features by target positions. The thick and dark portion indicates dense plots.
Figure 7.
Scatter plot of the distribution of features by target positions. The thick and dark portion indicates dense plots.
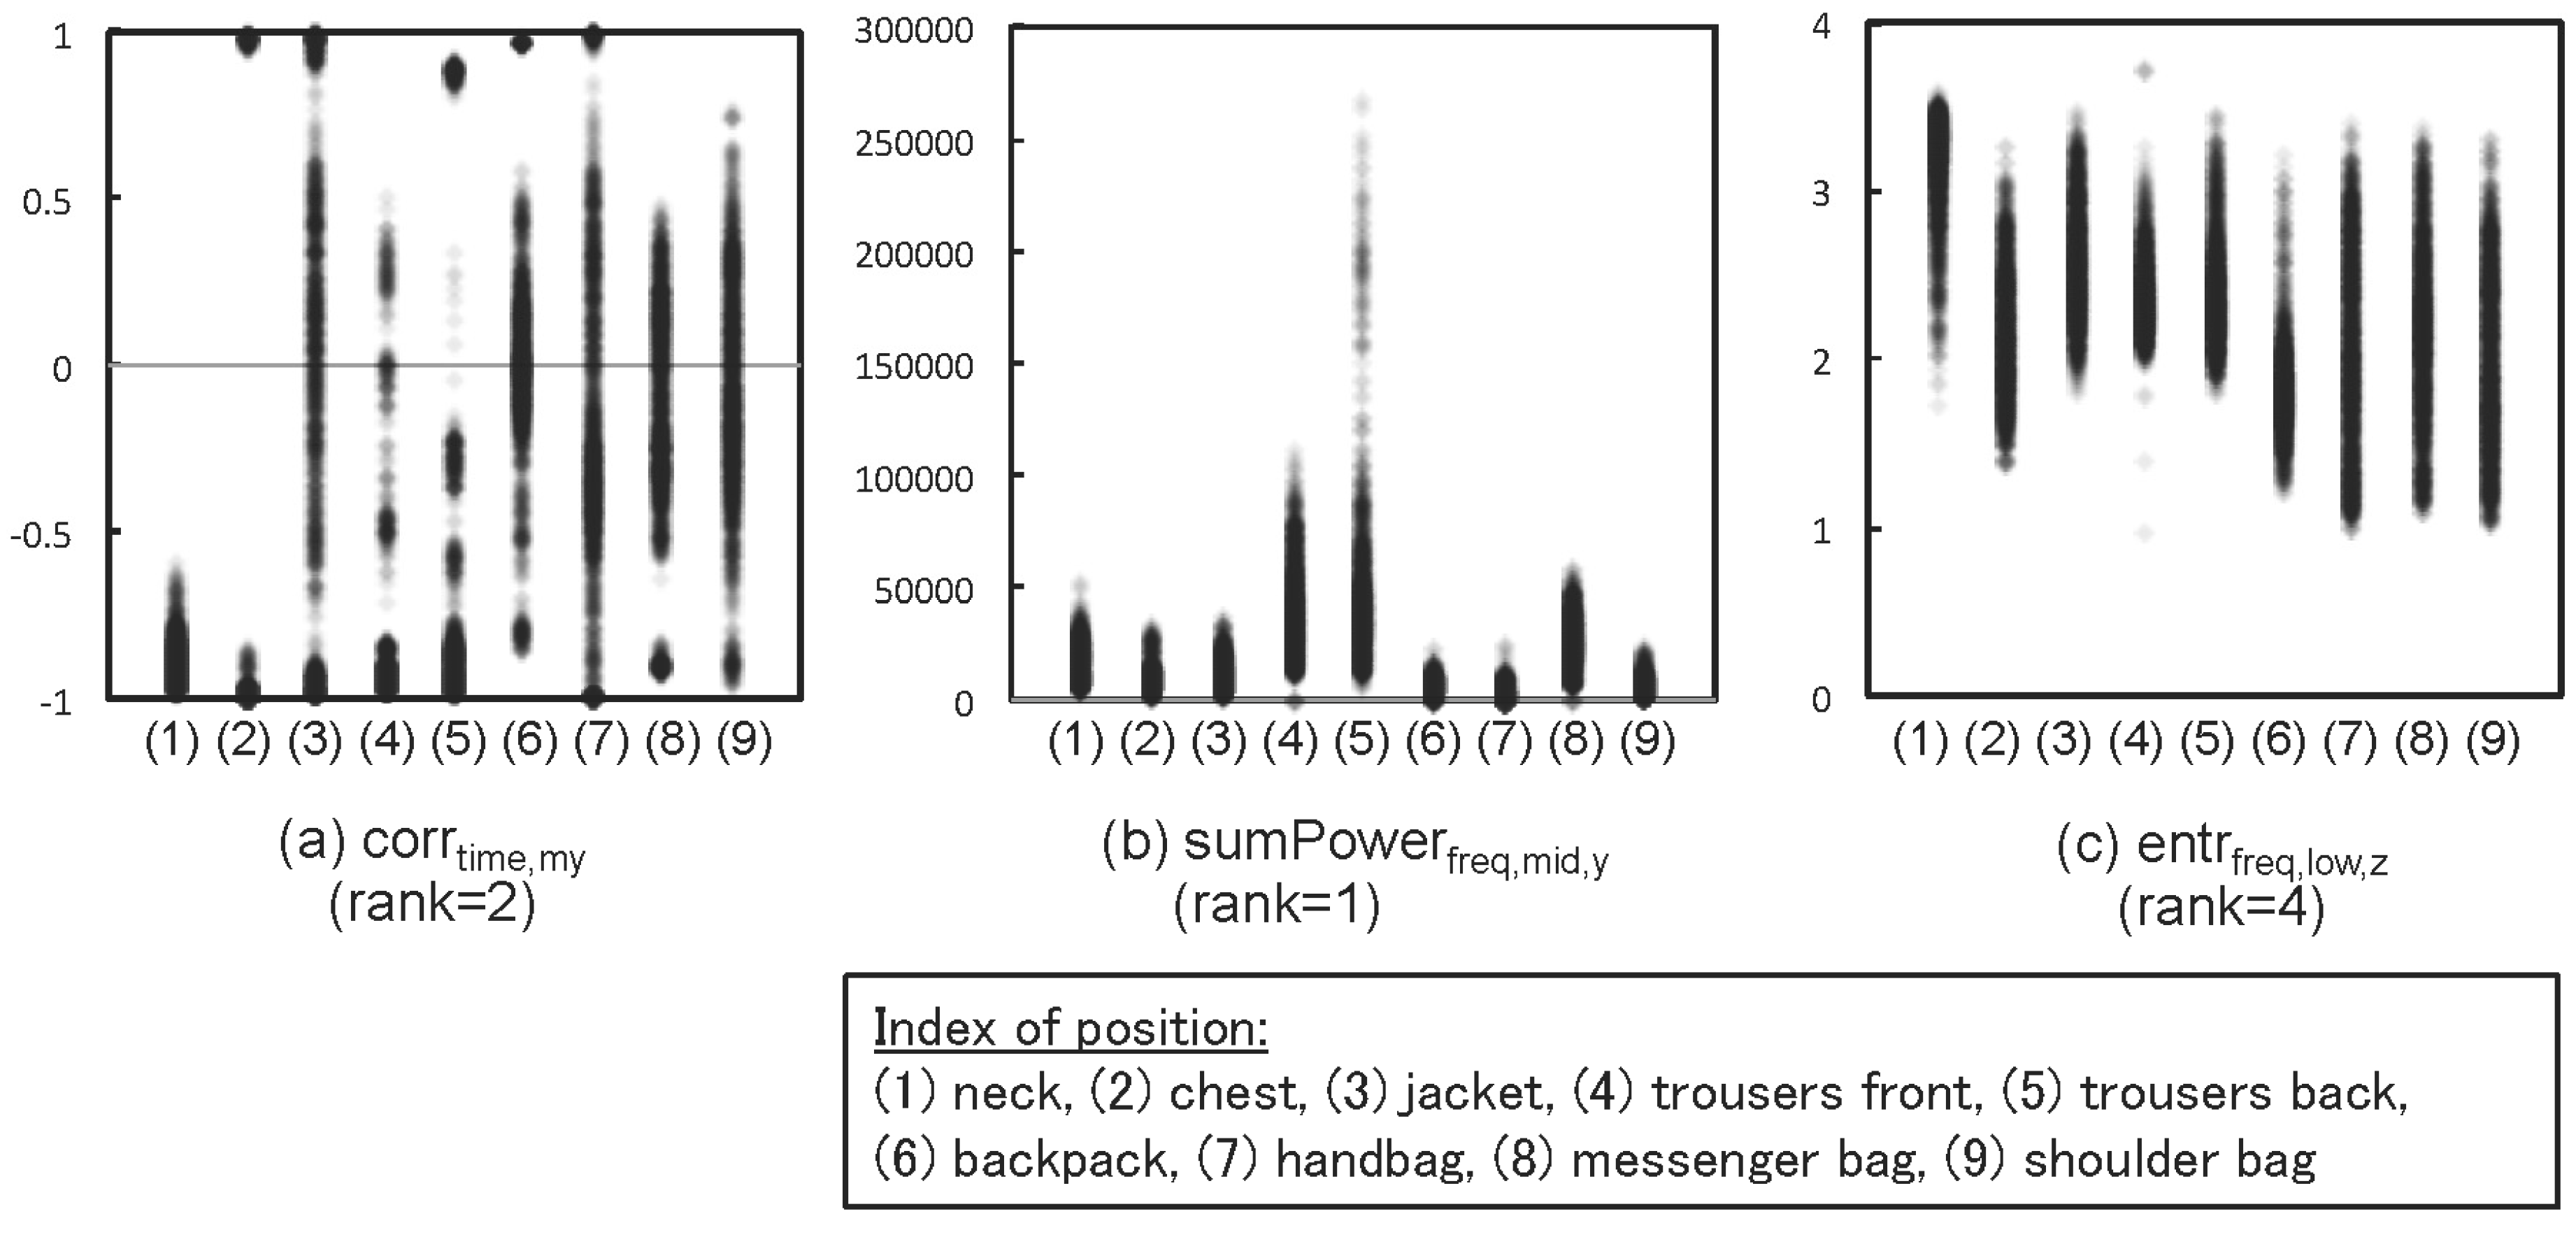
Figure 8.
Classification accuracy per person sorted by the value.
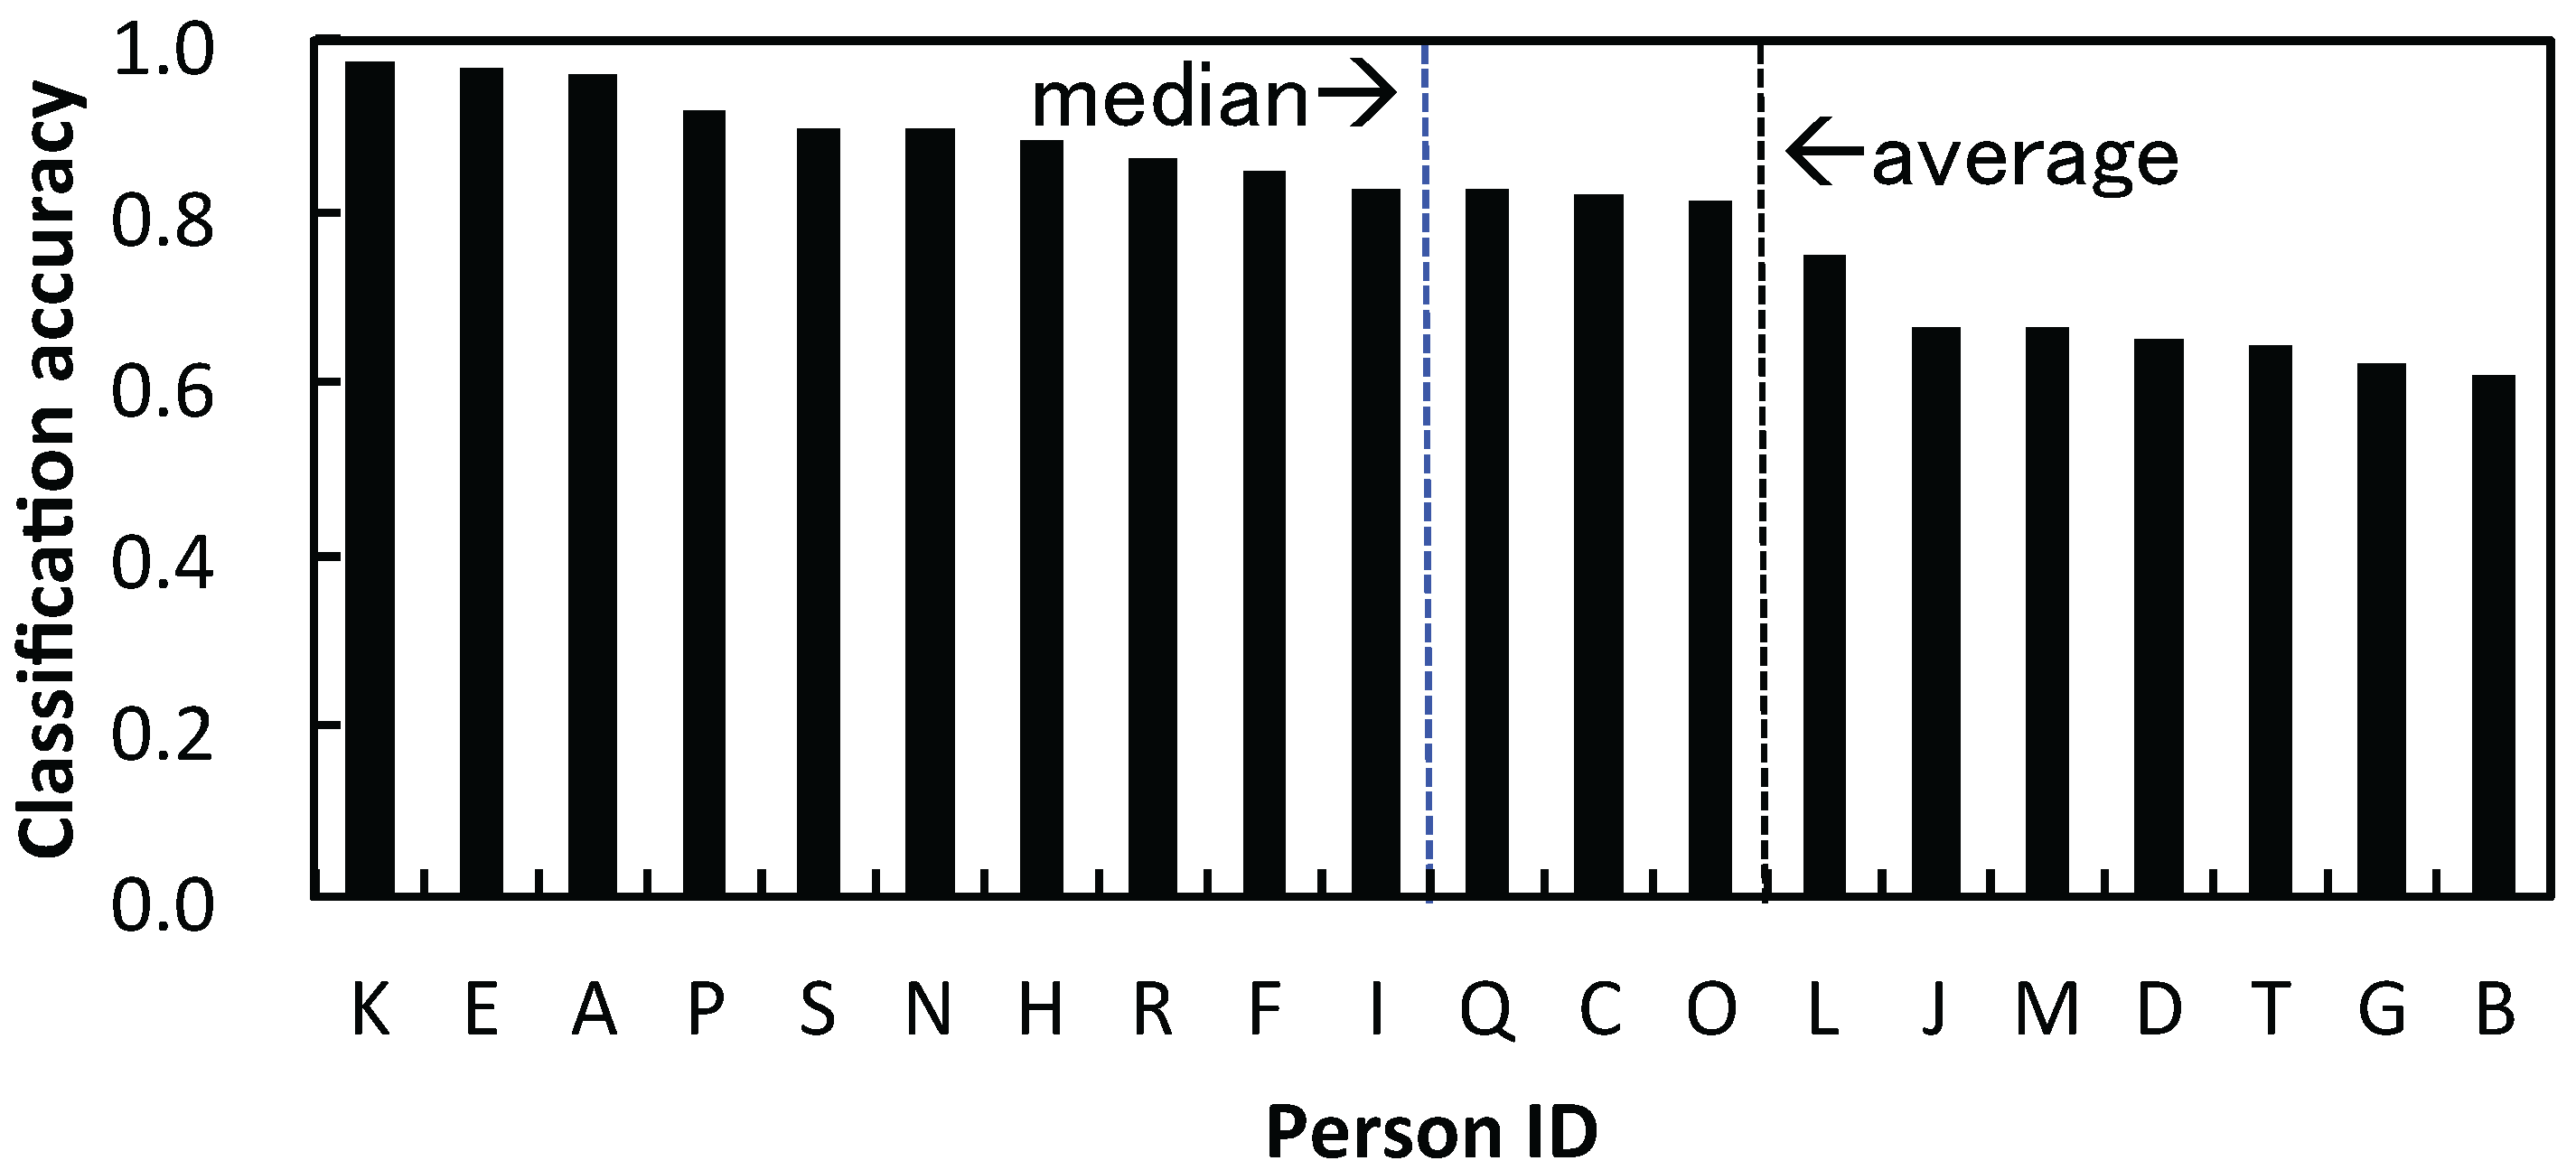

Table 1.
Related work on on-body localization of a device. The brackets in the accuracy column indicate the condition of the evaluation. LOSO, leave-one-subject-out.
| Target Position (Total Number) | Sensor | Evaluation | Subjects | Accuracy (%) | |
|---|---|---|---|---|---|
| Kunze et al. [24] | Head, trousers, breast, wrist (4) | Accelerometer | 10-fold | 6 | 94.0 (walking) |
| Harrison & Hudson [13] | Backpack, jacket, jeans hip, desk, etc. (27) | Multispectral light (active sensing w/ Ir light) | 10-fold | 16 | 94.8 (N/A) |
| Miluzzo et al. [17] | In or out of a pocket (2) | Microphone | 2-fold | 1 | 80 (N/A) |
| Vahdatpour et al. [23] | Upper arm, forearm, waist shin, thigh, head (6) | Accelerometer | 5-fold | 25 | 89 (walking) |
| Shi et al. [22] | Trouser front/back, breast, hand (4) | Accelerometer, gyroscope | 5-fold | 4 | 91.69 (walking) |
| Fujinami et al. [26] | Chest, jacket, trouser front/back of neck, 4 types of bags (9) | Accelerometer | LOSO | 20 | 74.6 (walking) |
| 10-fold | 99.4 (walking) | ||||
| Wiese et al. [27] | Pocket, bag, out of body, hand (4) | Accelerometer, proximity, capacitive | LOSO | 15 | 85 (mixed) |
| Diaconita et al. [11] | Pocket, backpack, desk, hand (4) | Microphone (active sensing w/ vibration) | 10-fold | Not given | 97 (stationary) |
| Diaconita et al. [12] | Pocket, hand, bag, desk (4) | Accelerometer (active sensing w/ vibration) | 10-fold | Not given | 99.2 (mixed) |
| Mannini et al. [25] | Ankle, thigh, hip, arm, waist (5) | Accelerometer | LOSO | 33 | 91.2 (walking) |
| 10-fold | 96.4 | ||||
| Alanezi et al. [28] | Trouser front/back, jacket, hand holding, talking on phone, | Accelerometer | 10-fold | 10 | 88.5 (walking) |
| watching a video (6) | Accelerometer, gyro | 89.3 (walking) | |||
| Incel [29] | Trousers, jacket, 2 types of bags, wrist, hand, arm, belt (8) | Accelerometer | LOSO | max/min/ave | 85.4 (walking) |
| 35/10/15.6 | 76.4 (stationary) | ||||
| 84.3 (mobile) | |||||
| Trouser left/right, upper arm, belt, wrist (5) | Accelerometer, gyro | LOSO | 10 | 95.9 (mixed) | |
| This work | Neck, chest, jacket, | Accelerometer | LOSO | 20 | 80.5 (walking) |
| trouser front/back, 4 types of bags (9) | 10-fold | 99.9 (walking) | |||
| Merged: “trousers”, “bags” (5) | LOSO | 85.9 (walking) |
| Type | Way of Slinging | Relationship with Body |
|---|---|---|
| Backpack | Over both shoulders | On the back (center of the body) |
| Handbag | Holding with hand | In the hand (side of the body) |
| Messenger bag | On the shoulder opposite the bag | Side or back of the body |
| Shoulder bag | On the same side of the shoulder as the bag | Side of the body |
| Type | Description |
|---|---|
| sdevtime | Standard deviation of time series data |
| mintime | Minimum value of time series data |
| maxtime | Maximum value of time series data |
| 3rdQtime | 3rd quartile of time series data |
| IQRtime | Inter-quartile range of time series data |
| RMStime | Root mean square of time series data |
| bin1time | 1st bin of the binned distribution of time series data |
| bin2time | 2nd bin of the binned distribution of time series data |
| bin3time | 3rd bin of the binned distribution of time series data |
| bin4time | 4th bin of the binned distribution of time series data |
| bin5time | 5th bin of the binned distribution of time series data |
| bin6time | 6th bin of the binned distribution of time series data |
| bin7time | 7th bin of the binned distribution of time series data |
| bin8time | 8th bin of the binned distribution of time series data |
| bin9time | 9th bin of the binned distribution of time series data |
| bin10time | 10th bin of the binned distribution of time series data |
| maxfreq,all | Maximum value in an entire frequency spectrum |
| fMaxfreq,all | Frequency that gives maxfreq,all |
| 3rdQfreq,all | 3rd quartile value in the frequency spectrum |
| IQRfreq,all | Inter-quartile range of the values in the frequency spectrum |
| 2ndMaxfreq,all | 2nd maximum value of the frequency spectrum |
| f2ndMaxfreq,all | Frequency that gives 2ndMaxfreq,all |
| maxfreq,low | Maximum value in the low-frequency range |
| maxfreq,mid | Maximum value in the mid-frequency range |
| maxfreq,high | Maximum value in the high-frequency range |
| sdevfreq,low | Standard deviation in the low-frequency range |
| sdevfreq,mid | Standard deviation in the mid-frequency range |
| sdevfreq,high | Standard deviation in the high-frequency range |
| maxSdevfreq,all | Maximum in subwindows in the frequency spectrum |
| fMaxSdevfreq,all | Central frequency of the subwindow that gives maxSdevfreq,all |
| sumPowerfreq,all | Sum of the entire range power |
| sumPowerfreq,low | Sum of the power in the low-frequency range |
| sumPowerfreq,mid | Sum of the power in the mid-frequency range |
| sumPowerfreq,high | Sum of the power in the high-frequency range |
| entrfreq,all | Frequency entropy in the entire range |
| entrfreq,low | Frequency entropy in the low-frequency range |
| entrfreq,mid | Frequency entropy in the mid-frequency range |
| entrfreq,high | Frequency entropy in the high-frequency range |
| Type | Description |
|---|---|
| corrtime | Correlation coefficient in time series data |
| corrfreq,all | Correlation coefficient in an entire frequency spectrum |
| corrfreq,low | Correlation coefficient in the low-frequency range |
| corrfreq,mid | Correlation coefficient in the mid-frequency range |
| corrfreq,high | Correlation coefficient in the high-frequency range |
| Condition | Value |
|---|---|
| Way of walking and orientation of a terminal | Unconstrained |
| Number of subjects | 20 (2 females and 18 males) |
| Trials per position | 10 |
| Duration of walking per trial | 30 s |
| Terminal | NexusOne (HTC) |
| Sampling rate | 25 Hz |
| Classifier | Parameter |
|---|---|
| J48 | -C 0.25 -M 2 |
| Naive Bayes | N/A |
| Support Vector Machine (SVM) | -S 0 -K 2 -D 3 -G 2.0 -R 0.0 -N 0.5 -M 40.0 -C 1.0 -E 0.0010 -P 0.1 -Z |
| Multi-Layer Perceptron (MLP) | -L 0.3 -M 0.2 -N 50 -V 0 -S 0 -E 20 -H a |
| RandomForest | -I 50 -K 0 -S 1 |
Table 7.
Basic performance in the relationship between classification accuracy vs. window size and the classifier (10-fold CV).
| Window Size | J48 | Naive Bayes | SVM | MLP | RandomForest |
|---|---|---|---|---|---|
| 128 | 0.964 | 0.798 | 0.997 | 0.984 | 0.994 |
| 256 | 0.979 | 0.810 | 0.999 | 0.994 | 0.999 |
| 512 | 0.989 | 0.813 | 0.999 | 0.994 | 0.999 |
| Rank | Name | Rank | Name | Rank | Name |
|---|---|---|---|---|---|
| 1 | sumPowerfreq,mid,y | 22 | f2ndMaxfreq,all,y | 43 | sdevfreq,low,z |
| 2 | corrtime,my | 23 | maxtime,z | 44 | corrfreq,all,yz |
| 3 | sumPowerfreq,high,y | 24 | corrfreq,high,mz | 45 | mintime,y |
| 4 | entrfreq,low,z | 25 | corrfreq,low,yz | 46 | bin9time,x |
| 5 | corrtime,mz | 26 | IQRfreq,all,y | 47 | sumPowerfreq,high,m |
| 6 | entrfreq,low,x | 27 | 3rdQfreq,all,z | 48 | bin4time,y |
| 7 | 3rdQfreq,all,y | 28 | corrfreq,low,zx | 49 | corrfreq,low,xy |
| 8 | sumPowerfreq,high,x | 29 | maxfreq,all,x | 50 | bin5time,z |
| 9 | corrfreq,high,my | 30 | sumPowerfreq,mid,x | 51 | sumPowerfreq,low,y |
| 10 | corrfreq,all,zx | 31 | entrfreq,low,y | 52 | corrtime,yz |
| 11 | RMStime,m | 32 | corrfreq,mid,mz | 53 | bin3time,m |
| 12 | corrfreq,all,xy | 33 | fMaxfreq,all,x | 54 | entrfreq,mid,z |
| 13 | maxSdevfreq,all,y | 34 | sumPowerfreq,mid,m | 55 | sumPowerfreq,mid,z |
| 14 | corrfreq,mid,my | 35 | bin6time,x | 56 | bin2time,x |
| 15 | entrfreq,all,z | 36 | corrfreq,all,my | 57 | maxtime,y |
| 16 | entrfreq,all,x | 37 | maxfreq,mid,y | 58 | maxfreq,high,x |
| 17 | sdevfreq,mid,y | 38 | mintime,x | 59 | IQRtime,z |
| 18 | entrfreq,all,y | 39 | corrfreq,mid,mx | 60 | f2ndMaxfreq,all,x |
| 19 | 3rdQfreq,all,x | 40 | corrtime,xy | 61 | corrfreq,mid,xy |
| 20 | corrtime,mx | 41 | sdevfreq,high,y | 62 | bin1time,z |
| 21 | maxfreq,high,y | 42 | bin6time,z | 63 | IQRfreq,all,m |
Table 9.
Median of the rank and the ratio of selected features for each category.
| Calculation Target | Domain | |||||||||
|---|---|---|---|---|---|---|---|---|---|---|
| Single Axis | Multi Axes (Correlation) | Time | Frequency | |||||||
| Median of rank | 34 | 26.5 | 45 | 27.5 | ||||||
| Proportion of selection | 45/63 | 18/63 | 19/63 | 44/63 | ||||||
| Individual Axis (Axes) Series | ||||||||||
|---|---|---|---|---|---|---|---|---|---|---|
| x | y | z | m | xy | zx | yz | mx | my | mz | |
| Median of rank | 34 | 24 | 43 | 40.5 | 44.5 | 44 | 19 | 29.5 | 11.5 | 24 |
| Proportion of definition | 12/38 | 16/38 | 11/38 | 6/38 | 4/5 | 3/5 | 2/5 | 2/5 | 4/5 | 3/5 |
Note: in the case of an even number of features, the average of two central successive values was utilized.
| Answer\decision | a | b | c | d | e | f | g | h | i | Recall |
|---|---|---|---|---|---|---|---|---|---|---|
| a. neck | 187 | 3 | 3 | 0 | 0 | 0 | 0 | 0 | 0 | 0.970 |
| b. chest | 0 | 168 | 17 | 0 | 0 | 0 | 1 | 0 | 3 | 0.889 |
| c. jacket | 8 | 14 | 119 | 5 | 3 | 12 | 2 | 7 | 19 | 0.633 |
| d. trouser front | 1 | 0 | 6 | 146 | 20 | 0 | 1 | 16 | 0 | 0.768 |
| e. trouser back | 1 | 3 | 7 | 29 | 145 | 0 | 0 | 9 | 1 | 0.744 |
| f. backpack | 0 | 10 | 1 | 0 | 0 | 156 | 14 | 1 | 15 | 0.794 |
| g. handbag | 0 | 11 | 4 | 0 | 0 | 12 | 162 | 0 | 9 | 0.818 |
| h. messenger bag | 0 | 11 | 12 | 0 | 0 | 1 | 1 | 171 | 3 | 0.853 |
| i. shoulder bag | 0 | 0 | 17 | 0 | 0 | 1 | 19 | 5 | 155 | 0.785 |
| Precision | 0.945 | 0.767 | 0.639 | 0.810 | 0.856 | 0.862 | 0.813 | 0.823 | 0.751 | 0.805 |
| Answer\decision | a | b | c | x | y | Recall |
|---|---|---|---|---|---|---|
| a. neck | 187 | 3 | 3 | 0 | 0 | 0.970 |
| b. chest | 0 | 168 | 17 | 0 | 4 | 0.889 |
| c. jacket | 8 | 14 | 119 | 8 | 40 | 0.633 |
| x. trousers | 1 | 2 | 7 | 170 | 13 | 0.883 |
| y. bag | 0 | 8 | 9 | 0 | 181 | 0.914 |
| Precision | 0.953 | 0.867 | 0.776 | 0.949 | 0.761 | 0.859 |
Table 12.
Compatibility matrix of the accuracy obtained by training and testing with person-by-person.

| Biking | Jogging | Upstairs | Downstairs | |
|---|---|---|---|---|
| Recall of trousers front pocket | 0.009 | 0.673 | 0.815 | 0.150 |
| Most confused class and | Jacket | Trousers back | Neck | Neck |
| the false recognition for the class | 0.321 | 0.240 | 0.118 | 0.806 |
© 2016 by the author; licensee MDPI, Basel, Switzerland. This article is an open access article distributed under the terms and conditions of the Creative Commons by Attribution (CC-BY) license (http://creativecommons.org/licenses/by/4.0/).
Share and Cite
MDPI and ACS Style
Fujinami, K. On-Body Smartphone Localization with an Accelerometer. Information 2016, 7, 21. https://doi.org/10.3390/info7020021
AMA Style
Fujinami K. On-Body Smartphone Localization with an Accelerometer. Information. 2016; 7(2):21. https://doi.org/10.3390/info7020021
Chicago/Turabian StyleFujinami, Kaori. 2016. "On-Body Smartphone Localization with an Accelerometer" Information 7, no. 2: 21. https://doi.org/10.3390/info7020021
Note that from the first issue of 2016, this journal uses article numbers instead of page numbers. See further details here.