Article

Bridging the Gap: Exploring Interpretability in Deep Learning Models for Brain Tumor Detection and Diagnosis from MRI Images

1
Department of Mathematical and Computational Sciences, University of Venda, Thohoyandou 0950, South Africa
2
Department of Mathematics, Rhodes University, Grahamstown 6139, South Africa
3
Institute of Cognitive Science, Osnabrück University, 49074 Osnabrück, Germany
*
Authors to whom correspondence should be addressed.
Information 2024, 15(4), 182; https://doi.org/10.3390/info15040182
Submission received: 12 February 2024 / Revised: 7 March 2024 / Accepted: 16 March 2024 / Published: 27 March 2024

Abstract

:
The advent of deep learning (DL) has revolutionized medical imaging, offering unprecedented avenues for accurate disease classification and diagnosis. DL models have shown remarkable promise for classifying brain tumors from Magnetic Resonance Imaging (MRI) scans. However, despite their impressive performance, the opaque nature of DL models poses challenges in understanding their decision-making mechanisms, particularly crucial in medical contexts where interpretability is essential. This paper explores the intersection of medical image analysis and DL interpretability, aiming to elucidate the decision-making rationale of DL models in brain tumor classification. Leveraging ten state-of-the-art DL frameworks with transfer learning, we conducted a comprehensive evaluation encompassing both classification accuracy and interpretability. These models underwent thorough training, testing, and fine-tuning, resulting in EfficientNetB0, DenseNet121, and Xception outperforming the other models. These top-performing models were examined using adaptive path-based techniques to understand the underlying decision-making mechanisms. Grad-CAM and Grad-CAM++ highlighted critical image regions where the models identified patterns and features associated with each class of the brain tumor. The regions where the models identified patterns and features correspond visually to the regions where the tumors are located in the images. This result shows that DL models learn important features and patterns in the regions where tumors are located for decision-making.

1. Introduction

The field of medical imaging has experienced a transformative paradigm shift with the emergence of deep learning (DL), unlocking unprecedented opportunities for accurate disease classification and diagnosis, as discussed in [1,2,3,4,5]. In the area of brain tumor classification using Magnetic Resonance Imaging (MRI) scan images, these DL models have shown exceptional promise [1,2]. The significance of brain tumor diagnosis from MRI images lies in its pivotal role in modern healthcare, offering opportunities for early detection and timely treatment, as is evident in [2,3,6]. DL models have demonstrated significant promise in automating brain tumor classification tasks. However, their real-world application and reliability, especially concerning accuracy and interpretability, are still questioned [7].
Despite the impressive classification results produced by DL models, their “black-box” nature impedes a comprehensive understanding of the decision-making rationale. Also, their incorporation into clinical practice and decision-making needs adaptability, not just in terms of classification performance, but also in interpretability and explainability. This study investigates the junction of medical image analysis and DL interpretability. Brain tumors, characterized by their diversity and clinical significance as highlighted in [2,3], demand precise classification for tailored treatment plans and improved patient outcomes. While DL models have exhibited substantial prowess in this domain, their inherent opacity presents a challenge, as discussed in [3,6]. The central issue revolves around understanding how these models reach their conclusions, particularly crucial in the context of medical decision-making. Today, interpretability techniques are used to understand the decision-making processes of DL models in medical imaging. These techniques aid in identifying crucial features and regions within images that impact the model’s decisions, thus enhancing comprehension of the diagnostic process.
We conducted a broad performance evaluation of various state-of-the-art DL frameworks with transfer learning such as AlexNet, DenseNet121, EfficientNetB0, GoogLeNet, Inception V3, ResNet50, VGG16, VGG19, ViT Transformer, and Xception for brain tumor MRI classification. This evaluation encompasses not only the assessment of classification accuracy, but also a focus on evaluating the interpretability of the models. Adaptive path-based techniques, including Grad-CAM++ [8], Grad-CAM [9], and Integrated Gradients [10], are used to understand what these DL models learn in MRI images. Other methods exist in the literature for feature extraction, such as the Stationary Wavelet Transform (SWT) [11] and optimized hybridization methods like Particle Swarm Optimization (PSO) and Artificial Bee Colony (ABC) [11]. However, in this work, our primary focus is on state-of-the-art CNNs using a gradient-based optimization method.
The rest of this paper is structured as follows. Section 2 discusses the literature review on explainability in medical imaging, while Section 3 covers the attribution methods used in this work and the transfer learning models. Section 4 presents the proposed method. Section 5 presents the dataset and discusses the results, while Section 6 concludes the work.

2. Literature on DL Models’ Explainability in Medical Imaging

The input image is passed through the algorithm via one forward, as well as backward propagation. The resulting score is then computed forward, and the dependency gradient amongst the convolution layers is then determined to build an attribution map. This process is known as the Vanilla Gradient explainability method. It is an easy-to-understand attribution approach with few processing power requirements because of its simplicity. Vanilla Gradient and other attribution-based graphic aids for MRI imaging of brain tumors were evaluated using an attribution-based scheme named NeuroXAI [12]. Both feature segmentation and classification were visualized using these techniques. Vanilla Gradient produced noisier attribution maps than the other attribution techniques and had gradient saturation, which means that a change in a neuron has no effect on the network’s output and, so, cannot be assessed. Similar results were observed utilizing Vanilla Gradient for feature visualization in [13], where the dissimilitude intensification juncture from computed tomography (CT) images is anticipated. Furthermore, Vanilla Gradient is unable to distinguish between classes (such as healthy and diseased) [14]. This demonstrates that Vanilla Gradient is unable to produce attribution maps that are distinct based on class. The deconvolution network (DeconvNET) is essentially comparable to Vanilla Gradient, with the primary distinction lying in the computation of gradients over a Rectified Linear Unit (ReLU) function [15].
The human brain’s artery segmentation was studied using different attribution techniques for interlayer CNN visualization using TorchEsegeta, a structure for image-based DL algorithms that can be understood and explained [16]. Since other techniques also indicated non-vessel activation, their primary focus was on the vessels; Vanilla Gradient and DeconvNET produced results that were more comprehensible to humans than other attribution techniques like Deep Learning Important Features (DeepLIFT) and Grad-CAM++.
Guided back-propagation (GBP) integrates both the DeconvNET [17] and Vanilla Gradient. Comparing this approach to applying each technique separately yields less noisy attribution maps as there are fewer active voxels. As compared to Vanilla Gradient, GBP presented purpose-specific attribution maps in the NeuroXAI framework with much less noise [12]. An extra refining mechanism for GBP was suggested in [17] to further reduce the quantity of noise and the influence of indiscriminate attributions on predicting brain disorders using MRI. GBP is likely to offer attribution maps with reduced noise, but it could furthermore produce attribution maps that are too sparse, which are unhelpful for comprehensive image characterization [18]. Although they are not class discriminative, all three of the gradient-based techniques are quite sensitive to the way the neural network layers collect information. ReLU and pooling layers may also cause local gradients to saturate. As a result, significant characteristics may disappear as the network’s layers advance, which might lead to an inadequate model clarification or even a concentration on unimportant features. Layerwise relevance propagation (LRP) is an Explainable Artificial Intelligence (XAI) technique that employs principles unique to LRP to propagate the class score backward through the neural layers to the input image [19]. The core idea of LRP is to preserve inter-neuron interdependence, ensuring that information acquired by one layer of neurons is equally transferred to the next lower layer. LRP addresses the challenges posed by the saturation problem since the decomposition relies on propagating relevance scores between neurons rather than gradients. In a study focused on the detection of abdominal aortic aneurysms using CT images, LRP demonstrated a distinct class difference based on activation differences in the aortic lumen [20].
Deep Learning Important Features (DeepLIFT) is an XAI technique that addresses the saturation problem by employing a neutral reference activation, such as the neuron activation in CT scans without pathology or disease [21]. The difference between a new neuron’s activation and the reference activation is described by this reference activation. An attribution map is generated by computing the contribution scores for each neuron based on these differences. To discern individuals with Multiple Sclerosis (MS) using MRI, DeepLIFT was compared to LRP and Vanilla Gradient [22]. Based on the quantitative evaluation, DeepLIFT extracts target-specific characteristics much better than Vanilla Gradient and marginally better than LRP. Gradient saturation is something that both LRP and DeepLIFT can handle, which might be why they outperform Vanilla Gradient in this classification challenge. Among the most popular model-specific attribution techniques is the class activation map (CAM) [23,24]. Rather than using numerous dense layers, it employs a Global Average Pooling (GAP) layer, which adds linearity before the last dense layer and after the last convolution layer. Low-dimensional attribution maps are produced by CAM since they only utilize information from the last convolution layer. As a result, the low-dimensional CAM can show if a model can generally focus on particular targets, but because of its poor specificity, it is unable to discriminatively define characteristics depending on the class [25,26]. Additionally, it was revealed through perturbation analysis of several attribution methodologies that gradient-based approaches have greater rigor than CAM [13]. However, CAM can be indicative when performing patch-based (more targeted) tumor analysis as opposed to whole-image tumor analysis [27,28], or when the classes in a classification task exhibit obvious visual distinctions, such as between healthy and Alzheimer’s brains [29].
The use of XAI techniques has increased dramatically as a result of COVID-19 detection [30]. Generally speaking, these techniques may be distinguished by either using the entire CT scan or only the lung segmentation for COVID-19 identification. In particular, there was a significant performance difference in attribution mapping for COVID-19 detection based on the entire picture. The most common attribution technique was Grad-CAM, an extension of CAM, which produced both very specific [31,32] and non-specific attributions [22,33,34], but generally was able to approximately pinpoint the possible COVID-19 lesions to produce reliable predictions. A priori segmentation of the lungs was proposed to eliminate the impact of non-target-specific characteristics [34,35,36,37,38,39,40]. In this manner, only characteristics from the lungs may be extracted by both the DL algorithms and the XAI approaches. In this sense, the XAI techniques and the DL algorithms can only extract characteristics from the lungs. Compared to utilizing the whole CT image with Grad-CAM, this anatomically based XAI approach demonstrated greater specificity. This indicates the benefits of medical-based data reduction for DL and XAI algorithms, that is lowering the number of trainable characteristics and/or getting rid of uninformative characteristics based on the input image. When the entire image was used, comparable non-target-relevant attribution maps were observed as well (in the absence of data reduction) for cerebral hemorrhage detection [41] and automated grading of expanded perivascular spaces in acute stroke [42]. In a manner akin to the COVID-19 investigations, prior anatomical segmentation was employed to categorize and illustrate mortality risks based on cardiac PET [43], Alzheimer’s disease [44], and schizophrenia based on MRI [45]. Grad-CAM’s low-dimensional attribution maps, however, continue to cause poor specificity even while data handling reduces the prevalence of non-target-specific characteristics [46,47]. The authors proposed that the active characteristics surrounding the tumor correlate with areas harboring occult microscopic illness based on the Grad-CAM attribution maps, in research for the categorization of lung cancer histology based on CT images [7]. This is more plausible, though, due to Grad-CAM’s poor dimensionality, as CT lacks the spatial resolution necessary to identify these tiny illnesses.
In classification tasks when there is a discernible radiological difference between the classes, Grad-CAM, like CAM, can be class discriminative [10,48,49,50,51]. However, additional attribution methods like Vanilla Gradient and GBP should be utilized in cases of tasks with less clear radiological distinctions, such as predicting survival based on tumor features, where Grad-CAM lacks fine-grained information [13,16]. In MRI imaging of brain tumors, research that paired GBP with Grad-CAM, a technique known as guided Grad-CAM (gGrad-CAM) showed improved localized attribution maps with greater resolution [12]. These supports integrate the benefits of attribution techniques for accurate and comprehensible model visualization. Numerous further enhanced versions of Grad-CAM, including Grad-CAM++, have been developed. To improve target-specific feature localization over Grad-CAM, Grad-CAM++ was introduced [6]. Grad-CAM may reduce the disparity in relevance between the various gradients since it averages the feature map gradients. Grad-CAM++ substitutes a weighted average, which quantifies each feature map unit’s significance, in its stead. In terms of knee osteoarthritis prediction using MRI, it demonstrated better target-specific attribution maps than Grad-CAM [9].

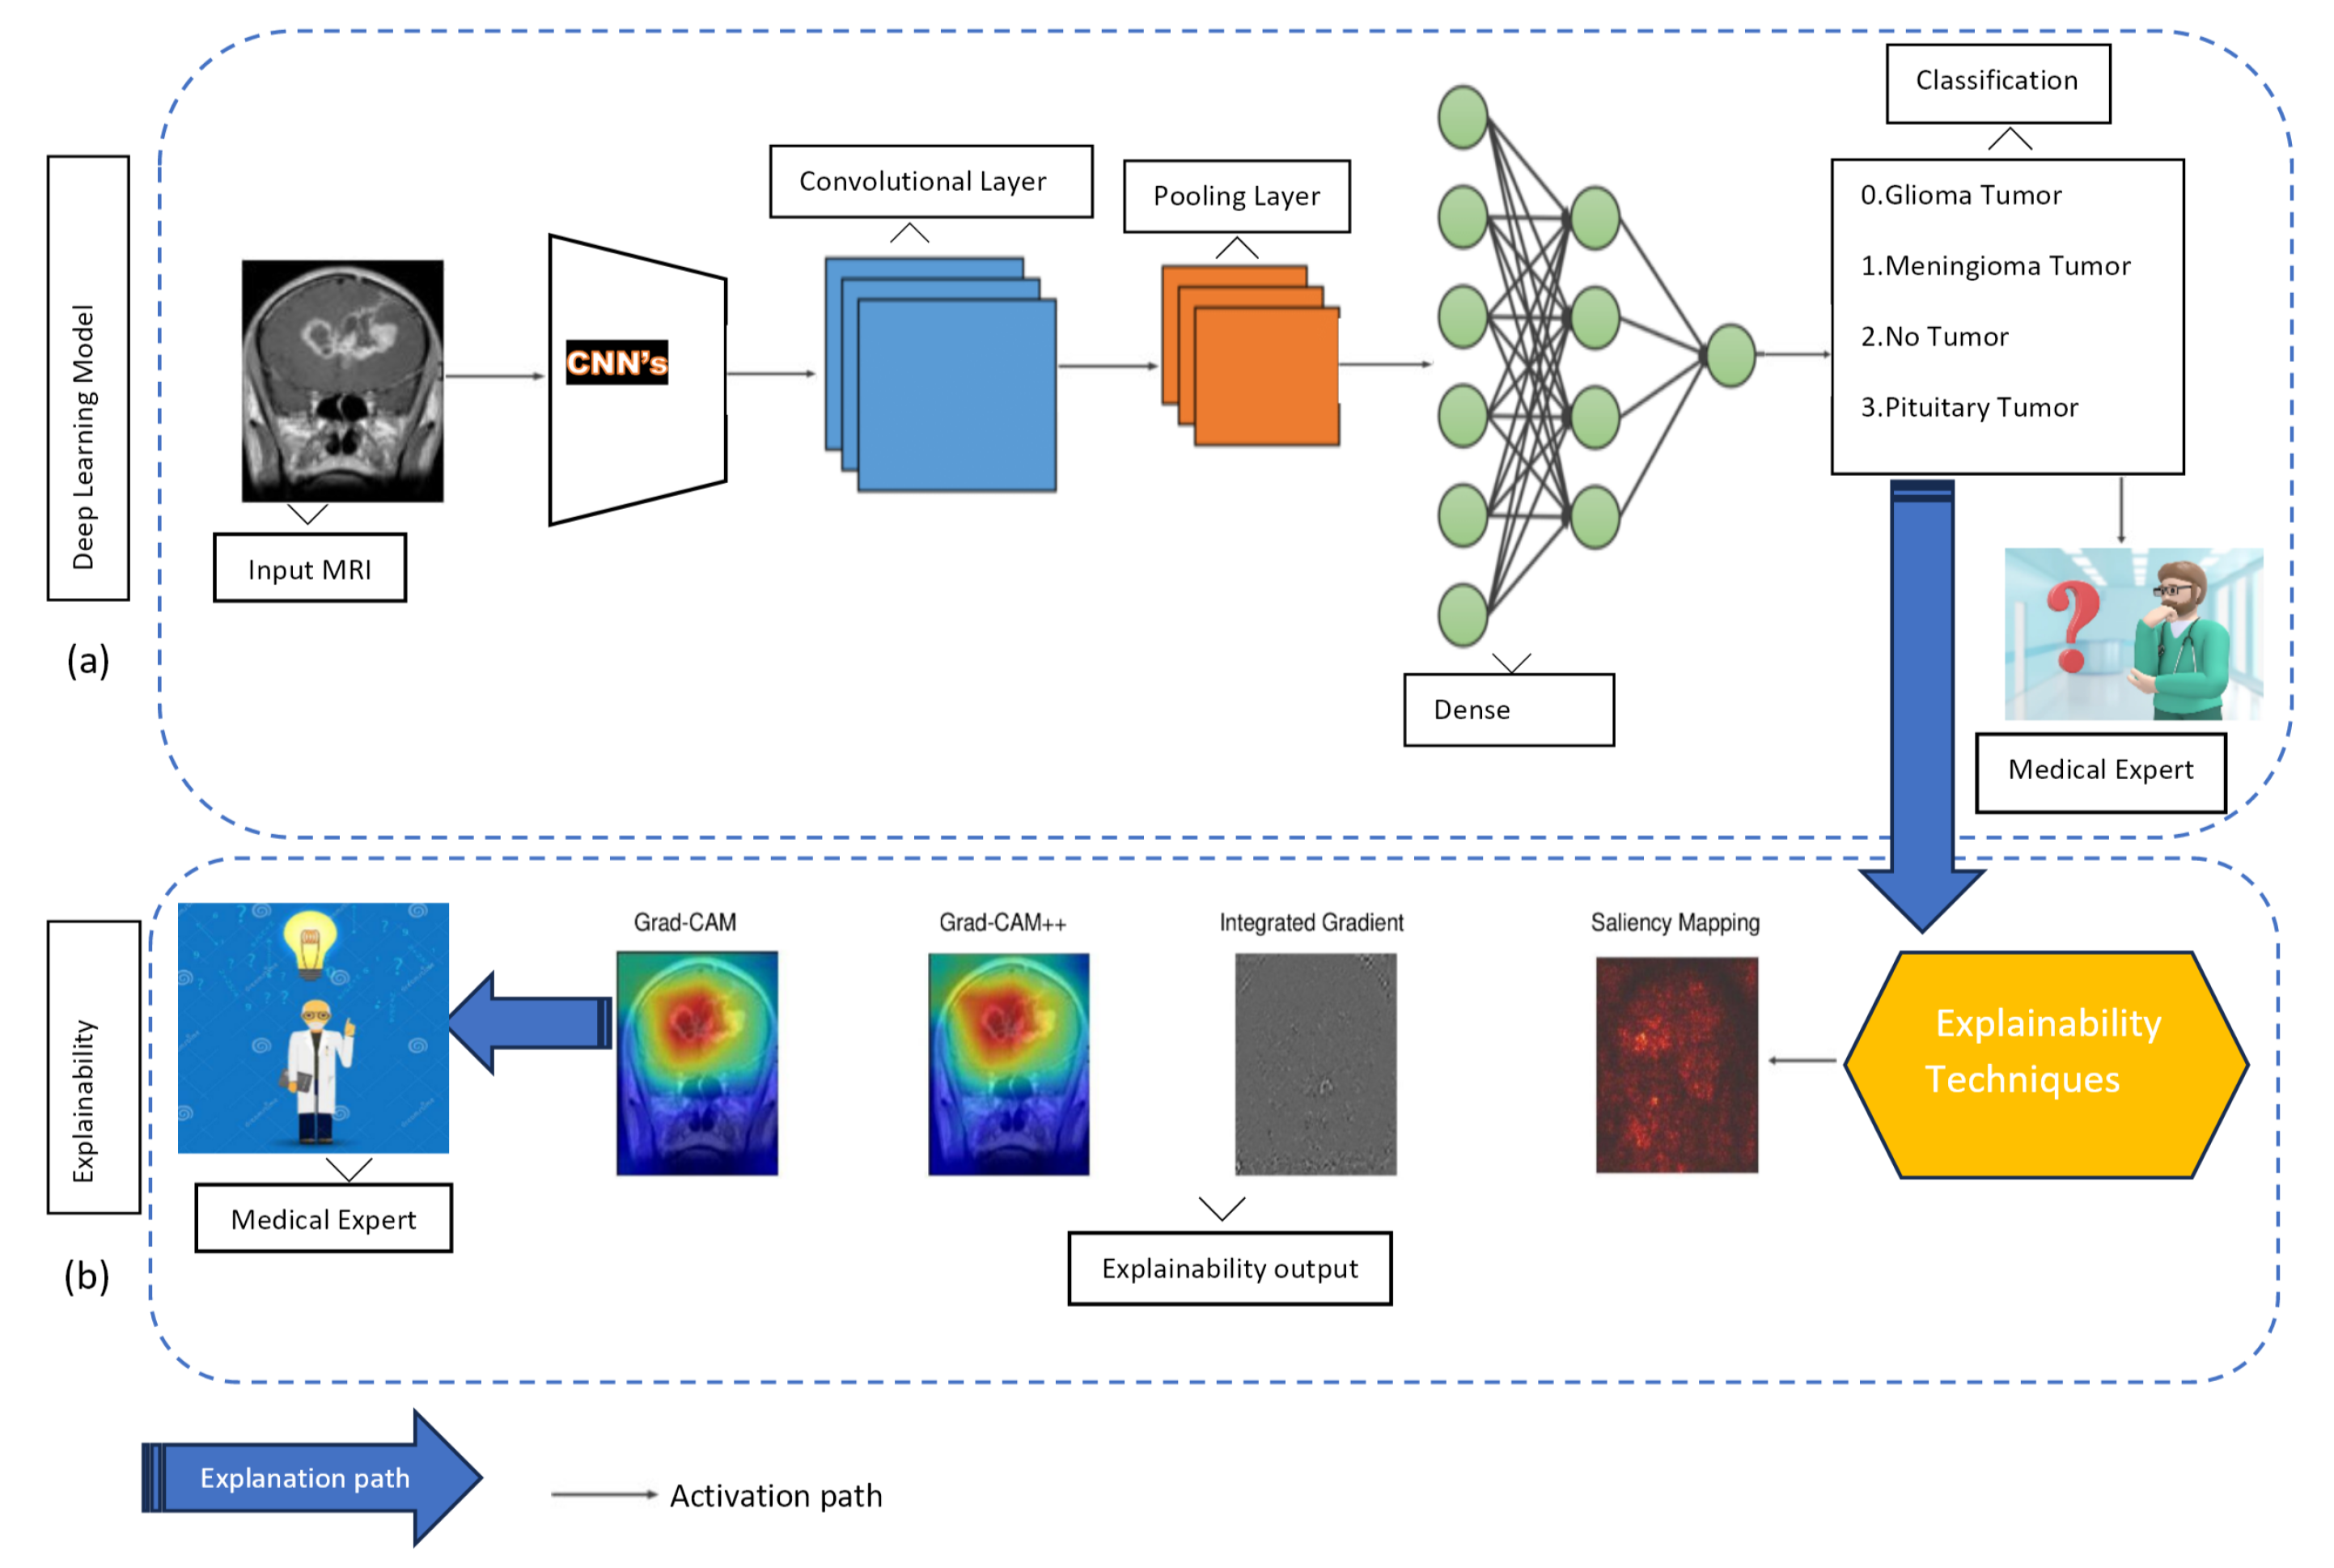
3. Path-Oriented Methods and Transfer Learning Models

We explored the complexities of transfer learning models and path-oriented methods. This investigation is essential because it offers a thorough grasp of the theoretical underpinnings of the models we trained and the attribution techniques used to ensure explainability. Through providing in-depth analyses of these techniques, we want to provide clarification on the fundamental ideas that underpin how they work. This theoretical foundation is essential to understanding the subtleties of the models and their interpretability, which is consistent with our goal of developing a deeper grasp of the theoretical foundations of these approaches in addition to putting them into practice.

3.1. Path-Oriented Methods

3.1.1. Grad-CAM and Grad-CAM++

Grad-CAM and Grad-CAM++ focus on visualizing the areas in the image that contribute significantly to the CNN’s decision-making process, providing interpretability to the model’s predictions. For Grad-CAM, let A be a feature map of class c and Y c the output that corresponds to class c. Its weights α k c at the i j -th position of the k-th feature map is expressed as:
α k c = 1 Z i j Y c A i j k ,
where Z represents the feature map’s size and A i j k the activation of the unit in position i j of the k-th feature map. In Grad-CAM++, the gradient weight α i j k c and R e L U function that correspond to class c are added, and the weight w k c is expressed as:
w k c = i j R e L U Y c A i j k α i j k c .
The localization heatmap L of class c in position i j is expressed as:
L i j c = k w k c A i j k .
R e L U is applied to enhance the relevance of positive gradients. These Equations (1)–(3) collectively represent the process of generating a heatmap that highlights the important regions in the input image for making predictions related to class c.

3.1.2. Integrated Gradient (IG)

Using this method, an attribution map is produced that shows the image parts that are important for the categorization choice. The output h c ( y ) represents the confidence score for predicting class c given a classifier h, input y, and class c. To compute Integrated Gradients (IG), we performed a line integral between a reference point y and an image y in the vector field generated by the gradient of h c ( y ) with respect to the input space. This vector field helps IG determine the importance or attribution for each feature, such as a pixel in an image. Formally, IG is defined as follows for each feature i:
I i IG ( y ) = 0 1 h c ( γ IG ( α ) ) γ i IG ( α ) γ i IG ( α ) α d α ,
where γ IG ( α ) , α [ 0 , 1 ] is the parametric function representing the path from y to y, with γ IG ( 0 ) = y and γ IG ( 1 ) = y . Specifically, γ IG is a straight line connecting y and y.

3.1.3. Saliency Mapping

Saliency Mapping uses an analysis of each pixel’s impact on the classification score to determine how salient it is in an input image. Saliency maps show the visual regions that influence the classification choice with a linear scoring model [52]:
S c ( I ) = w c T I + b c ,
where b c is the bias for class c, w c is the vector of weights, and I is a single-dimensional vectorized description of the image’s pixels. It is easy to see that, in such a situation, the related pixels of I are important based on the importance of the components of w c . We cannot simply use this insight since S c ( I ) is a non-linear function of the image in CNNs. However, by evaluating the first-order Taylor expansion, we can roughly estimate the class score function with a linear function in the vicinity of a given image I 0 :
S c ( I ) w T I + b ,
where w is the derivative of S c with respect to the image I at the point (image) I 0 :
w = S c I | I 0 .
Equation (7) can also be used to calculate the image-specific class saliency. In this case, the derivative’s magnitude shows which pixels require modification.

3.2. Transfer Learning Models

When faced with having a model excel in a related, yet slightly different challenge, transfer learning (TL) becomes pertinent. Rather than training the model from the initial stage, this approach involves leveraging the acquired knowledge, specifically the parameters, from the initial task and applying it to the new, related task. This process facilitates a more efficient adaptation of the model to the novel task by capitalizing on the previously acquired expertise. The TL models under consideration include AlexNet, VGG16, VGG19, GoogLeNet, ResNet50, Inception V3, DenseNet121, Xception, EfficientNetB0 and Vision Transformer (ViT).

3.2.1. AlexNet

The deep CNN architecture AlexNet made significant contributions to the development of DL and computer vision. By winning the ImageNet Large Scale Visual Recognition Challenge (ILSVRC) in 2012, it was first discussed in [53] and considerably advanced the state-of-the-art in image classification problems. It contains 5 convolutional layers and 3 fully connected layers for a total of 8 layers. The convolutional layers are separated by max-pooling layers, which are used to down-sample and capture important information.

3.2.2. VGG16

The contemporary transfer learning model VGG16, boasting sixteen weighted layers, stands as a state-of-the-art solution. Demonstrating its power on the ImageNet dataset, the model achieved an accuracy rate of 92.7% for the top-five test results. The VGG16 achieved the top spot in the Large Scale Visual Recognition Challenge (ILSVRC) organized by the Oxford Visual Geometry Group (VGG) [54]. The increased depth of the VGG model enables it to aid the kernel in capturing more intricate features.

3.2.3. VGG19

Within the VGG19 model, an extension of the VGG16 architecture with 19 weighted layers, three additional fully connected (FC) layers contribute to a total of 4096, 4096, and 1000 neurons respectively, as reported in [54]. This model encompasses a Softmax classification layer alongside five max-pooling layers. The convolutional layers within the architecture use the ReLU activation function.

3.2.4. GoogLeNet

The best-performing model, GoogLeNet, was presented by Google at the 2014 ImageNet Large Scale Visual Recognition Challenge (ILSVRC14) [55]. The inner layers of the neural network were expanded to output diverse correlation distributions, based on the theory that achieving different probability distributions highly correlated with the input data would optimize the efficiency of each layer’s neural network output.

3.2.5. ResNet50

The residual network ResNet50 is 50 layers deep [54]. The ResNet50 design integrates a combination of convolution filters of various sizes to address the degeneration of CNN models and shorten training times. A max-pooling layer, an average pooling layer, and a total of 48 convolutional layers make up this architecture.

3.2.6. Inception V3

Inception V1 was the name given to Google’s initial proposal of GoogLeNets, which was followed by Inception V2 and Inception V3 [56] the following year. To reduce the size of the feature maps, Inception V3 employs convolutional layers with a stride of two in combination with pooling layers. The first Inception module of Inception V3 replaces the 7-by-7 layer convolutional layer with 3-by-3 layer convolutional layers, which is a modification from Inception V2’s first Inception module. The network’s width and depth are increased in Inception V3 with the aforementioned upgrades to enhance performance.

3.2.7. DenseNet121

The DenseNet model was proposed in [57]. Its primary components are the DenseBlock (DB), transition layer, and growth rate. DenseNet121 has the advantage of requiring fewer parameters, allowing for the training of deeper models during computation. Additionally, the fully connected layer of the model also has a regularization effect, which can help prevent overfitting on smaller datasets.

3.2.8. Xception

Inception V3 was updated by Google to create Xception [58], which split regular convolution into spatial convolution and point-by-point convolution. Depthwise Separable Convolution (DSC) was used in place of the original Inception module. While pointwise convolution utilizes a 1-by-1 kernel to convolve point by point, reducing the number of parameters and computations, spatial convolution is conducted on each input channel.

3.2.9. EfficientNetB0

The EfficientNetB0 CNN architecture was proposed in [59]. Enhancing accuracy and efficiency through balanced scaling of the model’s depth, breadth, and resolution is the aim of EfficientNet. The design presents a fixed-ratio compound scaling technique that scales all three dimensions of depth, breadth, and resolution consistently.

3.2.10. Vision Transformer (ViT)

This architecture adopts the Transformer’s encoder component, revolutionizing image processing by segmenting the image into patches of a specified size like 16 × 16 or 32 × 32 dimensions [60,61]. This patch-based method enhances training with smaller patches. After flattening, the patches are fed into the network. Unlike traditional neural networks, the model lacks positional information about the sequence of samples. To address this, the encoder incorporates trainable positional fixed vectors, eliminating the need for hard-coded positions.

3.3. Performance Evaluation

Some of the most important performance measures frequently used are accuracy, precision, recall, and the so-called F 1 score. To describe these measures, let us denote by TP , TN , FP , and FN the number of true positives, true negatives, false positives, and false negatives, respectively. Here, TP s are instances where the model accurately predicted the presence of the positive class. TN s are instances where the model accurately predicted the absence of the negative class. FP s are instances where the model predicted a positive outcome when it ought to have been negative. FN s are instances where the model predicted a negative outcome when it ought to have been positive. The performance measures are defined as:
Accuracy = TP + TN TP + TN + FP + FN
Precision = TP TP + FP
Recall = TP TP + FN
F 1 = 2 · Precision · Recall Precision + Recall .

4. Method

This paper proposes a comprehensive framework for brain tumor classification while integrating the model’s explainability. This approach comprises two phases: phase (a) for classification and phase (b) for explainability, as illustrated in Figure 1.
Phase (a): This phase integrates a CNN model with TL for the classification of brain tumor types based on MRI data. In this approach, the acquired features of a pre-trained CNN model serve as an initial foundation, proving particularly advantageous in scenarios involving sparsely labeled data. The data are fed into a CNN, which subsequently processes the data through convolutional layers to capture intricate patterns and spatial hierarchies within the MRI images. Following this, the pooling layer is employed to down-sample and reduce the feature space, optimizing computational efficiency. Progressing along the activation path, the dense layer plays a pivotal role in transforming high-level features for effective classification. Finally, the model makes decisions about tumor types based on the combination of these learned features. When the decision is made, a medical expert becomes curious and seeks to understand how the model makes decisions based on their expertise.
Phase (b): This phase uses explainability techniques, including Grad-CAM, Grad-CAM++, IG, and Saliency Mapping. The explanation aims to shed light on how the CNN model arrives at its classifications, providing valuable insights to the medical expert. Grad-CAM and Grad-CAM++ offer the visualization of crucial regions in the MRI images that contribute to the model’s decisions. IG provides a comprehensive understanding of feature importance by perturbing input features, while Saliency Mapping highlights salient features influencing the classification. Together, these explainability techniques bridge the gap between the model’s predictions and human interpretability, fostering trust and comprehension in the application of DL models to medical imaging. After the model is explained, the focus shifts smoothly to the part where medical experts take over and make sense of it. The explained visualizations and insights provided by techniques like Grad-CAM, Grad-CAM++, IG, and Saliency Mapping serve as a bridge between the complex nature of DL classifications and the expertise of medical experts.

5. Results and Discussion
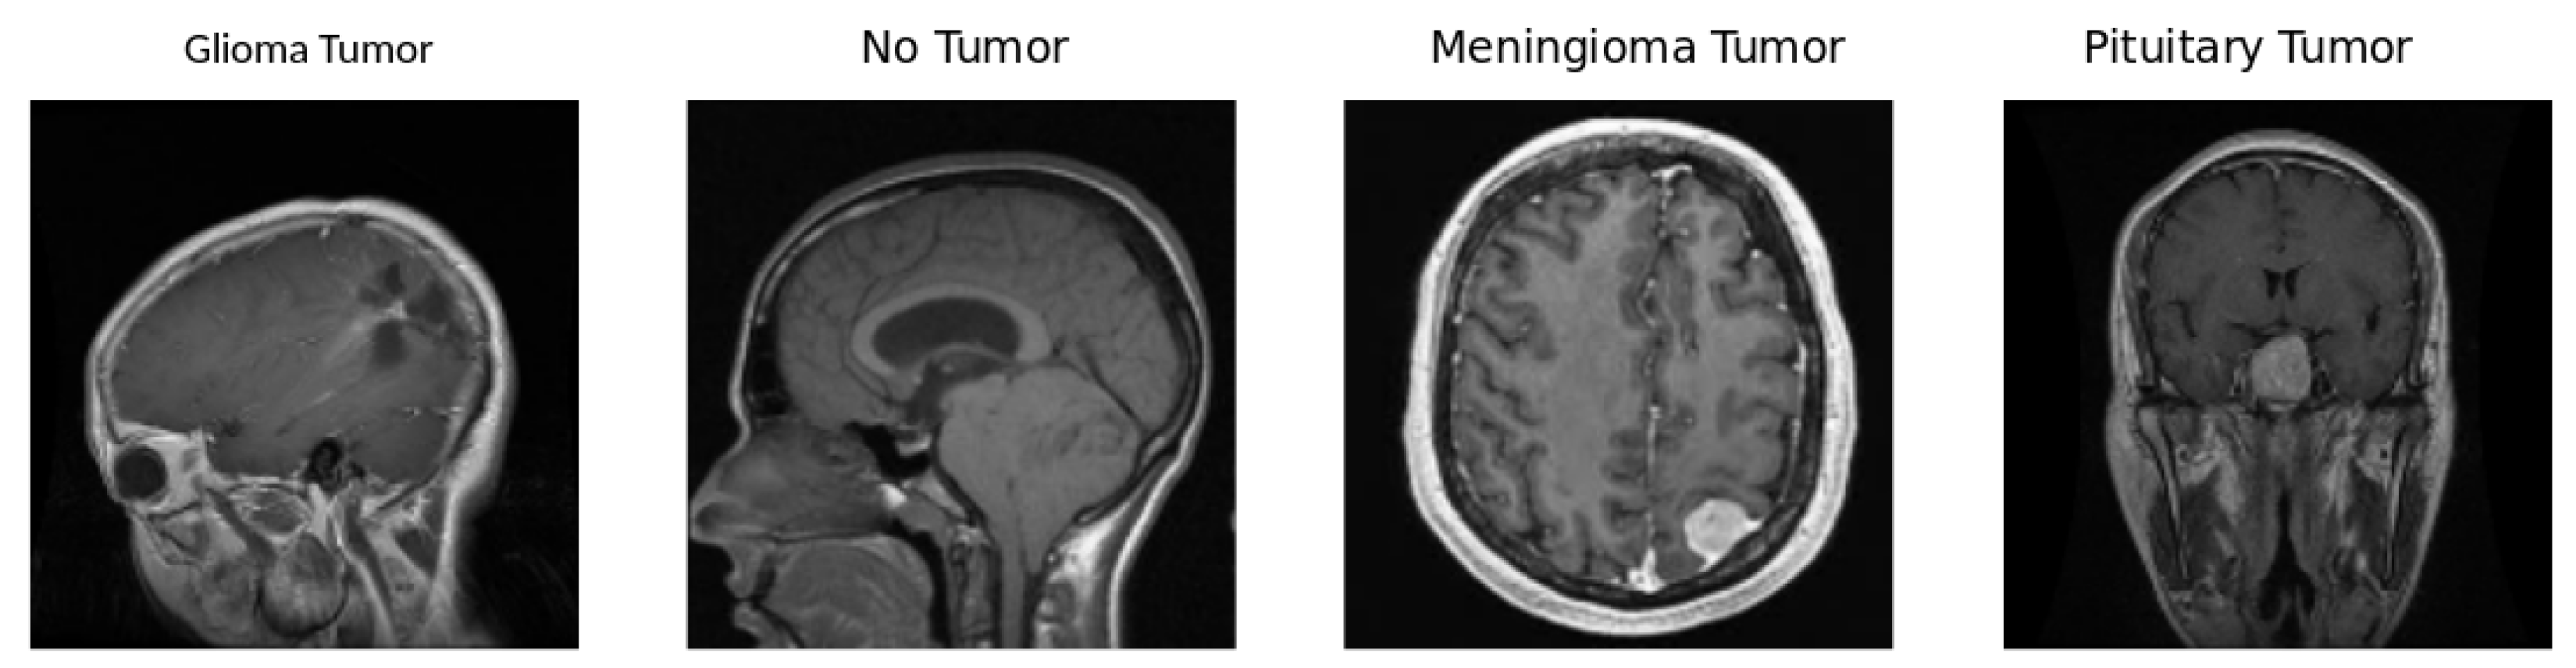
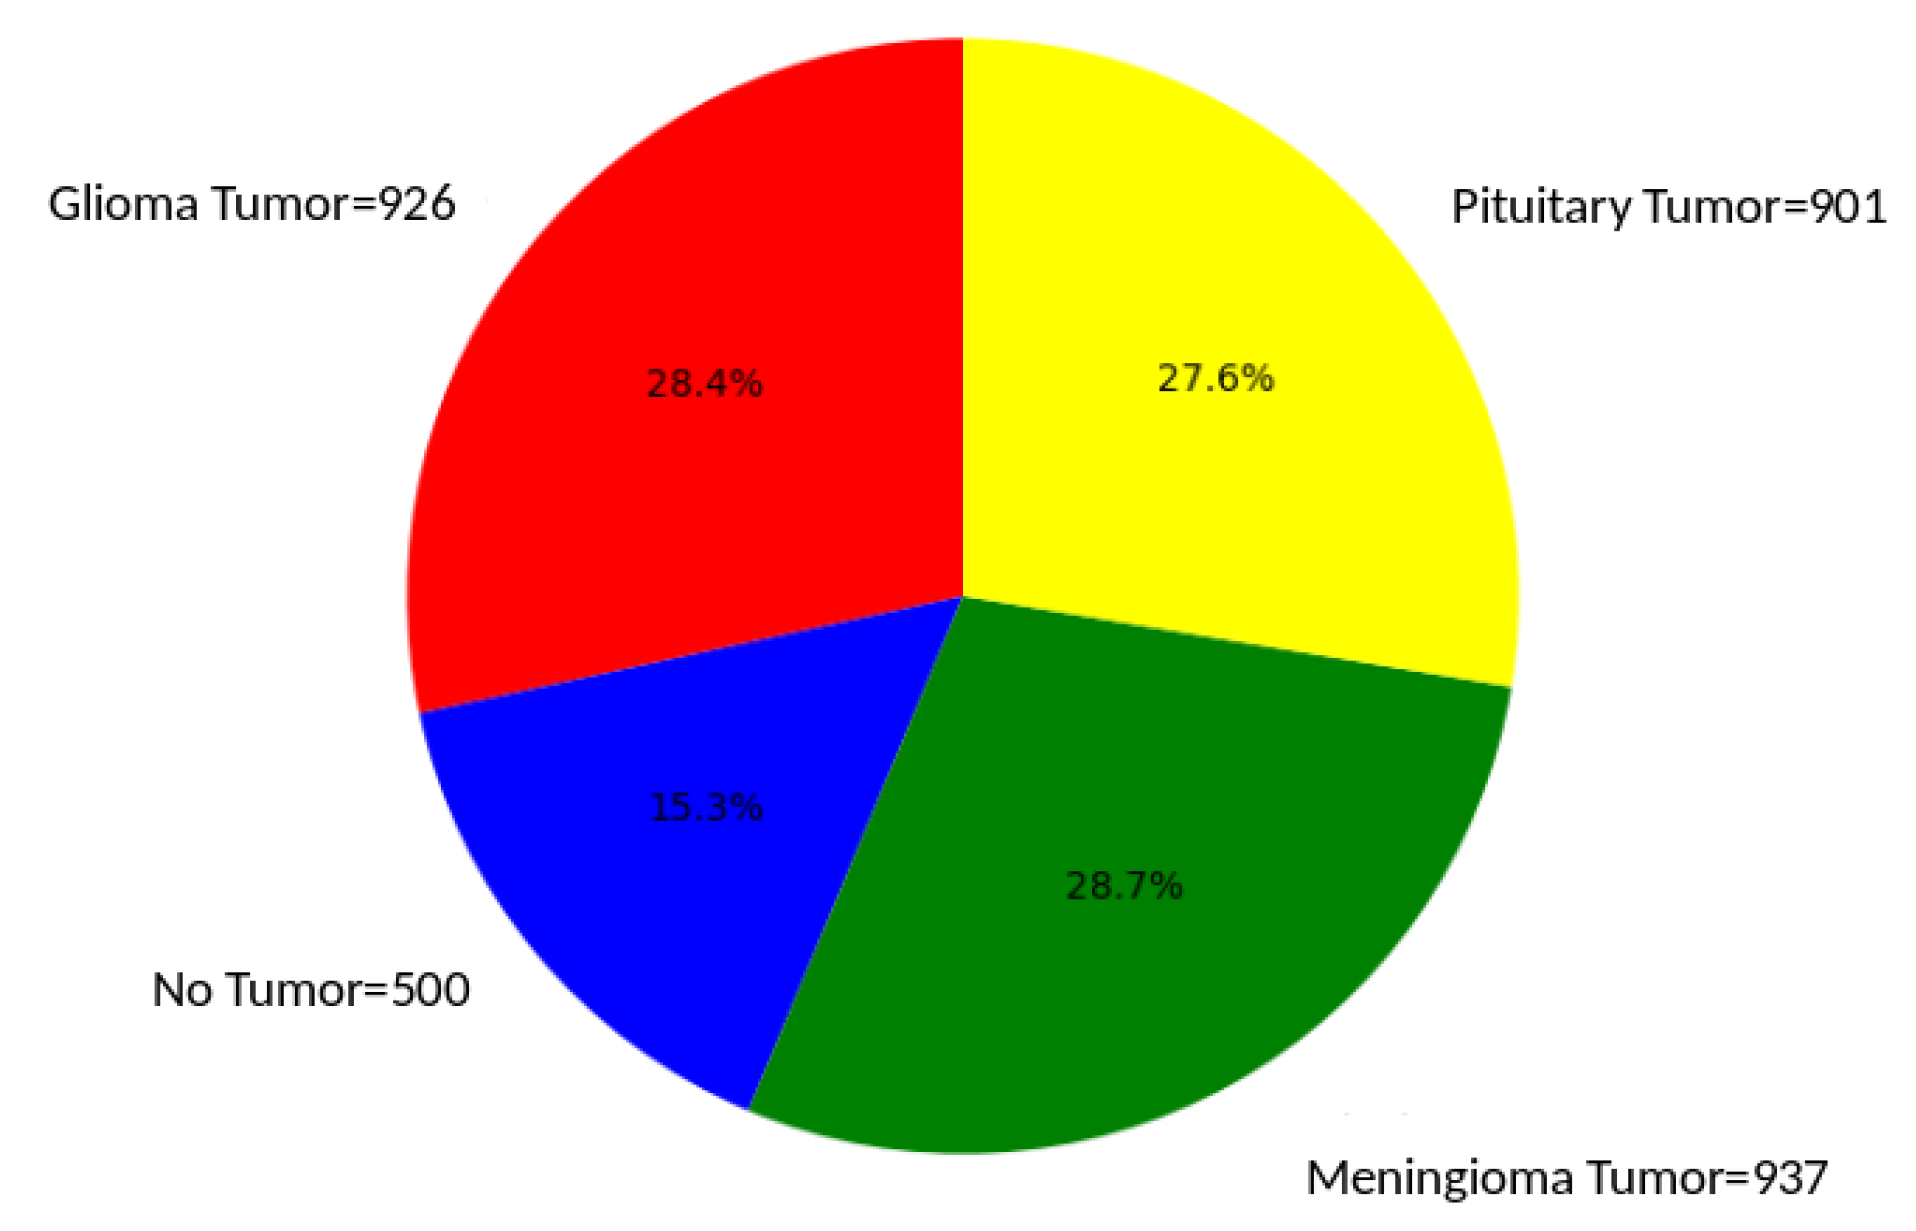
In this section, we present the outcomes of our study, offering a comprehensive overview of the key findings and their interpretation.

5.1. Dataset

For easy access and reference, the dataset used in this study is currently available on Kaggle [62]. This brain tumor dataset comprises 3264 2D slices of T1-weighted contrast-enhanced images, encompassing three distinct types of brain tumors—glioma, meningioma, and pituitary tumors—along with images of a healthy brain. We allocated 90% of the dataset for training and validation, reserving the remaining 10% for testing. We applied various data augmentation techniques to further enrich the training and validation subsets. The augmented subsets were subdivided into 90% for training and 10% for validation. The original images, initially sized at 299 × 299 , were resized to 150 × 150 to enhance computational efficiency and facilitate model training. Figure 2 visually presents samples from each of the four classes within the dataset, and Figure 3 illustrates the proportion of each of the four classes in the dataset.
Gliomas are tumors derived from glial cells and can manifest as either benign or malignant. Among them, glioblastoma multiforme stands out as a particularly aggressive variant, posing significant challenges in terms of therapeutic intervention [3]. Pituitary tumors arise in the pituitary gland; these tumors can disrupt hormonal balance. They may present as growths that secrete hormones or as non-functioning growths. Common sub-types include prolactinomas and growth-hormone-secreting tumors, each with its distinct clinical implications. Meningiomas are generally benign, slow-growing tumors originating from the meninges. The symptoms associated with meningiomas vary based on the size and location of the tumor, making their clinical presentation diverse and often dependent on individual cases [3].

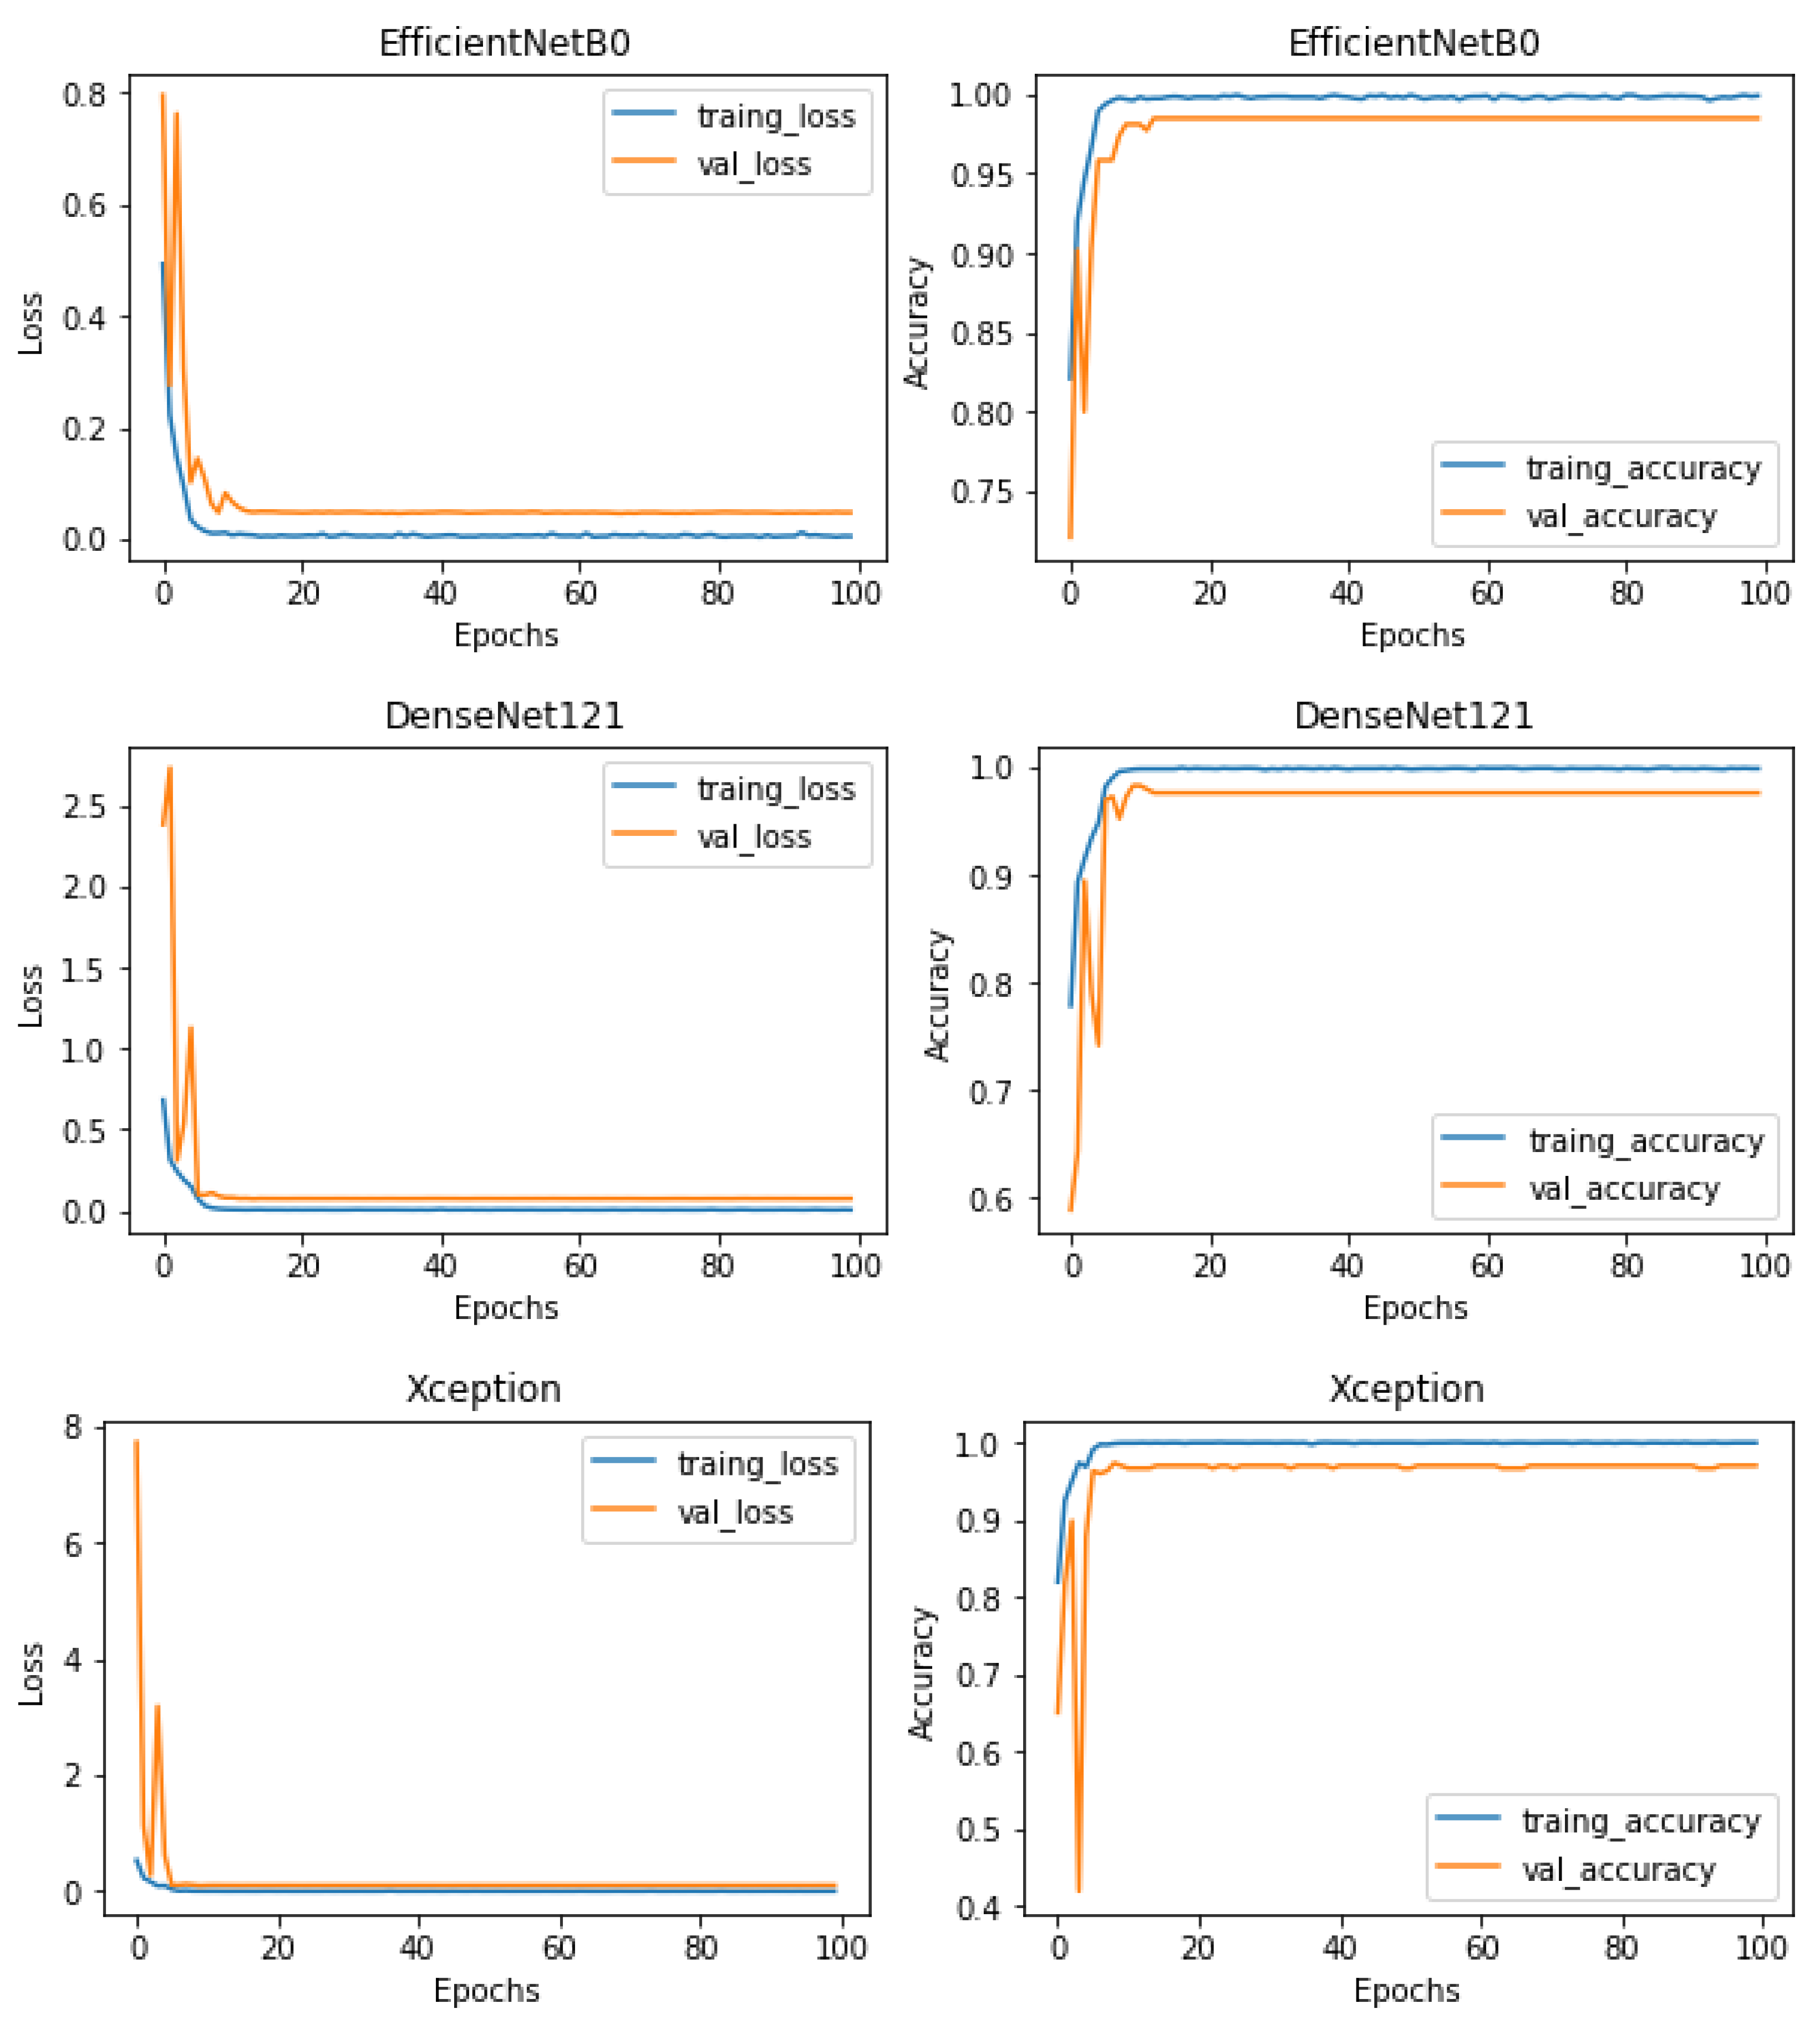
5.2. Training, Regularization, and Testing

As discussed in Section 5.1, 90% of the dataset was reserved for training and validation. This 90 % dataset was then augmented and shuffled to ensure randomness before splitting into 90% for training and 10% for validation. The hyperparameters, such as the number of layers, filter sizes, and dropout rates, were optimized to enhance the model’s predictive capabilities. This involved a systematic exploration of different hyperparameter combinations using Grid Search. It took several days to run the Grid Search for hyperparameter tuning. Throughout this process, we explored various combinations of hyperparameters, such as learning rates ranging from 0.001 to 0.1, batch sizes from 16 to 32, epochs from 10 to 150, as well as filter sizes and the number of filters. After completing the search, the best combination of hyperparameters was found to be a learning rate of 0.001, a batch size of 32, and 10 epochs. We used the categorical cross-entropy as a loss function with the Adam optimizer. The details of these hyperparameters are provided in Table 1. Figure 4 depicts the training and validation losses, as well as the training and validation accuracies for the top-performing models. It is evident from this figure that the models did not exhibit further learning beyond epoch 10, as indicated by the convergence of the training and validation losses. Hence, we preferred to stop training at epoch 10. The testing phase aimed to evaluate the trained model’s generalization to new, unseen data. The 10% test dataset as discussed in Section 5.1, consisting of 327 images, was used for this purpose. Metrics such as accuracy, precision, recall, and the so-called F1 score were computed to assess the model’s performance. The model training and hyperparameter tuning of our pre-trained models demanded substantial computational resources, and the efficiency of the process hinged on the specifications of our Dell computer, featuring an Intel Core i7 processor. The use of a powerful GPU, specifically the P100 model, played a pivotal role in accelerating the training speed. With 32 GB of system RAM, our system efficiently handled the computational load, facilitated by the Kaggle kernel environment. The implementation was carried out in Python version 3.9.7 and TensorFlow version 2.12.0.

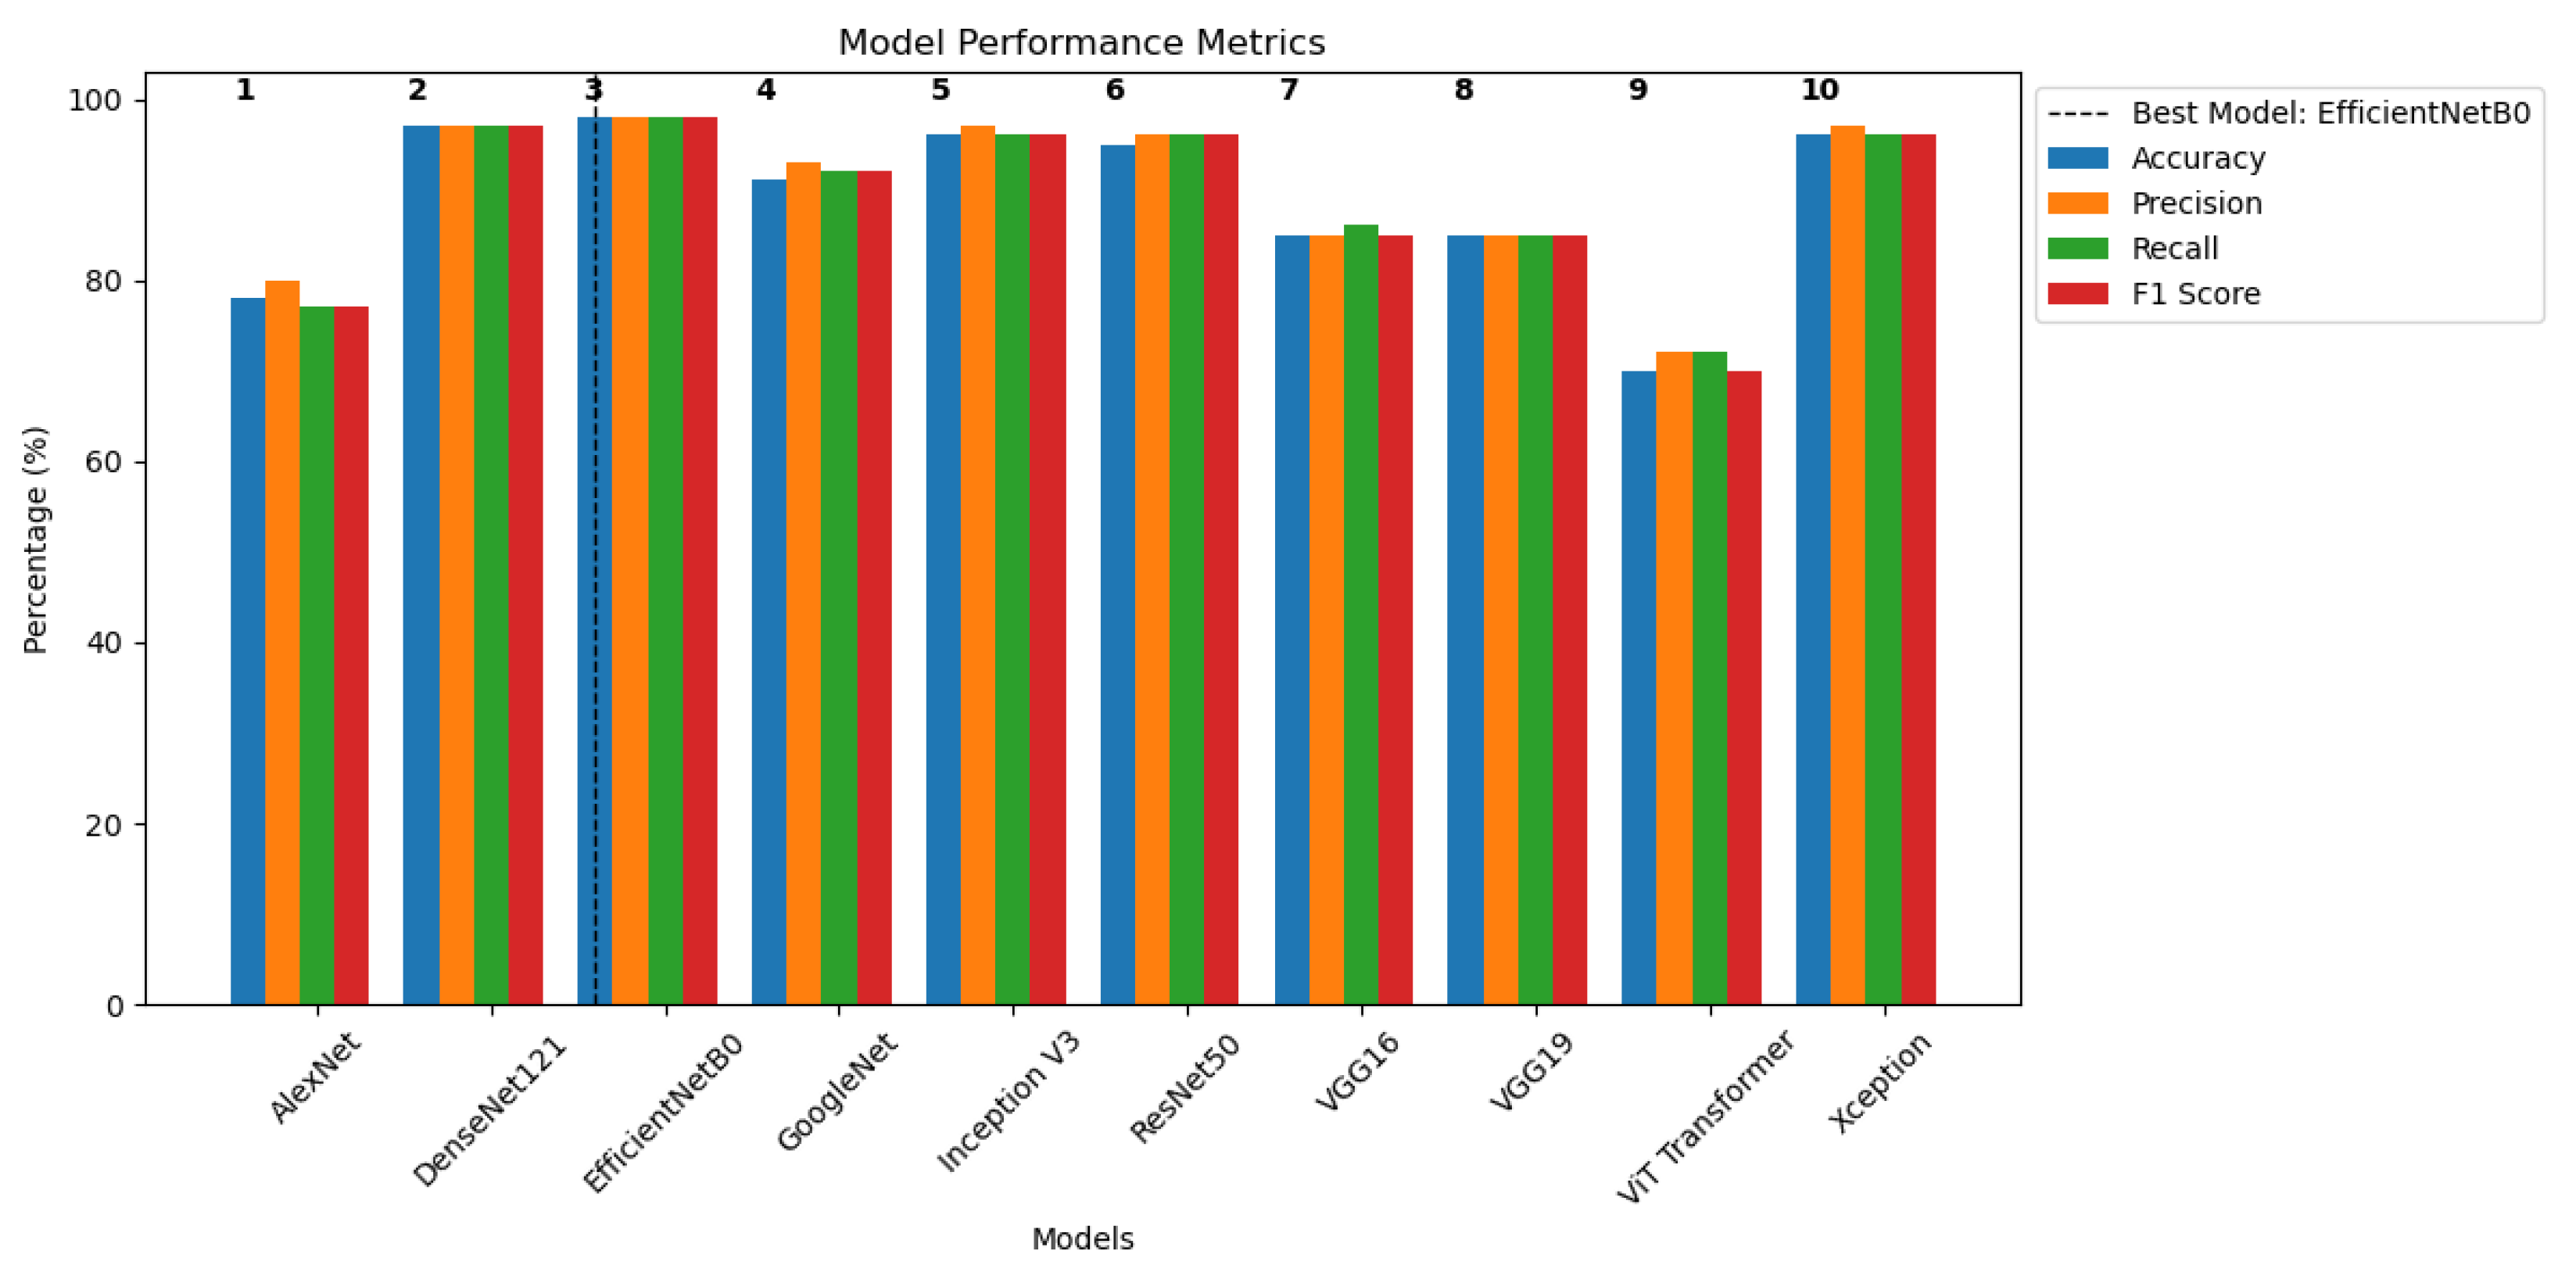
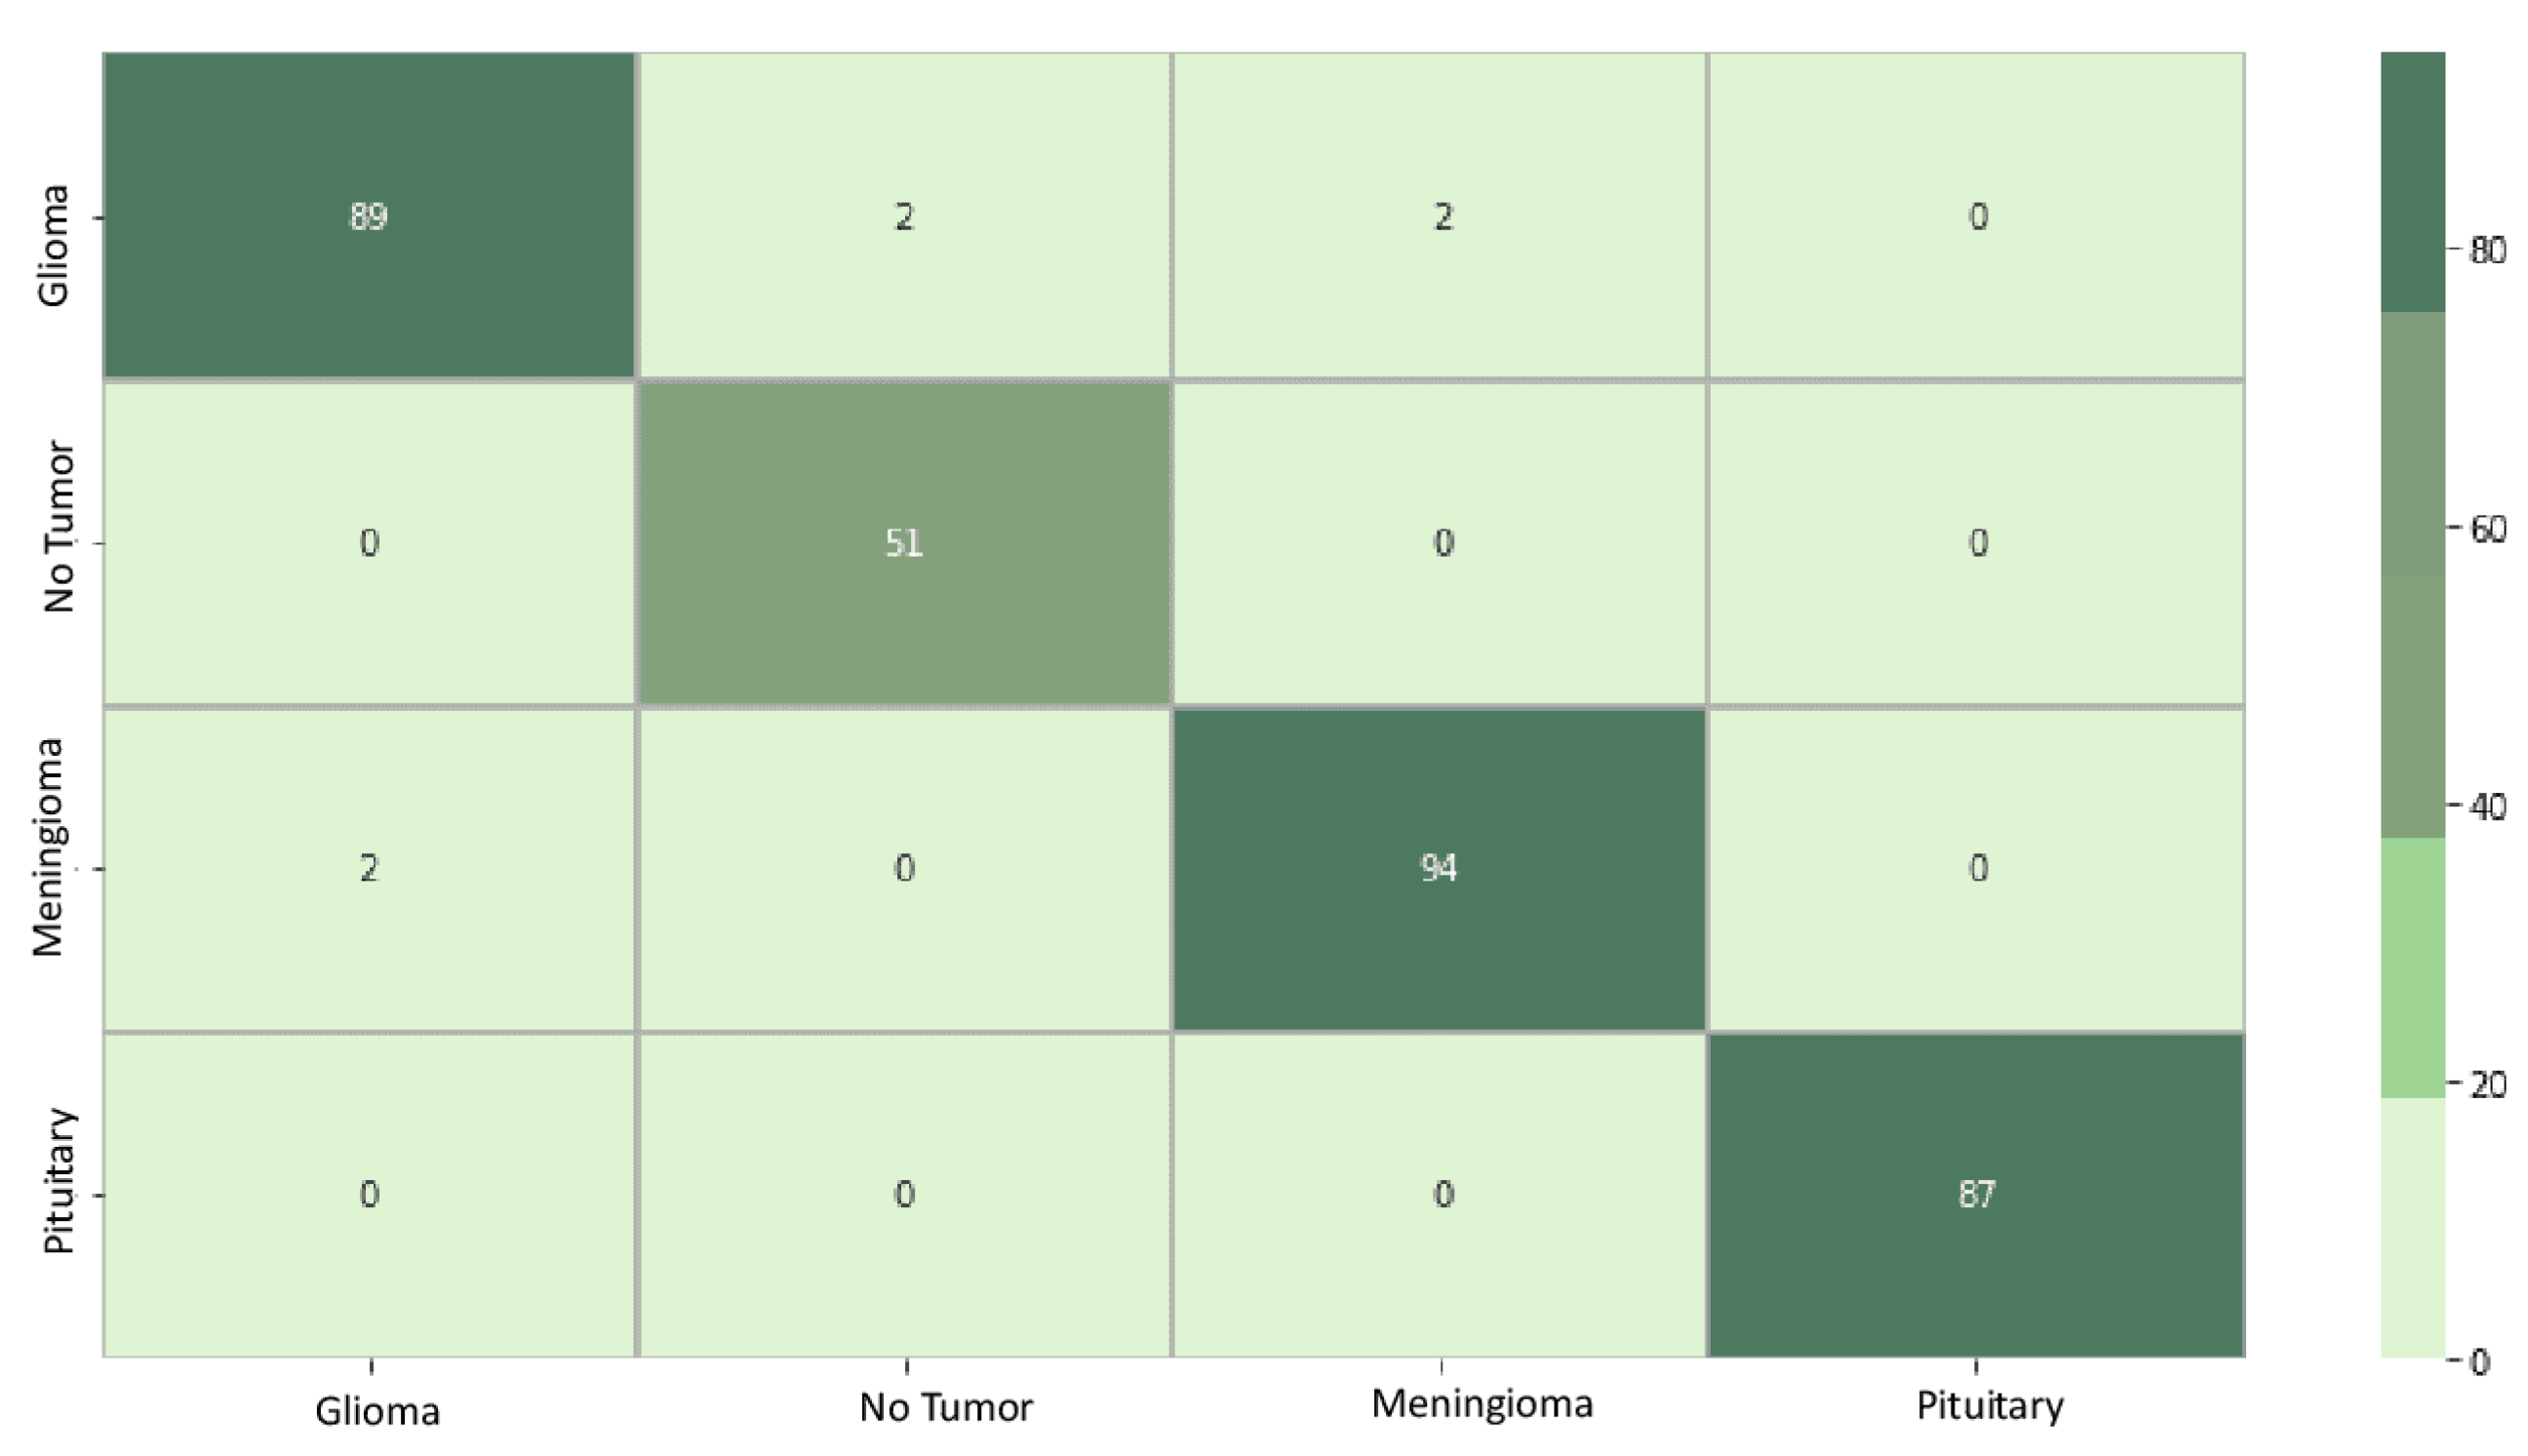
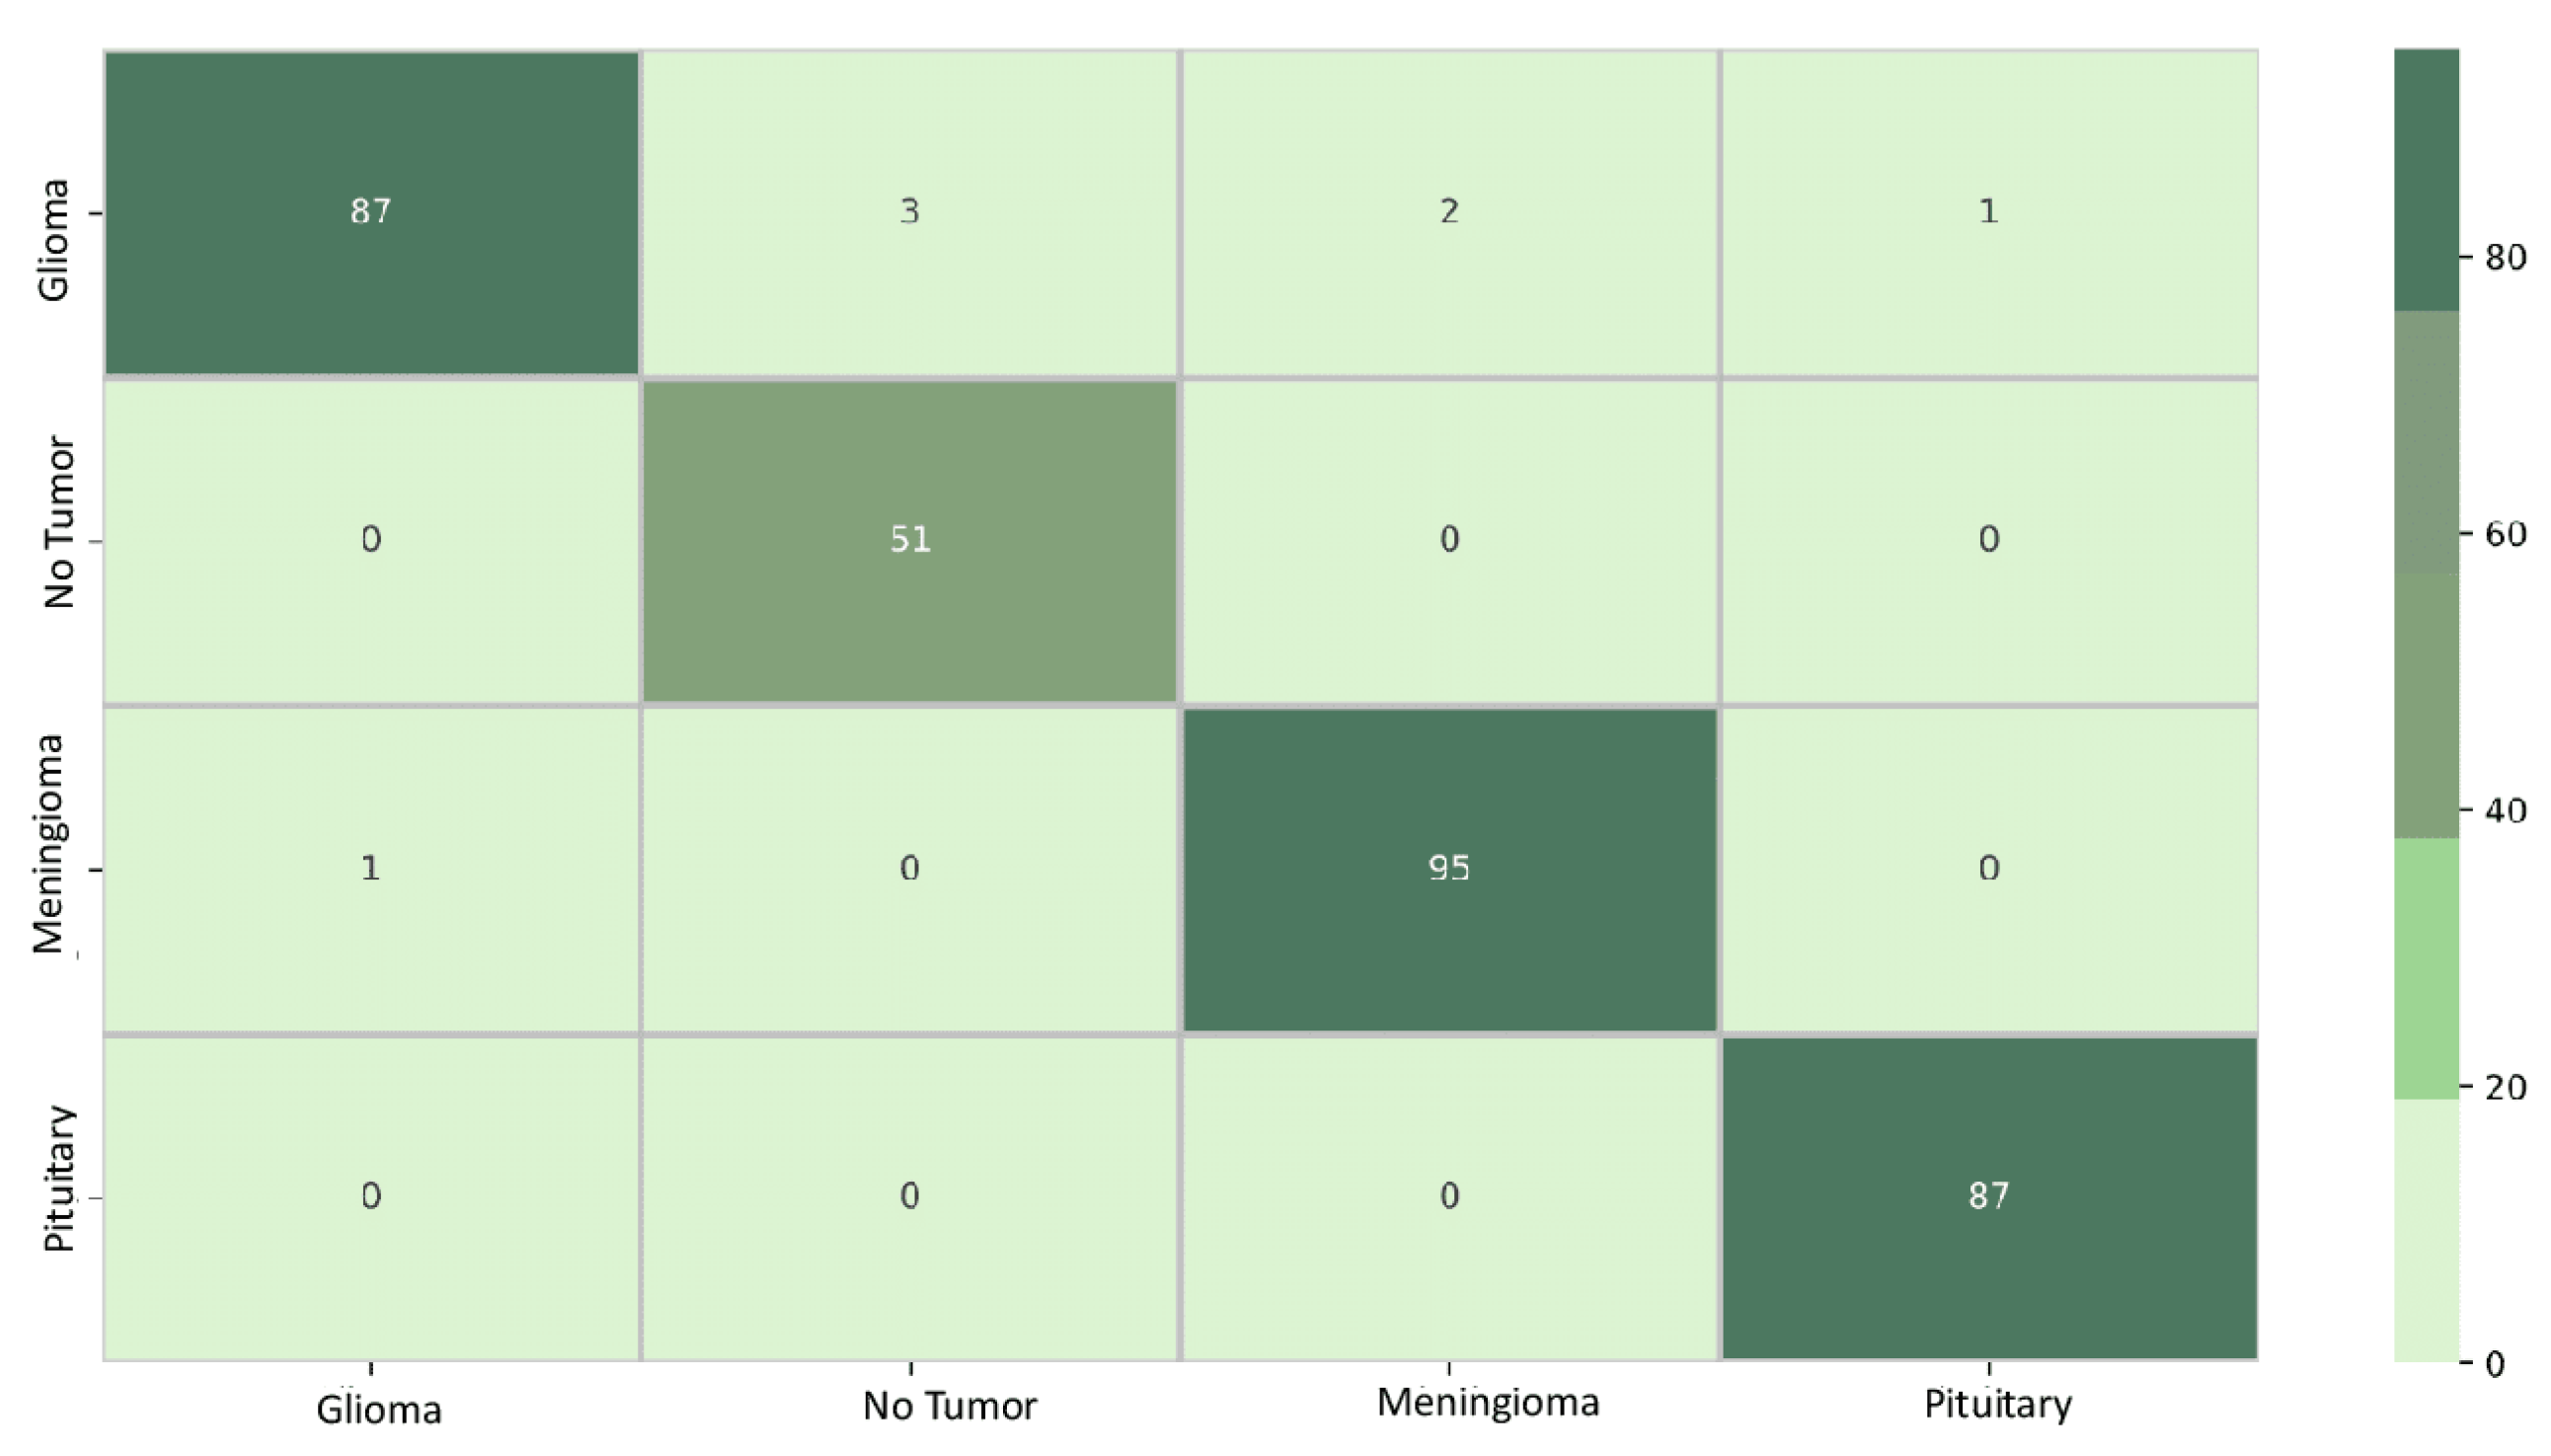
5.3. Classification Results

The detailed training outcomes are presented in Table 2 and visually represented in Figure 5. Moving on to the test results, a summary is provided in Table 3, and Figure 6 visually highlights the superior performance of the best model.
This section also undertakes a thorough analysis and interpretation of the confusion matrix derived from the classification. A detailed examination follows, shedding light on the interpretability results. Specifically, results for adaptive path-based techniques, such as Grad-CAM, Grad-CAM++, IG, and Saliency Mapping, are discussed in depth.
The training outcomes, as detailed in Table 2, offer insights into the model’s ability to learn from the training data. High training accuracy and low training loss often signify successful training, yet these metrics may not necessarily ensure performance on the test data. Among the models investigated in this study, DenseNet121, EfficientNetB0, GoogLeNet, Inception V3, ResNet50, and Xception stood out with an acceptable training accuracy, ranging from 99.86% to 100%. These high accuracy scores indicate that these models have effectively learned the statistical regularities present in the training data. Furthermore, the associated training loss values were remarkably low, showcasing the models’ efficiency in minimizing errors during the training phase. It is imperative to note that achieving high training accuracy does not necessarily guarantee superior performance on unseen datasets, emphasizing the importance of the comprehensive evaluation of the test data for a more robust assessment of model generalization.
In contrast, models with notably lower training accuracy, spanning from 74.84% to 87.63%, such as AlexNet, VGG16, VGG19, and Vision Transformer, while still demonstrating commendable performance on the training data, exhibited comparatively higher training loss values. This suggests a slightly higher level of modeling error during the learning process for these models. The inferior performance of VGG16, VGG19, ViT Transformer, and AlexNet may be due to a combination of huge parameter counts and excessive model complexity, which may not be adequately aligned with the task’s features. To increase the generalization capacity of these models, regularization strategies like dropout or batch normalization may need to be further refined or optimized, as well as further data augmentation.
The classification results, as detailed in Table 3, provide valuable insights into the model’s capability to classify the test data; it became evident that EfficientNetB0 emerged as the superior model among all those considered in this study. Upon closer examination of the results, it was apparent that some of the models may not be suited for this specific task, with some requiring more computational resources due to higher parameter counts, as observed in VGG16 and VGG19.
Figure 6 compares the 10 deep learning models used in this study, highlighting each model’s performance across key criteria such as accuracy, precision, recall, and F1 score percentages. This graphical representation offers a concise summary of these models’ effectiveness in classifying brain tumors from MRI images, enabling a quick and informative comparison. EfficientNetB0, exhibiting the best performance, showed great promise and warrants further consideration.
Figure 7 displays the confusion matrix for the EfficientNetB0 model. The diagonal elements represent samples that were accurately predicted. Out of the total of 327 samples, 321 were predicted correctly, resulting in an overall accuracy of 98%. The element in row 1 and column 2, a value of 2, indicates that EfficientNetB0 incorrectly learned the classification boundary between classes 1 and 2. This implies that the model confused data initially belonging to class 2 with class 1. Conversely, the element in row 4 and column 1, a value of 0, signifies that the classification boundary between classes 1 and 4 was correctly learned by EfficientNetB0, and the model did not confuse data initially belonging to class 4 with class 1.
For the model DenseNet121 in Figure 8, the confusion matrix shows that, out of the total of 327 samples, 320 were accurately predicted, resulting in an overall accuracy of 97%. The value 3 in row 1 and column 2 indicates that the classification boundary between classes 1 and 2 was incorrectly learned by DenseNet121, suggesting that the model confused data initially belonging to class 2 with class 1. Similarly, the presence of 0 in row 2 and column 1 implies that the classification boundary between classes 2 and 1 was correctly learned by DenseNet121, and the model did not confuse data initially belonging to class 1 with class 2.
Figure 9 depicts the confusion matrix for the model Xception. Out of the total of 327 samples, 315 were accurately predicted, resulting in an overall accuracy of 96%. The value of 1 in row 1 and column 2 indicates that the classification boundary between classes 1 and 2 was incorrectly learned by Xception, suggesting that the model confused data initially belonging to class 2 with class 1. Additionally, the presence of 0 in row 1 and column 4 signifies that the classification boundary between classes 1 and 4 was correctly learned by Xception, and the model did not confuse data initially belonging to class 4 with class 1.

5.4. Interpretability Results

In Figure 10, Figure 11 and Figure 12, we present a detailed look into the explainability results of our top-performing models: EfficientNetB0, DenseNet121, and Xception. Figure 10 provides insights into the interpretability of EfficientNetB0, highlighting crucial image regions using techniques such as Grad-CAM, Grad-CAM++, IGs, and Saliency Mapping. Moving to Figure 11, we explore the explainability of DenseNet121, our second-best model, uncovering the significant features influencing its predictions. Figure 12 reveals the interpretability degrees of Xception, our third-best model, showcasing the impact of various image regions on the classification decisions. These visualizations offer a transparent view into the decision-making processes of our models, facilitating understanding and trust.
Based on our obtained results, both the Grad-CAM and Grad-CAM++ methods demonstrated similar outcomes, offering visual explanations for the decision-making processes of EfficientNetB0, DenseNet121, and Xception in predicting brain tumors. These methods accurately pinpointed the exact location of the tumor, and the visualizations generated by both approaches closely aligned, suggesting a consistent portrayal of the crucial regions or features influencing the model’s predictions. However, it is essential to note that IG faced challenges in precisely pinpointing the tumor’s location, and Saliency Mapping exhibited some noise. Despite these challenges, both Grad-CAM and Grad-CAM++ consistently provided excellent visual explanations for the decision processes of EfficientNetB0, DenseNet121, and Xception, significantly enhancing our understanding of their predictive mechanisms.
In the case of “no tumor”, the presence of a red cloud color, though less intense and more centralized compared to images with tumors, indicates that features associated with the absence of tumors are faint and centered in the image. This insight provides clarity on how the deep learning model interprets images without tumors.

5.5. Discussion

The findings of evaluating the performance of different DL models provide intriguing new information on the relationship between total accuracy and model complexity, which is reflected by the number of parameters shown in Table 2. EfficientNetB0, DenseNet121, and Xception showed impressive accuracy values of 97-98% with much fewer parameters, indicating how well they use information for the tasks at hand. On the other hand, the accuracy was about 85% for VGG16 and VGG19, which have importantly greater parameter counts of more than 138 million. There is a clear exchange between model accuracy and complexity, highlighting the necessity of striking a balance. Interestingly, models with a reasonable amount of parameters, such as AlexNet, ResNet50, GoogLeNet, and Xception, achieved competitive accuracy in the 80-96% range, striking a medium ground. Even with a low number of parameters, the ViT Transformer showed greater accuracy variability, highlighting the impact of the architectural design on model performance.
Grad-CAM, Grad-CAM++, IG, and Saliency Mapping showed important areas that matched the glioma, meningioma, and pituitary classifications. What stood out was the remarkable similarity in the outcomes between the Grad-CAM and Grad-CAM++ methods, precisely pinpointing tumor locations. This consistency paints a clear picture of the essential regions influencing predictions across all three models; see Figure 10, Figure 11 and Figure 12. These visualizations played a crucial role, not just in making our models transparent, but also in fostering a deeper understanding and instilling trust in how the decisions were made. Our contributions are outlined as follows:
  • Model evaluation: The study comprehensively assesses various DL architectures, providing valuable insights into which models are most effective for brain tumor classification. This evaluation is crucial for guiding the selection of appropriate models in real-world medical imaging applications.
  • Brain tumor diagnosis: Diagnosing a brain tumor is a challenging process that requires the correct and rapid examination of MRI scan images. The study’s findings directly contribute to enhancing the accuracy and reliability of DL models for identifying brain tumors, focusing on this specific medical area. This is critical for early diagnosis and treatment planning for patients.
  • Model interpretability: The incorporation of explainability approaches, such as Grad-CAM, Grad-CAM++, IG, and Saliency Mapping, represents a significant scientific contribution. By using these methods, the study increases the interpretability of DL models, shedding light on the decision-making processes and providing valuable intuition into how these models arrive at their classifications, particularly in the context of brain tumor diagnosis.

6. Conclusions

In essence, the objective of this investigation was to assess the proficiency of diverse DL models in categorizing brain tumors. Following a series of comprehensive experiments and detailed analysis, it became apparent that these models exhibited varying degrees of competence for the assigned task. Models such as DenseNet121, EfficientNetB0, ResNet50 GoogLeNet, and Inception V3 distinguished themselves as top performers with almost flawless levels of accuracy, precision, recall, and F1 scores. For detailed classification results, refer to Table 3. Conversely, AlexNet and the innovative ViT Transformer, a recent contender in the field, displayed potential, but fell behind in terms of accuracy and achieving an optimal equilibrium between precision and recall. This research accentuates the significance of carefully selecting the most suitable DL model that aligns with the specific requirements of the application. It further underscores how advancements in neural network architectures, exemplified by the ViT Transformer, persist in shaping the field of DL and computer vision, presenting captivating prospects for future advancements.
In summary, both Grad-CAM and Grad-CAM++ consistently provided a more acceptable insight into model interpretability compared to other methods tested in our study. Put simply, these methods precisely revealed the location of tumors, significantly enhancing our understanding of how DL models make decisions in classifying brain tumors. Therefore, it can be concluded that Grad-CAM’s and Grad-CAM++’s heatmaps have improved our interpretative accuracy, playing a pivotal role in refining our understanding of DL model decision-making processes. These methodologies have been instrumental in enhancing the precision of our interpretations. This study contributes to selecting the correct DL model for brain tumor classification tasks while shedding light on ongoing challenges in making these models transparent and interpretable. However, further extensive work could be carried out to compare correlation measures and feature localization precision among the different studied models.

Author Contributions

Conceptualization: W.N., M.A. and J.-C.N.; methodology: W.N. and M.A.; software: W.N., M.A. and Y.B.; validation: M.A., Y.B. and J.-C.N.; writing—original draft preparation: W.N., M.A. and J.-C.N.; writing—review and editing: W.N., M.A., Y.B. and J.-C.N.; supervision: M.A. and J.-C.N.; funding: W.N. and J.-C.N. All authors have read and agreed to the published version of the manuscript.

Funding

This research received no external funding.

Institutional Review Board Statement

Not applicable.

Informed Consent Statement

Not applicable.

Data Availability Statement

Publicly available datasets were analyzed in this study. These data can be found at https://www.kaggle.com/datasets/sartajbhuvaji/brain-tumor-classification-mri (accessed on 20 July 2023).

Conflicts of Interest

The authors declare no conflicts of interest.

Abbreviations

The following abbreviations are used in this manuscript:
AbbreviationExpansion
CNNConvolutional Neural Network
CTComputed Tomography
DLDeep Learning
DeconvNETDeconvolution NETwork
DeepLIFTDeep Learning Important Features
F1 ScoreHarmonic Precision–Recall Mean
Grad-CAMGradient-weighted Class Activation Mapping
GBPGuided Back Propagation
LRPLayerwise Relevance Propagation
MRIMagnetic Resonance Imaging
ReLURectified Linear Unit
SHAPSHapley Additive exPlanation
TLTransfer Learning
VGGVisual Geometry Group
XAIExplainable Artificial Intelligence

References

  1. Bau, D.; Zhou, B.; Khosla, A.; Oliva, A.; Torralba, A. Network dissection: Quantifying interpretability of deep visual representations. In Proceedings of the IEEE Conference on Computer Vision and Pattern Recognition, Honolulu, HI, USA, 21–26 July 2017; pp. 6541–6549. [Google Scholar]
  2. Abiwinanda, N.; Hanif, M.; Hesaputra, S.T.; Handayani, A.; Mengko, T.R. Brain tumor classification using convolutional neural network. In Proceedings of the World Congress on Medical Physics and Biomedical Engineering 2018, Prague, Czech Republic, 3–8 June 2018; Volume 1, pp. 183–189. [Google Scholar]
  3. Latif, G.; Butt, M.M.; Khan, A.H.; Butt, O.; Iskandar, D.A. Multiclass brain Glioma tumor classification using block-based 3D Wavelet features of MR images. In Proceedings of the 2017 4th International Conference on Electrical and Electronic Engineering (ICEEE), Ankara, Turkey, 8–10 April 2017; pp. 333–337. [Google Scholar]
  4. Fukushima, K. Neocognitron: A self-organizing neural network model for a mechanism of pattern recognition unaffected by shift in position. Biol. Cybern. 1980, 36, 193–202. [Google Scholar] [CrossRef]
  5. Brima, Y.; Atemkeng, M. Visual Interpretable and Explainable Deep Learning Models for Brain Tumor MRI and COVID-19 Chest X-ray Images. arXiv 2022, arXiv:2208.00953. [Google Scholar]
  6. Ebiele, J.; Ansah-Narh, T.; Djiokap, S.; Proven-Adzri, E.; Atemkeng, M. Conventional machine learning based on feature engineering for detecting pneumonia from chest X-rays. In Proceedings of the Conference of the South African Institute of Computer Scientists and Information Technologists 2020, Cape Town, South Africa, 14–16 September 2020; pp. 149–155. [Google Scholar]
  7. Brima, Y.; Atemkeng, M.; Tankio Djiokap, S.; Ebiele, J.; Tchakounté, F. Transfer learning for the detection and diagnosis of types of pneumonia including pneumonia induced by COVID-19 from chest X-ray images. Diagnostics 2021, 11, 1480. [Google Scholar] [CrossRef] [PubMed]
  8. Chattopadhay, A.; Sarkar, A.; Howlader, P.; Balasubramanian, V.N. Grad-CAM++: Generalized gradient-based visual explanations for deep convolutional networks. In Proceedings of the 2018 IEEE Winter Conference on Applications of Computer Vision (WACV), Lake Tahoe, NV, USA, 12–15 March 2018; pp. 839–847. [Google Scholar]
  9. Selvaraju, R.R.; Cogswell, M.; Das, A.; Vedantam, R.; Parikh, D.; Batra, D. Grad-CAM: Visual explanations from deep networks via gradient-based localization. In Proceedings of the IEEE International Conference on Computer Vision, Venice, Italy, 22–29 October 2017; pp. 618–626. [Google Scholar]
  10. Sundararajan, M.; Taly, A.; Yan, Q. Axiomatic attribution for deep networks. In Proceedings of the International Conference on Machine Learning, Sydney, Australia, 6–11 August 2017; pp. 3319–3328. [Google Scholar]
  11. Zhang, Y.; Dong, Z.; Wu, L.; Wang, S.; Zhou, Z. Feature extraction of brain MRI by stationary wavelet transform. In Proceedings of the 2010 International Conference on Biomedical Engineering and Computer Science, Wuhan, China, 23–25 April 2010; pp. 1–4. [Google Scholar]
  12. Zeineldin, R.A.; Karar, M.E.; Elshaer, Z.; Coburger, J.; Wirtz, C.R.; Burgert, O.; Mathis-Ullrich, F. Explainability of deep neural networks for MRI analysis of brain tumors. Int. J. Comput. Assist. Radiol. Surg. 2022, 17, 1673–1683. [Google Scholar] [CrossRef]
  13. Philbrick, K.A.; Yoshida, K.; Inoue, D.; Akkus, Z.; Kline, T.L.; Weston, A.D.; Korfiatis, P.; Takahashi, N.; Erickson, B.J. What does deep learning see? Insights from a classifier trained to predict contrast enhancement phase from CT images. AJR Am. J. Roentgenol. 2018, 211, 1184–1193. [Google Scholar] [CrossRef] [PubMed]
  14. Martí-Juan, G.; Frías, M.; Garcia-Vidal, A.; Vidal-Jordana, A.; Alberich, M.; Calderon, W.; Piella, G.; Camara, O.; Montalban, X.; Sastre-Garriga, J.; et al. Detection of lesions in the optic nerve with magnetic resonance imaging using a 3D convolutional neural network. Neuroimage Clin. 2022, 36, 103187. [Google Scholar] [CrossRef] [PubMed]
  15. Zeiler, M.; Fergus, R. Visualizing and understanding convolutional networks. arXiv 2013, arXiv:1311.2901. [Google Scholar] [CrossRef]
  16. Chatterjee, S.; Das, A.; Mandal, C.; Mukhopadhyay, B.; Vipinraj, M.; Shukla, A.; Nagaraja Rao, R.; Sarasaen, C.; Speck, O.; Nürnberger, A. TorchEsegeta: Framework for interpretability and explainability of image-based deep learning models. Appl. Sci. 2022, 12, 1834. [Google Scholar] [CrossRef]
  17. Springenberg, J.; Dosovitskiy, A.; Brox, T.; Riedmiller, M. Striving for simplicity: The all convolutional net. arXiv 2014, arXiv:1412.6806. [Google Scholar] [CrossRef]
  18. Wood, D.A.; Kafiabadi, S.; Al Busaidi, A.; Guilhem, E.; Montvila, A.; Lynch, J.; Townend, M.; Agarwal, S.; Mazumder, A.; Barker, G.J. Deep learning models for triaging hospital head MRI examinations. Med. Image Anal. 2022, 78, 102391. [Google Scholar] [CrossRef]
  19. Saleem, H.; Shahid, A.R.; Raza, B. Visual interpretability in 3D brain tumor segmentation network. Comput. Biol. Med. 2021, 133, 104410. [Google Scholar] [CrossRef] [PubMed]
  20. Montavon, G.; Binder, A.; Lapuschkin, S.; Samek, W.; Müller, K.-R. Layer-wise relevance propagation: An overview In Explainable AI: Interpreting, Explaining and Visualizing Deep Learning; Samek, W., Montavon, G., Vedaldi, A., Hansen, L., Müller, K.R., Eds.; Lecture notes in computer science; Springer: Cham, Switzerland, 2019; pp. 193–209. [Google Scholar]
  21. Golla, A.K.; Tönnes, C.; Russ, T.; Bauer, D.F.; Froelich, M.F.; Diehl, S.J.; Schoenberg, S.O.; Keese, M.; Schad, L.R.; Zöllner, F.G.; et al. Automated screening for abdominal aortic aneurysm in CT scans under clinical conditions using deep learning. Diagnostics 2021, 11, 2131. [Google Scholar] [CrossRef] [PubMed]
  22. Shi, W.; Tong, L.; Zhu, Y.; Wang, M.D. COVID-19 automatic diagnosis with radiographic imaging: Explainable attention transfer deep neural networks. IEEE J. Biomed. Health Inform. 2021, 25, 2376–2387. [Google Scholar] [CrossRef] [PubMed]
  23. Karim, M.R.; Jiao, J.; Doehmen, T.; Cochez, M.; Beyan, O.; Rebholz-Schuhmann, D.; Decker, S. DeepKneeExplainer: Explainable knee osteoarthritis diagnosis from radiographs and magnetic resonance imaging. IEEE Access. 2021, 9, 39757–39780. [Google Scholar] [CrossRef]
  24. Lopatina, A.; Ropele, S.; Sibgatulin, R.; Reichenbach, J.R.; Güllmar, D. Investigation of deep-learning-driven identification of multiple sclerosis patients based on susceptibility-weighted images using relevance analysis. Front. Neurosci. 2020, 14, 609468. [Google Scholar] [CrossRef] [PubMed]
  25. Shrikumar, A.; Greenside, P.; Kundaje, A. Learning important features through propagating activation differences. arXiv 2017, arXiv:1704.02685. [Google Scholar] [CrossRef]
  26. Gulum, M.A.; Trombley, C.M.; Kantardzic, M. A review of explainable deep learning cancer detection models in medical imaging. Appl. Sci. 2021, 11, 4573. [Google Scholar] [CrossRef]
  27. Singh, A.; Sengupta, S.; Lakshminarayanan, V. Explainable deep learning models in medical image analysis. J. Imaging 2020, 6, 52. [Google Scholar] [CrossRef]
  28. Wang, C.; Ma, J.; Shao, J.; Zhang, S.; Li, W. Predicting EGFR and PD-L1 status in NSCLC patients using multitask AI system based on CT images. Front. Immunol. 2022, 13, 813072. [Google Scholar] [CrossRef]
  29. Kumar, A.; Manikandan, R.; Kose, U.; Gupta, D.; Satapathy, S.C. Doctor’s dilemma: Evaluating an explainable subtractive spatial lightweight convolutional neural network for brain tumor diagnosis. ACM Trans. Multimed. Comput. Commun. Appl. 2021, 17, 1–26. [Google Scholar] [CrossRef]
  30. Uyulan, C.; Erguzel, T.T.; Turk, O.; Farhad, S.; Metin, B.; Tarhan, N. A class activation map-based interpretable transfer learning model for automated detection of ADHD from fMRI data. Clin. EEG Neurosci. 2022, 54, 151–159. [Google Scholar] [CrossRef] [PubMed]
  31. Wang, C.J.; Hamm, C.A.; Savic, L.J.; Ferrante, M.; Schobert, I.; Schlachter, T.; Lin, M.; Weinreb, J.C.; Duncan, J.S.; Chapiro, J.; et al. Deep learning for liver tumor diagnosis part II: Convolutional neural network interpretation using radiologic imaging features. Eur. Radiol. 2019, 29, 3348–3357. [Google Scholar] [CrossRef] [PubMed]
  32. Akatsuka, J.; Yamamoto, Y.; Sekine, T.; Numata, Y.; Morikawa, H.; Tsutsumi, K.; Yanagi, M.; Endo, Y.; Takeda, H.; Hayashi, T. Illuminating clues of cancer buried in prostate MR image: Deep learning and expert approaches. Biomolecules 2019, 9, 673. [Google Scholar] [CrossRef] [PubMed]
  33. Fuhrman, J.D.; Gorre, N.; Hu, Q.; Li, H.; El Naqa, I.; Giger, M.L. A review of explainable and interpretable AI with applications in COVID-19 imaging. Med. Phys. 2022, 49, 1–14. [Google Scholar] [CrossRef] [PubMed]
  34. Alshazly, H.; Linse, C.; Barth, E.; Martinetz, T. Explainable COVID-19 detection using chest CT scans and deep learning. Sensors 2021, 21, 455. [Google Scholar] [CrossRef] [PubMed]
  35. Hao, J.; Xie, J.; Liu, R.; Hao, H.; Ma, Y.; Yan, K.; Liu, R.; Zheng, Y.; Zheng, J.; Liu, J.; et al. Automatic sequence-based network for lung diseases detection in chest CT. Front. Oncol. 2021, 11, 781798. [Google Scholar] [CrossRef] [PubMed]
  36. Lahsaini, I.; El Habib Daho, M.; Chikh, M.A. Deep transfer learning based classification model for COVID-19 using chest CT-scans. Pattern Recognit Lett. 2021, 152, 122–128. [Google Scholar] [CrossRef] [PubMed]
  37. Garg, A.; Salehi, S.; Rocca, M.; Garner, R.; Duncan, D. Efficient and visualizable convolutional neural networks for COVID-19 classification using chest CT. Expert Syst. Appl. 2022, 195, 116540. [Google Scholar] [CrossRef]
  38. Ullah, F.; Moon, J.; Naeem, H.; Jabbar, S. Explainable artificial intelligence approach in combating real-time surveillance of COVID19 pandemic from CT scan and X-ray images using ensemble model. J. Supercomput. 2022, 78, 19246–19271. [Google Scholar] [CrossRef]
  39. Lu, S.Y.; Zhang, Z.; Zhang, Y.D.; Wang, S.H. CGENet: A deep graph model for COVID-19 detection based on chest CT. Biology 2022, 11, 33. [Google Scholar] [CrossRef]
  40. Jadhav, S.; Deng, G.; Zawin, M.; Kaufman, A.E. COVID-view: Diagnosis of COVID-19 using chest CT. IEEE Trans. Vis. Comput. Graph. 2022, 28, 227–237. [Google Scholar] [CrossRef] [PubMed]
  41. Nagaoka, T.; Kozuka, T.; Yamada, T.; Habe, H.; Nemoto, M.; Tada, M.; Abe, K.; Handa, H.; Yoshida, H.; Ishii, K.; et al. A deep learning system to diagnose COVID-19 pneumonia using masked lung CT images to avoid AI-generated COVID-19 diagnoses that include data outside the lungs. Adv. Biomed. Eng. 2022, 11, 76–86. [Google Scholar] [CrossRef]
  42. Suri, J.S.; Agarwal, S.; Chabert, G.L.; Carriero, A.; Paschè, A.; Danna, P.S.; Saba, L.; Mehmedović, A.; Faa, G.; Singh, I.M.; et al. COVLIAS 20-cXAI: Cloud-based explainable deep learning system for COVID-19 lesion localization in computed tomography scans. Diagnostics 2022, 12, 1482. [Google Scholar] [CrossRef] [PubMed]
  43. Pennisi, M.; Kavasidis, I.; Spampinato, C.; Schinina, V.; Palazzo, S.; Salanitri, F.P.; Bellitto, G.; Rundo, F.; Aldinucci, M.; Cristofaro, M.; et al. An explainable AI system for automated COVID-19 assessment and lesion categorization from CT-scans. Artif. Intell. Med. 2021, 118, 102114. [Google Scholar] [CrossRef] [PubMed]
  44. Huang, G.; Liu, Z.; Maaten, L.V.D.; Weinberger, K.Q. Densely Connected Convolutional Networks. In Proceedings of the 2017 IEEE Conference on Computer Vision and Pattern Recognition (CVPR), Honolulu, HI, USA, 21–26 July 2017; pp. 4700–4708. [Google Scholar] [CrossRef]
  45. Li, C.F.; Xu, Y.D.; Ding, X.H.; Zhao, J.J.; Du, R.Q.; Wu, L.Z.; Sun, W.P. MultiR-net: A novel joint learning network for COVID-19 segmentation and classification. Comput. Biol. Med. 2022, 144, 105340. [Google Scholar] [CrossRef] [PubMed]
  46. Williamson, B.J.; Khandwala, V.; Wang, D.; Maloney, T.; Sucharew, H.; Horn, P.; Haverbusch, M.; Alwell, K.; Gangatirkar, S.; Mahammedi, A.; et al. Automated grading of enlarged perivascular spaces in clinical imaging data of an acute stroke cohort using an interpretable, 3D deep learning framework. Sci. Rep. 2022, 12, 788. [Google Scholar] [CrossRef] [PubMed]
  47. Kim, K.H.; Koo, H.W.; Lee, B.J.; Yoon, S.W.; Sohn, M.J. Cerebral hemorrhage detection and localization with medical imaging for cerebrovascular disease diagnosis and treatment using explainable deep learning. J. Korean Phys. Soc. 2021, 79, 321–327. [Google Scholar] [CrossRef]
  48. Singh, A.; Kwiecinski, J.; Miller, R.J.; Otaki, Y.; Kavanagh, P.B.; Van Kriekinge, S.D.; Parekh, T.; Gransar, H.; Pieszko, K.; Killekar, A.; et al. Deep learning for explainable estimation of mortality risk from myocardial positron emission tomography images. Circ. Cardiovasc. Imaging 2022, 15, e014526. [Google Scholar] [CrossRef]
  49. Jain, V.; Nankar, O.; Jerrish, D.J.; Gite, S.; Patil, S.; Kotecha, K. A novel AI-based system for detection and severity prediction of dementia using MRI. IEEE Access. 2021, 9, 154324–154346. [Google Scholar] [CrossRef]
  50. Hu, M.; Qian, X.; Liu, S.; Koh, A.J.; Sim, K.; Jiang, X.; Guan, C.; Zhou, J.H. Structural and diffusion MRI based schizophrenia classification using 2D pretrained and 3D naive convolutional neural networks. Schizophr. Res. 2022, 243, 330–341. [Google Scholar] [CrossRef]
  51. Zhang, X.; Han, L.; Zhu, W.; Sun, L.; Zhang, D. An explainable 3D residual self-attention deep neural network for joint atrophy localization and Alzheimer’s disease diagnosis using structural MRI. IEEE J. Biomed. Health Inform. 2021, 26, 5289–5297. [Google Scholar] [CrossRef] [PubMed]
  52. Simonyan, K.; Vedaldi, A.; Zisserman, A. Deep inside convolutional networks: Visualising image classification models and saliency maps. arXiv 2013, arXiv:1312.6034. [Google Scholar]
  53. Krizhevsky, A.; Sutskever, I.; Hinton, G.E. ImageNet classification with deep convolutional neural networks. Proc. Adv. Neural Inf. Process. Syst. 2012, 25, 1–9. [Google Scholar] [CrossRef]
  54. Mascarenhas, S.; Agarwal, M. A comparison between VGG16, VGG19 and ResNet50 architecture frameworks for Image Classification. In Proceedings of the 2021 International Conference on Disruptive Technologies for Multi-Disciplinary Research and Applications (CENTCON), Bengaluru, India, 19–21 November 2021; Volume 1, pp. 96–99. [Google Scholar]
  55. Chollet, F. Xception: Deep Learning with Depthwise Separable Convolutions. In Proceedings of the IEEE Conference on Computer Vision and Pattern Recognition, Washington, DC, USA, 19–24 June 2016; pp. 1610–2357. [Google Scholar]
  56. Simonyan, K.; Zisserman, A. Very deep convolutional networks for large-scale image recognition. arXiv 2014, arXiv:1409.1556. [Google Scholar]
  57. Szegedy, C.; Liu, W.; Jia, Y.; Sermanet, P.; Reed, S.; Anguelov, D.; Erhan, D.; Vanhoucke, V.; Rabinovich, A. Going deeper with convolutions. In Proceedings of the IEEE Conference on Computer Vision and Pattern Recognition, Boston, MA, USA, 7–12 June 2015; pp. 1–9. [Google Scholar]
  58. Szegedy, C.; Vanhoucke, V.; Ioffe, S.; Shlens, J.; Wojna, Z. Rethinking the inception architecture for computer vision. In Proceedings of the IEEE Conference on Computer Vision and Pattern Recognition, Washington, DC, USA, 19–24 June 2016; pp. 2818–2826. [Google Scholar]
  59. Tan, M.; Le, Q. Efficientnet: Rethinking model scaling for convolutional neural networks. In Proceedings of the International Conference on Machine Learning, PMLR, Beach, CA, USA, 9–15 June 2019; pp. 6105–6114. [Google Scholar]
  60. Dosovitskiy, A.; Beyer, L.; Kolesnikov, A.; Weissenborn, D.; Zhai, X.; Unterthiner, T.; Dehghani, M.; Minderer, M.; Heigold, G.; Gelly, S.; et al. An image is worth 16 × 16 words: Transformers for image recognition at scale. arXiv 2020, arXiv:2010.11929. [Google Scholar]
  61. Islam, M.N.; Hasan, M.; Hossain, M.K.; Alam, M.G.R.; Uddin, M.Z.; Soylu, A. Vision Transformer and explainable transfer learning models for auto detection of kidney cyst, stone and tumor from CT-radiography. Sci. Rep. 2022, 12, 11440. [Google Scholar] [CrossRef]
  62. Bhuvaji, S.; Kadam, A.; Bhumkar, P.; Dedge, S. Brain Tumor Classification (MRI) Kaggle Dataset. Available online: https://www.kaggle.com/datasets/sartajbhuvaji/brain-tumor-classification-mri/data (accessed on 20 July 2023).
Figure 1. Comprehensive framework for brain tumor classification that integrates classification and model explainability. Phase (a) involves integrating a Convolutional Neural Network (CNN) model with Transfer Learning (TL) for brain tumor classification based on MRI data. Pre-trained CNN features form the foundation, beneficial for scenarios with limited labeled data. Data undergo convolutional layers to capture intricate patterns and spatial hierarchies, followed by pooling for feature space reduction. Dense layers transform features for classification. Phase (b) employs explainability techniques (e.g., Grad-CAM, Grad-CAM++, IG, Saliency Mapping) to elucidate the CNN’s decision-making process, aiding medical expert understanding. These techniques visualize crucial regions in MRI images, highlight feature importance, and bridge the gap between DL predictions and human interpretability, fostering trust in medical applications.
Information 15 00182 g001
Figure 2. Sample of each image in the dataset. A glioma tumor image typically exhibits abnormal growth in the brain, indicating potential malignancy. No tumor images represent a healthy state without any abnormal growth or lesions. Meningioma tumor images showcase tumors arising from the meninges, the protective layers around the brain, and the spinal cord. Pituitary tumor images depict tumors in the pituitary gland, influencing hormone regulation and potentially affecting various bodily functions.
Information 15 00182 g002
Figure 3. Brain tumor distribution. This pie chart effectively visualizes the relative proportions of different brain tumor types, offering a clear and concise representation of the distribution within the studied sample. The dataset comprises 926 MRI images of glioma tumors, 500 images with no tumors, 901 images featuring pituitary tumors, and 937 images showing meningioma tumors.
Information 15 00182 g003
Figure 4. EfficientNetB0, DenseNet121, and Xception, during training and validation. The plots illustrate the training and validation loss, as well as the training and validation accuracy over multiple epochs.
Information 15 00182 g004
Figure 5. Training accuracy and loss are the two main keys that are shown in this figure, which shows the training outcomes of several models. A distinct DL model is represented by each bar in the plot, and the height of the bar indicates the model’s training accuracy. Additionally, the loss values for each model are displayed as a line plot superimposed on the same graph.
Information 15 00182 g005
Figure 6. Visualizing the comparison of different DL models to provide a clear overview of their performance. The main performance indicators used to assess the effectiveness of various models are highlighted in the legend. The top model is EfficientNetB0 due to its excellent results in accuracy, precision, recall, and F1 score, which demonstrate its ability to provide well-balanced and accurate predictions on the provided test dataset.
Information 15 00182 g006
Figure 7. EfficientNetB0 confusion matrix. The matrix systematically breaks down the model’s predictions, highlighting instances of true positives (correctly identified cases), true negatives (correctly rejected cases), false positives (incorrectly identified cases), and false negatives (missed cases) for each tumor class.
Information 15 00182 g007
Figure 8. DenseNet121 confusion matrix.
Information 15 00182 g008
Figure 9. Xception confusion matrix.
Information 15 00182 g009
Figure 10. EfficientNetB0 explainability: We used a variety of explainability approaches, such as Grad-CAM, Grad-CAM++, IG, and Saliency Mapping, in our evaluation of EfficientNetB0 for brain tumor classification. These techniques played an important role in assisting in identifying the specific regions in MRI scan images that corresponded to the tumor types such as glioma, meningioma, no tumor, and pituitary. By using these techniques, we were able to determine the critical locations for the categorization of each tumor type and obtain important insights into EfficientNetB0’s decision-making process.
Information 15 00182 g010
Figure 11. DenseNet121 explainability: We used a variety of explainability approaches, such as Grad-CAM, Grad-CAM++, IG, and Saliency Mapping, in our evaluation of DenseNet121 for brain tumor classification. These techniques played an important role in assisting in identifying the specific regions in MRI scan images that corresponded to the tumor types such as glioma, meningioma, no tumor, and pituitary. By using these techniques, we were able to determine the critical locations for the categorization of each tumor type and obtain important insights into DenseNet121’s decision-making process.
Information 15 00182 g011
Figure 12. Xception explainability: We used a variety of explainability approaches, such as Grad-CAM, Grad-CAM++, IG, and Saliency Mapping, in our evaluation of Xception for brain tumor classification. These techniques played an important role in assisting in identifying the specific regions in MRI scan images that corresponded to the tumor types such as glioma, meningioma, no tumor, and pituitary. By using these techniques, we were able to determine the critical locations for the categorization of each tumor type and obtain important insights into Xception’s decision-making process.
Information 15 00182 g012
Table 1. Training hyperparameters.
HyperparameterSetting
Batch size32
Learning rate 0.001
Epochs10
Training and validation split 90 %
Test split 10 %
OptimizerAdam
Input size 150 × 150 pixels
Loss functionCategorical cross-entropy
Table 2. Training results.
Model NameParametersTraining AccuracyLoss
AlexNet61.9 M0.87630.3233
DenseNet1218.1 M0.99860.0057
EfficientNetB05.3 M0.99910.0042
GoogLeNet11.2 M0.99970.0027
Inception V323.9 M0.99890.0084
ResNet5025.6 M0.99910.0044
VGG16138.4 M0.86980.4011
VGG19143.7 M0.85700.3953
Vision Transformer86 M0.74840.5115
Xception22.9 M1.00000.0021
Table 3. Test dataset classification results where various metrics are considered for each model.
Model NameAccuracy %Precision %Recall %F1 Score %
AlexNet78807777
DenseNet12197979797
EfficientNetB098989898
GoogLeNet91939292
Inception V396979696
ResNet5095969696
VGG1685858685
VGG1985858585
ViT Transformer70727270
Xception96979696
Disclaimer/Publisher’s Note: The statements, opinions and data contained in all publications are solely those of the individual author(s) and contributor(s) and not of MDPI and/or the editor(s). MDPI and/or the editor(s) disclaim responsibility for any injury to people or property resulting from any ideas, methods, instructions or products referred to in the content.

