
Modeling and Moderation of COVID-19 Social Network Chat
Department of Computer Science and Software Engineering, Université Laval, 2325 Rue de l’Université, Quebec, QC G1V 0A6, Canada
*
Author to whom correspondence should be addressed.
†
These authors contributed equally to this work.
Information 2023, 14(2), 124; https://doi.org/10.3390/info14020124
Submission received: 10 January 2023
/
Revised: 3 February 2023
/
Accepted: 10 February 2023
/
Published: 15 February 2023
(This article belongs to the Special Issue The Role of Social Media during the Ongoing Outbreaks of COVID-19 and Monkeypox: Applications, Use-Cases, Analytics, and Beyond)
Abstract
:Negative social media usage during the COVID-19 pandemic has highlighted the importance of understanding the spread of misinformation and toxicity in public online discussions. In this paper, we propose a novel unsupervised method to discover the structure of online COVID-19-related conversations. Our method trains a nine-state Hidden Markov Model (HMM) initialized from a biclustering of 23 features extracted from online messages. We apply our method to 16,000 conversations (1.5 million messages) that took place on the Facebook pages of 15 Canadian newspapers following COVID-19 news items, and show that it can effectively extract the conversation structure and discover the main themes of the messages. Furthermore, we demonstrate how the PageRank algorithm and the conversation graph discovered can be used to simulate the impact of five different moderation strategies, which makes it possible to easily develop and test new strategies to limit the spread of harmful messages. Although our work in this paper focuses on the COVID-19 pandemic, the methodology is general enough to be applied to handle communications during future pandemics and other crises, or to develop better practices for online community moderation in general.
1. Introduction
In late 2019, the first COVID-19 cases emerged in Wuhan, China. The virus then quickly spread to the rest of the world, prompting the World Health Organization (WHO) to classify COVID-19 as a global pandemic in March 2020 [1].
Adapting to the increasing proportion of people using social media as their main news source [2,3], official health authorities turned to online social networks (OSNs) to disseminate crucial COVID-19-related information and guidelines in order to combat the pandemic [4]. The sensitive nature of these announcements caused many users to engage in online conversations, sharing their opinions and personal experiences regarding the pandemic [5,6].
As these discussions often took place in public spaces, notably in the OSNs’ dedicated comment sections, many groups and users took advantage of this visibility in order to spread false information regarding COVID-19 and its vaccines [7,8] and to attack both health authorities and individual users promoting the vaccine and other preventive measures. Fueled by this misinformation, many users voiced their concerns regarding COVID-19 vaccines and other aspects of the pandemic. In particular, studies have shown that multiple COVID-19-related messages expressed worries about potential side-effects of the vaccines [7,9] as well as their efficiency and safety given their short development time [6,10]. Additionally, many conspiracy theories spread through these conversations, showing a clear lack of trust in the governments and in pharmaceutical companies [7,10]. A 2021 study directly linked misinformation with lower vaccine acceptance rates [11], adding to the list of negative consequences resulting from misinformation.
In addition to misinformation, COVID-19-related OSN messages often contained higher toxicity rates than other messages [12]. As a result, online discussions on these topics can quickly deteriorate, resulting in an overall unhealthy environment. Combined with misinformation, many users were negatively influenced, leading to increased vaccine hesitancy [6]. In response, some pro-vaccination groups began to direct insults and other negative messages towards anti-vaccination groups [10], which contributed to the cleavage between both groups, and pushed members of anti-vaccination groups further away from accepting any vaccine.
To limit the spread of misinformation and toxicity, OSN conversations need to be properly monitored and moderated. This can only be achieved by developing a strong understanding of how conversations are structured and how information flows through user interactions. Trends and patterns of harmful behaviors can be recognized from sequences of messages, and can in turn be used to anticipate and limit the propagation of harmful messages and misinformation.
In this study, our objective is to develop a methodology to discover meaningful thematic groups of messages and learn the structure of typical conversations in OSN comment sections. Achieving this objective will facilitate the analysis of communication behavior patterns and will make it possible to identify harmful interactions. This, in turn, will help develop and test various online moderation strategies to mitigate online harm.
Previous work often focuses on training supervised machine learning algorithms to recognize aspects of conversations. For example, Dutta and Das [13] trained a support vector machine (SVM) model to detect if pairs of Facebook comments were consecutive messages from the same conversation. Similarly, SVMs have been used in conjunction with Naïve Bayes classifiers by Brambilla et al. [14] in order to determine the latent meaning behind OSN comments, as well as the intentions of their authors. Paul and Gokhale [10] trained multiple supervised machine learning models (SVM, random forest, gradient boosting, multilayer perceptron and long short-term memory (LSTM) neural networks) to automatically differentiate between pro and anti-vaccination posts on Twitter. LSTM neural networks were also trained by Jelodar et al. [15] to detect the sentiments (positivity, negativity or neutrality) of COVID-19-related comments. The authors of Hayawi et al. [16] collected their own dataset of 15K COVID-19-related tweets and annotated them as either containing misinformation or not. They then used this dataset to train three different machine learning models to detect disinformation: gradient boosting, a LSTM neural network and a BERT model. The relationship between sentiment and opinion on COVID-19 vaccination was studied by Yousefinaghani et al. [17]. Using a dataset of 500k tweets, the authors used the VADER tool to detect message sentiment and keyword detection to capture opinion. They could then measure the trends of sentiment and opinion per region over time.
Unsupervised approaches to modeling OSN conversation structures have also been used in the past. In particular, auto-encoder neural networks are a pretty popular model choice. Zeng et al. [18] used variational auto-encoder (VAE) networks to simultaneously model intentions behind user messages in online conversations, as well as the topics of these conversations. A VAE network adapted to graph data was used by Xu et al. [19] with the goal of generating directed graphs capturing the structure and semantics of online conversations. Likewise, a recurrent variant to the VAE network, incorporating different types of attention layers, was used by Qiu et al. [20] in order to model the structure of online conversations. Bonifazi et al. [21] developed a method to represent OSN users and the interactions between them in the form of a massive multi-layer network. They applied their method on a dataset of COVID-19 vaccine-related tweets and analyzed the results to draw some interesting conclusions on the different Twitter behaviors of pro- and anti-vaccination users.
Hidden Markov models (HMMs) have also been commonly used in the past literature as unsupervised methods capable of capturing the structure of sequential data, such as OSN conversations. Ritter et al. [22] trained a basic HMM on Twitter conversations, using unigram language models as the emission distributions, with the goal of detecting intent behind individual messages. They also extended their model by taking inspiration from Latent Dirichlet Allocation (LDA) models, by allowing each words to be generated by three different sources instead of one. Pursuing the same goal, Brychcín and Král [23] modified Ritter’s base model, changing the emission distributions for multivariate Gaussian distributions and representing messages as multidimensional vectors. Paul [24] also expanded on the work of Ritter, by allowing each message to be associated to a distribution of multiple hidden states, rather than a single one, offering better flexibility.
Following the work of Ritter et al. [22], our main contribution is the development of a novel unsupervised method to model and learn the structure of social network user conversations. Our method uses 23 meaningful features extracted from a dataset of 1.5 million COVID-19-related Facebook comments to train a nine-state HMM representing the conversation. An important novelty of our method is that we propose using a biclustering strategy to properly initialize the parameters of the HMM. To the best of our knowledge, this is the first time biclustering has been used to learn the initial parameters of a HMM in an unsupervised manner. We use the trained HMM to group together similar comments and extract important themes by analyzing their feature values as well as the most meaningful unigrams and bigrams according to the term frequency-inverse document frequency (TF-IDF) scores. Finally, we demonstrate how we can use the PageRank algorithm on our HMM graph to simulate and test the impact of various moderation strategies when applied to the conversations in our dataset. We believe ours is the first moderation simulation tool proposed. As we will discuss, one important advantage of our methodology is that it is general enough to be used on any online community. Our dataset and algorithms are available on our GitHub account (https://github.com/FelixG-G/Covid19-Facebook-conversation-modeling, accessed on 13 February 2023).
The remainder of the paper is structured as follows: in Section 2, the dataset we used is presented and our HMM-training methodology is detailed. The performance of our models are shown in Section 3. This section also includes a discussion of the meaningful message themes that were uncovered using our method, as well as a practical application of our model as a moderation development tool. Lastly, in Section 4, we offer some final thoughts on our methodology and on the challenges of conversation structure modeling.
2. Materials and Methods
2.1. Dataset Collection and Feature Extraction
In order to develop our method and test its performance, a dataset of Facebook comments was collected. These comments were all manually collected between 1 January and 30 June 2020 from the pages of Canadian newspapers (the data were collected from the Facebook pages of the following Canadian newspapers: The Times Colonist, The Tyee, The Vancouver Sun, CBC News, The Globe and Mail, The National Post, The Cape Breton Post, The Chronicle Herald, The Halifax Examiner, The Toronto Star and The Toronto Sun), specifically from articles about COVID-19. In this work, we call a chronological sequence of comments related to a single article a “conversation”. In total, we collected 1,498,930 Facebook comments from 16,026 conversations about the same number of news articles. Conversations consisting of fewer than 10 comments were removed, as we judged them too short to contain meaningful user interactions to model. This leaves 10,035 conversations and 1,478,409 comments in our dataset.
The conversation model proposed by Ritter et al. [22] uses a bag-of-words (BoW) model to represent user messages. For our method, we instead decided to represent each comment by a feature vector and to train the model using those vectors. We expected this would make our method more resilient to variations in wording: two comments can express a similar idea and play the same role in a conversation while having very little overlap in word use, especially when considering that the average comment is only 24.7 words long. In total, we extracted 23 different features from each comment, which we list in Table 1.
The Nbr likes feature was collected when building the dataset. Likewise, the exact date and time the comment was posted was collected with the comment, and the Elapsed time feature was computed as the difference with the timestamp of the previous comment in the same conversation. The first comment of every conversation was assigned the value 0 for this feature. To build the binary features Contains URL, Contains Email and Contains hashtag, the presence of URLs, email addresses and hashtags in the text was detected by using regular expressions. The Nbr first person singular pronouns, Nbr first person plural pronouns, Nbr second person pronouns, Nbr third person singular pronouns, Nbr third person plural pronouns and Nbr politeness / gratitude features were all obtained by comparing every word in a comment with lists of words corresponding to these features. The Image only feature was obtained by checking if the comment’s text was an empty string. Since Facebook does not allow for empty comments, this means that the comment contained only an image or a GIF animation.
The goal of the Starts with name feature is to detect when a comment starts with a user tagging another user, a common feature of Facebook replies. We check for this in two ways. First, we check if the first character of the comment is the @ symbol, indicating it starts by tagging another user. Second, we use the named entity recognizer from the Python library SpaCy (https://spacy.io/, accessed 9 January 2023) to detect untagged proper names at the beginning of a comment. When a comment is found to start with a proper name, that name is compared to a list of celebrity names to ignore, as it is more likely the comment is talking about the celebrity than replying to the celebrity.
The Toxicity score, Sarcasm score, Sentiment score, Anger score, Fear score, Joy score, Love score, Sadness score and Surprise score features were all extracted using pre-trained and fine-tuned neural networks (model used to obtain the Toxicity score feature: https://huggingface.co/unitary/toxic-bert accessed on 9 January 2023; model used to obtain the Sarcasm score feature: https://huggingface.co/cardiffnlp/twitter-roberta-base-irony accessed on 9 January 2023; model used to obtain the Sentiment score feature: https://huggingface.co/distilbert-base-uncased-finetuned-sst-2-english accessed on 9 January 2023; model used to obtain the Anger score, Fear score, Joy score, Love score, Sadness score and Surprise score features: https://huggingface.co/bhadresh-savani/distilbert-base-uncased-emotion, accessed 9 January 2023) from HuggingFace’s transformers (https://huggingface.co/docs/transformers/index, accessed 9 January 2023) Python library. Before using each neural network, a simple preprocessing of the comments was performed, to replace URLs and email addresses with the tokens “URL” and “EMAIL”, respectively, and substitute a wide variety of online acronyms with their full-length version (“lol” became “laughing out loud”, “omg” became “oh my god”, etc.)
After feature extraction, every comment in our dataset is represented by a 23-dimensional vector consisting of 3 different data types (continuous, discrete or binary). To simplify for processing later on, we need to transform all of the features into a single data type. We thus follow the feature extraction step with a binarization step to convert the continuous and discrete attributes to binary attributes. For the continuous features, comments with a value below 0.5 are assigned the value 0 while comments above that threshold are assigned the value 1. This threshold was chosen because all the continuous features have a high concentration around 0 and 1, with a lower uniform distribution between these values.
For the discrete features that count elements (Nbr likes, Nbr politeness/gratitude, etc.), we assigned the value 0 if the count was 0 and the value 1 otherwise. Next, for the Elapsed time feature, we applied the popular IQR Rule, which consists of dividing the range of elapsed times into quartiles and thresholding at the third quartile plus 1.5 times the interquartile range. This yielded a threshold of 650 s; comments thus received a value of 0 or 1 if their elapsed time was below or above that threshold, respectively. For reference, 84% of comments are below the threshold. Finally, we find that there are three ranges of values for the Comment length attribute: short comments composed of 5 words or less (18% of comments), long comments composed of more than 62 words (7% of comments), and medium-length comments between these two extremes (75% of comments). We assign the values 0, 1 and 2 to short, medium and long comments respectively, thus making it our only ternary attribute.
In order to properly train our system and evaluate its performance, we split our dataset into a training set and a testing set. The training set contains 80% of the conversations, while the test set contains 20%. We split the dataset at the conversation level and not at the comment level; since the goal of our study is to extract the structure of conversations on social networks, it is important to maintain the integrity of the conversations. Instead of randomly splitting the dataset, as is often done, we split the conversations according to how old they are. This is done to simulate real-world use of our system: it will be tested on conversations that took place after its training. To do that, we ordered the conversations according to the timestamp of their last (most recent) comment, and used the oldest 80% of conversations as a training set. Since comments are added to conversations over time, there is a risk that building a training dataset of older conversations and a testing set of newer conversations will lead to an imbalance in conversation lengths. However, a quick check confirmed this was not the case; our training set contained 81% of individual messages and the testing set 19%.
2.2. Bi-clustering and HMM Initialization
An HMM possesses 4 different sets of parameters: the start probabilities (or initial state probabilities), the transition probabilities, the emission probabilities and the number of hidden states. These parameters have to be initialized before starting the training procedure. According to Rabiner [25], randomly or uniformly initializing the start and transition probabilities has proven to yield good enough results. However, that is not the case for the emission probabilities and the number of hidden states, where the initial values can have a significant impact on the resulting trained model. For this reason, Rabiner [25] recommends the use of different methods, such as K-means clustering, to properly initialize the emission probabilities. For our method, we have decided to randomly initialize the start and transition probabilities, and to apply a strategy based on biclustering of the comments to select the number of states and initialize the emission probabilities. Biclustering [26] is a clustering method that clusters both the comments and the features at the same time. We used the popular Scikit-Learn library’s implementation of biclustering (https://scikit-learn.org/stable/modules/generated/sklearn.cluster.SpectralCoclustering.html, accessed 9 January 2023). In this implementation, each comment and feature can only be part of a single bicluster, the number of biclusters has to be selected in advance and biclusters with no features are allowed.
The idea behind our emission probabilities initialization strategy is to cluster together comments that share similar values for a subset of the 23 features. Each bicluster will then correspond to a hidden state of the HMM, with its emission probabilities corresponding to the distribution of values for features that are part of that bicluster or uniform otherwise. Thus, for example, if a bicluster contains 100 comments and the Toxicity score feature but not the Sarcasm score feature, and 25 messages in the bicluster have a Toxicity score value of 0 and the others have a value of 1, then the corresponding HMM hidden state will be initialized with a Toxicity score emission probability of 0.25 for 0 and 0.75 for 1, and a Sarcasm score emission probability of 0.5 for each value.
The optimal number of biclusters to discover (and thus of hidden states in our HMM) is determined by computing the Silhouette coefficient [27] for different numbers of biclusters. This method measures how compact the points of a cluster are and how distant they are from other clusters, and it computes a coefficient between 1 for a perfect clustering into neat and well-separated clusters to −1 for a clustering where the points are completely misassigned. The Silhouette coefficient computation involves measuring the distance between points of different clusters, which is a problem in our case as different biclusters will be defined with different subsets of the binary attributes. We thus adapted the distance measure as follows: for a target point , we are computing the coefficient for and being compared to point , we only compare the points on set of attributes that are part of ’s bicluster. The distance is then computed with Jaccard’s coefficient using only those attributes:
If comment belongs to a bicluster with no features, then the set contains all 23 features. The distance is always between 0 and 1, with 0 indicating identical comments for the compared features and 1 completely opposite comments on those features. Since the Silhouette coefficient computing takes an extremely long time, we decided to limit ourselves to only using 1% of the data contained in every bicluster.
As mentioned, the Silhouette coefficient computation begins by computing the average distance of each individual data point in the dataset to each point within and outside its cluster. It then computes an average value per cluster based on its points, then an average value of the clustering based on its clusters. We chose to ignore biclusters with no features from that final average value. The reason for this is that these biclusters, having no attributes, are thus not part of the clustering space.
2.3. HMM Training
HMMs are trained by iteratively updating their parameters, which we initialized in the previous subsection. The HMM training algorithm has three hyperparameters: inertia, decay and number of iterations. Inertia controls how much the parameters should be updated at every iteration, similarly to the learning rate in neural network training algorithms. The decay modifies the inertia during the training process, so that earlier iterations have a bigger impact on the parameters of the model than later ones. To select the best hyperparameter values, we use a grid search strategy to test different possible combinations. We perform k-fold cross-validation on the training set to evaluate the performance quality each time. We used folds, a popular value which we found gives good results in relatively fast computation times. We tested models with a number of iterations between 2 and 10, inertia of 0, 0.1 or 0.2, and decay of either 0 or 0.75.
To evaluate the performance quality of the different models during the cross-validation process, we use the Kendall’s [28] method which was also used by [22]. The intuition of this method is that, if we take a real conversation from the dataset and randomly modify the order of its comments to generate new conversations, then a good model should be able to recognize which conversation is the original one. In practice, we generate random permutations of a given conversation and use the HMM to assign each one a log-likelihood, a probability of having been generated by the model. We then compute the value of Kendall’s between the original conversation and the conversation that has received the highest log-likelihood. Kendall’s is a metric that measures how similar two orderings are. Suppose you have two orderings of the same sequence, and , where and represents the position of the ith element of the original sequence in the new ordering. For example, means that the third element of the original sequence has been placed in position 1 in reordered sequence X. We then define a “concordant pair” as a pair and where and , and conversely, a “discordant pair” as a pair where . The Kendall’s is then computed as:
where C and D are the number of concordant and discordant pairs, respectively. Kendall’s is always between 1 and −1, with 1 indicating identical orderings and −1 reverse orderings. While this method works best when all possible permutations of a conversation are considered, in our case this is impractical as some conversations contain thousands of comments. We thus limit our computation to at most 100 random permutations of each conversation.
Since we use a k-fold cross-validation, every conversation will be part of the held-out testing set exactly once. At the end of the cross-validation, we thus have the Kendall’s value for every conversation in the training set. We then compute the average over all conversations as the measure of how well the HMM performed. Using this measure, we can compare different HMMs trained with different hyperparameter values.
Given the randomness involved when initializing and training an HMM, we need a way to compare two HMMs that are trained using the same hyperparameter values, to see if they converge towards a similar final model. To that end, we implemented the distance measure proposed in [25,29]. This measure is computed by first generating a conversation with one of the two models. Then, the log-likelihood of that conversation is calculated for both models and the difference between these log-likelihoods is divided by the length of the conversation. This process is applied a second time, using a conversation generated by the other model. The two values are then averaged out to obtain the final distance measure. We repeat this process multiple times and average the results, to reduce the impact of the randomness involved in the conversation-generating process. Since the final result is a distance measure, the value is between 0 and 1, with 0 indicating perfectly identical models. The generated conversations have to be long for the distance measure to work properly. In our work, we found that conversations of 500 comments were long enough to yield good results. This distance measure was used as part of the k-fold cross-validation procedure, to verify whether the training process was converging to equivalent HMMs every time.
3. Results
3.1. Bi-Clustering
We used the previously described Silhouette coefficient method to determine the optimal number of biclusters to use. Given the randomness involved in the biclustering process, multiple runs of this method using the same number of biclusters did not always yield the same Silhouette coefficient. For this reason, we computed the Silhouette coefficient for every number of biclusters five times. The average coefficient per number of biclusters can be found in Figure 1. The highest average is obtained when using two biclusters. However, it is not realistic to assume that only two biclusters (states) are enough to properly model conversations. For this reason, we selected nine as the optimal number of biclusters, as it obtained the second highest average Silhouette coefficient.
3.2. HMM Training
For the hyperparameter values, the grid search and five-fold cross-validation procedures indicated that a good trade-off between a high Kendall’s value and low mean distance between trained models was obtained when training for eight iterations with an inertia of 0.1 and a decay of 0.
With these hyperparameter values, we trained twelve nine-state bi-clusterings and HMMs over the entire training set and evaluated their mean Kendall’s on the test set. Given the randomness involved in the bi-clustering and training process, the final varies for every trained HMM. The results for the twelve trained HMMs can be found in Table 2.
We use the work of Ritter et al. [22] as a benchmark and compare their three different models with our top models. We focus the comparison on the results they obtained when training their models for 10 states, since this is the closest to our selected optimal number of states. Additionally, as the values of their models are not explicitly stated in their paper, we estimated it from the histogram in their paper. The results are presented in Table 2. Their first model is the one our work is based on and is called the “EM Conversation” model. It consists of an HMM where messages are represented as a BoW, with unigram language models as emission distributions. Their second model is called “Conversation + Topic” and is an extension of the first one. It borrows concepts from Latent Dirichlet Allocation (LDA) models, allowing each word in a given message to be generated from three different sources: the message’s dialogue act, its topic or general English. The third and last model is a Bayesian variation of the first one and is thus called “Bayesian Conversation”.
Our four best models (models #1 through #4) each obtained Kendall’s values equal to or higher than Ritter et al. [22]’s base “EM Conversation” model. Additionally, our best HMM (model #1) performed similarly to their “Conversation + Topic” model. Our models #2 to #4 were outperformed by their “Conversation + Topic” model, but only by a small margin. Lastly, Ritter et al. [22]’s “Bayesian Conversation” model outperformed all of our models. However, the difference between the “Bayesian Conversation” model and our top four models is small, hinting at models with similar performance levels.
However, it is important to note that this benchmark comparison is imperfect: Ritter et al. [22] used a dataset of short Twitter conversations where users directly replied to each other, whereas our Facebook conversations are longer and less structured. This makes it much more difficult to achieve a high value in our case. This is because many different permutations of our conversations can be equally valid. For instance, if user A asks a question and users B and C respond independently of each other, the ordering and are equally valid conversations, but only one corresponds to the real-world order and achieves a higher Kendall’s value.
3.3. Meaning of HMM Conversation States
The graph representing our best HMM can be found in Figure 2. It is made up of 10 nodes, representing the nine hidden states and the starting probabilities. The hidden states are fully connected and the start state is connected to all hidden states, but to reduce clutter, the figure excludes transition probabilities of less than 0.15.
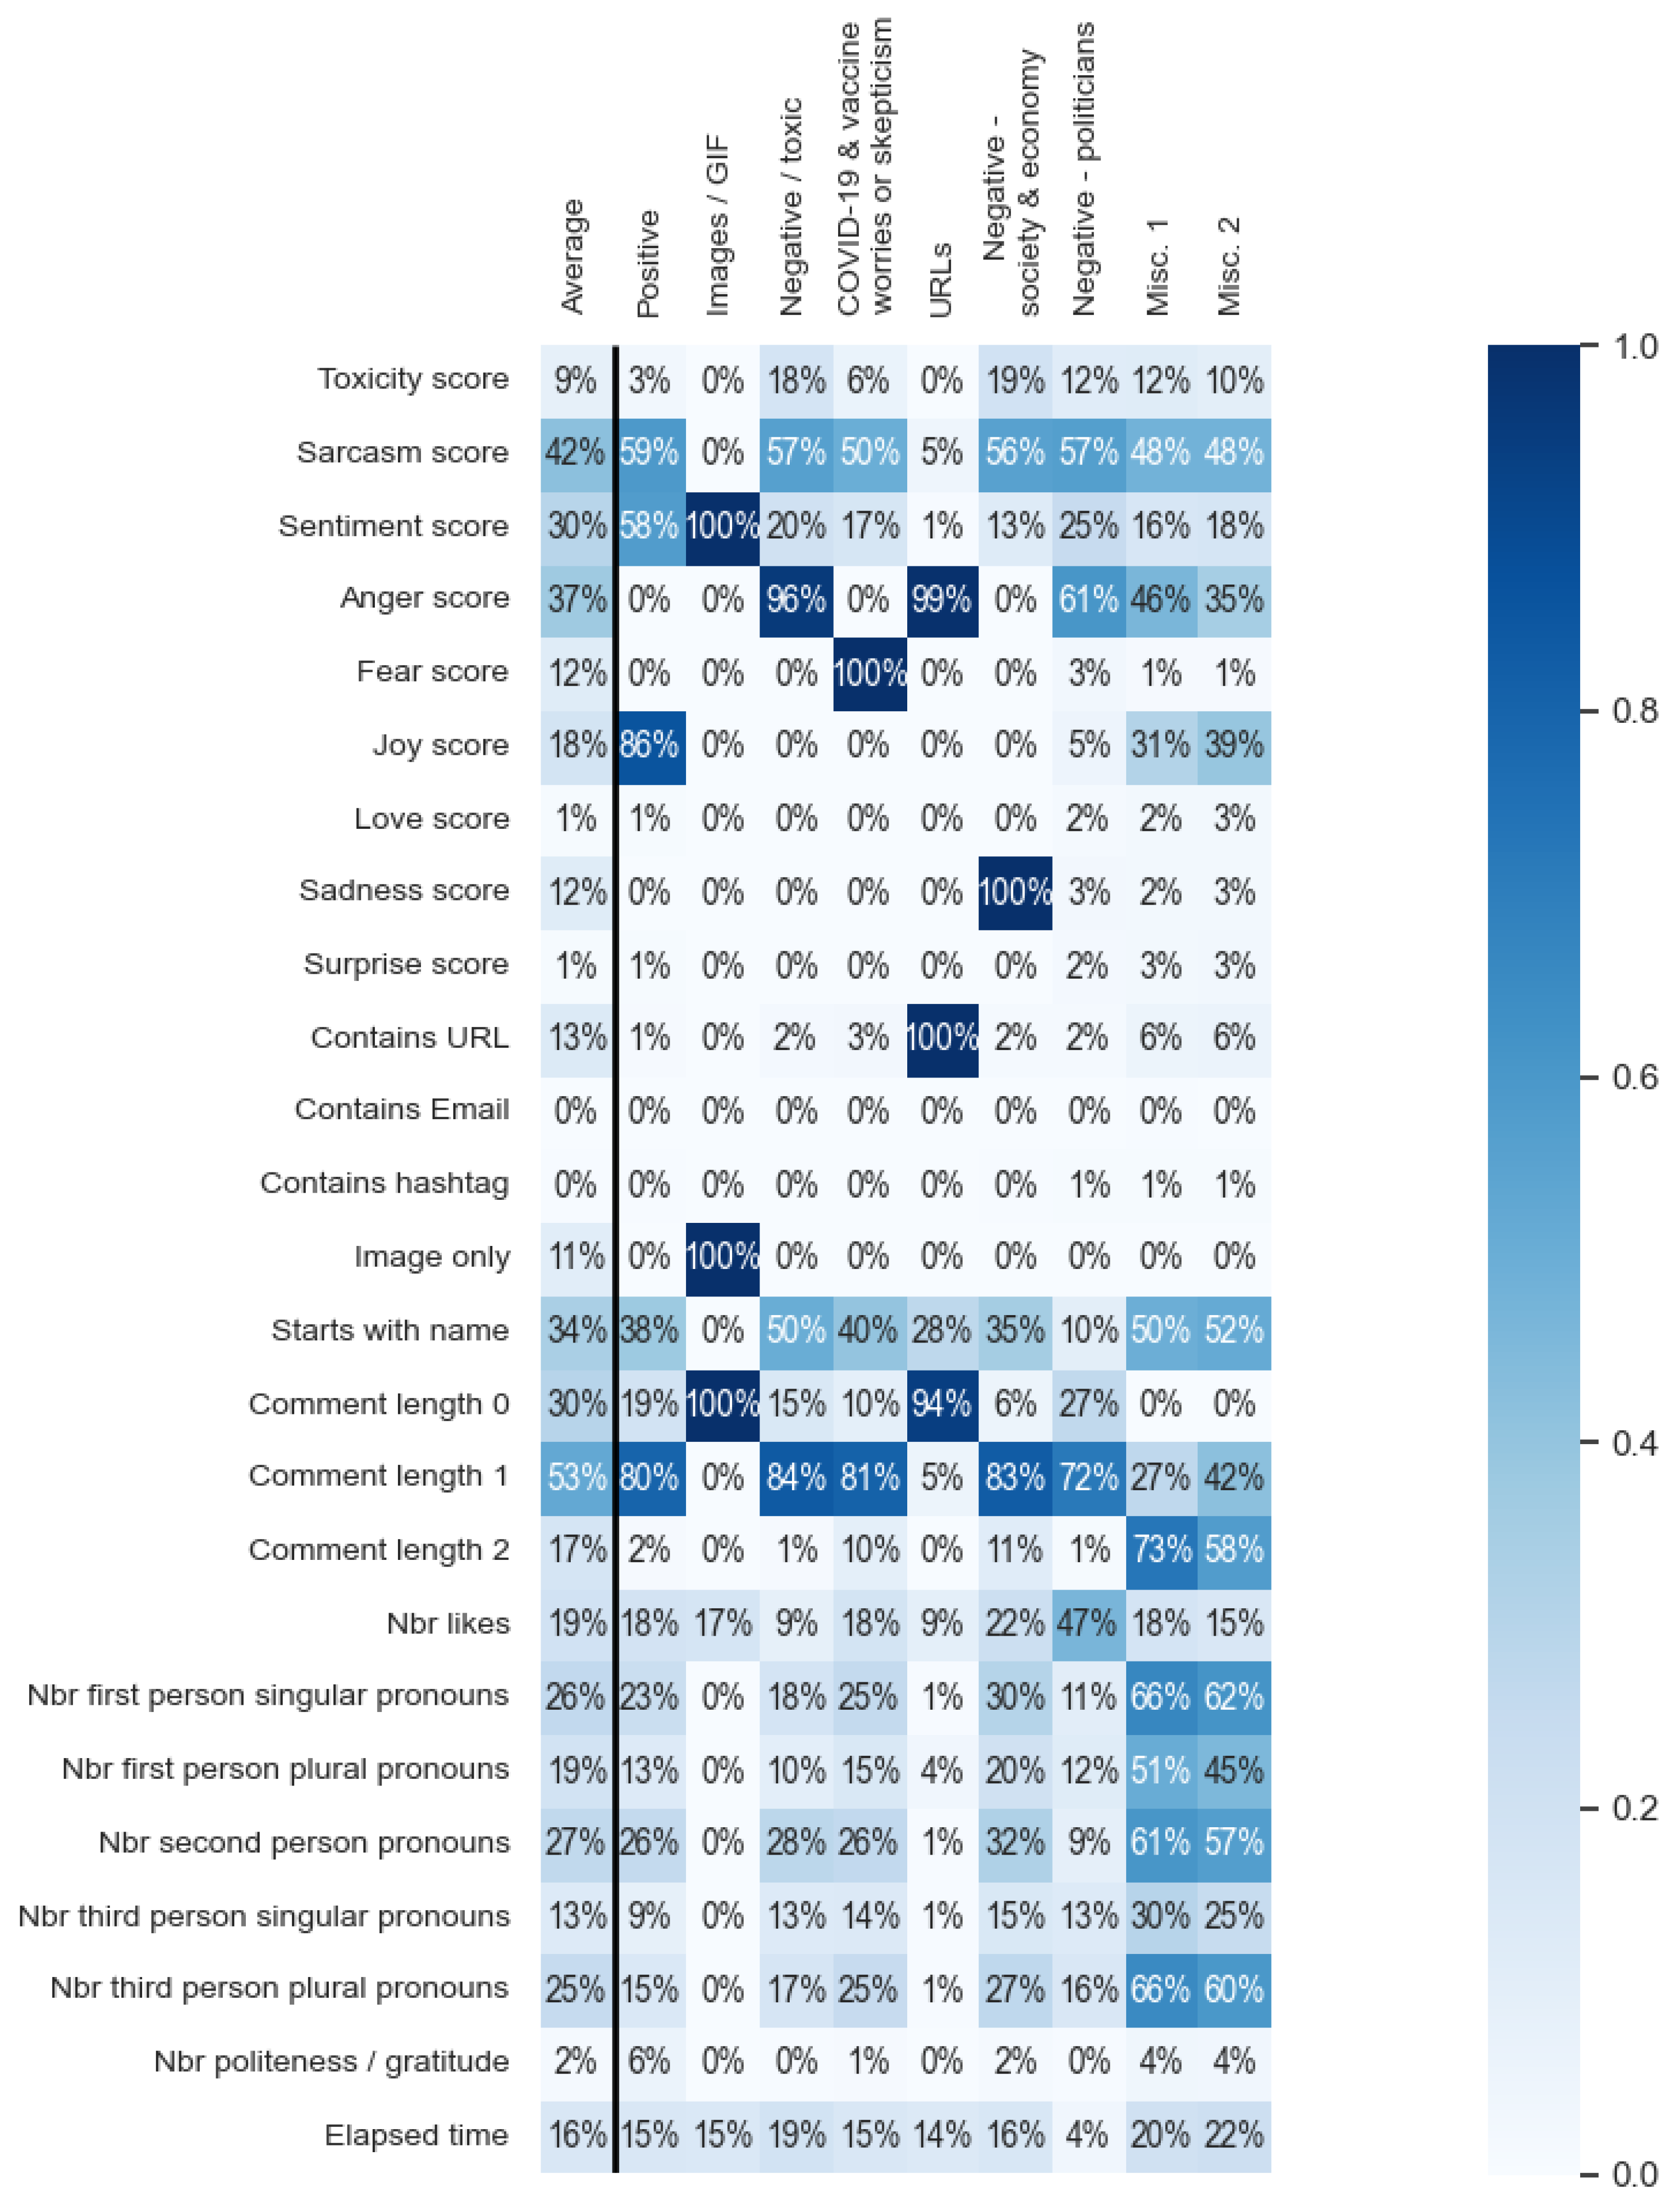
We used two techniques to assign meaning to the hidden states. The first is to compare the emission probabilities for each feature of each state together, and the second is to list the most significant keywords of the messages of each state. The emission probabilities are presented in Figure 3. The value in each cell corresponds to the probability of a comment in the matching state having “1” as its value for the corresponding feature. The only exception is the Comment length feature. Because of its ternary nature, we instead divided it in three distinct rows, with each one corresponding to the probability of observing the value “0”, “1” or “2”, as indicated by the row’s names. We also include, for reference, the average probabilities of each feature in the entire dataset; this will make it easier to observe outlier values.
For the significant keywords, we used our best model to associate each comment from each conversation of the test set to one of the nine hidden states. We then computed the TF-IDF of every unigram and bigram found in the messages. For this step, URLs and Emails were replaced with the words “URL” and “EMAIL”, respectively, and stopwords were removed. We retained the highest-valued unigrams and bigrams of each state and manually analyzed them to pick out a pattern or theme. The most significant unigrams and bigrams of each state are presented in Table 3.
Based on this analysis, we were able to identify and describe the meaning of our nine hidden states, which we present in Table 3. We also gave them names representing their meaning, which are featured in Figure 2 and Figure 3 and Table 3.
The most important state in the HMM, in the sense that it contains the most messages, is the Positive state. This state has the highest Sentiment and Joy scores, and its significant unigrams and bigrams are all positive words. Excluding the Images / GIF and URLs states, the Positive state has the lowest Toxicity score. This state also has the highest probability of its messages containing politeness or gratitude terms. This state thus represents positive messages in the conversation, which are to be encouraged.
The next three most important states are for negative comments. Unsurprisingly, the Negative/toxic and Negative—society and economy states have the two highest Toxicity scores, while the Negative—politicians state is tied for third highest score with the Misc. 1 state. Additionally, all three of these negative states have nearly null probabilities of showing Joy or politeness/gratitude terms, as well as a low Sentiment score. They do, however, represent very different behaviors. The Negative/toxic state has an extremely high Anger score and a high Starts with name probability, and its most significant words are insults. This is a state where the conversation has degenerated to personal attacks. This state has the lowest probability of observing likes on its comments. By contrast, the Negative/society and economy state has no Anger but very high Sadness scores, and its keywords show users are very pessimistic for the future. Finally, the Negative/politicians state has high anger, but unlike the Negative/toxic, its most significant keywords are insults directed at politicians, political movements and the political class. Interestingly enough, this is also the state with the highest probability of Nbr likes and the lowest Elapsed time probability, hinting at more active conversations.
The COVID-19 and vaccine worries or skepticism state has a very high Fear score and a vocabulary that mixes COVID terminology and expressions of worry. It also shares some features with the three “Negative” states, namely, low Sentiment and Joy scores. Nonetheless, we do not consider this a “Negative” state, for two reasons. In terms of features, its Toxicity score is much lower than that of the “Negative” states; it is in fact second only to the Positive state. Moreover, socially, we must recall that the early 2020s were a very worrisome period, during which most people could only watch helplessly as the COVID-19 virus spread from country to country and pharmaceutical companies raced to create a vaccine. Expressing worries in these conditions seems only natural. In addition, it is important to note that the two main transitions out of this state are to the Positive and Negative/toxic states, with almost equal probabilities, meaning that people worried about COVID were equally likely to be reassured or attacked online. If one has as a goal to reassure the public and spread correct information about the pandemic (as a public health department would), than this state is the one they should be most focused on, and their strategy should be to intervene to improve positive transitions.
The Images/GIF state is entirely made up of comments that contained only an image. Likewise, the URLs state is made up of messages containing a URL, sometimes with minimal surrounding text (e.g., “hey check this out”). We should note that the scores for the various emotions and sentiments measured by our system are not reliable for these states. For example, an empty comment always obtains a perfect positive sentiment score, leading to the 100% Sentiment score of the Images/GIF state, when in reality, our system has no way of knowing whether the images posted reflect positive or negative sentiments. Likewise, short messages featuring the word “URL” are assigned a high Anger score by the emotion classification network we used.
The Misc. 1 and Misc. 2 states are very similar to each other. They are both composed of the longest messages posted and have a high Starts with name probability, meaning that many of them are long responses to other messages. They also contain the most pronouns of any class and have the second and third-highest probability of observing politeness/gratitude terms, which are likely simply due to the length of their comments. Their other features have near-average values compared to the other states, and although some differences can be observed between them, they are not major. In terms of vocabulary, both states are dominated by Islam-related terminology, and Misc. 1 also discusses alternative-medicine ideas, while Misc. 2 is slightly more interested in economics and Israel.
Some of the features we measured turned out not to be very useful in these conversations. This is the case for the Sarcasm score feature. If we exclude the Images/GIF and URLs states, the average Sarcasm score probability is 53% and every state has an emission probability hovering around that value. Similarly, the Love score, Surprise score, Contains Email and Contains hashtag features are almost null for all states. The case of the Contains hashtag feature is interesting; as shown in Table 3, hashtags are among the popular unigrams of the Negative—politicians state, so we could have expected that feature to highlight that state. Clearly, this was not the case, possibly because hashtags are not a popular feature on Facebook. It is worth noting, however, that these particular features were only deemed not useful as part of our study, where the focus was on distinguishing the different states of COVID-19-oriented Facebook conversations. In a different setting, one could expect different features to be useful.
3.4. Moderation Strategies
The transition graph of Figure 2 can give us insight on how conversations evolve online. We have already hinted at the usefulness of such insight when discussing the COVID-19 and vaccine worries or skepticism state transitions. In order to explore this idea further, we need a way to simulate conversations given changes in the transition probabilities of the graph that would result from different conversation moderation strategies we could put into practice.
To this end, we use the PageRank [30] algorithm, a graph exploration algorithm well-proven in practice to match human behavior. The central equation of the algorithm is given in Equation (4), with M being the matrix of state-to-state transition probabilities and being the vector of current state probabilities. As a baseline experiment, we ran PageRank on the graph using the same transition probabilities the HMM learned and using the Start state probabilities as the initial state probability vector . After 50 iterations of the algorithm, the state probabilities converged to almost exactly the observed frequencies of Table 3. This result is presented in Table 4, under the column Baseline.
As can be seen in the transition graph, conversations have a 24% chance of starting with a comment in the Positive state and 64% chance of starting in the Negative - Politicians state. This means that most conversations evolve from a negative starting point. The first moderation strategy we consider is to rectify this by forcing the first message of every conversation to be in the Positive state. This is implemented by changing the vector to be 1 for the Positive state and 0 elsewhere. As a real-world moderation strategy, this could be done by watching new conversations to make sure they start off positively, or even by having moderators write a first positive message themselves. Our hope was that starting the conversations more positively would lead to more positive outcomes. However, our simulation indicates that this strategy does not change the final conversation, as shown in Table 4, under the Positive Start column.
It is also interesting to note that two of the “Negative” states have higher probabilities of looping back to themselves than transitioning towards a different state. This indicates that conversations tend to stay in the current negative state that they are in. This gave us the idea for another moderation strategy, which consists of moderators intervening to break these self-reinforcing conversation loops. We implemented this by dividing in half the probabilities of each of the three negative states transitioning back to itself, then normalizing so the matrix columns sum to 1 (a requirement of the PageRank algorithm). As shown in Table 4, under the Reduced Loops column, this strategy slightly increased the probabilities of every non-negative state and decreased the probabilities of both the Negative/toxic and Negative—politicians states. However, the probability of comments from the Negative—society and economy, which is not as self-reinforcing as the other two, actually increases very slightly. Overall, this seems like an insufficient moderation intervention.
The next moderation strategy we simulate corresponds to the most common strategy used in the real world, namely, intervening in negative states to prevent the conversation from continuing in a negative direction. We implemented this strategy by dividing in half the probabilities of transitions starting from one of the three negative states and going to itself or another negative state and normalizing the matrix columns. This simulation results in a strong increase of the probabilities of non-negative comments, while all three negative states decrease in probability, as can be seen under the Negative Intervention column in Table 4.
We consider next the opposite strategy: having moderators ignore negative states but intervene instead on non-negative states in order to discourage them from transitioning to negative states. To the best of our knowledge, this is not a strategy used in the real world; moderators tend to leave positive conversations alone and only get involved in negative ones. We implemented it by dividing in half the transition probabilities starting from a non-negative state and going to a negative state, then normalizing the matrix columns. The results under the Non-Negative Intervention column in Table 4 show that this seems to be the best strategy available, in that it leads to the highest increase in the probability of all non-negative states and the highest decrease in the probability of negative states.
Finally, we wondered about a strategy to encourage Positive state messages. This corresponds to the idea of having moderators encourage every user, regardless of which type of message they wrote, to write positive comments. We implemented this by doubling the transition probability of every state towards the Positive state and normalizing the matrix columns. The results of Table 4, under the Positive Only column, show that the probability of positive comments greatly increases, which is expected. However, the probability of all other types of non-negative messages decreases, which indicates this strategy is hindering on conversation. In addition, while the probability of all three negative classes of messages decreases, it does not decrease as much as with our previous moderation strategy. Overall, this does not seem like a worthwhile moderation strategy, based on our simulation.
3.5. Comparison with Other Works
There are few systems in the literature comparable to ours. The two closest matches are those of Ritter et al. [22] and Bonifazi et al. [21]. Both our work and Ritter et al. [22] use an unsupervised HMM-based methodology to model online conversations, which allowed us to compare our performances against those of that paper in Section 3.2. However, our two systems have very different aims: ours seeks to model conversation structures and topic clusters, while Ritter et al. [22] seek to identify conversation acts (such as greetings, questions, answers, etc.) The graph generated by their method is thus not comparable to ours.
On the other hand, Bonifazi et al. [21] studied user interactions (likes, shares, etc.) and used these to create a social interaction graph that makes it possible to analyze user behaviors and habits. This is a very different aim from that of our work. Rather than comparable, our works should be seen as complementary to each other. While we all study the same source data, online conversations, we each extract different features from them and model a different aspect of the interactions. Future work may look at combining our methods to obtain a more complete vision of the different facets of online user communications.
4. Discussion
The COVID-19 pandemic gave rise not only to new healthcare challenges but also to new health communication challenges. Around the world, governments and public health agencies scrambled to inform the public on the pandemic and to share advice and good practices. They used every communication tool available, including press conferences, media interviews, and advertisement campaigns. However, this overlooked the fact that an important and growing proportion of the public today gets their information not from these traditional sources, but online on social networks [3]. While mainstream news media were for the most part reassuring and informative, the online news environment was ripe with misinformation and fear-mongering about the virus and the vaccine. This in turn greatly hindered the efforts of healthcare workers in their fight against COVID-19.
In this study, we developed an unsupervised method to model the structure and flow of social network conversations. Our method trains an HMM representation of the conversation initialized from the results of a bi-clustering of the comments. We demonstrated this method on a dataset of COVID-19-related Facebook conversations and showed that it yielded interesting results. Our method recognized specific conversation acts, such as people expressing worries about the pandemic, sadness about the state of the world, or anger at the political class. It also detected conversation behaviors, such as the fact that negative comments tend to self-reinforce or that expressions of worries are answered in a positive or negative manner with almost equal frequency.
In addition, we showed that the conversation graph our method learned can be used to accurately simulate the aggregated conversations observed in the real world, using the PageRank algorithm. This simulation can in turn be used to develop and test different moderation strategies, and develop best practices for community moderators. For instance, our simulations showed that preemptive interventions in non-negative conversation states could lead to better conversation outcomes than the current popular strategy of disrupting negative states.
The method we proposed can be used to better understand how information flows on social networks. In the context of the COVID-19 pandemic, it would be useful to encourage positive and informative conversations and to limit negative conversations that were ripe with toxic and hateful comments and were breeding grounds for fake news and conspiracy theories. However, it is important to emphasize that our method is neither COVID-specific nor Facebook-specific. It could be set up quickly to study conversations and communities on any social network in the event of another pandemic or any other major event (elections, protests, natural disasters, etc.) or to study online community behaviors in general.
Author Contributions
Conceptualization, F.G.-G. and R.K.; methodology, F.G.-G. and R.K.; software, F.G.-G.; validation, F.G.-G. and R.K.; formal analysis, F.G.-G. and R.K.; investigation, F.G.-G. and R.K.; resources, F.G.-G. and R.K.; data curation, F.G.-G.; writing—original draft preparation, F.G.-G. and R.K.; writing—review and editing, F.G.-G. and R.K.; visualization, F.G.-G. and R.K.; supervision, R.K.; project administration, R.K.; funding acquisition, Eve Dubé. All authors have read and agreed to the published version of the manuscript.
Funding
This work was supported by a research grant from the Canadian Institutes of Health Research (GA3177725). The data collection was supported by a research grant from the Canadian Institutes of Health Research (#440293).
Institutional Review Board Statement
This study was approved by the Ethics Review Board of the CHU de Québec-Université Laval Research Centre (2020-5155).
Informed Consent Statement
Not applicable.
Data Availability Statement
Publicly available datasets were analyzed in this study. These data can be found here: https://github.com/FelixG-G/Covid19-Facebook-conversation-modeling accessed on 9 January 2023.
Acknowledgments
The authors want to thank Eve Dubé, Dominique Gagnon and Fabienne Labbé for their collaboration.
Conflicts of Interest
The authors declare no conflict of interest. The funding sponsors had no role in the design of the study; in the collection, analyses, or interpretation of data; in the writing of the manuscript, and in the decision to publish the results.
Abbreviations
The following abbreviations are used in this manuscript:
| OSN | Online social network |
| SVM | Support vector machine |
| LSTM | Long short-term memory |
| VAE | Variational auto-encoder |
| HMM | Hidden Markov model |
| TF-IDF | Term frequency-inverse document frequency |
References
- Listings of WHO’s Response to COVID-19. 2020. Available online: https://www.who.int/news/item/29-06-2020-covidtimeline (accessed on 13 December 2022).
- Auxier, B.; Anderson, M. Social media use in 2021. Pew Res. Cent. 2021, 1, 1–4. [Google Scholar]
- Spotlight on Canadians: Results from the General Social Survey the Use of Media to Follow News and Current Affairs. 2016. Available online: https://www150.statcan.gc.ca/n1/pub/89-652-x/89-652-x2016001-eng.htm (accessed on 8 November 2022).
- Wong, A.; Ho, S.; Olusanya, O.; Antonini, M.V.; Lyness, D. The use of social media and online communications in times of pandemic COVID-19. J. Intensive Care Soc. 2021, 22, 255–260. [Google Scholar] [CrossRef] [PubMed]
- Oyebode, O.; Ndulue, C.; Adib, A.; Mulchandani, D.; Suruliraj, B.; Orji, F.A.; Chambers, C.T.; Meier, S.; Orji, R. Health, Psychosocial, and Social Issues Emanating From the COVID-19 Pandemic Based on Social Media Comments: Text Mining and Thematic Analysis Approach. JMIR Med. Inform. 2021, 9, e22734. [Google Scholar] [CrossRef] [PubMed]
- Lyu, J.C.; Han, E.L.; Luli, G.K. COVID-19 Vaccine–Related Discussion on Twitter: Topic Modeling and Sentiment Analysis. J. Med. Internet Res. 2021, 23, e24435. [Google Scholar] [CrossRef] [PubMed]
- Boucher, J.C.; Cornelson, K.; Benham, J.L.; Fullerton, M.M.; Tang, T.; Constantinescu, C.; Mourali, M.; Oxoby, R.J.; Marshall, D.A.; Hemmati, H.; et al. Analyzing Social Media to Explore the Attitudes and Behaviors Following the Announcement of Successful COVID-19 Vaccine Trials: Infodemiology Study. JMIR Infodemiol. 2021, 1, e28800. [Google Scholar] [CrossRef] [PubMed]
- Haupt, M.R.; Li, J.; Mackey, T.K. Identifying and characterizing scientific authority-related misinformation discourse about hydroxychloroquine on twitter using unsupervised machine learning. Big Data Soc. 2021, 8, 20539517211013843. [Google Scholar] [CrossRef]
- Hussain, A.; Tahir, A.; Hussain, Z.; Sheikh, Z.; Gogate, M.; Dashtipour, K.; Ali, A.; Sheikh, A. Artificial Intelligence–Enabled Analysis of Public Attitudes on Facebook and Twitter Toward COVID-19 Vaccines in the United Kingdom and the United States: Observational Study. J. Med. Internet Res. 2021, 23, e26627. [Google Scholar] [CrossRef] [PubMed]
- Paul, N.; Gokhale, S.S. Analysis and classification of vaccine dialogue in the coronavirus era. In Proceedings of the 2020 IEEE International Conference on Big Data (Big Data), Atlanta, GA, USA, 10–13 December 2020; pp. 3220–3227. [Google Scholar]
- Loomba, S.; de Figueiredo, A.; Piatek, S.J.; de Graaf, K.; Larson, H.J. Measuring the impact of COVID-19 vaccine misinformation on vaccination intent in the UK and USA. Nat. Hum. Behav. 2021, 5, 337–348. [Google Scholar] [CrossRef] [PubMed]
- Obadimu, A.; Khaund, T.; Mead, E.; Marcoux, T.; Agarwal, N. Developing a socio-computational approach to examine toxicity propagation and regulation in COVID-19 discourse on YouTube. Inf. Process. Manag. 2021, 58, 102660. [Google Scholar] [CrossRef] [PubMed]
- Dutta, S.; Das, D. Dialogue modelling in multi-party social media conversation. In Proceedings of the International Conference on Text, Speech, and Dialogue, Prague, Czech Republic, 27–31 August 2017; Springer: Berlin/Heidelberg, Germany, 2017; pp. 219–227. [Google Scholar]
- Brambilla, M.; Javadian, A.; Sulistiawati, A.E. Conversation Graphs in Online Social Media. In Proceedings of the International Conference on Web Engineering, Biarritz, France, 18–21 May 2021; Springer: Berlin/Heidelberg, Germany, 2021; pp. 97–112. [Google Scholar]
- Jelodar, H.; Wang, Y.; Orji, R.; Huang, S. Deep sentiment classification and topic discovery on novel coronavirus or COVID-19 online discussions: NLP using LSTM recurrent neural network approach. IEEE J. Biomed. Health Inform. 2020, 24, 2733–2742. [Google Scholar] [CrossRef] [PubMed]
- Hayawi, K.; Shahriar, S.; Serhani, M.A.; Taleb, I.; Mathew, S.S. ANTi-Vax: A novel Twitter dataset for COVID-19 vaccine misinformation detection. Public Health 2022, 203, 23–30. [Google Scholar] [CrossRef]
- Yousefinaghani, S.; Dara, R.; Mubareka, S.; Papadopoulos, A.; Sharif, S. An analysis of COVID-19 vaccine sentiments and opinions on Twitter. Int. J. Infect. Dis. 2021, 108, 256–262. [Google Scholar] [CrossRef]
- Zeng, J.; Li, J.; He, Y.; Gao, C.; Lyu, M.R.; King, I. What you say and how you say it: Joint modeling of topics and discourse in microblog conversations. Trans. Assoc. Comput. Linguist. 2019, 7, 267–281. [Google Scholar] [CrossRef]
- Xu, J.; Lei, Z.; Wang, H.; Niu, Z.Y.; Wu, H.; Che, W. Discovering dialog structure graph for coherent dialog generation. In Proceedings of the 59th Annual Meeting of the Association for Computational Linguistics and the 11th International Joint Conference on Natural Language Processing (Volume 1: Long Papers), Bangkok, Thailand, 1–6 August 2021; Association for Computational Linguistics: Stroudsburg, PA, USA, 2021; pp. 1726–1739. [Google Scholar]
- Qiu, L.; Zhao, Y.; Shi, W.; Liang, Y.; Shi, F.; Yuan, T.; Yu, Z.; Zhu, S.C. Structured Attention for Unsupervised Dialogue Structure Induction. In Proceedings of the 2020 Conference on Empirical Methods in Natural Language Processing (EMNLP), Online, 16–18 November 2020; Association for Computational Linguistics: Stroudsburg, PA, USA, 2020; pp. 1889–1899. [Google Scholar]
- Bonifazi, G.; Breve, B.; Cirillo, S.; Corradini, E.; Virgili, L. Investigating the COVID-19 vaccine discussions on Twitter through a multilayer network-based approach. Inf. Process. Manag. 2022, 59, 103095. [Google Scholar] [CrossRef] [PubMed]
- Ritter, A.; Cherry, C.; Dolan, B. Unsupervised Modeling of Twitter Conversations. In Proceedings of the Human Language Technologies: The 2010 Annual Conference of the North American Chapter of the Association for Computational Linguistics, Los Angeles, CA, USA, 2–4 June 2010; pp. 172–180. [Google Scholar]
- Brychcín, T.; Král, P. Unsupervised Dialogue Act Induction using Gaussian Mixtures. In Proceedings of the 15th Conference of the European Chapter of the Association for Computational Linguistics: Volume 2, Short Papers, Online, 19–20 April 2017; pp. 485–490. [Google Scholar]
- Paul, M.J. Mixed Membership Markov Models for Unsupervised Conversation Modeling. In Proceedings of the 2012 Joint Conference on Empirical Methods in Natural Language Processing and Computational Natural Language Learning, Jeju Island, Republic of Korea, 12–14 July 2012; pp. 94–104. [Google Scholar]
- Rabiner, L.R. A tutorial on hidden Markov models and selected applications in speech recognition. Proc. IEEE 1989, 77, 257–286. [Google Scholar] [CrossRef] [Green Version]
- Dhillon, I.S. Co-Clustering Documents and Words Using Bipartite Spectral Graph Partitioning. In Proceedings of the Seventh ACM SIGKDD International Conference on Knowledge Discovery and Data Mining. Association for Computing Machinery, San Francisco, CA, USA, 26–29 August 2001; pp. 269–274. [Google Scholar]
- Rousseeuw, P.J. Silhouettes: A graphical aid to the interpretation and validation of cluster analysis. J. Comput. Appl. Math. 1987, 20, 53–65. [Google Scholar] [CrossRef] [Green Version]
- Kendall, M.G. A new measure of rank correlation. Biometrika 1938, 30, 81–93. [Google Scholar] [CrossRef]
- Juang, B.H.; Rabiner, L.R. A probabilistic distance measure for hidden Markov models. AT&T Tech. J. 1985, 64, 391–408. [Google Scholar]
- Page, L.; Brin, S.; Motwani, R.; Winograd, T. The PageRank Citation Ranking: Bringing Order to the Web; Technical Report 1999-66; Stanford InfoLab: Stanford, CA, USA, 1999. [Google Scholar]
Figure 1.
Average Silhouette coefficient given the number of biclusters.
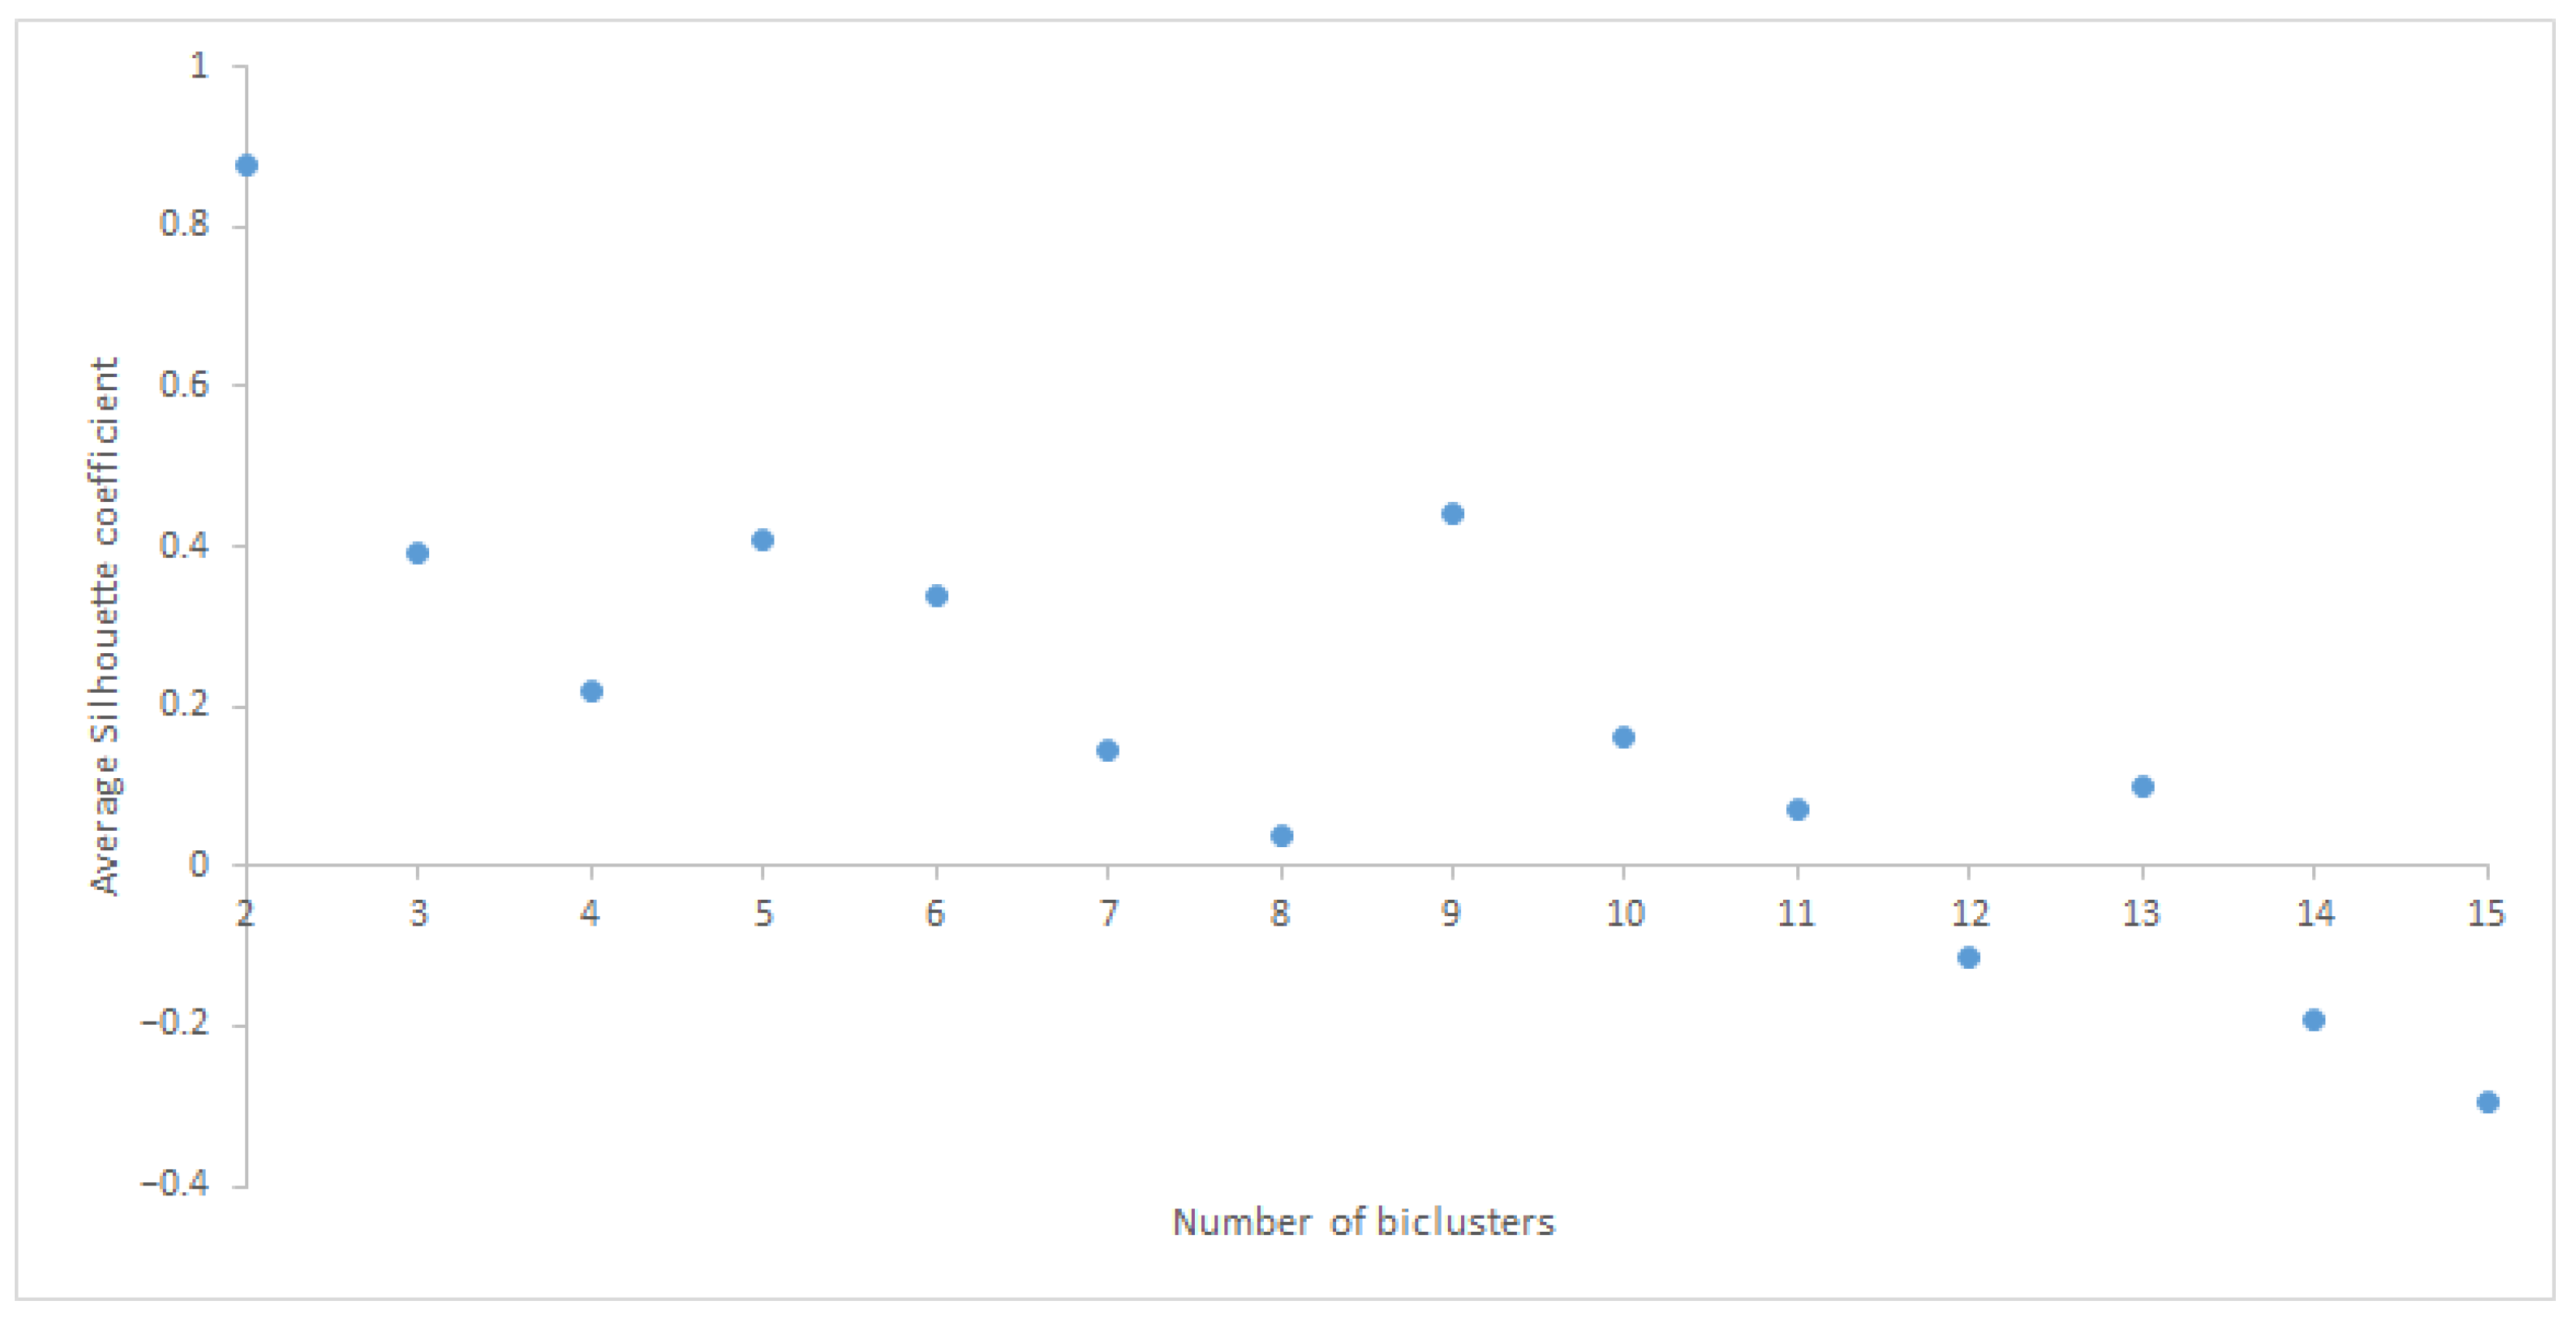
Figure 2.
Our HMM represented as a graph.
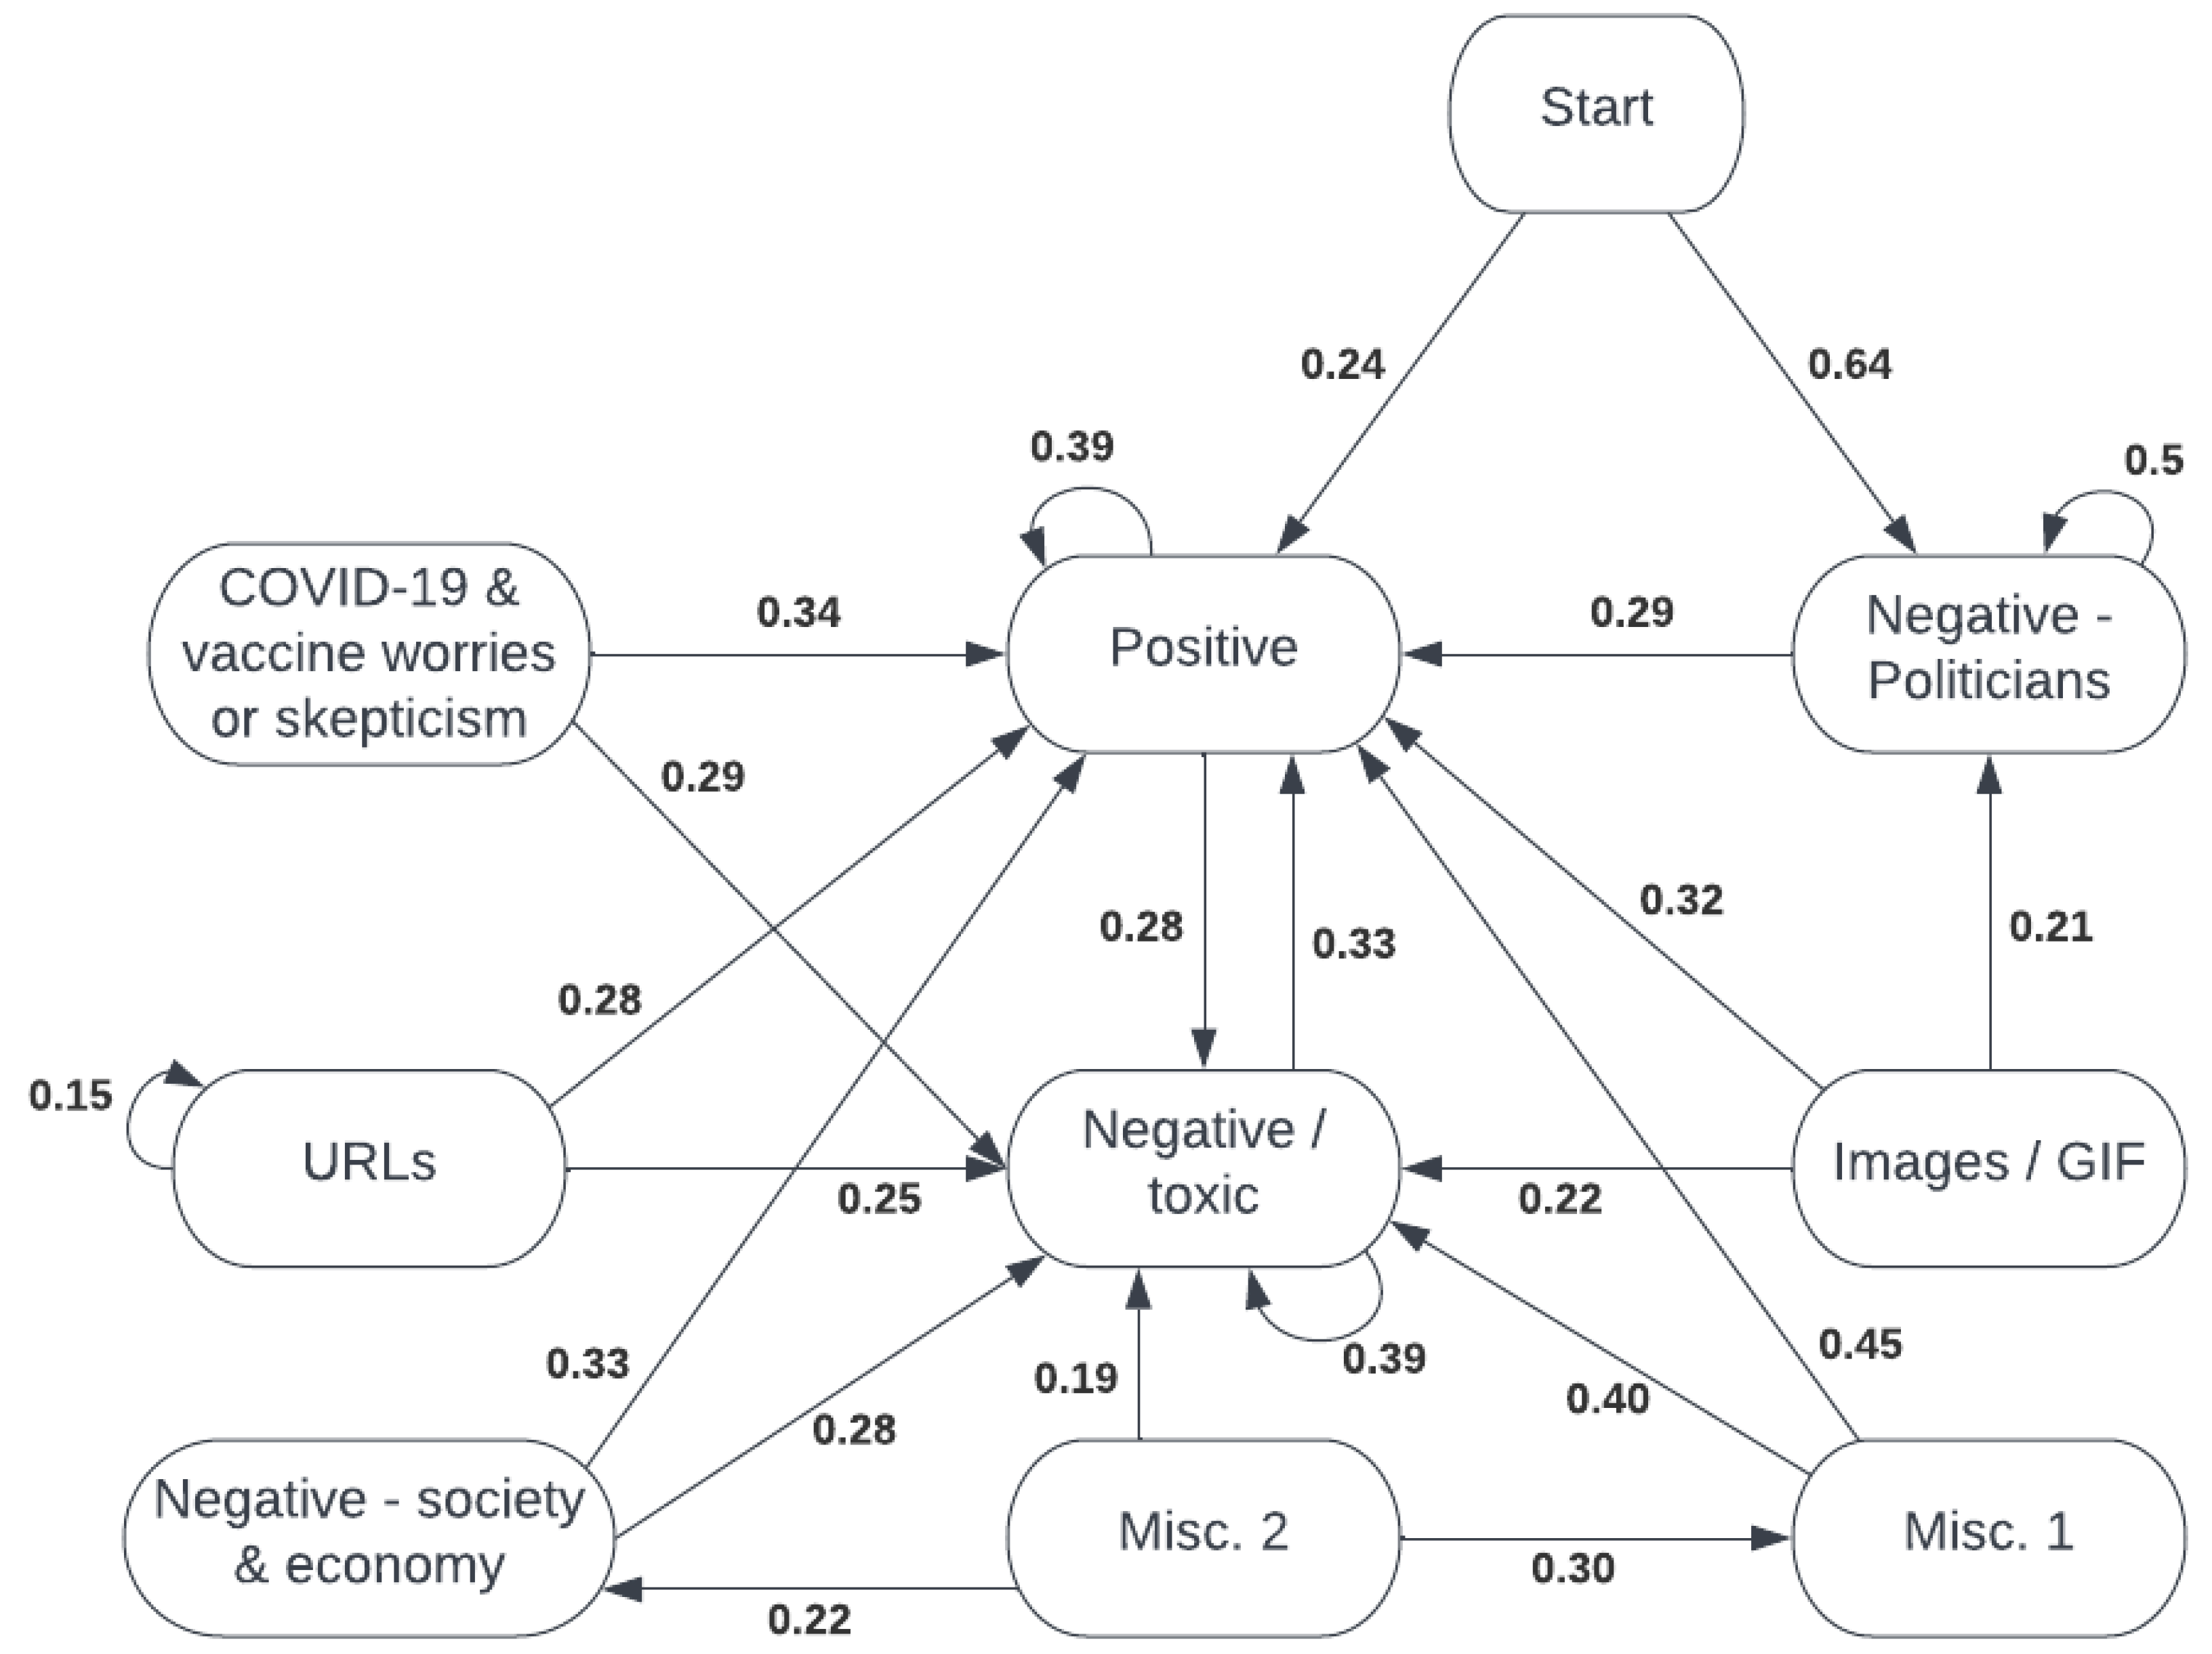
Figure 3.
Heatmap of the emission probabilities of our HMM.

Table 1.
Full list of the features extracted from the comments.
| Name | Description |
|---|---|
| Toxicity score | Degree to which the comment contains some form of toxicity. Continuous (between 0 and 1). |
| Sarcasm score | Degree to which the comment contains sarcasm. Continuous (between 0 and 1). |
| Sentiment score | Degree to which the comment is positive. Continuous (between 0 and 1). |
| Anger score | Degree to which the comment contains the anger emotion. Continuous (between 0 and 1). |
| Fear score | Degree to which the comment contains the fear emotion. Continuous (between 0 and 1). |
| Joy score | Degree to which the comment contains the joy emotion. Continuous (between 0 and 1). |
| Love score | Degree to which the comment contains the love emotion. Continuous (between 0 and 1). |
| Sadness score | Degree to which the comment contains the sadness emotion. Continuous (between 0 and 1). |
| Surprise score | Degree to which the comment contains the surprise emotion. Continuous (between 0 and 1). |
| Contains URL | 1 if the comment contains an URL, 0 otherwise. |
| Contains Email | 1 if the comment contains an email address, 0 otherwise. |
| Contains hashtag | 1 if the comment contains a hashtag, 0 otherwise. |
| Image only | 1 if the comment contains only an image or a GIF but no text, 0 otherwise. |
| Starts with name | 1 if the comment starts with a proper noun referring to a person, 0 otherwise. |
| Comment length | Number of words in the comment. |
| Nbr likes | Number of likes on the comment. |
| Nbr first person singular pronouns | Number of first person singular pronouns that the comment contains. |
| Nbr first person plural pronouns | Number of first person plural pronouns that the comment contains. |
| Nbr second person pronouns | Number of second person pronouns (both singular and plural) that the comment contains. |
| Nbr third person singular pronouns | Number of third person singular pronouns that the comment contains. |
| Nbr third person plural pronouns | Number of third person plural pronouns that the comment contains. |
| Nbr politeness / gratitude | Number of terms of politeness and gratitude that the comment contains. |
| Elapsed time | How much time has passed between when this comment and the previous one were written |
| in the conversation. Measured in seconds. |
Table 2.
Kendall’s for our twelve trained Hidden Markov Models (HMMs) and Ritter’s models.
| Model | Value | Model | Value | Model | Value |
|---|---|---|---|---|---|
| Model #1 | 0.26 | Model #2 | 0.24 | Model #3 | 0.23 |
| Model #4 | 0.22 | Model #5 | 0.20 | Model #6 | 0.18 |
| Model #7 | 0.13 | Model #8 | 0.11 | Model #9 | 0.10 |
| Model #10 | 0.09 | Model #11 | 0.09 | Model #12 | 0.08 |
| EM Conversation | 0.22 | Conversation + Topic | 0.26 | Bayesian Conversation | 0.28 |
Table 3.
Description of the 9 hidden states, with examples of their most meaningful unigrams and bigrams.
Table 3.
Description of the 9 hidden states, with examples of their most meaningful unigrams and bigrams.
| Name | Description | Examples of Most Relevant Unigrams and Bigrams | Proportion of Comments from the Dataset |
|---|---|---|---|
| Positive | Comments that are mostly positive. | Delicious, congratulations, condolences, fantastic, adorable, much happiness, filled joy, well done, beautiful story, happy birthday, etc. | 35.70% |
| Images/GIF | Comments that consist of only an image or a GIF, with no text. | N/A | 0.86% |
| Negative/toxic | Comments that are negative and toxic in general. | Vicious, vile, drunken, bitch, petty, pretty racist, jealous con, fascist regimes, notoriously vicious, etc. | 29.02% |
| COVID-19 and vaccine worries or skepticism | Comments that reflect people’s worries about the vaccine and COVID-19 in general, as well as their skepticism towards both of these aspects. Feelings of discomfort and uneasiness related to the lockdown are also present in these comments. | Poliovirus, terrified, claustrophobic, skeptical, frightened, reluctant, nervous, feel uncomfortable, URL vaccines, plandemic scamdemic, really scared, URL brainwashing, vaccine derived, etc. | 5.44% |
| URLs | Comments that are mostly made up of users linking URLs, with little to no additional text. | N/A | 1.29% |
| Negative—society and economy | Comments that contain a lot of negativity aimed towards the state of society and economy. | Doomed, deprived, teetering, disgraceful, crumbling, dysfunctional, agonizing, failed economic, disrupting economy, warnings imploring, hoarding country, decimated economy, lost jobs, crash bankrupts, etc. | 9.25% |
| Negative—politicians | Comments that contain a lot of negativity aimed towards politicians and governments. Contains a few hashtags. | #teardowntrudeau, #thisisamerica, overlords, spineless, #npisfakenews, humiliate bureaucratic, overlords demanding, bureaucratic overlords, trump trash, liberal retardation, hot mess, deficits matter, etc. | 12.54% |
| Misc. 1 | Long messages on a variety of topics. | Khalifa, merciful, chastisement, Allah, vigour, herbal, human physicians, oil rich, grand quran, private sector, misleading information, etc. | 3.78% |
| Misc. 2 | Long messages on a variety of topics. | Allah, trachea, stable financially, peace upon, investment trade, allah chastisement, wonderful mentorship, war crimes, isreali regime, economic growth, private sector, etc. | 2.12% |
Table 4.
Probability of comments from each state for every moderation strategy.
| State | Baseline | Positive Start | Reduced Loops | Negative Intervention | Non-Negative Intervention | Positive Only |
|---|---|---|---|---|---|---|
| Positive | 33.59% | 33.59% | 37.17% | 39.16% | 40.61% | 43.22% |
| Images/GIF | 0.82% | 0.82% | 0.91% | 0.95% | 0.98% | 0.70% |
| Negative/toxic | 27.48% | 27.48% | 24.51% | 24.05% | 21.96% | 23.89% |
| COVID-19 and vaccine worries or skepticism | 5.20% | 5.20% | 5.76% | 6.07% | 6.31% | 4.54% |
| URLs | 1.31% | 1.31% | 1.44% | 1.52% | 1.64% | 1.10% |
| Negative—society and economy | 8.89% | 8.89% | 9.27% | 7.69% | 7.13% | 7.78% |
| Negative—politicians | 15.33% | 15.33% | 12.76% | 11.92% | 12.27% | 12.54% |
| Misc. 1 | 4.02% | 4.02% | 4.45% | 4.70% | 4.89% | 3.31% |
| Misc. 2 | 3.37% | 3.37% | 3.73% | 3.94% | 4.22% | 2.92% |
Disclaimer/Publisher’s Note: The statements, opinions and data contained in all publications are solely those of the individual author(s) and contributor(s) and not of MDPI and/or the editor(s). MDPI and/or the editor(s) disclaim responsibility for any injury to people or property resulting from any ideas, methods, instructions or products referred to in the content. |
© 2023 by the authors. Licensee MDPI, Basel, Switzerland. This article is an open access article distributed under the terms and conditions of the Creative Commons Attribution (CC BY) license (https://creativecommons.org/licenses/by/4.0/).
Share and Cite
MDPI and ACS Style
Gélinas-Gascon, F.; Khoury, R. Modeling and Moderation of COVID-19 Social Network Chat. Information 2023, 14, 124. https://doi.org/10.3390/info14020124
AMA Style
Gélinas-Gascon F, Khoury R. Modeling and Moderation of COVID-19 Social Network Chat. Information. 2023; 14(2):124. https://doi.org/10.3390/info14020124
Chicago/Turabian StyleGélinas-Gascon, Félix, and Richard Khoury. 2023. "Modeling and Moderation of COVID-19 Social Network Chat" Information 14, no. 2: 124. https://doi.org/10.3390/info14020124
Note that from the first issue of 2016, this journal uses article numbers instead of page numbers. See further details here.