
Practical Eco-Design and Eco-Innovation of Consumer Electronics—the Case of Mobile Phones


Abstract
:1. Introduction
- It does not introduce complicated analysis tools which would burden the designers.
- It does not have high barriers for adoption for fast paced commercial companies.
- Easy and fast to implement.
- Fully transparent.
- Cost-effective.
Hypothesis
2. Materials and Methods—Approach
- Literature review
- Describe the eco-design process EcoSmarT.
- Show an application of EcoSmarT on phone models B and C.
- Briefly introduce emerging approaches for product sustainability evaluation and show examples of results for phones A, B, and C.
- Discuss the results.
- Conclusions and outlook.
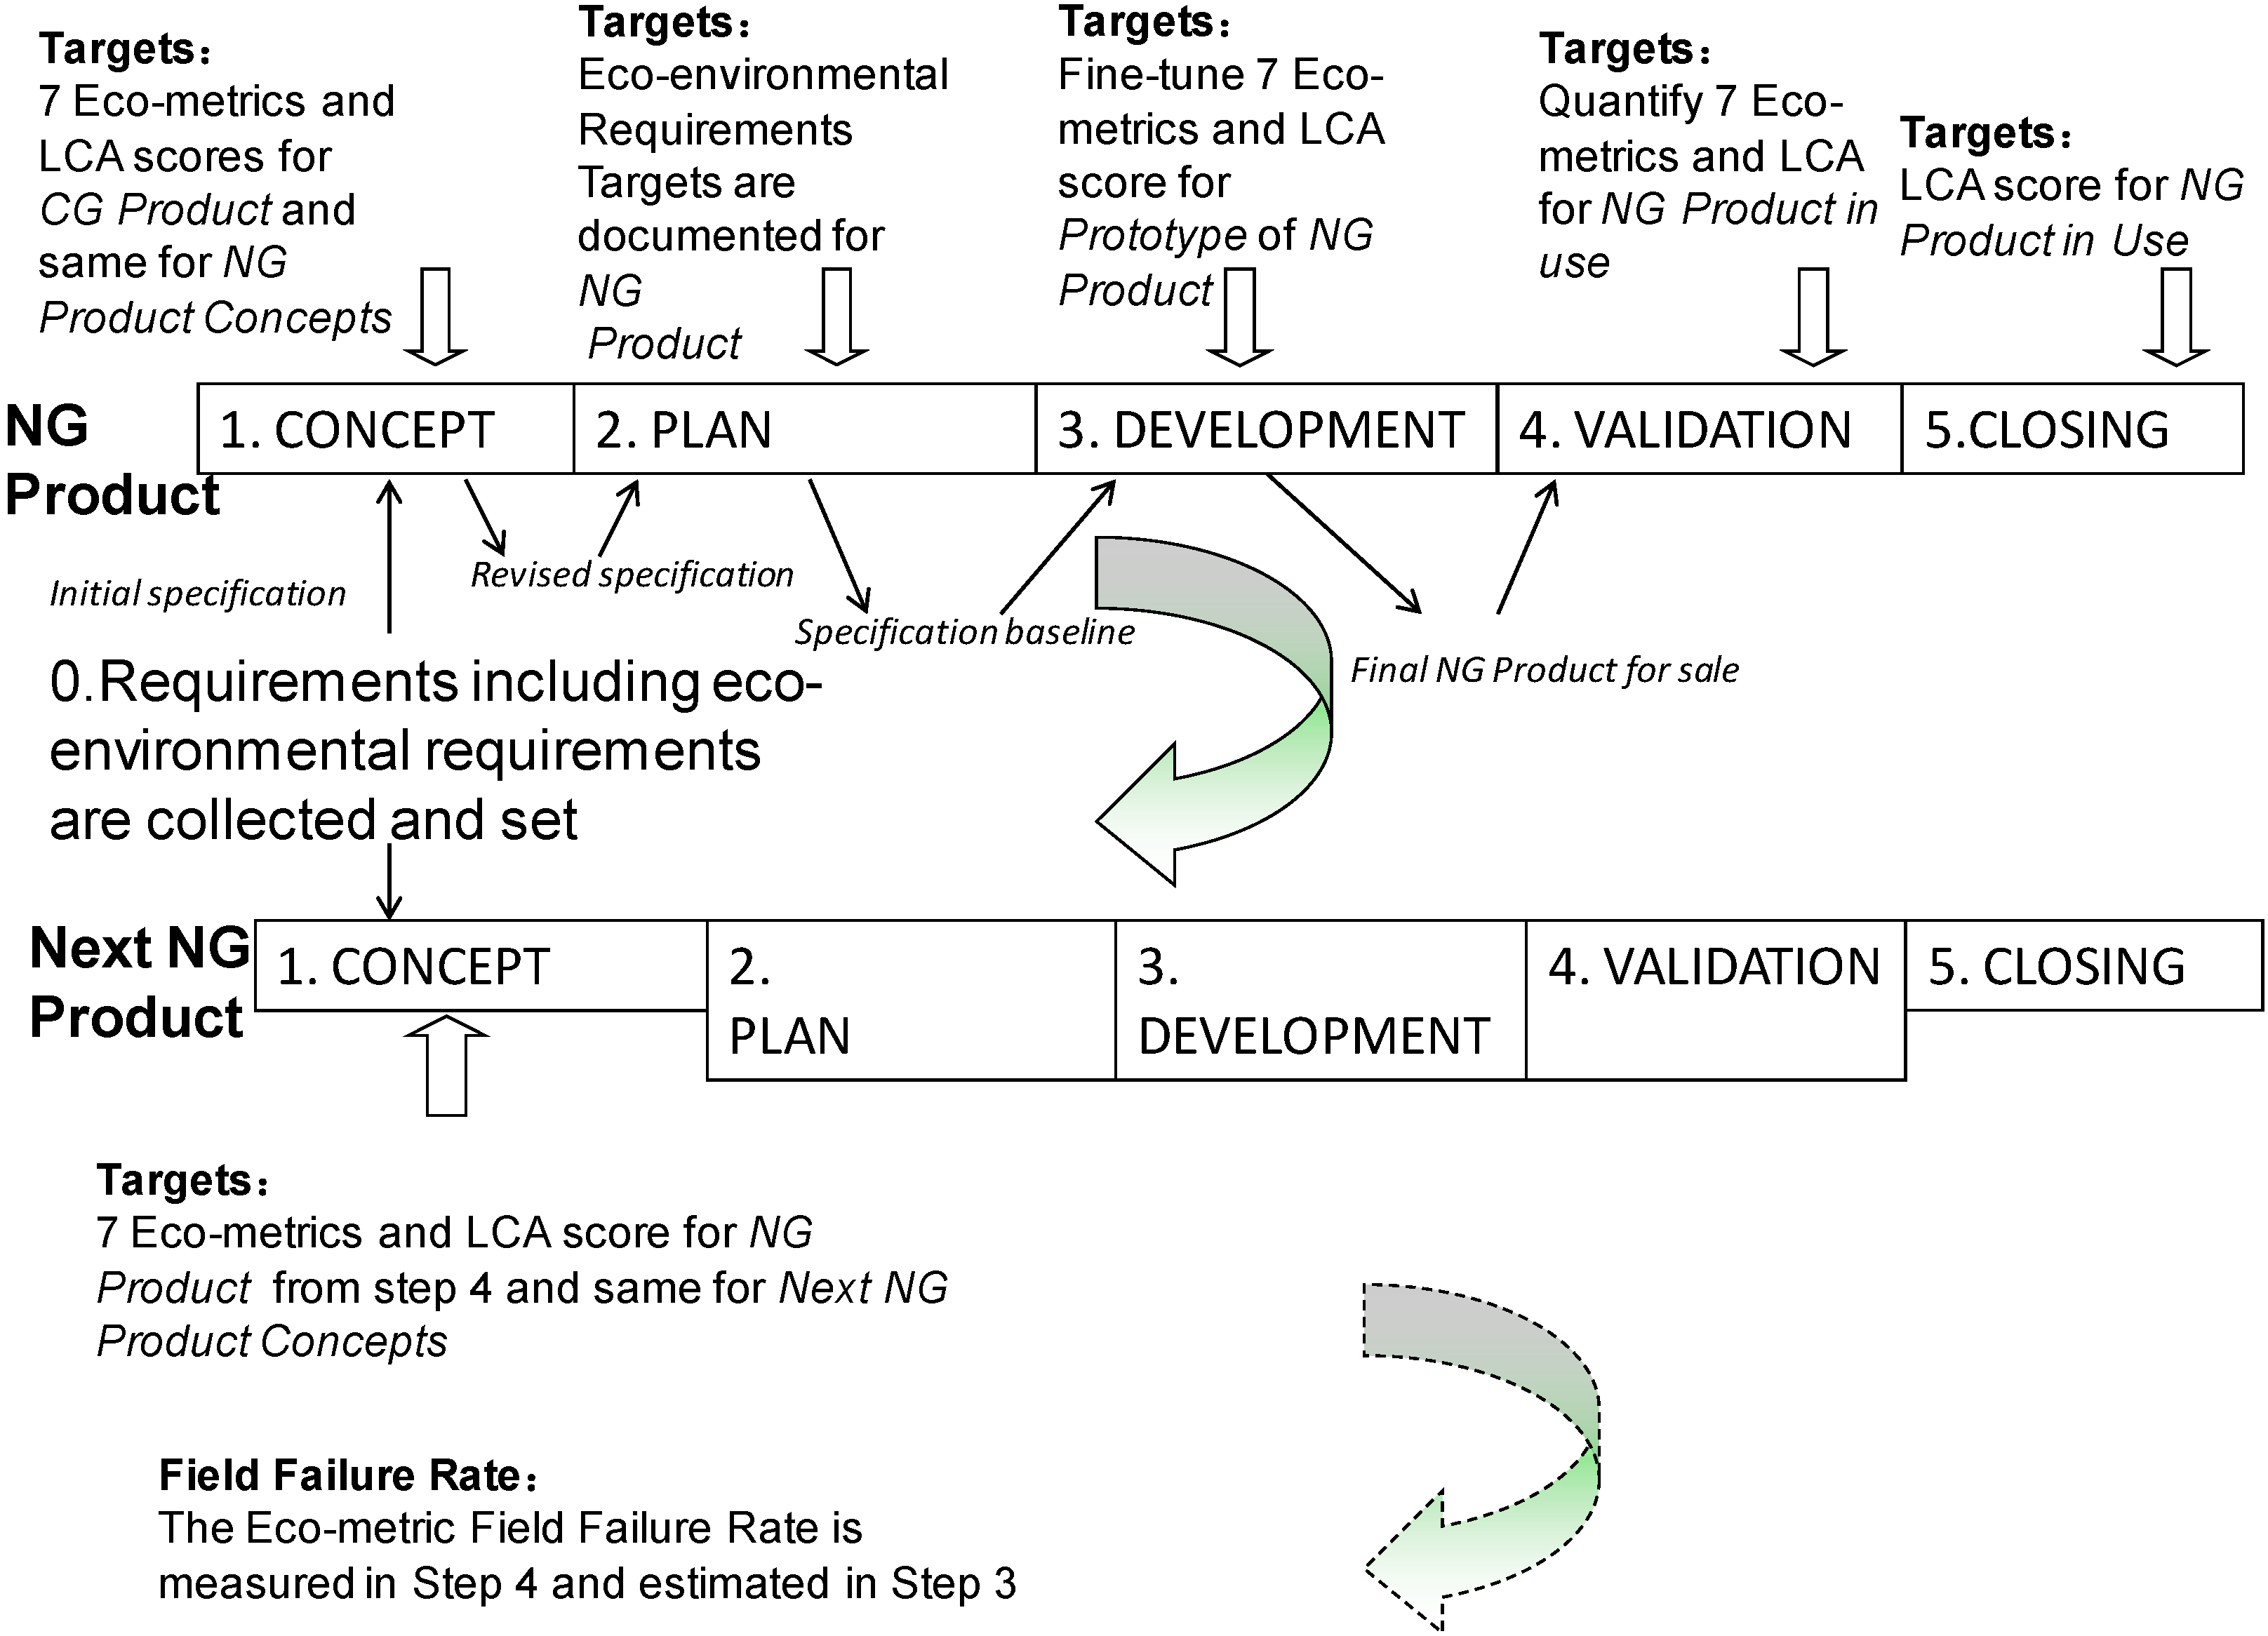
3. Eco-Design Method EcoSmarT
3.1. Eco-Metrics
- Energy efficiencyEnergy efficiency is a rather broad concept defined as the quotient between the energy needed to do useful work and total energy actually used. The metric refers to the use stage energy and is product-specific. Examples applicable to mobile phones are charger efficiency, absorbed power, charging time, and receiver sensitivity.
- Packaging materials mass and volumeThis metric refers to the mass and volume of the packaging materials, such as cardboard, paper, and plastics. The target is to reduce the volume and mass.
- Hazardous substancesThis metric refers to mass of hazardous substances which are neither regulated nor banned. It can also be qualitative measures such as elimination of substance usage.
- Precious metalsThis metric refers to masses of gold, silver, platinum, palladium, and other valuable metals such as tantalum, indium, rhodium, ruthenium, osmium, and iridium.
- Total massThis metric refers to the total mass of the designed product including the accessories. The target is to reduce the mass.
- Recyclability, recoverability, reuse-ability, disassemble-abilityThe recyclability rate is typically defined as the amount of materials which can be recycled divided by the total mass of the product [86]. Several new 5R metrics have been defined for products [86]. It is judged from case to case if energy recycling is to be included and which recyclability metrics are to be applied. An example of a 5R metric is time of disassembly [87].The focus shall generally be on easy and fast disassembly, material identification, fewer material types and less surface finish, etc., which all help increase the recyclability.
- Lifetime reliabilityThis metric usually refers to FFR. FFR is defined as the frequency at which an engineered system fails [88]. The mean time between failure (MTBF) scores can be determined by FFR data.
3.2. Life Cycle Assessment (LCA)
3.3. Collection of Requirements
3.4. Design Step 1, Concept: Drafting of Design Concepts
3.5. Design Step 2, Plan
3.6. Design Step 3, Development
3.7. Design Step 4, Customer Validation
3.8. Design Step 5, Closing Process.
4. Application of EcoSmarT to the Development of Phone B to C
4.1. Collection of Requirements
- Increase the stand-by time compared to B
- Introduce a bio-based plastic
- Eliminate brominated flame retardants/chlorinated flame retardants from the main body
- Eliminate polyvinyl chloride (PVC)
- Eliminate phthalates
- Introduce Forest Steward Council (FSC) certified color box
- Introduce soy-ink printing
- Reach a certain score for various Eco-Ratings (see clause 5),
- Fulfill Energy Star standards,
- Fulfill Code of Conducts for energy efficiency,
- Fulfill various eco-labels.
- Remove hazardous substances beyond legislation
- Uses bio-based plastics for the front shell instead of petro-based plastics.
- Has lower packaging materials volume.
- Has longer talk time and stand-by time.
- Uses soy ink for the packaging box and manual.
- Have no painted mechanical parts.
- Innovated the packaging.
4.2. Design Step 1, Concept: Drafting of Design Concepts for Phone
4.3. Design Step 2, Plan of Phone
- fine-tune and improve three of seven eco-metrics
- has >5% lower packaging volume than B
- has at least 10% better autonomy time in stand-by than B

| Eco-Metric | Value for B | Target Value for a C Concept | Unit | Comment |
|---|---|---|---|---|
| 1. Energy efficiency | 422 | 475 | hours | Mobile autonomy time in stand-by mode (charged at 100%) |
| 2. Packaging materials volume | 825 | 784 | cm3 | The metric is also used in Open Eco Rating (OER) [91] |
| 3. Hazardous substances | Meet the requirements of laws and regulations | PVC, Be, phthalates and triphenyl phosphate eliminated | Qualitative. | OER [91] contains similar metrics. |
| 4. Precious metals (Au, Ag) | 240 | 150 | mg | The metric is also used in OER [91]. |
| 5. Total mass | 392 | 454 | g | Total mass (mobile phone including battery + charger + accessories + packaging). The metric is also used in OER [91]. |
| 6. Recyclability (metals and polymers) | 80 | 90 | % | Can only be measured for C when it has been used by customer. |
| 7.Lifetime reliability | Not specified. | Not specified. | % | Can only be measured for C when it has been used by customer. |
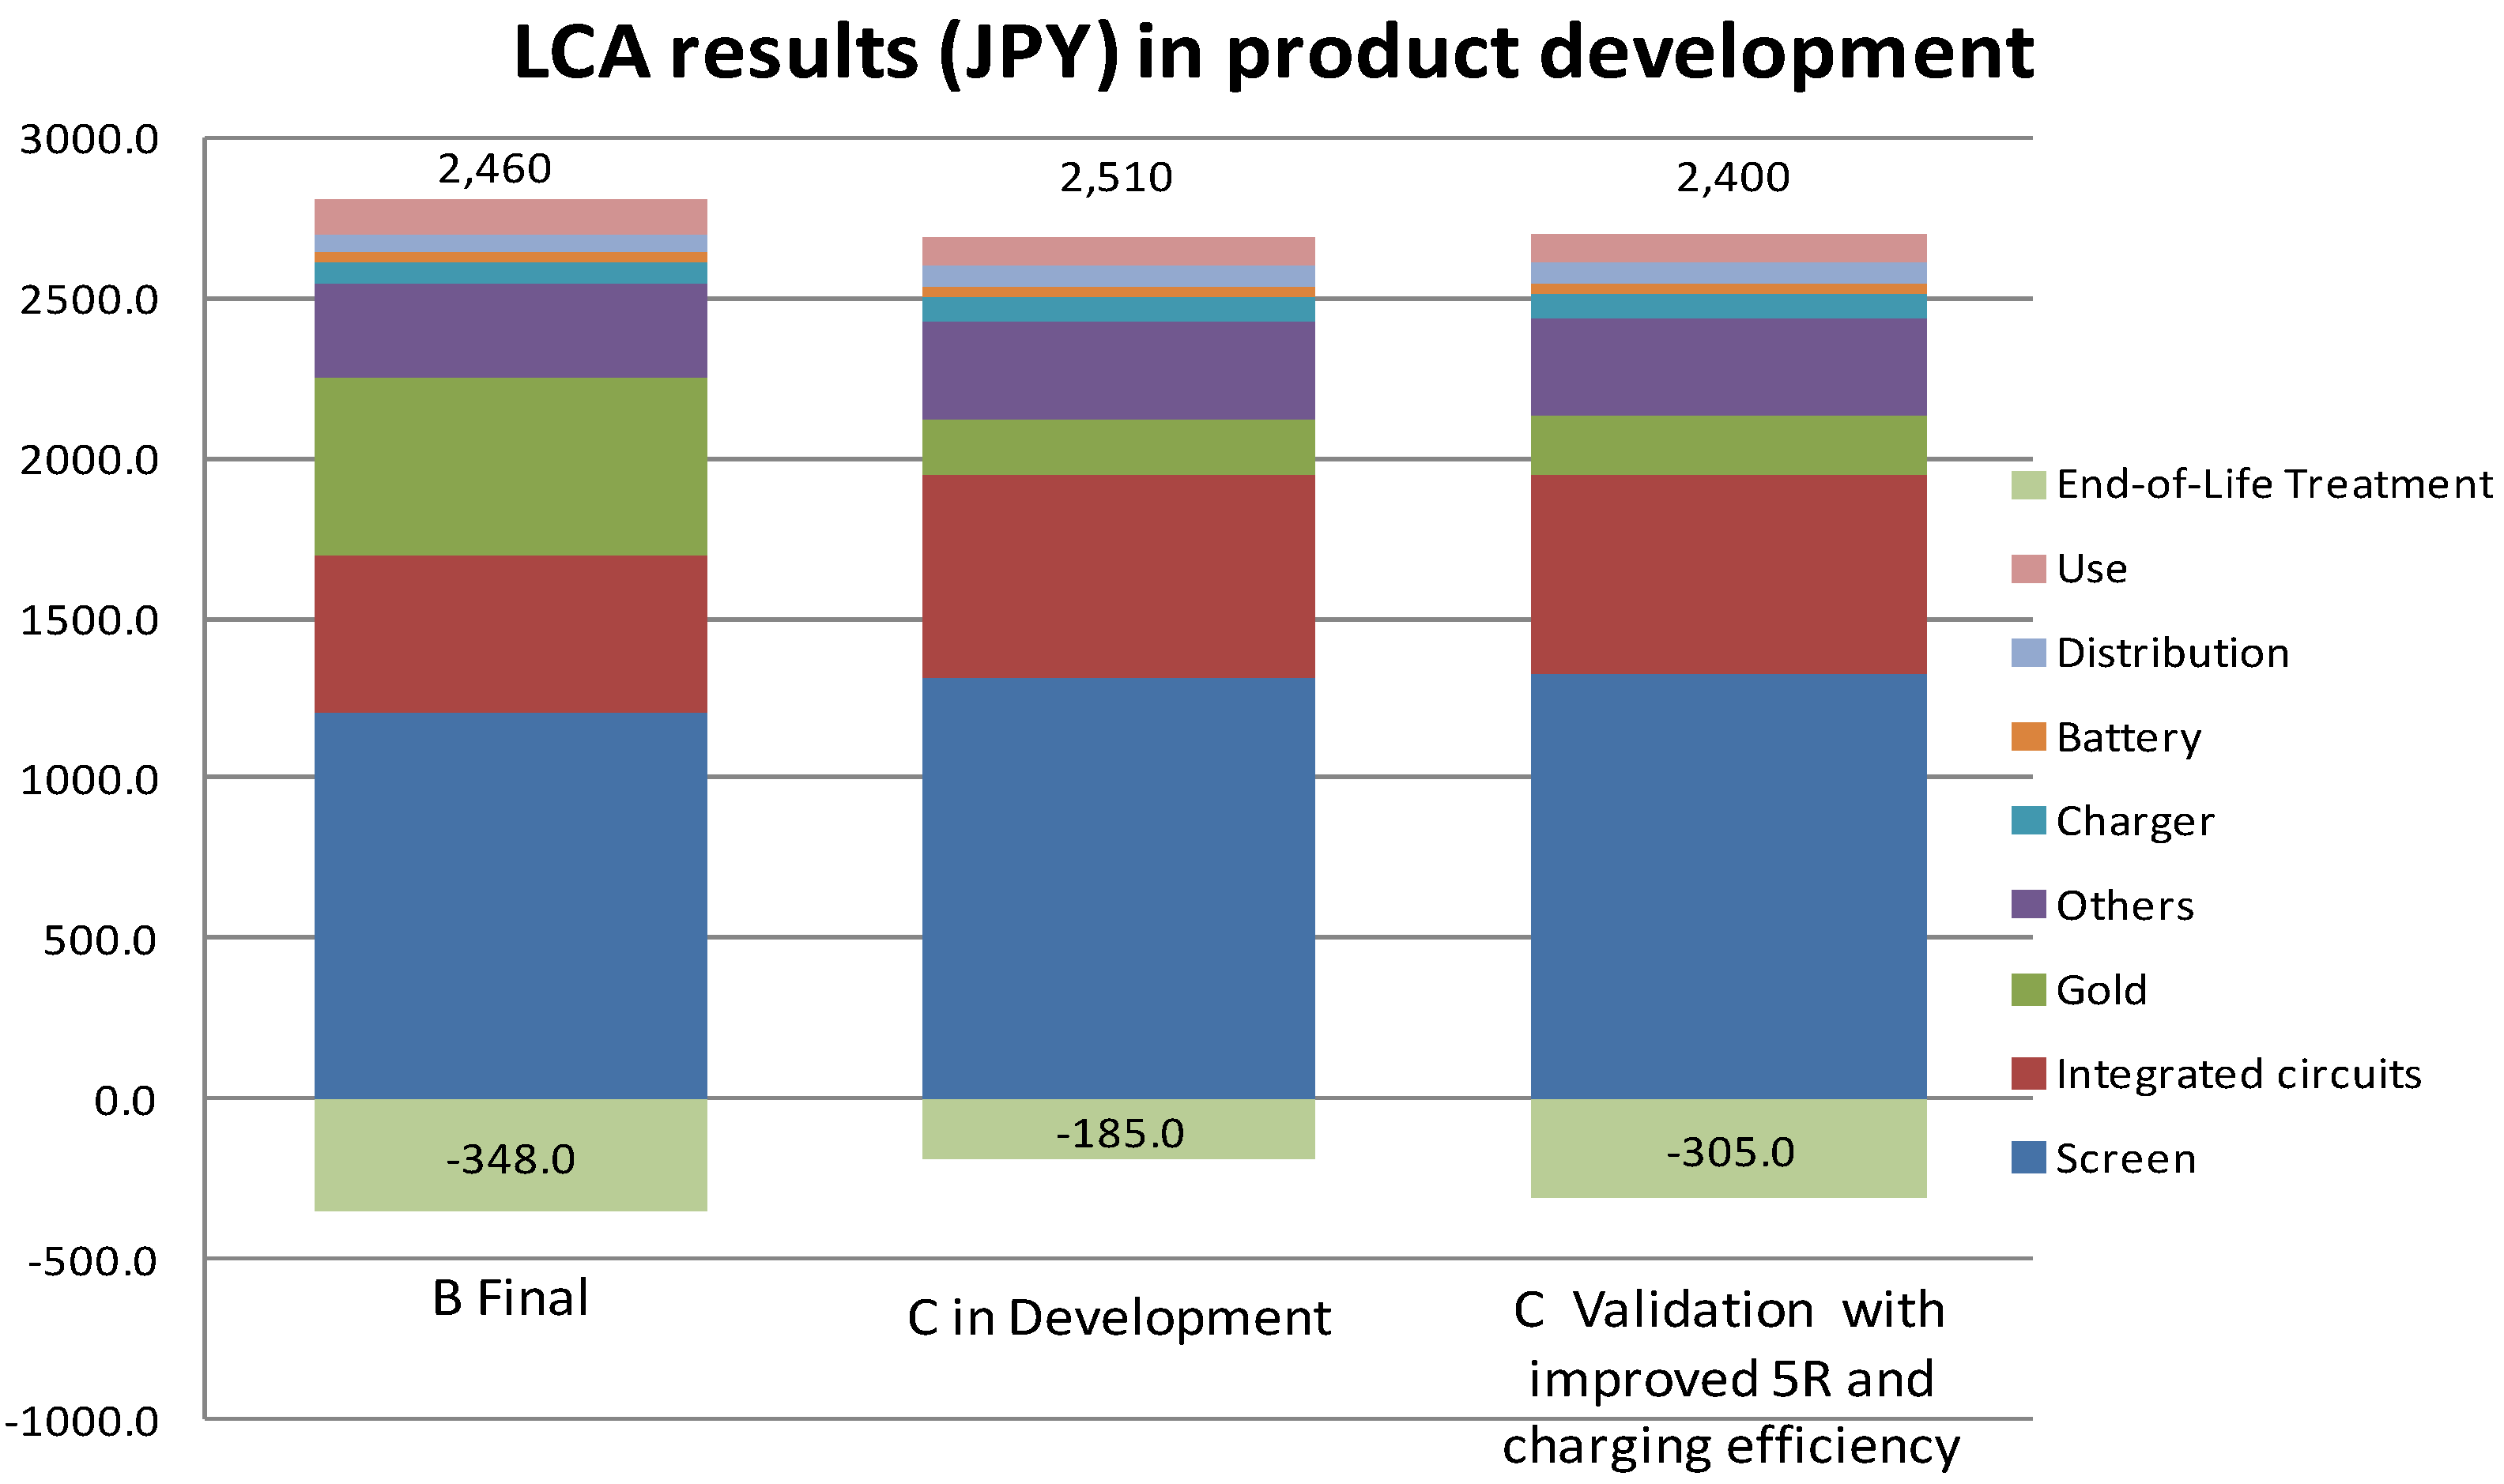
| 8. LCA score | 2460 JPY | 2510 JPY, (the effect of improved 5R and charging efficiency can be explored) | JPY | LIMEv2 weighting method [89]. For Assembly of C a proxy value is used. Re-use has a relatively strong correlation with the LCA score, whereas the correlation is low for Bio-plastics. |
4.4. Design Step 3, Development of Phone
- fine-tuned and improved three of seven eco-metrics (Yes, autonomy time in stand-by, packaging volume, and total mass)
- has >5% lower packaging volume than B (Yes)
- has at least 10% better autonomy time in stand-by than B (Yes)
- has better absolute LCA score than B (No, but as more data are collected about actual life cycle performance it could change in step 4.4)
| Eco-Metric | Value for a C Prototype | Value for C Final Design | Unit | Comment |
|---|---|---|---|---|
| 1. Energy efficiency | 475 | 480 | hours | Mobile autonomy time in stand-by mode (charged at 100%) |
| 2. Packaging materials volume | 783 | 780 | cm3 | Improvements are made during development. |
| 3. Hazardous substances | PVC, Be, phthalates and triphenyl phosphate eliminated | PVC, Be, phthalates and triphenyl phosphate eliminated | Qualitative. | |
| 4. Precious metals (Au, Ag) | 151 | 154 | mg | |
| 5. Total mass | 454 | 450 | g | |
| 6. Recyclability (metals and polymers) | 80 | 80 | % | Recoverability can only be measured for C when it has been used by customer. |
| 7. Lifetime reliability | Not specified | Not specified | % | Estimations based on similar product to C |
| 8. LCA score | 2510 | 2510 | JPY | LIMEv2 weighting method [89]. |
4.5. Design Step 4, Customer Validation of C
| Eco-Metric | Value for C Final Design | Unit | Comment |
|---|---|---|---|
| 1. Energy efficiency | 480 | hours | Mobile autonomy time in stand-by mode (charged at 100%) + improved charging efficiency when (fast) charging the battery |
| 2.Packaging materials volume | 780 | cm3 | |
| 3.Hazardous substances | PVC, Be, phthalates and triphenyl phosphate eliminated | Qualitative | |
| 4. Precious metals (Au, Ag) | 154 | mg | |
| 5. Total mass | 450 | g | |
| 6. Recyclability (metals and polymers) | 90 | % | (5% Re-use, 5% Re-manufacturing, 90% gold recovery, [92]) |
| 7. Lifetime reliability | Not specified. | % | Measurement |
| 8. LCA score | 2400 | JPY | LIMEv2 weighting method [89]. Solar generated power for assembly of C, improved gold recovery, re-use, re-manufacturing and charging efficiency. |
4.6. Design Step 5, Closing the C Design Project
5. Eco-Innovation Based on Emerging Frameworks and Tools: Eco-Rating and Sustainability Assessment Standard Framework
5.1. UL110 Eco-Rating
5.2. Open Eco-Rating
5.2.1. Corporate Score
5.2.2. Simplified Proxy LCA
5.2.3. Responsible Design
5.2.4. Functionality
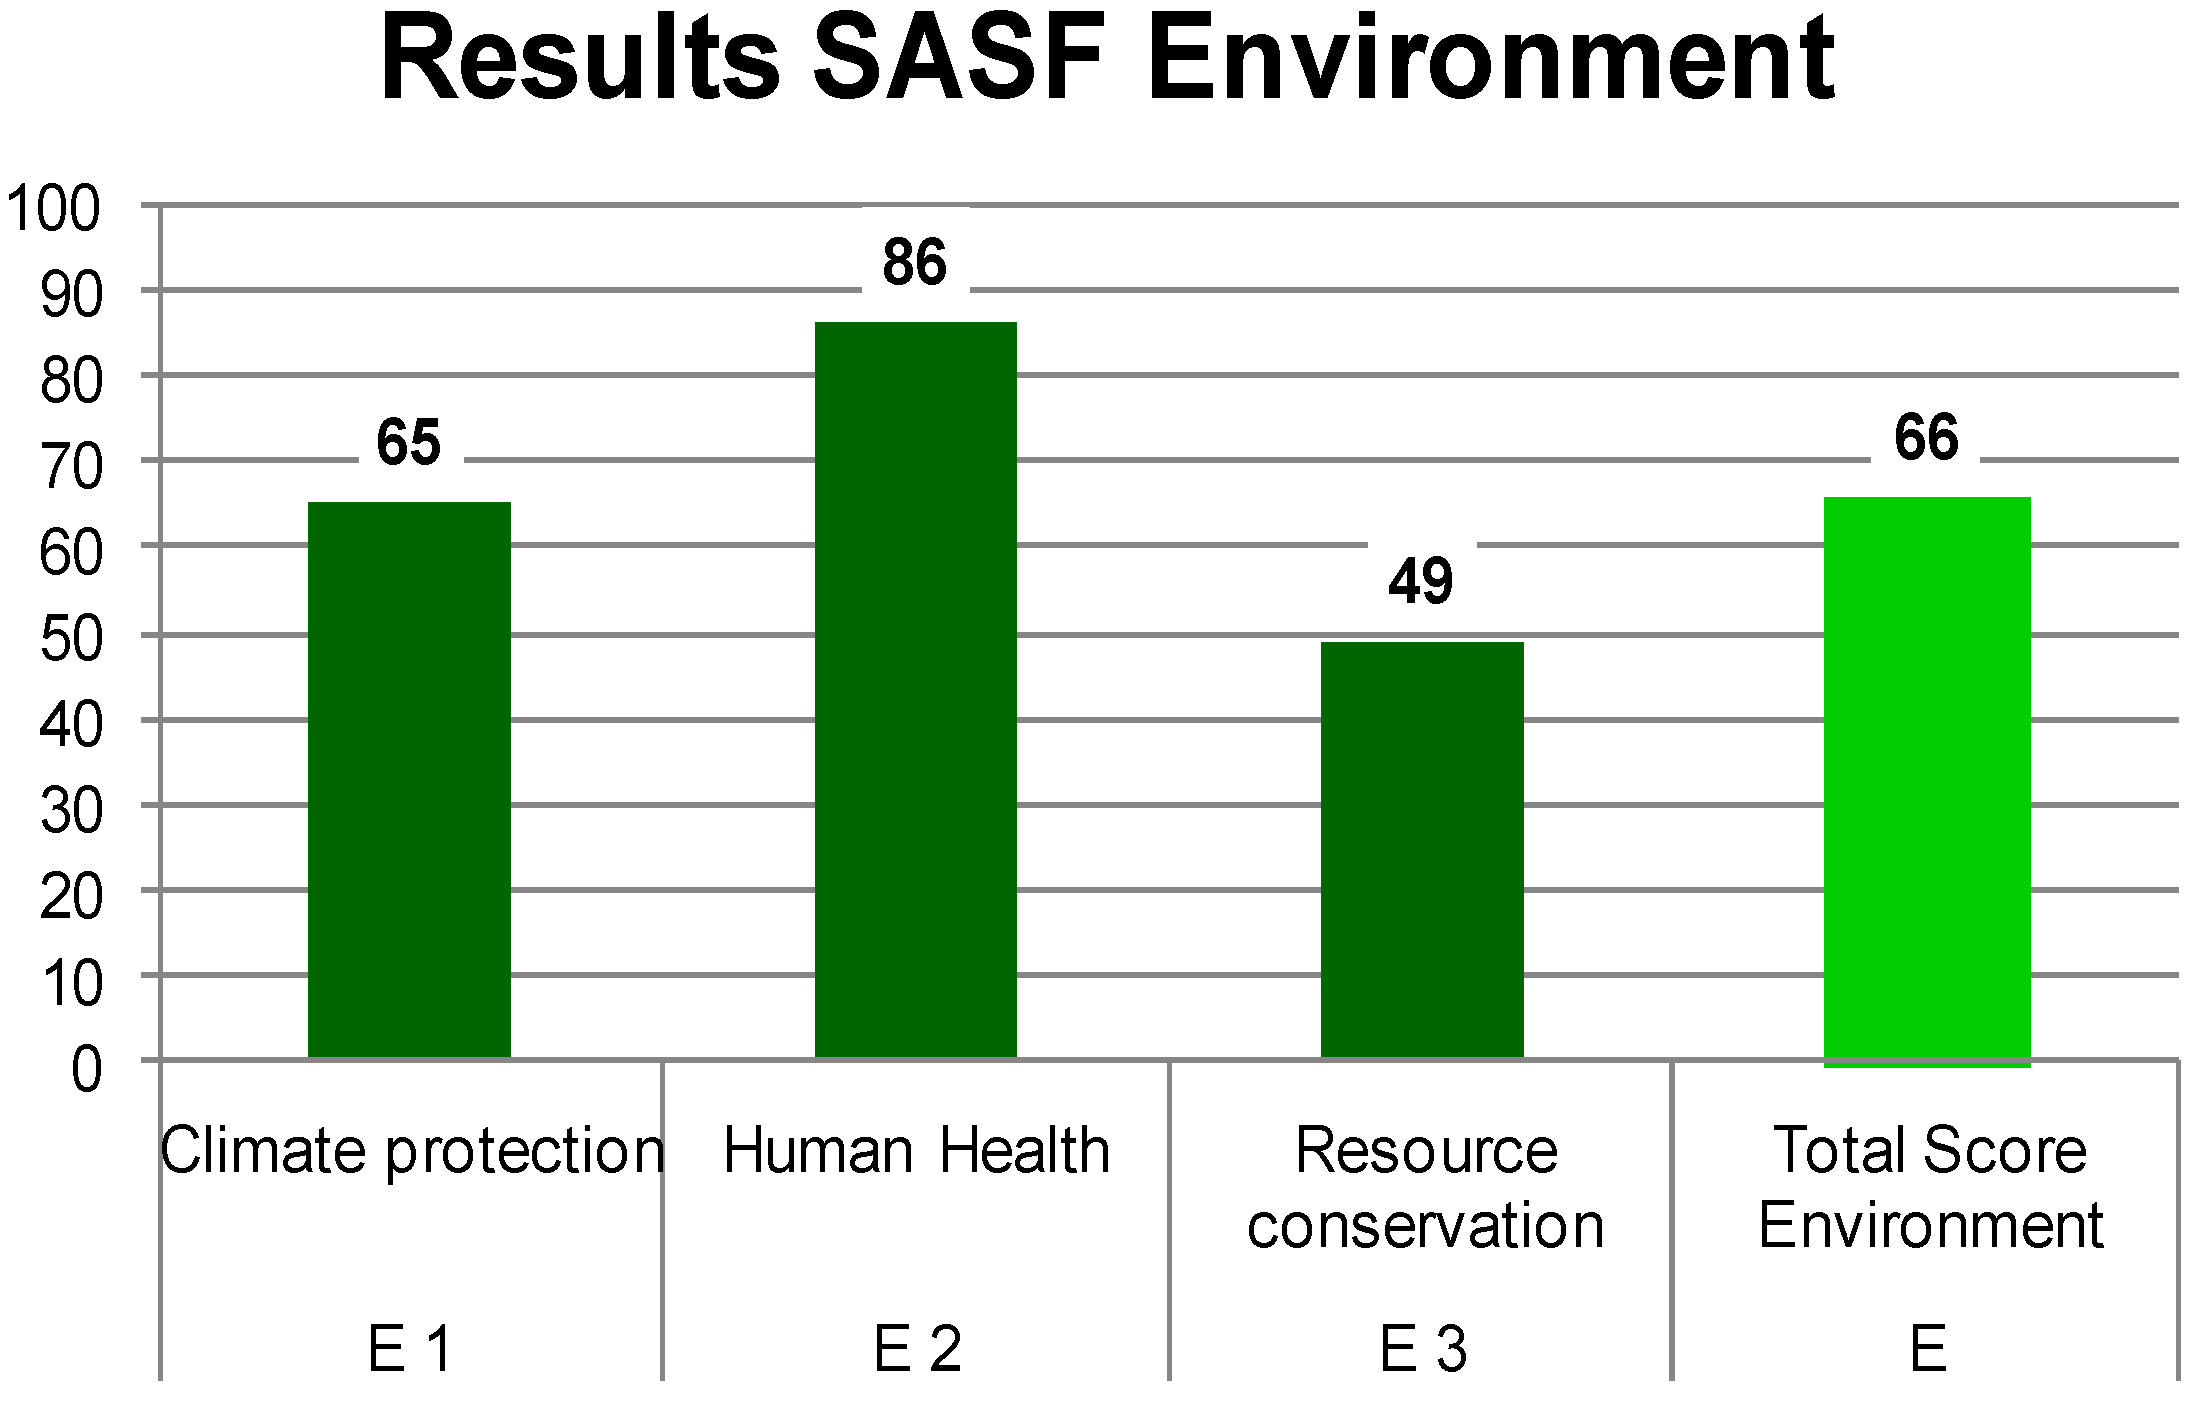
5.3. Sustainability Assessment Standard Framework (SASF)—Evaluation of End-User Equipment
- Evaluation of mobile phones (and other end-user hardware) using SASF Environment and OER LCA/Functionality have different purposes;
- The purpose of SASF Environment is to monitor the green policy of a company, whereas OER LCA puts footprint indicator values (GWP100 and RMD) for individual mobile phones based on their individual metrics (display area, silicon die sizes, battery capacity, printed circuit boards area/number of copper layers, etc.);
- SASF cannot calculate an individual footprint, e.g., 50 kg CO2e, for a mobile phone, nor does it have the resolution for individual specific products, such as mobile phones;
- On the contrary, OER LCA and OER Functionality should be included as sub-criteria in the SASF Environment if the SASF evolution is done for a mobile phone; and
- SASF is a general company portfolio rating tool (horizontal) and OER (especially LCA, but also most of the Responsible Design and Functionality) is a very specific rating tool (vertical) for mobile phones.
| Criteria in Eco-Rating | A | B | C | Comment |
|---|---|---|---|---|
| Corporate Score based on EcoVadis criteria (30% weight) | 5.0/10 | 5.1/10 | 5.8/10 | Improvements: landfill rate, energy efficiency of wireless products, shipments with green packaging, solar power generated power, number of recycling stations, number of certified suppliers |
| Simplified LCA proxy score (30%) | 5.2/10 | 4.9/10 | 5.3/10 | |
| GWP100 (15%) | 5.4/10 | 4.5/10 | 3.7/10 | Gradually larger and heavier phones |
| RMD (15%) | 5.0/10 | 5.2/10 | 6.9/10 | Gradually less amounts of gold, silver, tin, tantalum and indium per phone. |
| Responsible Design score (40% weight) | 4.1/10 | 4.4/10 | 5.5/10 | |
| Product durability & life extension (13%) | 4.7/10 | 4.7/10 | 4.7/10 | |
| Power conservation (7%) | 10/10 | 10/10 | 10/10 | |
| Sustainable materials (10%) | 3.3/10 | 3.9/10 | 5.8/10 | Improvements: elimination of PVC, Be, phthalates and triphenyl phosphate |
| Packaging & logistics efficiency (7%) | 3.6/10 | 4.1/10 | 6/10 | Improvements: Paper and cardboard are FSC certified and marked accordingly |
| Disposal impacts (3%) | 0/10 | 0/10 | 0/10 | Only >90wt% proven material recoverability render any points |
| Functionality | 1/6 | 6/6 | 6/6 | Improvement: replace need for digital compact camera |
| Total OER score | 2.4/5 | 2.7/5 | 3.0/5 | Improvement |

6. Discussion
6.1. Eco-Design Method EcoSmarT
6.2. Emerging Approaches Which Complement EcoSmarT
7. Conclusions
- A low-barrier eco-design method for convenient measurement of eco-metrics has been presented;
- Eco-innovation is successfully implemented in the mobile phone industry; and
- Innovation of materials and energy supply are measured by LCA and eco-rating.
8. Next Steps
Universal Chargers?
Acknowledgments
Author Contributions
Conflict of Interest
References
- Andrae, A.S.G.; Edler, T. On electricity usage of communication technology: Trends to 2030. Challenges 2015, 6, 117–157. [Google Scholar] [CrossRef]
- Silveira, G.T.; Chang, S.Y. Cell phone recycling experiences in the United States and potential recycling options in Brazil. Waste Manag. 2010, 30, 2278–2291. [Google Scholar] [CrossRef] [PubMed]
- Wong, S.K.S. The influence of green product competitiveness on the success of green product innovation: Empirical evidence from the Chinese electrical and electronics industry. Europ. J. Innov. Manag. 2012, 15, 468–490. [Google Scholar]
- Ramani, R.; Ramanujan, D.; Bernstein, W.Z.; Zhao, F.; Sutherland, J.; Handwerker, C.; Choi, J.K.; Kim, H.; Thurston, D. Integrated sustainable life cycle design: A review. J. Mech. Des. 2010, 132, 091004. [Google Scholar] [CrossRef]
- Unger, N.; Schneider, F.; Salhofer, S. A review of eco-design and environmental assessment tools and their appropriateness for electrical and electronic equipment. Prog. Ind. Ecol. Int. J. 2008, 5, 13–29. [Google Scholar] [CrossRef]
- De Langhe, P.S.; Criel, S.; Ceuterick, D. Green design of telecom products: The ADSL high speed modem as a case Study. IEEE Trans. Comp. Pack. Manuf. Technol. Part A 1998, 21, 154–167. [Google Scholar] [CrossRef]
- Nagel, M.H. Environmental supply-line engineering: Eco-supplier development coupled to eco-design—A new approach. Bell Labs Tech. J. 1998, 3, 109–123. [Google Scholar] [CrossRef]
- Andrae, A.S.G.; Östermark, U.; Liu, J. Life cycle assessment of a telecommunications exchange. J. Electron. Manuf. 2000, 10, 147–160. [Google Scholar] [CrossRef]
- Mathieux, F.; Rebitzer, G.; Ferrendier, S.; Simon, M.; Froelich, D. Ecodesign in the European electronics industry—An analysis of the current practices based on cases studies. J. Sustain. Prod. Des. 2001, 1, 233–245. [Google Scholar] [CrossRef]
- Alonso, J.C.; Rodrigo, J.; Castells, F. Design for environment of electrical and electronic automotive components based on life cycle assessment. Gate EHS 2003, 17, 1–7. [Google Scholar]
- De Caluwe, N. Business benefits from applied EcoDesign. IEEE Trans. Electron. Pack. Manuf. 2004, 27, 215–220. [Google Scholar] [CrossRef]
- Andrae, A.S.G.; Zou, G.; Liu, J. LCA of electronic products—An environmental assessment of gallium arsenide monolithic microwave integrated circuit system-in-a-package switch product. Int. J. Life Cycle Assess. 2004, 9, 45–52. [Google Scholar] [CrossRef]
- Chen, L.; Andrae, A.S.G.; Zou, G.; Liu, J. Characterization of substrate materials for system-in-a-package. J. Electron. Pack. 2004, 126, 195–201. [Google Scholar] [CrossRef]
- Andrae, A.S.G.; Möller, P.; Anderson, J.; Liu, J. Uncertainty estimation by Monte Carlo simulation applied to life cycle inventory of cordless phones and microscale metallization processes. IEEE Trans. Electron. Pack. Manuf. 2004, 27, 233–245. [Google Scholar] [CrossRef]
- Andrae, A.S.G.; Andersson, D.R.; Liu, J. Significance of intermediate production processes in life cycle assessment of electronic products assessed using a generic compact model. J. Clean. Prod. 2005, 13, 1269–1279. [Google Scholar] [CrossRef]
- Donnelly, K.; Beckett-Furnell, Z.; Traeger, S.; Okrasinski, T.; Holman, S. Eco-design implemented through a product-based environmental management system. J. Clean. Prod. 2006, 14, 1357–1367. [Google Scholar] [CrossRef]
- Gurauskienė, I.; Varžinskas, V. Eco-design methodology for electrical and electronic equipment industry. Environ. Res. Eng. Manag. 2006, 3, 43–51. [Google Scholar]
- Ekvall, T.; Andrae, A.S.G. Attributional and consequential environmental assessment of the shift to lead–free Solders. Int. J. Life Cycle Assess. 2006, 11, 344–353. [Google Scholar] [CrossRef]
- Aoe, T. Eco-efficiency and ecodesign in electrical and electronic products. J. Clean. Prod. 2007, 15, 1406–1414. [Google Scholar]
- Ge, C.P.; Wang, B. An activity-based modelling approach for assessing the key stakeholders’ corporation in the eco-conscious design of electronic products. J. Eng. Design 2007, 18, 55–71. [Google Scholar]
- Andrae, A.S.G.; Itsubo, N.; Yamaguchi, H.; Inaba, A. Screening life cycle assessment of silver-based conductive adhesive vs. lead-based solder and plating materials. Mater. Trans. 2007, 48, 2212–2218. [Google Scholar] [CrossRef]
- Andrae, A.S.G.; Itsubo, N.; Inaba, A. Global environmental impact assessment of the Pb-free shift, Sold. Surf. Mount Technol. 2007, 19, 18–28. [Google Scholar] [CrossRef]
- Andrae, A.S.G.; Itsubo, N.; Yamaguchi, H.; Inaba, A. Life cycle assessment of high-temperature Japanese conductive adhesives. Environ. Sci. Technol. 2008, 42, 3084–3089. [Google Scholar] [CrossRef] [PubMed]
- Schoenmakers, T.J.M.; De Caluwe, N. Green DNA. Ind. Eng. 2008, 40, 47–51. [Google Scholar]
- Cerdan, C.; Gazulla, C.; Raugei, M.; Martinez, E.; Palmer, P.F. Proposal for new quantitative eco-design indicators: A first case study. J. Clean. Prod. 2009, 17, 1638–1643. [Google Scholar] [CrossRef]
- Muñoz, I.; Gazulla, C.; Bala, A.; Puig, R.; Fullana, P. LCA and ecodesign in the toy industry: Case study of a teddy bear incorporating electric and electronic components. Int. J. Life Cycle Assess. 2009, 14, 64–72. [Google Scholar] [CrossRef]
- Zhu, Q.; Liu, Q. Eco-design planning in a Chinese telecommunication network company. Benchm. Int. J. 2010, 17, 363–377. [Google Scholar] [CrossRef]
- Andrae, A.S.G.; Andersen, O. Life cycle assessments of consumer electronics—Are they consistent? Int. J. Life Cycle Assess. 2010, 15, 827–836. [Google Scholar] [CrossRef]
- Andrae, A.S.G.; Andersen, O. Life cycle assessment of integrated circuit packaging technologies. Int. J. Life Cycle Assess. 2011, 16, 258–267. [Google Scholar] [CrossRef]
- Yung, W.K.C.; Chan, H.K.; So, J.H.T.; Wong, D.W.C.; Choi, A.C.K.; Yue, T.M. A life-cycle assessment for eco-redesign of a consumer electronic product. J. Eng. Design 2011, 22, 69–85. [Google Scholar] [CrossRef]
- Yang, J; Chen, J.L. Accelerating preliminary eco-innovation design for products that integrates case-based reasoning and TRIZ method. J. Clean. Prod. 2011, 19, 998–1006. [Google Scholar]
- Lelah, L.; Mathieux, F.; Brissaud, D. Contributions to eco-design of machine-to-machine product service systems: The example of waste glass collection. J. Clean. Prod. 2011, 19, 1033–1044. [Google Scholar] [CrossRef]
- Andrae, A.S.G. The effect of revised characterization indices for N2O and CO2 in life cycle assessment of optical fiber networks—The case of ozone depletion and aquatic acidification. J. Green Eng. 2012, 3, 12–32. [Google Scholar]
- Ma, J.; Yin, F.; Liu, Z.; Zhou, X. The eco-design and green manufacturing of a refrigerator. Proc. Environ. Sci. 2012, 16, 522–529. [Google Scholar] [CrossRef]
- Andrae, A.S.G. Comparative micro life cycle assessment of physical and virtual desktops in a cloud computing network with consequential, efficiency, and rebound considerations. J. Green Eng. 2013, 3, 193–218. [Google Scholar]
- Chan, H.K.; Wang, X.; Chung, S.H. A fuzzy-AHP framework for evaluation of eco-design alternatives. Int. J. Innov. Manag. Technol. 2013, 4, 147–151. [Google Scholar]
- Evrard, D.; Brissaud, D.; Mathieux, F. Synergico: A method for systematic integration of energy efficiency into the design process of electr(on)ic equipment. Int. J. Sust. Eng. 2013, 6, 225–238. [Google Scholar] [CrossRef] [Green Version]
- Dufrene, P.; Zwolinski, P.; Brissaud, D. An engineering platform to support a practical integrated eco-design methodology. CIRP Annal Manuf. Technol. 2013, 62, 131–134. [Google Scholar] [CrossRef]
- Andrae, A.S.G.; Vaija, M.S. To which degree does sector specific standardization make life cycle assessments comparable?—The case of global warming potential of smartphones. Challenges 2014, 5, 409–429. [Google Scholar] [CrossRef]
- Andersen, O.; Gilpin, G.; Andrae, A.S.G. Cradle-to-gate life cycle assessment of the dry etching step in the manufacturing of photovoltaic cells. AIMS Energ. 2014, 2, 410–423. [Google Scholar] [CrossRef]
- Andrae, A.S.G. Method based on market changes for improvement of comparative attributional life cycle assessments. Int. J. Life Cycle Assess. 2015, 20, 263–275. [Google Scholar] [CrossRef]
- Andrae, A.S.G. Comparative screening life cycle impact assessment of renewable and fossil power supply for a radio base station site. Int. J. Green Technol. 2015, 1, 258–267. [Google Scholar]
- Rose, C.M.; Ishii, K. Product end-of-life strategy categorization design tool. J. Electron. Manuf. 1996, 9, 41–51. [Google Scholar] [CrossRef]
- Bras, B. Incorporating environmental issues in product design and realization. Ind. Environ. 1997, 20, 7–13. [Google Scholar]
- Cramer, J.M.; Stevels, A.L.N. Strategic environmental product planning within Philips Sound & Vision. Environ. Qual. Manag. 1997, 7, 91–102. [Google Scholar]
- Cramer, J. Towards innovative, more eco-efficient product design strategies. J. Sustain. Prod. Des. 1997, 1, 7–16. [Google Scholar]
- Stevels, A.L.N.; Ram, A.A.P.; Deckers, E. Take-back of discarded consumer electronic products from the perspective of the producer: Conditions for success. J. Clean. Prod. 1999, 7, 383–389. [Google Scholar] [CrossRef]
- Umeda, Y.; Nonomura, A.; Tomiyama, T. Study on life-cycle design for the post mass production paradigm. AI EDAM 2000, 14, 149–161. [Google Scholar] [CrossRef]
- Rose, C.M.; Stevels, A.; Ishii, K. Method for formulating product end-of-life strategies for electronics industry. J. Electron. Manuf. 2002, 11, 185–196. [Google Scholar] [CrossRef]
- Rose, C.M.; Ishii, K.; Stevels, A. Influencing design to improve product end-of-life stage. Res. Eng. Des. 2002, 13, 83–93. [Google Scholar]
- Masui, K.; Sakao, T.; Kobayashi, M.; Inaba, A. Applying quality function deployment to environmentally conscious design. Int. J. Qual. Reliab. Manag. 2003, 20, 90–106. [Google Scholar] [CrossRef]
- Huisman, J.; Boks, C.B.; Stevels, A.L.N. Quotes for environmentally weighted recyclability (QWERTY): Concept of describing product recyclability in terms of environmental value. Int. J. Product. Res. 2003, 41, 3649–3665. [Google Scholar]
- Fujimoto, J.; Umeda, Y.; Tamura, T.; Tomiyama, T.; Kimura, F. Development of service-oriented products based on the inverse manufacturing concept. Environ. Sci. Technol. 2003, 37, 5398–5406. [Google Scholar] [CrossRef] [PubMed]
- Bras-Klapwijk, R.M. Procedures and tools for generating and selecting alternatives in LCA. Int. J. Life Cycle Assess. 2003, 8, 266–272. [Google Scholar] [CrossRef]
- Huisman, J.; Stevels, A.L.N.; Stobbe, I. Eco-efficiency considerations on the end-of-life of consumer electronic products. IEEE Trans. Electron. Pack. Manuf. 2004, 27, 9–25. [Google Scholar] [CrossRef]
- Herrmann, C.; Eyerer, P.; Gediga, J. Economic and ecological material index for end-of-life and design of electronic products. IEEE Trans. Electron. Pack. Manuf. 2004, 27, 2–8. [Google Scholar] [CrossRef]
- Dewulf, W.; Duflou, J.R. Integrating eco-design into business environments. Prod. Eng. 2005, 1, 55–76. [Google Scholar]
- Park, P.J.; Lee, K.M.; Wimmer, W. Development of an environmental assessment method for consumer electronics by combining top-down and bottom-up approaches (11 pp). Int. J. Life Cycle Assess. 2006, 11, 254–264. [Google Scholar] [CrossRef]
- Boks, C. The soft side of ecodesign. J. Clean. Prod. 2006, 14, 1346–1356. [Google Scholar] [CrossRef]
- Huisman, J.; Stevels, A.L. Eco-efficiency of take-back and recycling, a comprehensive approach. IEEE Trans. Electron. Pack. Manuf. 2004, 29, 83–90. [Google Scholar]
- Boks, C.; Stevels, A. Essential perspectives for design for environment. Experiences from the electronics industry. Int. J. Prod. Res. 2007, 45, 4021–4039. [Google Scholar] [CrossRef]
- Grote, C.A.; Jones, R.M.; Blount, G.N.; Goodyer, J.; Shayler, M. An approach to the EuP Directive and the application of the economic eco-design for complex products. Int. J. Prod. Res. 2007, 45, 4099–4117. [Google Scholar] [CrossRef]
- Park, P.J.; Tahara, K. Quantifying producer and consumer-based eco-efficiencies for the identification of key ecodesign issues. J. Clean. Prod. 2008, 16, 95–104. [Google Scholar] [CrossRef]
- Huisman, J.; Stevels, A. Eco-efficiency as a road-mapping instrument for WEEE implementation. Prog. Ind. Ecol. Int. J. 2008, 5, 30–43. [Google Scholar] [CrossRef]
- Kunnari, E.; Valkama, J.; Keskinen, M.; Mansikkamäki, P. Environmental evaluation of new technology: Printed electronics case study. J. Clean. Prod. 2009, 17, 791–799. [Google Scholar] [CrossRef]
- Boks, C.; McAloone, T.C. Transitions in sustainable product design research. Int. J. Prod. Dev. 2009, 9, 429–449. [Google Scholar] [CrossRef]
- Wong, Y.L.; Lee, K.M.; Yung, K.C. Model scenario for integrated environmental product assessment at the use of raw materials stage of a product. Res. Cons. Rec. 2010, 54, 841–850. [Google Scholar]
- Kishita, Y.; Low, B.H.; Fukushige, S.; Umeda, Y.; Suzuki, A.; Kawabe, T. Checklist-based assessment methodology for sustainable design. J. Mech. Design 2010, 132, 091011. [Google Scholar] [CrossRef]
- Arnold, M.G.; Hockerts, K. The greening dutchman: Philips’ process of green flagging to drive sustainable innovations. Bus. Strat. Environ. 2011, 20, 394–407. [Google Scholar] [CrossRef]
- Kurunsaari, H.; Bu, Z. Eco-control in the Japanese manufacturing industry: A case study of Toyota and Panasonic. Bus. Rev. 2011, 62, 63–86. [Google Scholar]
- Umeda, Y.; Takata, S.; Kimura, F.; Tomiyama, T.; Sutherland, J.W.; Kara, S.; Duflou, J.R. Toward integrated product and process life cycle planning—An environmental perspective. CIRP Ann. Manuf. Technol. 2012, 61, 681–702. [Google Scholar] [CrossRef]
- Staniškis, J.; Arbačiauskas, V.; Varžinskas, V. Sustainable consumption and production as a system: Experience in Lithuania. Clean Technol. Environ. Pol. 2012, 14, 1095–1105. [Google Scholar]
- Rasamoelina, F.; Bouchard, C.; Aoussat, A. Towards a kansei-based user modeling methodology for eco-design. Int. J. Affect. Eng. 2013, 12, 337–348. [Google Scholar] [CrossRef]
- Siderius, P.J.S.; Nakagami, H. A MEPS is a MEPS is a MEPS: Comparing ecodesign and top runner schemes for setting product efficiency standards. Energ. Efficiency 2013, 6, 1–19. [Google Scholar]
- Aschehoug, S.H.; Boks, C. Towards a framework for sustainability information in product development. Int. J. Sust. Eng. 2013, 6, 94–108. [Google Scholar] [CrossRef]
- Elduque, D.; Javierre, C.; Pina, C.; Martínez, E.; Jiménez, E. Life cycle assessment of a domestic induction hob: Electronic boards. J. Clean. Prod. 2014, 76, 74–84. [Google Scholar] [CrossRef]
- Bakker, C.; Wang, F.; Huisman, J.; Den Hollander, M. Products that go round: Exploring product life extension through design. J. Clean. Prod. 2014, 69, 10–16. [Google Scholar] [CrossRef]
- De Felice, F.; Elia, V.; Gnoni, M.G.; Petrillo, A. Comparing environmental product footprint for electronic and electric equipment: A multi-criteria approach. Int. J. Sust. Eng. 2014, 7, 360–373. [Google Scholar] [CrossRef]
- Vasan, A.; Sood, B.; Pecht, M. Carbon footprinting of electronic products. Appl. Energ. 2014, 136, 636–648. [Google Scholar] [CrossRef]
- Li, J.; Zeng, X.; Stevels, A. Ecodesign in consumer electronics: Past, present, and future. Crit. Rev. Environ. Sci. Technol. 2015, 45, 840–860. [Google Scholar] [CrossRef]
- Hischier, R. Life cycle assessment study of a field emission display television device. Int. J. Life Cycle Assess. 2015, 20, 61–73. [Google Scholar] [CrossRef]
- Kuo, T.C.; Smith, S.; Smith, G.C.; Huang, S.H. A predictive product attribute driven eco-design process using depth-first search. J. Clean. Prod. 2015, in press. [Google Scholar]
- Chiang, T.A.; Che, Z.H. A decision-making methodology for low-carbon electronic product design. Decis. Support Syst. 2015, 71, 1–13. [Google Scholar] [CrossRef]
- Wu, Y.H.; Ho, C.C. Integration of green quality function deployment and fuzzy theory: A case study on green mobile phone design. J. Clean. Prod. 2015, 108, 271–280. [Google Scholar] [CrossRef]
- Meyer, D.E.; Katz, J.P. Analyzing the environmental impacts of laptop enclosures using screening-level life cycle assessment to support sustainable consumer electronics. J. Clean. Prod. 2016, 112, 369–383. [Google Scholar] [CrossRef]
- Ardente, F.; Mathieux, F. Identification and assessment of product's measures to improve resource efficiency: The case-study of an energy using product. J. Clean Prod. 2014, 83, 126–141. [Google Scholar] [CrossRef]
- Cheung, W.M.; Marsh, R.; Griffin, P.W.; Newnes, L.B.; Mileham, A.R.; Lanham, J.D. Towards cleaner production: A roadmap for predicting product end-of-life costs at early design concept. J. Clean. Prod. 2015, 87, 431–441. [Google Scholar] [CrossRef] [Green Version]
- Finkelstein, M. Failure rate and mean remaining lifetime. In Failure Rate Modelling for Reliability and Risk; Finkelstein, M., Ed.; Springer-Verlag London Limited: London, UK, 2008; Volume 1, pp. 9–44. [Google Scholar]
- Itsubo, N.; Sakagami, M.; Kuriyama, K.; Inaba, A. Statistical analysis for the development of national average weighting factors—Visualization of the variability between each individual’s environmental thoughts. Int. J. Life Cycle Assess. 2012, 17, 488–498. [Google Scholar]
- Andrae, A.S.G. A review of methodological approaches for life cycle assessment (LCA) of consumer electronics. IEEE Consum. Electron. Mag. 2016, 5, 51–60. [Google Scholar] [CrossRef]
- Forum for the Future. Open Eco Rating (V3)—A User Guide—September 2015. Available online: https://www.forumforthefuture.org/sites/default/files/Open_Eco_Rating_User_Guide.pdf (accessed on 3 December 2015).
- Huawei. Sustainability Report 2014. Available online: http://www-file.huawei.com/~/media/CORPORATE/PDF/Sustainability/2014%20Huawei%20sustainability%20report-final.pdf?la=en (accessed on 3 December 2015).
- Underwriters Laboratories. Interim Sustainability Requirements (ISR) for Mobile Phones; UL ISR 110: Northbrook, IL, USA, 2011. [Google Scholar]
- Global e-Sustainability Initiative (GeSI). Sustainability Assessment Standard Framework (SASF) 2015. Available online: http://gesi.org/portfolio/project/81 (accessed on 3 December 2015).
- Krieger, E.M.; Arnold, C.B. Effects of undercharge and internal loss on the rate dependence of battery charge storage efficiency. J. Power Sources 2012, 210, 286–291. [Google Scholar] [CrossRef]
- Aoe, T.; Michiyasu, T. “Ecological rucksack” of high-definition TVs. Mater. Trans. 2005, 46, 2561–2566. [Google Scholar] [CrossRef]
© 2016 by the authors; licensee MDPI, Basel, Switzerland. This article is an open access article distributed under the terms and conditions of the Creative Commons by Attribution (CC-BY) license (http://creativecommons.org/licenses/by/4.0/).
Share and Cite
Andrae, A.S.G.; Xia, M.; Zhang, J.; Tang, X. Practical Eco-Design and Eco-Innovation of Consumer Electronics—the Case of Mobile Phones. Challenges 2016, 7, 3. https://doi.org/10.3390/challe7010003
Andrae ASG, Xia M, Zhang J, Tang X. Practical Eco-Design and Eco-Innovation of Consumer Electronics—the Case of Mobile Phones. Challenges. 2016; 7(1):3. https://doi.org/10.3390/challe7010003
Chicago/Turabian StyleAndrae, Anders S. G., Mengjun Xia, Jianli Zhang, and Xiaoming Tang. 2016. "Practical Eco-Design and Eco-Innovation of Consumer Electronics—the Case of Mobile Phones" Challenges 7, no. 1: 3. https://doi.org/10.3390/challe7010003