From Antisemitism to Philosemitism? Trends in American Attitudes toward Jews from 1964 to 2016

Department of Political Science, Fordham University, Bronx, NY 10458, USA
Religions 2018, 9(4), 107; https://doi.org/10.3390/rel9040107
Submission received: 22 March 2018
/
Revised: 28 March 2018
/
Accepted: 29 March 2018
/
Published: 2 April 2018
(This article belongs to the Special Issue The Jewish Experience in America)
Abstract
:This paper uses the feeling thermometer toward Jews on the American National Election (ANES) surveys from 1964 through 2016 to track trends in Americans’ attitudes toward Jews. The feeling thermometer is one of the longest continuous time series studies in which Americans are asked about their attitudes toward Jews, and there are items on the ANES surveys that can be used to partially correct for social desirability response effects. The analysis compares several demographic groups, an important focus of extant research. Findings indicate a modest warming trend for most groups, with older Americans and the least educated displaying the greatest warmth increases. In contrast, Catholics have become slightly cooler. Analysis suggests that the immigration of Catholics from Latin America, nations that lack the religious tolerance tradition, may account for this counter-trend. The conclusion offers suggestions for future research and discusses the implications of the rising proportion of Hispanic immigrants into the US for future levels of antisemitism in the US.
1. Introduction
Currently there appears to be little antisemitism in American public opinion, quite a departure from the 1940s and early 1950s, when large percentages of voters held such attitudes (Smith 1996).1 For example, Gordon W. Allport, reviewing polls of the 1940s, estimates that “five to ten percent [of the population] are violently antisemitic, while perhaps 45% are more mildly bigoted …” (cited in Flowerman and Jahoda 1946, p. 83). Flowerman and Jahoda calculate that in the 1940s, about 10% of the US mass public would give antisemitic responses to questions that do not mention Jews, while another 30–60% would offer antisemitic responses to questions mentioning Jews (Flowerman and Jahoda 1946, p. 85). Welch (2014) comes to a similar conclusion—Americans in the 1940s displayed high levels of antisemitism.
Americans now appear warmly disposed toward Jews. A 2015 Gallup poll finds 91% willing to vote for a well-qualified Jew, compared to 62% in 1958 (Gallup Organization 1958, 2015).2 Fewer now think Jews are more loyal to Israel than to the United States: 30% said Jewish loyalty resided with Israel in 1964 compared to 21% in 2000 (Anti-Defamation League of B’nai B’rith 1964; Newsweek 2000).3 In 1964, 43% said Jews were responsible for Christ’s death, deicide, compared to 26% in 2004 (Anti-Defamation League of B’nai B’rith 1964; Pew Research Center 2004).4 Putnam and Campbell (2012) report Jews are the third highest religious groups in warmth, only below mainline Protestants and Catholics, although they caution that social desirability bias may mask the true degree of antisemitism (p. 506). Karpowitz et al. (2016) find respondents are more sensitive to disparaging comments about Jews than for other religions. Using a list experiment, Kane et al. (2004) report that respondents are willing to vote for a Jewish presidential candidate. But in another experiment, Berinsky and Mendelberg (2005) demonstrate that it is easy to activate latent antisemitic stereotypes, which in turn may affect voter willingness to support Jewish politicians. This study provides one dissent to the portrait of Americans in recent years as being philosemitic.
There are several issues with tracking the level of antisemitism in the American mass public. First is the issue of validity, i.e., whether the question posed actually taps into antisemitic attitudes. For instance, the recent Anti-Defamation League report of antisemitism around the globe has been criticized for questions and response categories it uses in its scale and how it classifies a person as antisemitic (Greene and Kingsbury 2017; Tausch 2014). Second, almost all research, except for several experimental studies (Rudman et al. 1999; Kane et al. 2004; Berinsky and Mendelberg 2005), employs an explicit measure of antisemitism, that is, Jews are mentioned in the question. Using explicit measures raises concerns of socially desirable responses. Third, there are very few questions that are asked multiple times over many years, which is necessary to track trends (Smith 1993). Gallup’s presidential candidate question is the longest running but currently has little cross-sectional variation. In the latest administration of that question, 91% said they would be willing to vote for a well-qualified Jew for president.5
This paper turns to the American National Election Study (ANES), which has been asking respondents since 1964 to rate Jews on a feeling thermometer scale.6 Warmth toward Jews has risen from 63 degrees in 1964 to 70 in 2016. Unlike the Gallup presidential candidate question, there is considerable cross-sectional variation, even in recent years, with standard deviations of 20+ degrees every year. However, the ANES feeling thermometer may be subject to social desirability effects. Below I present a methodology that partially corrects for this problem.
This paper follows the long research tradition on mass public antisemitism in the US by looking at demographic groups emphasized in that research and for which the ANES has collected comparable respondent data across as much as the series as possible (e.g., race, age, gender, religion, partisanship, and education). This paper also asks whether the decline in antisemitic sentiment is true or is a measurement artifact. Results suggests a true, albeit modest, decline in antisemitism since the mid-1960s. Older and better-educated Americans contribute disproportionately to this decline, while Catholics appear to be bucking the trend, perhaps due to the increasing number of non-native born Hispanics (Smith 2007; King and Weiner 2007). Blacks are cooler to Jews than non-Blacks, but average Black ratings are still warm. Plus, Black attitudes appear to be a function of “Jewishness” rather than viewing Jews as white. The conclusion puts the findings into perspective and suggests directions for future research.
The next section discusses issues in measuring antisemitism with survey questions, followed by a discussion of demography and antisemitism in the US. Then, the data are presented, followed by the analysis. The conclusion puts the findings into perspective and suggests directions for future research.
There are several contributions of this research. First, this study discusses several measurement issues in using surveys for detecting antisemitic attitudes in the mass public, which is rarely done in research on antisemitism either in the US or other locales. This investigation hopefully will inform future research on how to better measure antisemitism in survey questions. Second, this study looks at one of the longest time series study on antisemitism in the US mass public yet undertaken and thus supplements the bulk of research that generally only makes cross-sectional comparisons of select groups. Third, this paper focuses on how changing levels of antisemitism within groups and changes in the relative population size of groups may affect national, aggregate levels of antisemitism.
2. Issues in Measuring Antisemitism in Public Opinion Surveys
How should we measure antisemitism in survey questions? This section discusses several issues regarding measurement strategies and their implications: using (1) implicit versus explicit measures and (2) specific versus general questions.
2.1. Implicit Versus Explicit Antisemitism
Bias and prejudice have been conceptualized and measured either implicitly or explicitly. Implicit bias resides in one’s unconscious—one may not even be aware of one’s prejudice or discriminatory behavior. Explicit bias is conscious, even if one does not consider their attitudes or behaviors to be biased or prejudicial. Implicit bias is often measured with an Implicit Assessment Test (IAT) in which the reactions of study participants are timed, assuming that deeply rooted, unconscious associations will lead to rapid responses in assigned tasks. Explicit bias traditionally is measured with items that reference the specific groups of interest. For instance, in assessing whether a person is antisemitic, an explicit measurement will reference Jews. To date, other than several experimental studies (Rudman et al. 1999; Kane et al. 2004; Berinsky and Mendelberg 2005), no published study measures antisemitism implicitly.7 The major problem with explicit measures of prejudice is that respondents may offer socially desirable answers, thereby hiding their true attitudes (Krumpal 2013). This may affect the detection of trends in levels of antisemitism, even when tracking identical questions.
For instance, assume that in the 1940s and 1950s, there was little social stigma to expressing antisemitic sentiments, but beginning in the 1960s, the climate of opinion changed, leading to a social cost if someone publicly made an antisemitic comment. This new opinion climate might affect responses to survey items meant to measure antisemitism, decreasing the likelihood that someone who has antisemitic attitudes will offer the antisemitic response. Thus, due to the new opinion climate, measured levels of antisemitism may decline, but the decline does not reflect true opinion change. Without a method to correct for social desirability effects, it may not be possible to estimate accurately trends in antisemitism. Numerous methods of coping with or correcting social desirability effects in surveys have been proposed (Nederhof 1985; Podsakoff et al. 2003). Below I propose one method to account (partially) for possible social desirability effects on antisemitism items.
2.2. Specific Versus General Question Wordings
Two basic types of questions have been used for measuring antisemitism, specific versus general. Specific questions ask respondents about characteristics of Jews or their willingness to engage in specific behaviors regarding to Jews. These characteristics are derived from theories of antisemitism; they are specific to Jews and what antisemites think of Jews. Questions of this type might ask whether respondents think Jews are shady, have too much power, are more loyal to Israel than the United States, killed Christ, etc., or whether the respondent will object to a Jewish neighbor or a relative marrying a Jew. The specific question approach assumes that antisemitism is multi-faceted and multi-dimensional, and that there are numerous antisemitic stereotypes and behaviors. One limitation of using explicit questions is that there is a possibility of overlooking one or more antisemitic stereotypes, leading to measurement error of the amount of antisemitism. Moreover, not everyone agrees that each specific item is indicative of antisemitism, which leads to disagreement over the interpretation of specific questions as indicators of antisemitism.
The other approach asks a more general question to elicit antisemitism. Often the question is not particular to Jews but can be applied to other groups. Two common general questions are favorability impressions and feeling thermometers, the first asking whether the respondent has favorable or unfavorable impressions, the second asking the respondent to rate their warmth–coolness toward Jews.
There are several advantages to general, as opposed to specific, questions for detecting antisemitism. First, as general questions can be asked about non-Jews, one can compare levels of antisemitism with other forms of prejudice. Using general questions, however, also assumes that antisemitism is not a unique form of prejudice but may be related to other types of prejudice. Second, general questions do not confront the “missing stereotype” issue when using specific questions. General questions allow respondents to define personally whatever stereotype may be affecting their attitudes toward Jews, even if that stereotype is not explicitly expressed. Individuals may differ in their stereotypes about Jews. A third advantage of general questions is that, when such questions are asked about several groups, Jews are not singled out, which may mitigate social desirability effects. Further, responses to the non-Jewish favorability-thermometer ratings can be used to control for social desirability effects, assuming that social desirability affects prejudice responses across groups. The major limitations of general questions, however, is that they cannot reveal the specific or substantive nature of antisemitic attitudes and whether the specific nature varies across groups, places, or over time.
3. Demographic Sources of Antisemitism in the United States
There are two major, complementary perspectives on sources of antisemitism in the American mass public, psychological and demographic. The psychological perspective suggests that certain personality types and/or psychological processes lend themselves to greater stereotypical and prejudicial thinking, including antisemitism. The most famous theory from this perspective, most closely associated with Adorno et al.’s (1950) classic study, argues that an authoritarian personality leads to antisemitic prejudice (Dunbar 1995; Dunbar and Simonova 2003; Krekó 2012; Raden 1999). Although once the dominant paradigm, the association between the authoritarian personality and antisemitism has been questioned recently. The current debate centers over the measurement and conceptualization of the authoritarian personality construct. Other personality-related syndromes, such as anomie, alienation, dogmatism, misanthropy, victimhood, and low self-esteem may also lead to antisemitic prejudice (Antoniou et al. 2015; Crandall and Cohen 1994; Duckitt 2008, 2009; Freedman 1987; Frindte et al. 2005; Smith 1997).
The demographic approach suggests that an individual’s social characteristics define an individual’s social, economic, and/or political position, which in turn may affect antisemitic attitudes and behaviors. This paper focuses on demography’s role in accounting for trends in antisemitism, building upon the large literature on demographic correlates of antisemitism.
Demography may affect trends in antisemitism in several ways. First, a group’s proportion of the population may change, becoming larger or smaller. If group members’ tendency toward antisemitism remains constant, and the group’s size declines, the aggregate amount of antisemitism in the population should drop. Group members, also, may become less (or more) antisemitic over time. If the group’s population proportion remains stable, but its members become less antisemitic, aggregate antisemitism should also decline. Both of these processes—changes in the distribution of antisemitism within a group and changes in relative group size—may affect aggregate levels of antisemitism in the broader mass public.
This paper investigates the effects of several demographic groups that past research has identified as contributing to the level of US public antisemitism—race (Blacks), age, gender, religion (Catholic), education, and party identification. The primary constraint in selecting demographic factors to study is whether the ANES measured the demographic comparably over time and whether the survey included the Jewish feeling thermometer, the indicator of attitudes toward Jews used in this study. The ANES first employed the Jewish feeling thermometer in 1964, but 1964 may be a relatively late date to track trends in antisemitism. Hence, it is important to keep data from the early years in the ANES series. Consequently, several demographic factors of interest, such as being an evangelical, a Muslim, Hispanic (Smith 2007; King and Weiner 2007), and/or a political ideology (e.g., conservative) are not addressed here.
3.1. Race
Race, especially Black–White differences, has received the most research attention on antisemitic attitudes. Past research indicates that Blacks exhibit higher levels of antisemitism than Whites, although only a minority of Blacks can be called antisemitic (D’Alessio and Stolzenberg 1991; Fiebert et al. 1999; Greene and Kingsbury 2017; Sigelman 1995).8 There are several explanations for Black–White differences in antisemitism. Economic resentment, the idea that Jews owned many businesses in Black urban communities, lead black customers and residents to feel that Jewish proprietors had economically exploited them (King and Weiner 2007; Lipset 1987; Marx 1967; Okami 1992; Quinley and Glock 1979; Raden 1998; Sigelman 1995). This sense of economic exploitation led to negative attitudes toward Jews. The decline of Jewish ownership of such stores may have reduced these racial tensions in recent years. Others contend that Black antisemitism has more to do with Blacks viewing Jews as whites, rather than as Jews, as in the economic exploitation thesis. Thus, negative attitudes of Blacks toward Jews have little to do with Jewishness and more to do with Whiteness (Brodkin 1999; Goldstein 2006; Jacobson 1998; Simes 2009; but see King and Weiner (2007)).
3.2. Age
Research finds less antisemitism among older adults compared with younger adults (Lipset 1987; Martire and Clark 1982; Quinley and Glock 1979; Selznick and Steinberg 1969; Smith 1996; but see D’Alessio and Stolzenberg (1991)). The age–antisemitism relationship, however, counters other research on age and racism/prejudice, which generally finds the reverse—that older individuals are more likely to harbor racist/prejudicial attitudes (Gonsalkorale et al. 2009; Wilson 1996). It is not clear why older Americans are less antisemitic than younger individuals. One possibility may be that the simple age–antisemitic relationship is spurious. Once controlling for other factors, like the demographics used here, this association may disappear or reverse.
Age differences in antisemitic opinion also may be a function of cohort, aging, and/or period effects. Take cohort effects. By this argument, older cohorts that came of age prior to the revelation of the Holocaust should be the most strongly antisemitic. News of the Holocaust in the late 1940s should have the greatest opinion effects on younger cohorts during those years, as the antisemitism of older individuals at that time immunized them to some degree from such news, but events and news may more strongly affect the attitudes of younger people. Thus, in the late 1940s, there should be a positive relationship between age and antisemitism. Over time, as the older generation dies off, the positive relationship should fade. A negative association between age and antisemitism may emerge as newer cohorts, coming of age after the 1940s, and thus not exposed directly to the Holocaust news like the 1940s cohort, may not be as strongly positive toward Jews as the 1940s cohort. We can partially test the implications of the cohort theory. Since the 1940s cohort will be smaller later in the series (e.g., 2010s) than it will be earlier, the age gap in antisemitism should diminish for more recent years.
3.3. Gender
Although less studied regarding antisemitism, considerable research finds women are less prejudiced than men (Ekehammar et al. 2003; Sidanius and Pratto 1999). This gender difference is also reported in a handful of studies on antisemitism. (D’Alessio and Stolzenberg 1991; Stember 1966; King and Weiner 2007).
3.4. Religion
Religion has been crucial in understanding antisemitism in the US. A common argument is that Christians holds antisemitic attitudes because of long-held beliefs, such as deicide—that Jews were responsible for Christ’s death (Baum 2009; Glock and Stark 1966; King and Weiner 2007; Smith 1999). Christian antisemitism may be waning, in part because of public stances by religious authorities. For example, in the Second Vatican Council (1962–1965), Pope Paul VI proclaimed that Jews were not responsible for killing Jesus. Organizations were established in response to this proclamation, to promote better relations and understanding between Catholics and Jews, such as the Institute for Catholic–Jewish Relations at Saint Joseph’s University (Philadelphia, PA, USA), founded in 1965 (https://sites.sju.edu/ijcr/). Yet as recently as 2011, Pope Benedict XVI reiterated that Jews bear no collective responsibility for killing Jesus (Reynolds 2011). Pope Benedict’s need to reiterate this position may indicate that deicide and related opinions are still evident among some set of co-religionists. There is some empirical support that antisemitism may still be present among Catholics. A recent study by Arno Tausch (2018), using various cross-national data sets, found an association between regular attendance of Sunday Mass and antisemitism—Catholics who regularly attend Sunday Mass exhibit higher levels of antisemitic attitudes than those who are not regular attendees.
While papal pronouncements may affect Catholics, they should have less impact on Protestants. In the 1980s, the Christian right and evangelical Christians began to more strongly support Israeli government control of Holy sites. Such attitudes about the Middle East may spill over to affect their attitudes to Jews more generally. Some research demonstrates Christian right and evangelical accommodation, and at times, alliance with Jews in the US (Smith 1999; Wald and Sigelman 1997).
In contrast to these positive trends among Christians, some have argued that there is a new antisemitism, which links criticism of Israel to negative attitudes toward Jews. Several studies find this anti-Israel–anti-Jewish connection most strongly among Muslims around the world (Baum and Nakazawa 2007; Beattie 2017; Cohen et al. 2011; Dinnerstein 2004; Gerstenfeld 2007; Jaspal 2014; Kaplan and Small 2006; Kempf 2012, 2015; Klug 2003, 2013; Tausch 2014). But there is little research on such a correlation among American Muslims. Unfortunately, the ANES does not have comparable measures of religion across all surveys, did not ask about Evangelical and other Protestant denominations in much detail in the early surveys used here, and has not asked about Islam until only relatively recently. Moreover, there are few Muslims in the ANES studies. Consequently, this analysis focuses on Catholics.
3.5. Partisanship
There is little research on the relationship between partisanship and antisemitism, focusing instead on how partisanship structures attitudes toward Israel (Cavari 2012). Insofar as attitudes toward Israel may generalize to Jews, partisanship may be related to antisemitism. Since the independence of Israel, there has been bipartisan support for Israel, with modestly stronger support among Democrats. Cavari (2012) documents a realignment in partisan support toward Israel, with Republicans becoming slightly more supportive in the 1980s and Democrats slightly less supportive, although still demonstrating strong support levels. Extending this line of argument, and applying the logic of the new antisemitism approach, we should see greater warmth toward Jews among Democrats until about the 1980s, when Republicans warmth levels should surpass those of Democrats.
3.6. Education
Among the most consistent findings is the inverse relationship between education and antisemitism (D’Alessio and Stolzenberg 1991; Martire and Clark 1982; Selznick and Steinberg 1969; Smith 1996; Weil 1985; Wuthnow 1982). Education reduces antisemitism by promoting a greater understanding of democratic principles, leading to tolerance and cosmopolitanism, which reduces fear of those who are different. Moreover, educated individuals tend to be more personally secure, which also facilitates tolerance of differences (Greene and Kingsbury 2017; Weil 1985; but see Green et al. (2011) on support for civil liberties in general). However, the new antisemitism model suggests that the rise of anti-Israel attitudes and actions on college campuses over the past decade (Kosmin and Keysar 2015; Marcus 2007) may lead to increased antisemitism among the better-educated, especially recent college attendees, reversing the traditional education–antisemitism relationship.
4. Data: The American National Election Study Feeling Thermometer
Since 1964, the ANES has been asking respondents to rate their warmth–coolness toward Jews (and many other groups) on a 0–100-degree feeling thermometer. This series, administered 12 times through 2016, serves as the dependent variable for this study. Feeling thermometers have been critiqued. Respondents tend to give warmer over cooler ratings, but studies find predictable differences in ratings across respondent characteristics (Wilcox et al. 1989). Alwin (1997) also argues that feeling thermometers, with many response categories, are more reliable and valid than questions with fewer response categories. Another advantage of the feeling thermometer is the ability to use OLS, which facilitates and eases statistical interpretation. Finally, the inclusion of the Jewish item in a battery that asks respondents about a host of other groups keeps attitudes about Jews from being singled out, which may mitigate social desirability response effects.
Some may not consider the feeling thermometer a true measure of antisemitism, but only an indicator of anti-Jewish attitudes. First, the few analyses of the feeling thermometer consider it a measure of antisemitism (D’Alessio and Stolzenberg 1991). Second, it is far from clear what the difference is between being anti-Jewish and antisemitic. Perhaps those who prefer anti-Jewish to antisemitic view the latter as a stronger label, but antisemitism is always defined in terms of being Jewish—an antisemite is one who discriminates against or has prejudicial attitudes toward someone who is Jewish.
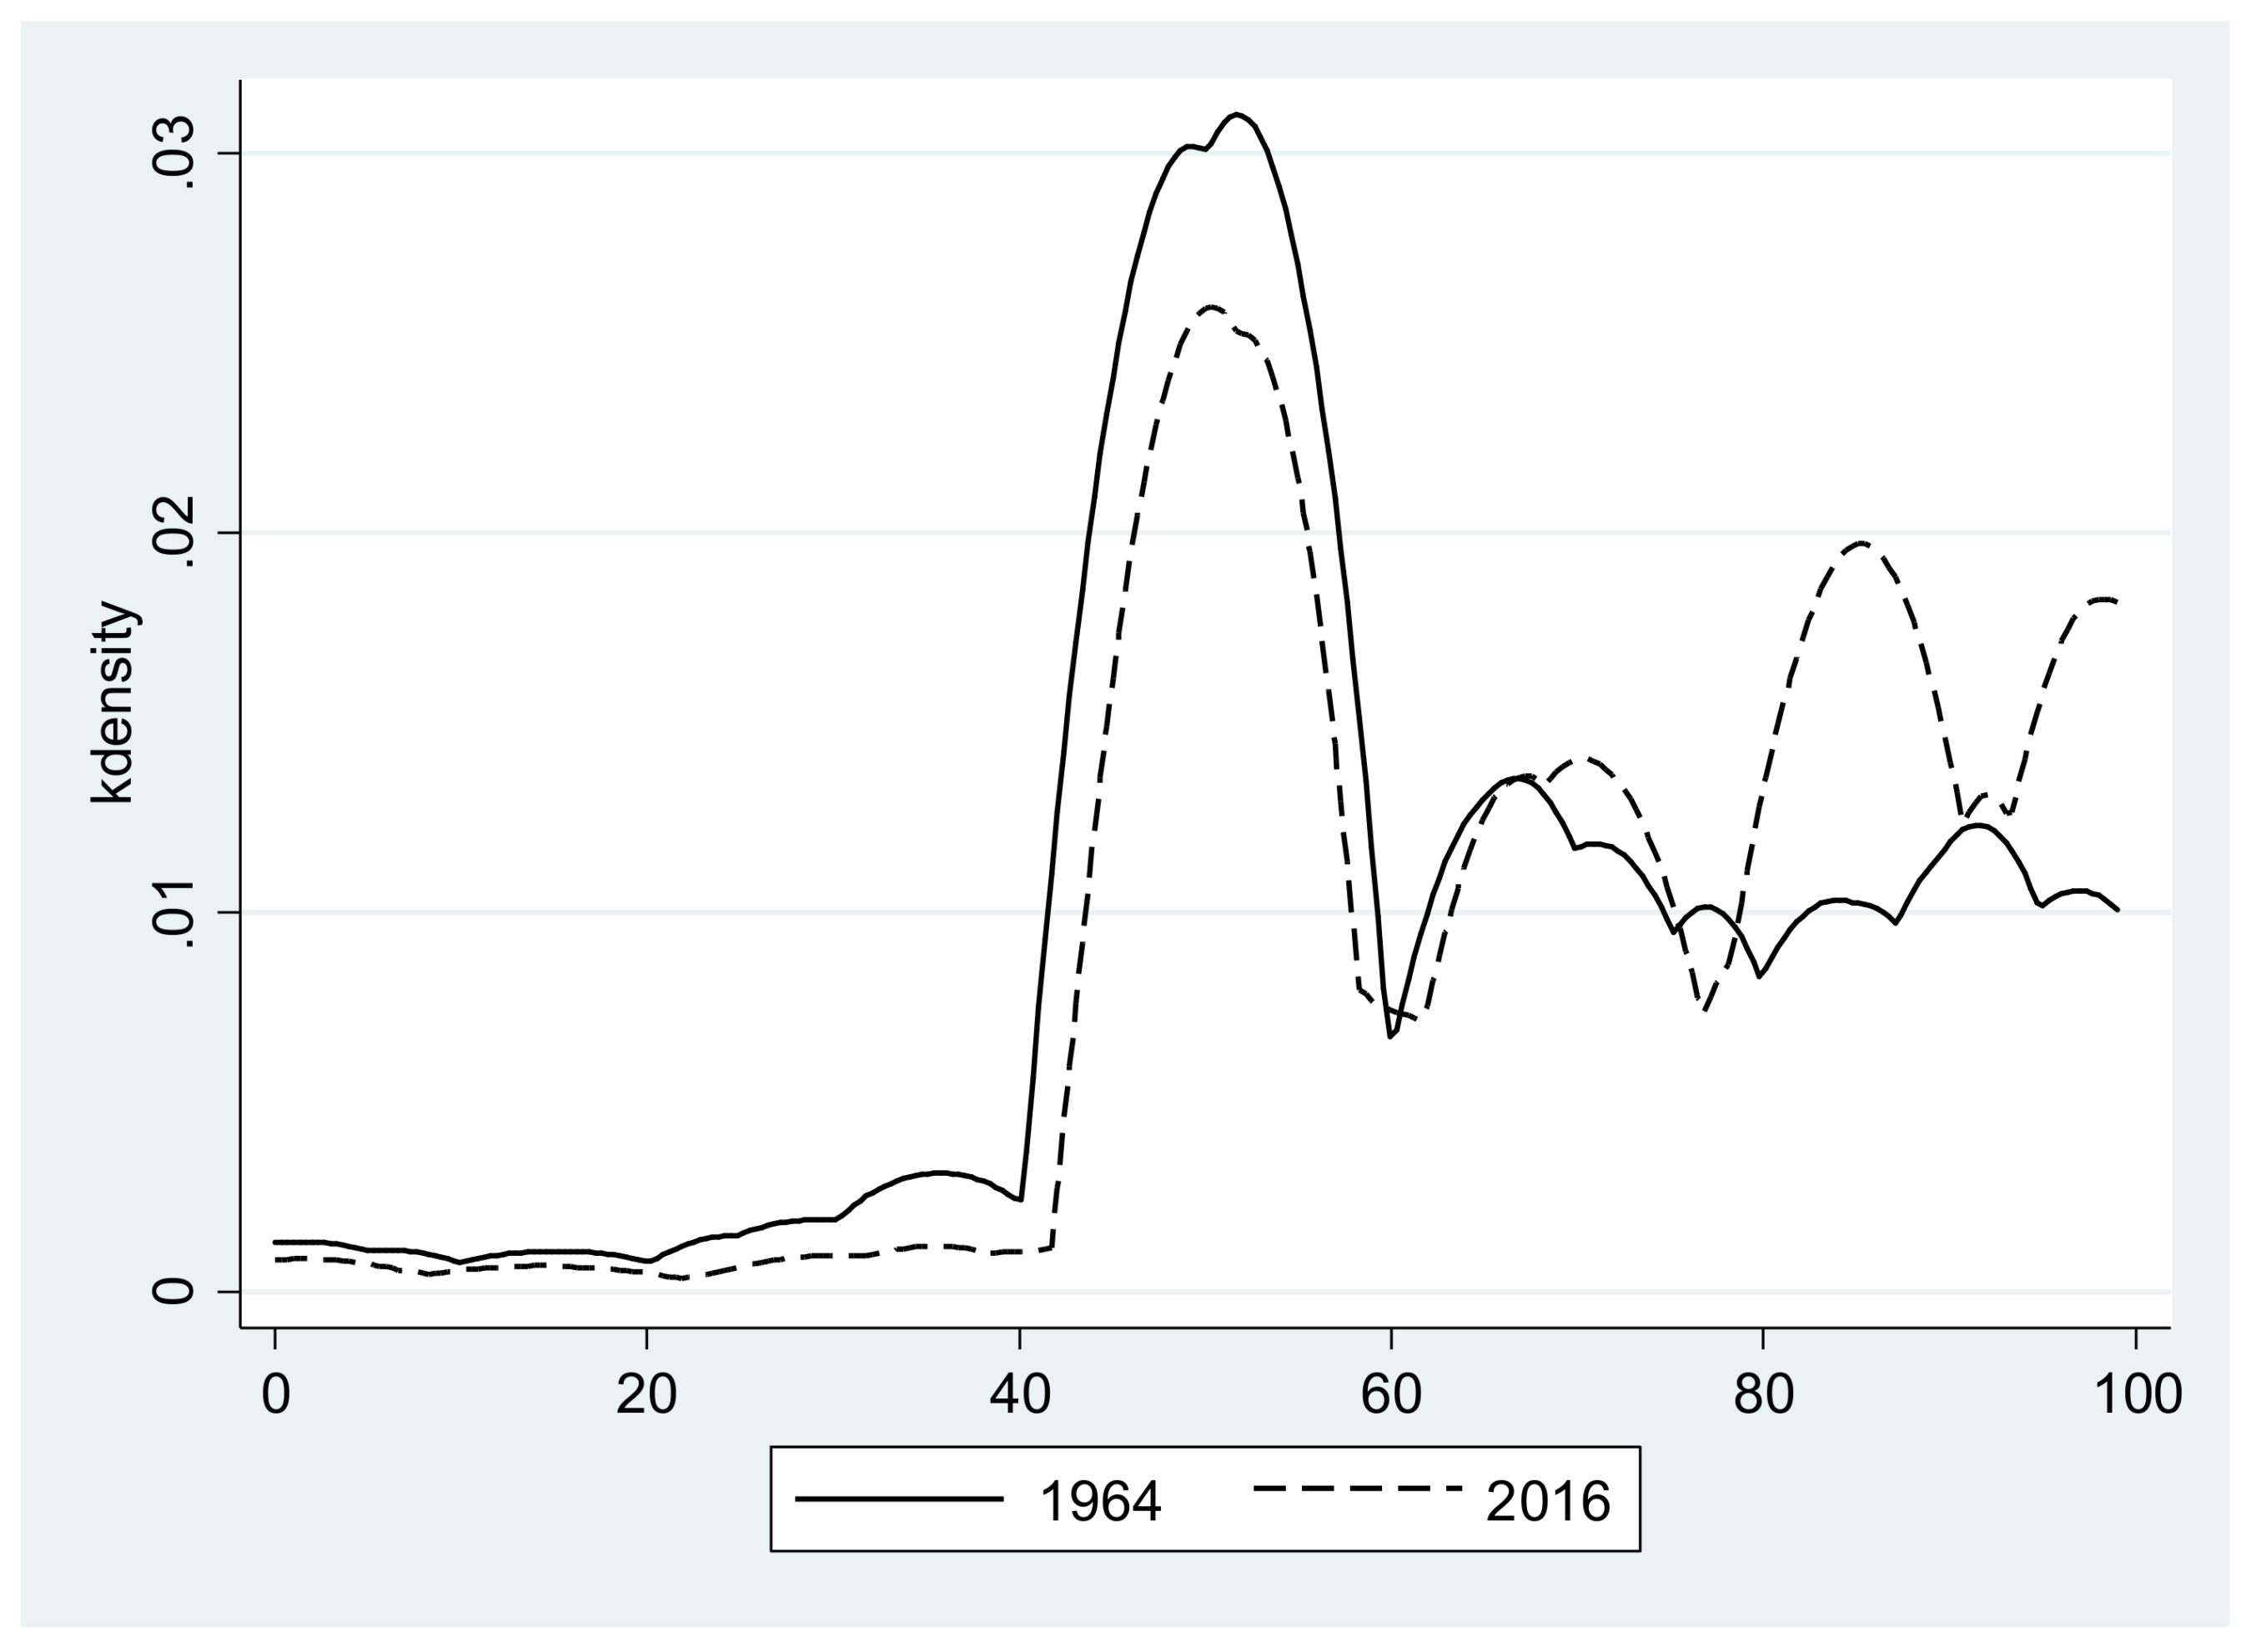
Table 1 presents descriptive information on the Jewish thermometer ratings from 1964–2016 (in all analyses, Jews are excluded). There is an upward trend in warmth, from 62.4 in 1964 to 70.5 in 2016, about 8 degrees, and the median rating has risen from 60 in 1964 to 70 in 2016. Figure 1 presents a kernel density plot for 1964 and 2016. The modal rating, around 50, declined in frequency from 1964 to 2016, while higher values increased in proportion. Few respondents rate Jews in the cool temperatures in either year, but there are cooler ratings in 1964 than 2016. There is also considerable cross-sectional variation within years: Table 1 reports a relatively steady, yet substantial, standard deviation of about 20 across all years.
5. Baseline Analyses
The analytic strategy pools all surveys with the Jewish feeling thermometer into a common dataset, allowing identification of both temporal and cross-sectional sources of variation.9 A time counter (1964 = 1 and 2016 = 53) measures the long-term secular trend. There are short-term oscillations around the long-term trend (see Table 1), with the warmest ratings in 1972 and 2000. Short-term factors and events may account for these oscillations; the major concern of this paper is with whether demographic factors account for the long-term trend of rising warmth to Jews. Model 1 in Table 2 presents results of regressing the feeling thermometer on the time counter. The time counter, representing the long-term trend, is positive and statistically significant, indicating an increase in warmth over the years. The regression coefficient shows an increase of 0.07 degrees for each year, or that Americans have become 3.6 degrees warmer over the 52-year period, a substantively modest, albeit statistically significant, warmth increase.
Model 2 in Table 2 includes the variables of being Black, age, being female, education, party identification, and being Catholic,10 without the time counter or other controls. This estimation produces the average warmth effect of each demographic over the entire period and repeats several standard findings from the extant literature. Education, being a female, being an older individual, and being Catholic are associated with warmer attitudes toward Jews. Republicans have slightly cooler ratings than Democrats, about 1.3 degrees, substantively meager, but statistically significant given the large sample size. Contrary to some studies, Blacks are also warmer than non-Blacks by about three degrees. Model 3 in Table 2 adds the time counter to the demographics. As in Model 1, the time counter remains statistically significant, although the coefficient drops slightly from 0.07 to 0.05. All other previous results hold, with some minor variation in the size of some coefficients.
Social desirability effects pose a major threat to these results. To help control for such effects, the analysis includes feeling thermometers for Blacks and Whites.11 Model 4 presents the results with the White and Black feeling thermometers included. Both significantly predict the Jewish feeling thermometer and increase the R2 from about 0.02 to 0.42, a large amount. Respondents who have warm (or cool) ratings toward Whites and/or Blacks feel the same toward Jews. Importantly, with these controls, the impact of some demographics change. Blacks are now found to be about 4.6% cooler than non-Blacks. This suggests that Black attitudes are due to Jewishness, not Blacks viewing Jews as Whites. Still, Blacks are by no means collectively antisemitic, with an average feeling thermometer rating of about 65, still quite warm.
With the Black and White thermometer controls, only education, age, and being a Catholic remain statistically significant, albeit at reduced levels compared to the previous estimations. Each additional educational category adds one degree of warmth, for a difference of about three degrees between the least and most well educated. Each additional year of age adds 0.07 degrees of warmth. A 90-year-old will be about five degrees warmer to Jews than an 18-year-old. Finally, Catholics will be about 1.8 degrees warmer than non-Catholics. All of these are modest to meager substantive effects. Finally, the time counter remains significant, with about the same size effect as noted earlier, about 0.07 degrees per year.
6. Demographics and Trends in Warmth toward Jews
The above analysis only presents findings of the average impact of each demographic across the entire 52-year period. How much do these demographics contribute to the increased warmth toward Jews? Demographic groups can affect the trend in warmth if group members become more (or less) warmly disposed toward Jews, if the group’s population proportion changes, or both. To distinguish these two mechanisms, the analysis interacts with the demographic variable with the time counter. The coefficient for the interaction term measures within-group opinion effects over time. Since inclusion of the interactions between demographics and time produces much multicollinearity, Table 3 presents the results for the interaction of each demographic group with the time counter separately. For the interested reader, Table 4 presents results that include all interactions in one estimation. The discussion that follows focuses on Table 3.
Turning to race, results indicate that Blacks have become warmer toward Jews over time, but the difference between Blacks and non-Blacks slightly widened. Figure 2 shows the trends in warmth for Blacks and non-Blacks. In 1964, Blacks rated Jews at 63.6 degrees, compared to non-Blacks, who rated Jews 4 degrees warmer (67.6). Black warmth grew to 66.3 degrees in 2016, nearly a three-degree rise, but non-Black warmth also rose, to 71.5, widening the warmth gap to about 5.2 degrees, a slight increase of about 1 degree. Both Blacks and non-Blacks grew increasingly warm to Jews over time, but non-Blacks did so at a slightly greater, albeit statistically insignificant, rate.
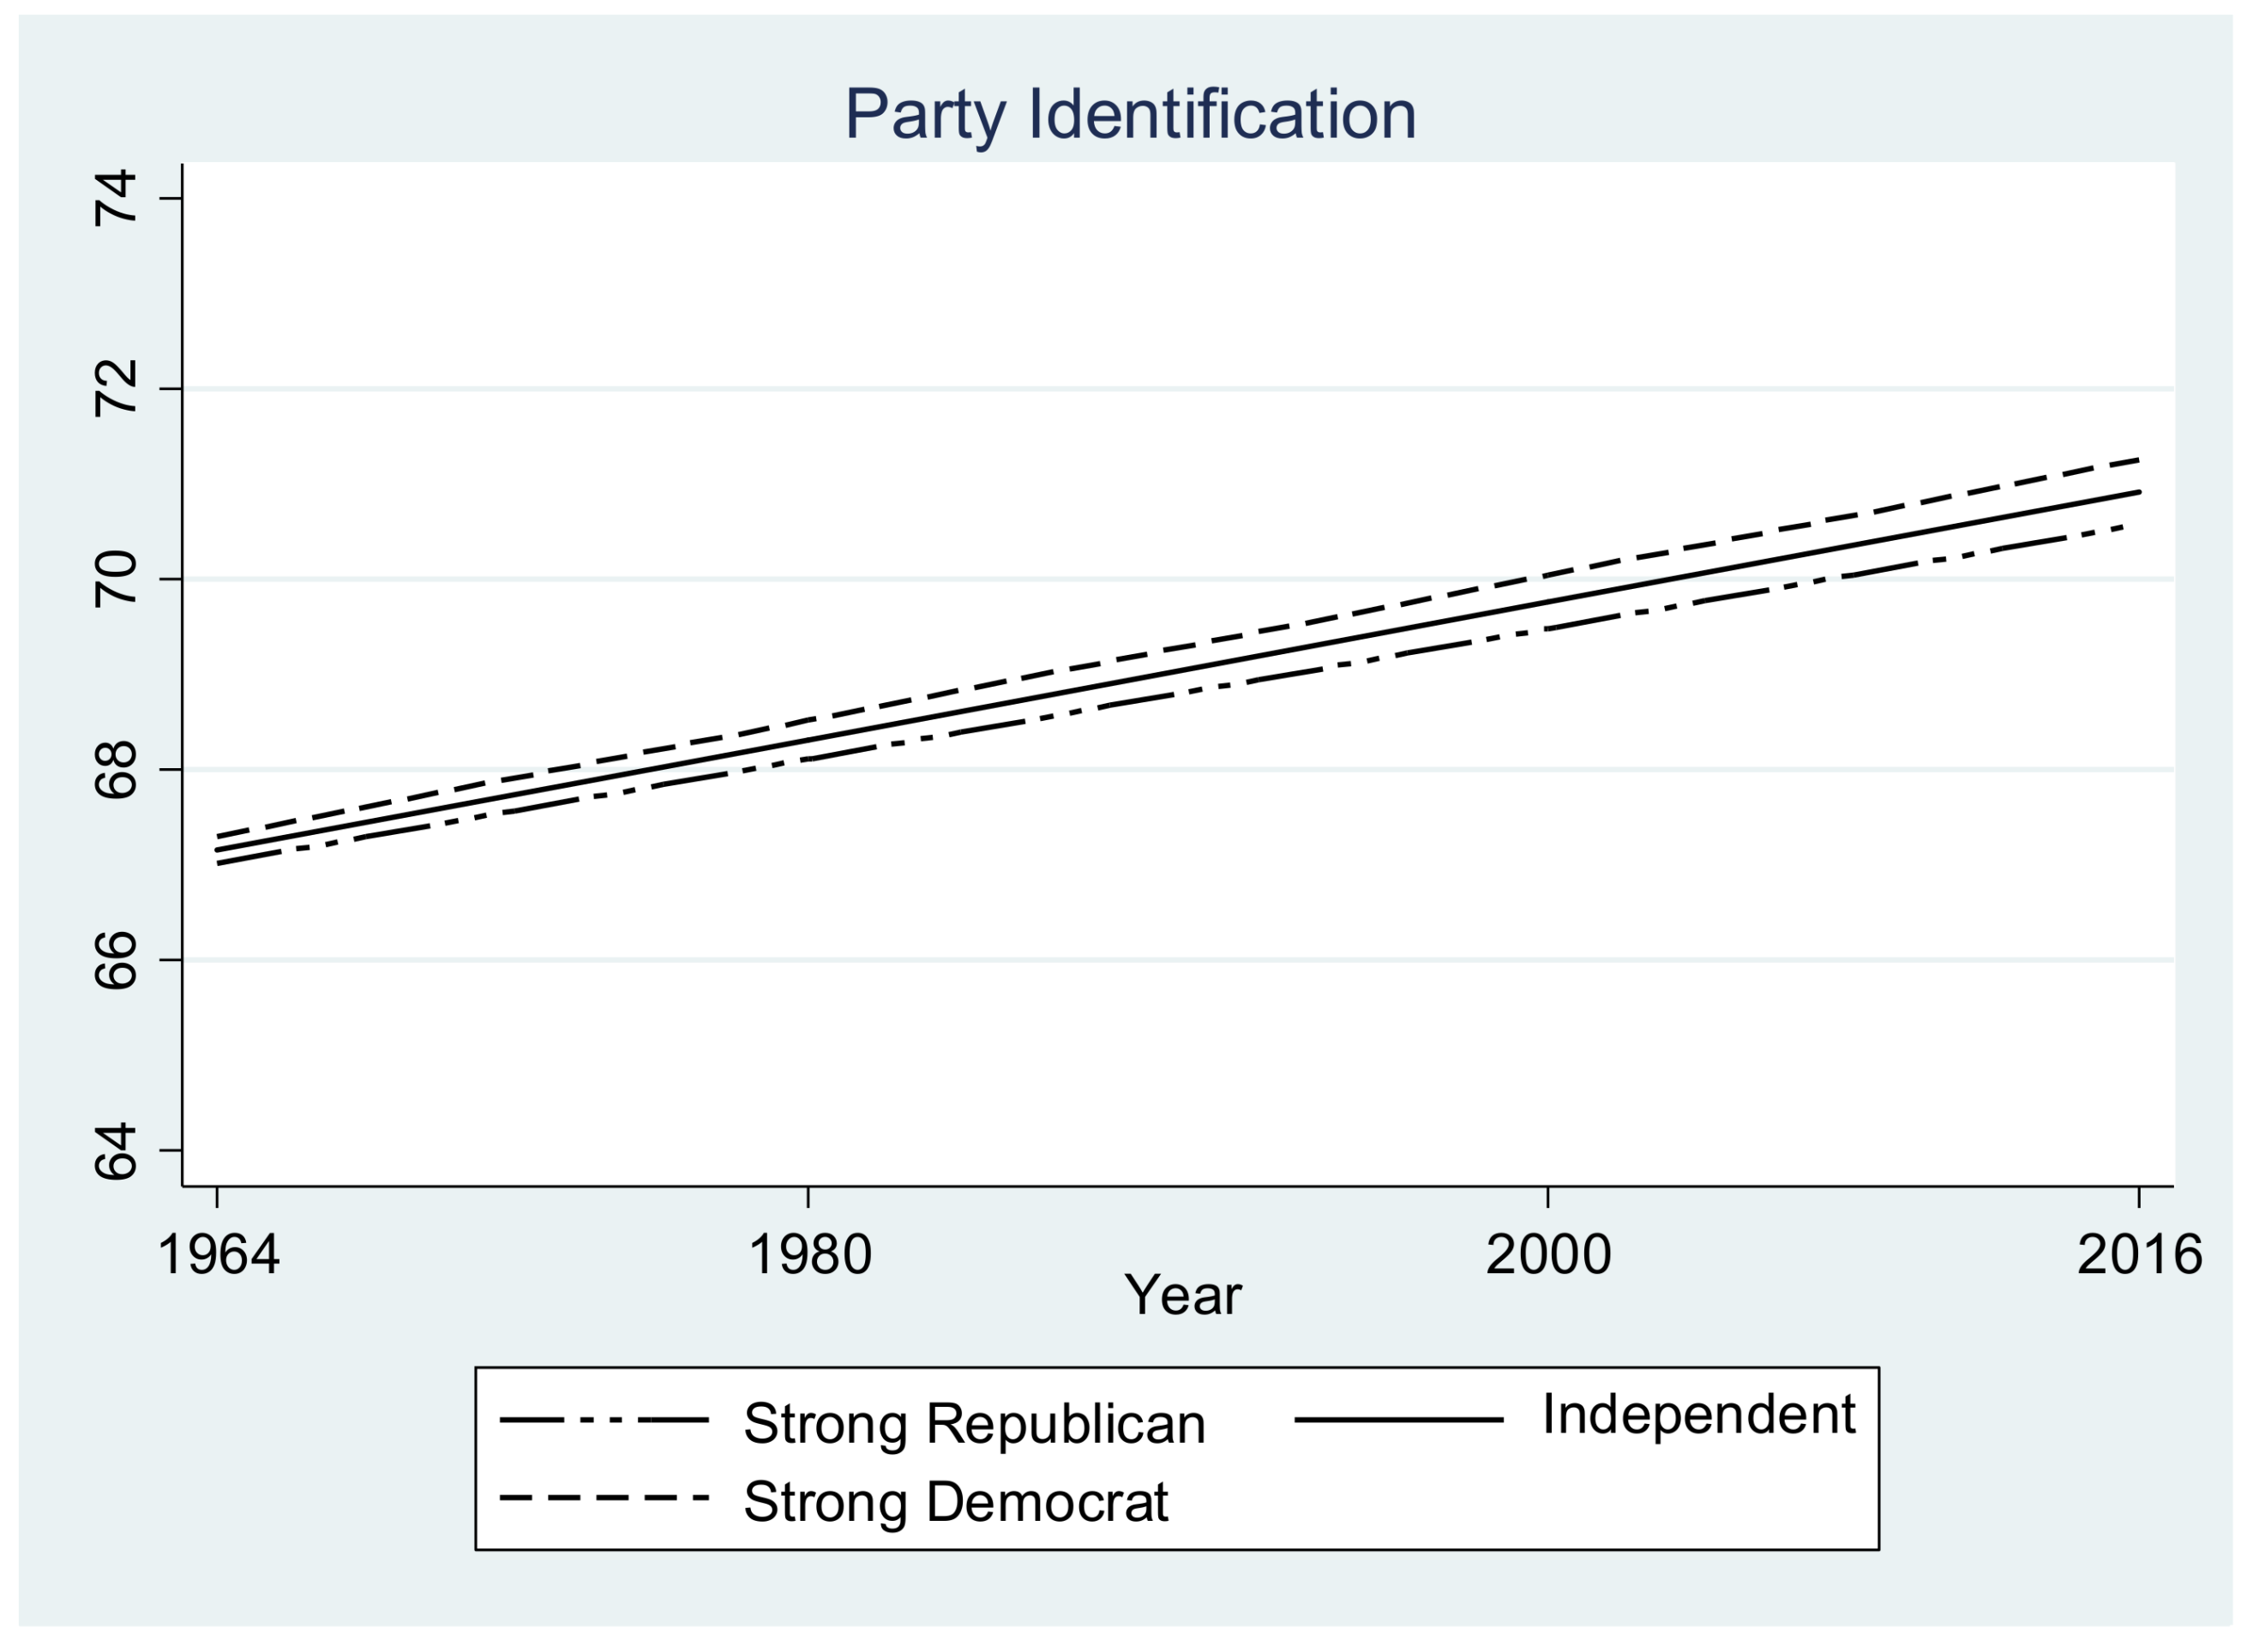
There do not appear to be any partisan differences in warmth, and identifiers of each partisan group show similar changes in warmth over time. Figure 3 displays the trends, but only for strong partisans; the other partisan groups change in parallel fashion, within the boundaries of the strong partisans. Both strong Democrats and Republicans register ratings of 67 in 1964, and both rise in tandem to 71 by 2016. Thus, even though, as Cavari (2012) demonstrates, there has been a partisan realignment in support for Israel over time, with Republicans growing more supportive and Democrats evincing a slight drop, that pattern is not evident when it comes to rating Jews. American voters apparently separate attitudes toward Jews and Israel, even though other analyses suggest a correlation in other countries.
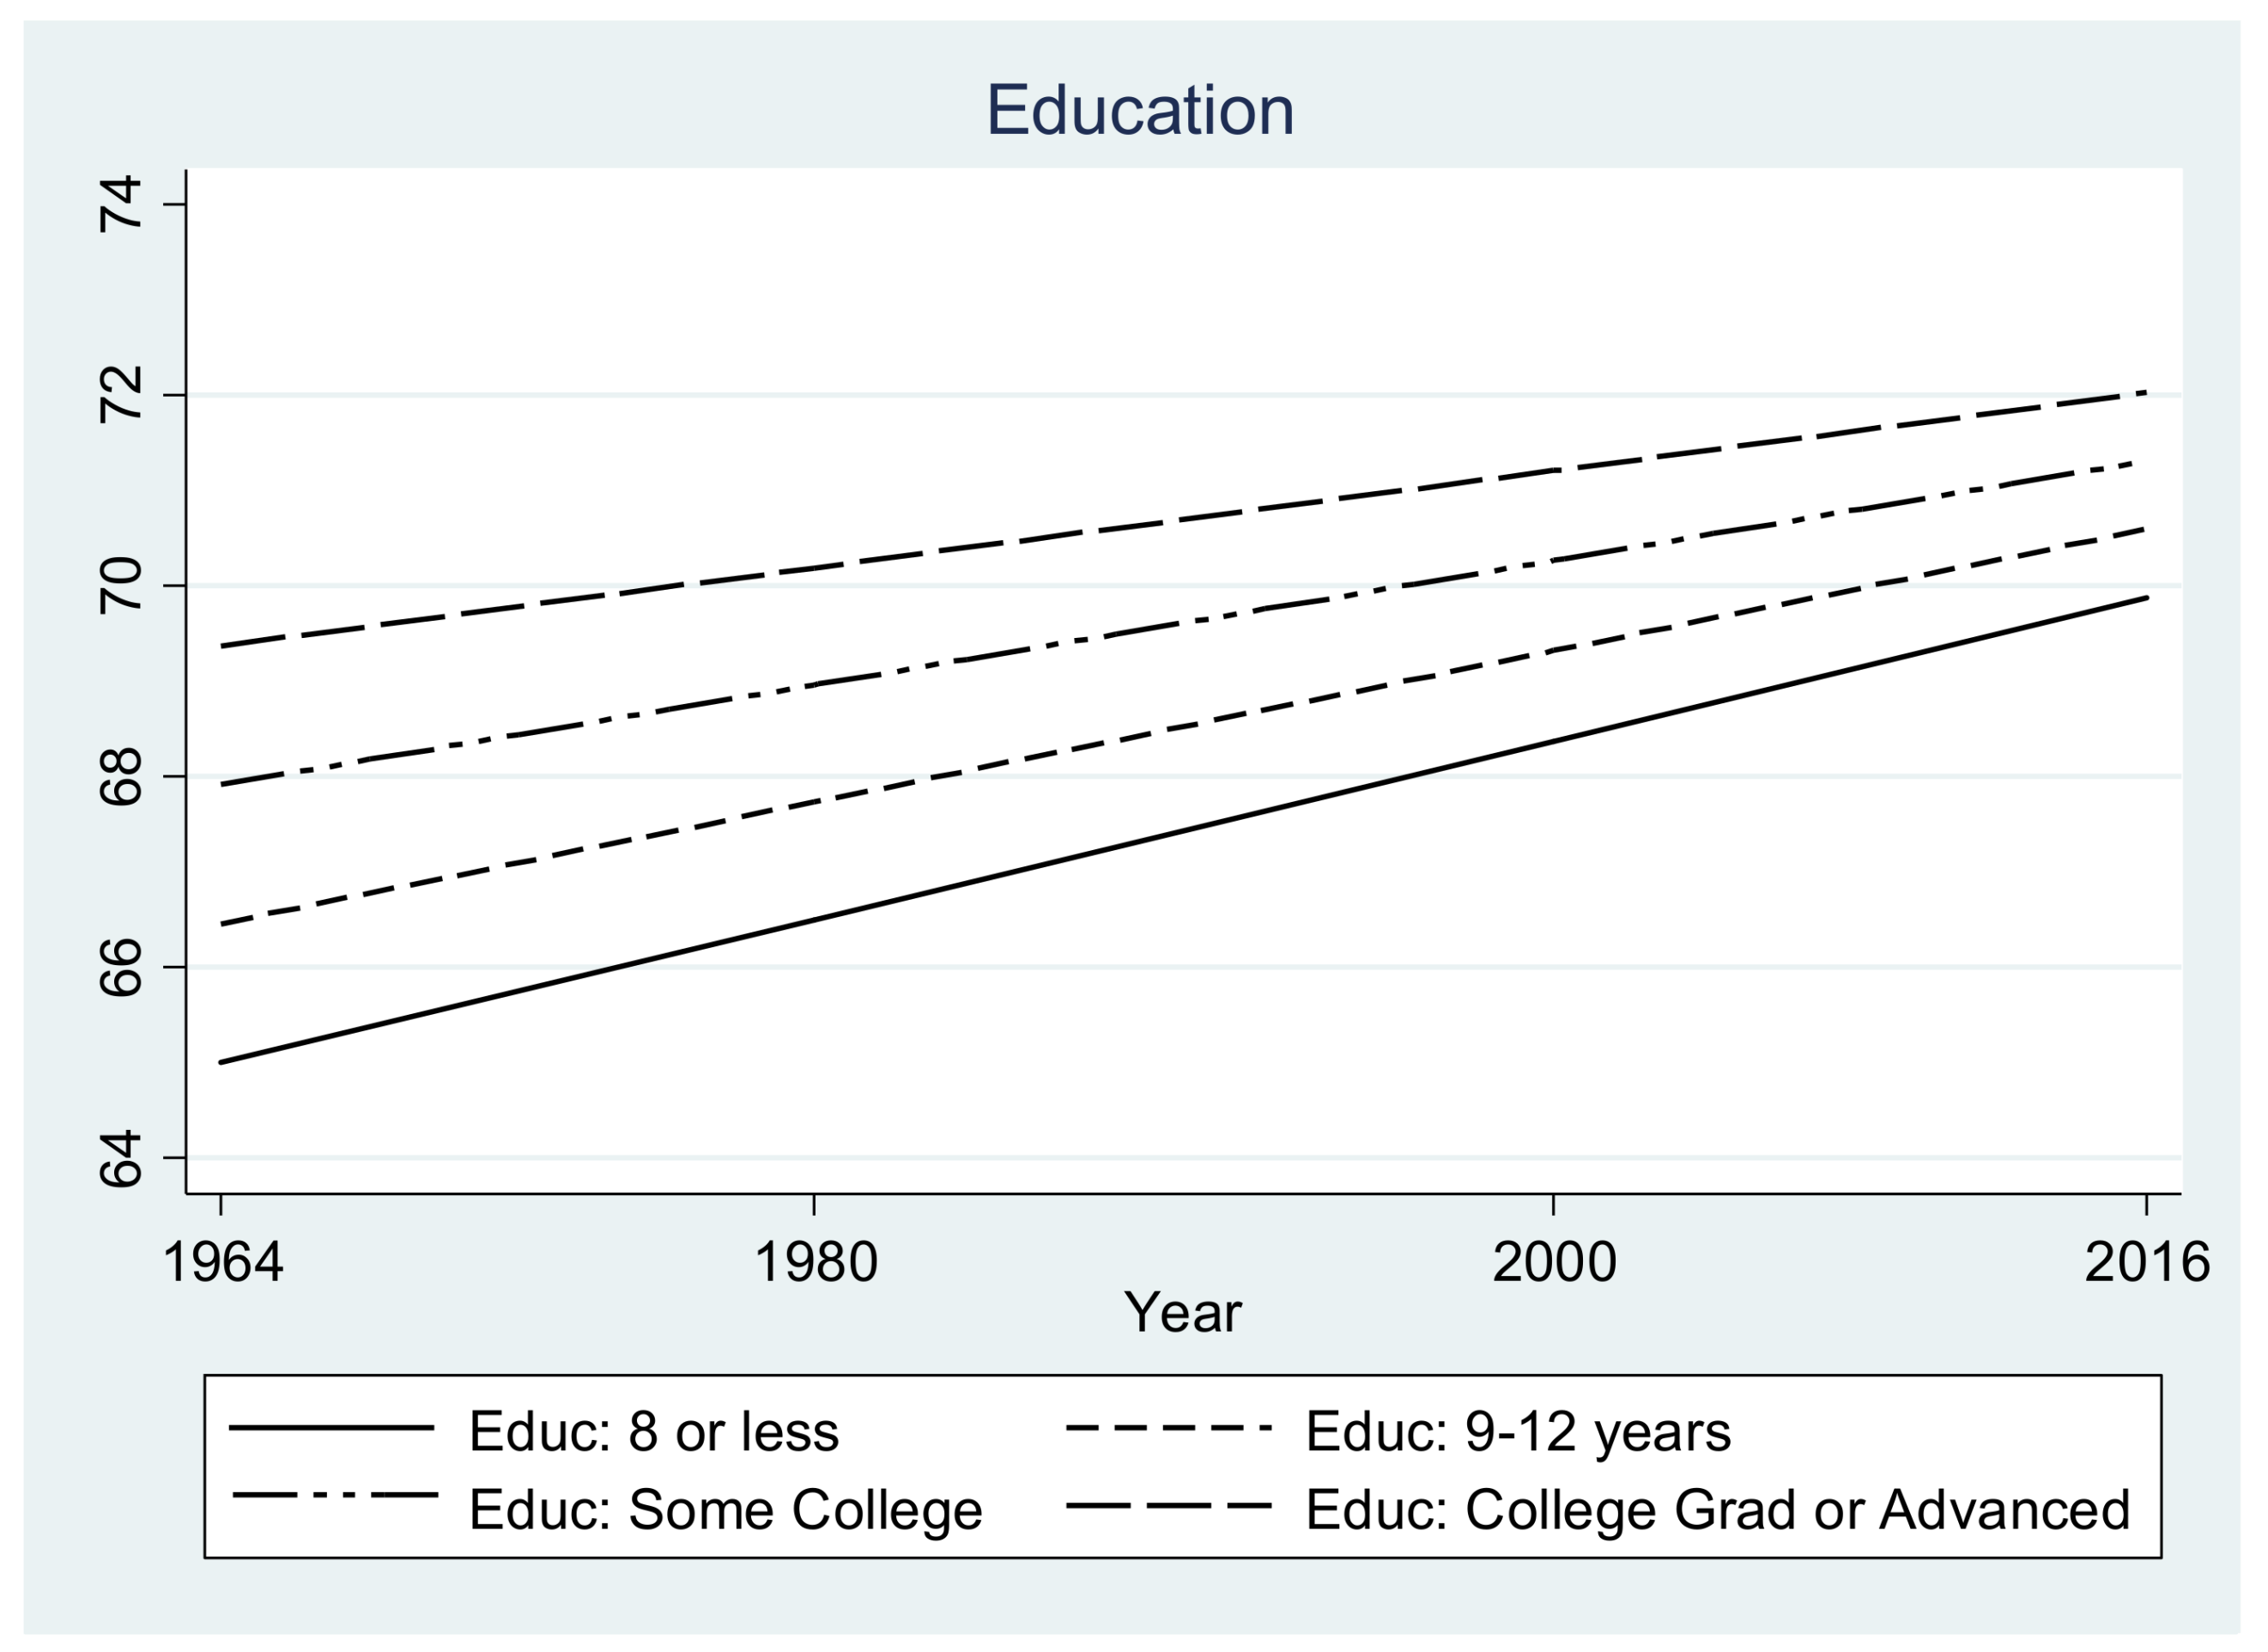
Over time, the effect of education has waned slightly, as the negative coefficient (−0.014, p = 0.04, one-tailed test) signifies. Still, individuals at all education levels have become increasing warm to Jews; only the difference across education levels has narrowed, as Figure 4 shows. In 1964, the most highly educated rate Jews at 69.4, compared to 65 for the least educated, a 4.4-degree difference. In 2016, the highest educated rate Jews at 72, with the least educated rating them 69.9, a difference of 2.1 degrees, one-half of the gap in 1964. Education has a two-pronged effect on aggregate trends. First, there are more highly educated Americans in 2016 than 1964. Second, voters at all educational levels demonstrate increasing warmth over time, with the greatest warming among the least well educated. These results do not support the contention that the most educated are becoming more antisemitic due to exposure to antisemitic and anti-Israel environments on college campuses.12 It appears from these finding that the combination of antisemitic and anti-Israel attitudes among educated youth may be restricted to a very small number of individuals, perhaps only while in residence on college campuses.
Moreover, the increase in warmth at all educational levels has a greater impact on the thermometer ratings than the changes in sizes of different educational levels. We can simulate the effects of education on the 2016 thermometer ratings by using the sizes of each educational level in 1964, with the predicted thermometer scores in 2016. In other words, we can answer the question of what the effect of education on warmth would be if there were no change in educational attainment. This produces a 2016 thermometer rating of 70.8, just shy of the 71.2 when using the sizes from 1964 and the predicted scores from 2016. However, if we use the size from 2016 and the predicted warmth scores from 1964 for each educational level, we produce a thermometer rating of 67.8, about 3.4 degrees less than the predicted thermometer rating using both the size and scores from 2016. Most of the effect of education is due to increases in warmth across all education levels, not from increases in education.
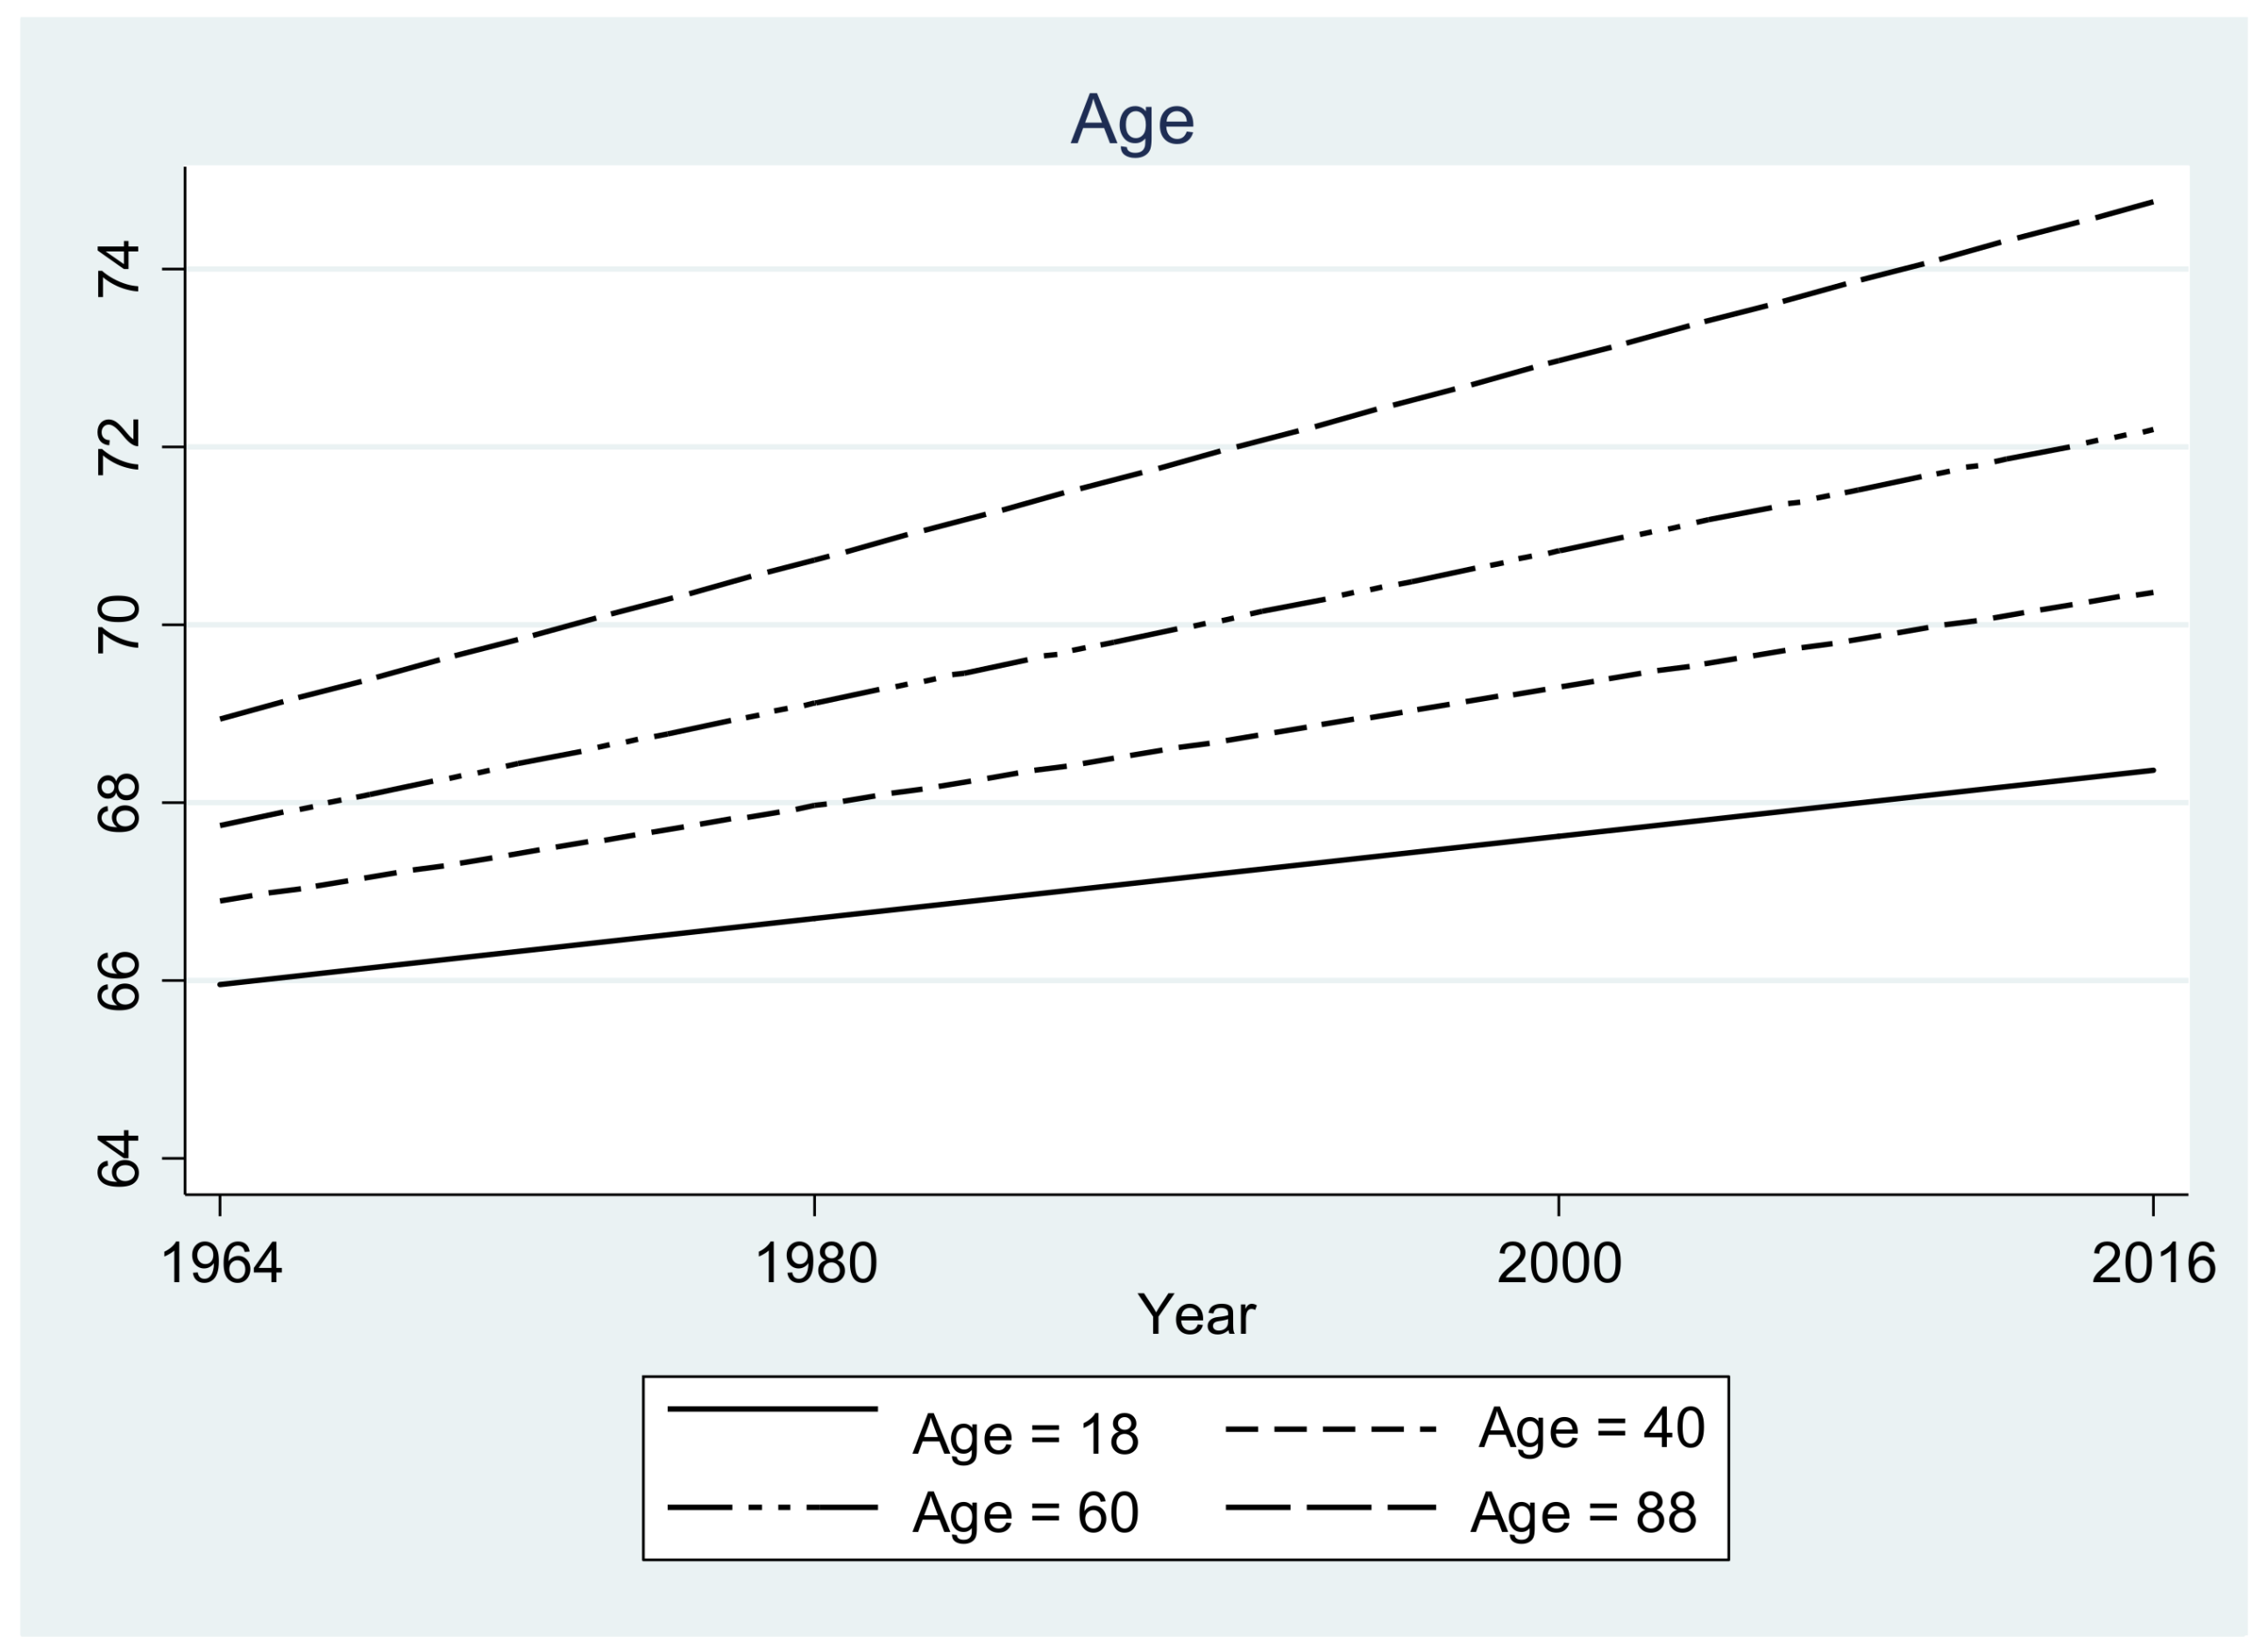
Age, like education, has complex effects on warmth toward Jews over time. Each additional year of age adds about 0.001 degrees of warmth, or about five degrees when comparing an 18-year-old with a 90-year-old. The aging of the population has something to do with the increasing warmth toward Jews. Moreover, older Americans have also grown warmer at a faster rate than younger Americans. Figure 5 plots trends in warmth for several age cohorts. In 1964, 90-year-olds average a 69-degree rating and 18-year-old average a 66-degree rating, a 3-degree difference. But in 2016, 90-year-olds average a 75-degree rating, and 18-year-olds average a 68-degree rating, a 7-degree difference. Ninety-year-olds show a 6-degree increase in warmth, while 18-year-olds show a 2-degree increase. Young and old have both become warmer, but older Americans have grown warmer at a faster rate.
The widening gap in warmth between the young and old in 2016 counters the hypothesis that exposure to news of the Holocaust in the 1940s would have a strong effect on cohorts living at that time compared to individuals coming of age afterwards. As the 1940s cohorts became a smaller percentage in the population, this hypothesis predicts a narrowing gap in warmth across age. But this is not the case, suggesting that there is something about the aging process itself that produces greater warmth toward Jews. It is not clear what it is about this aging process that produces this effect.
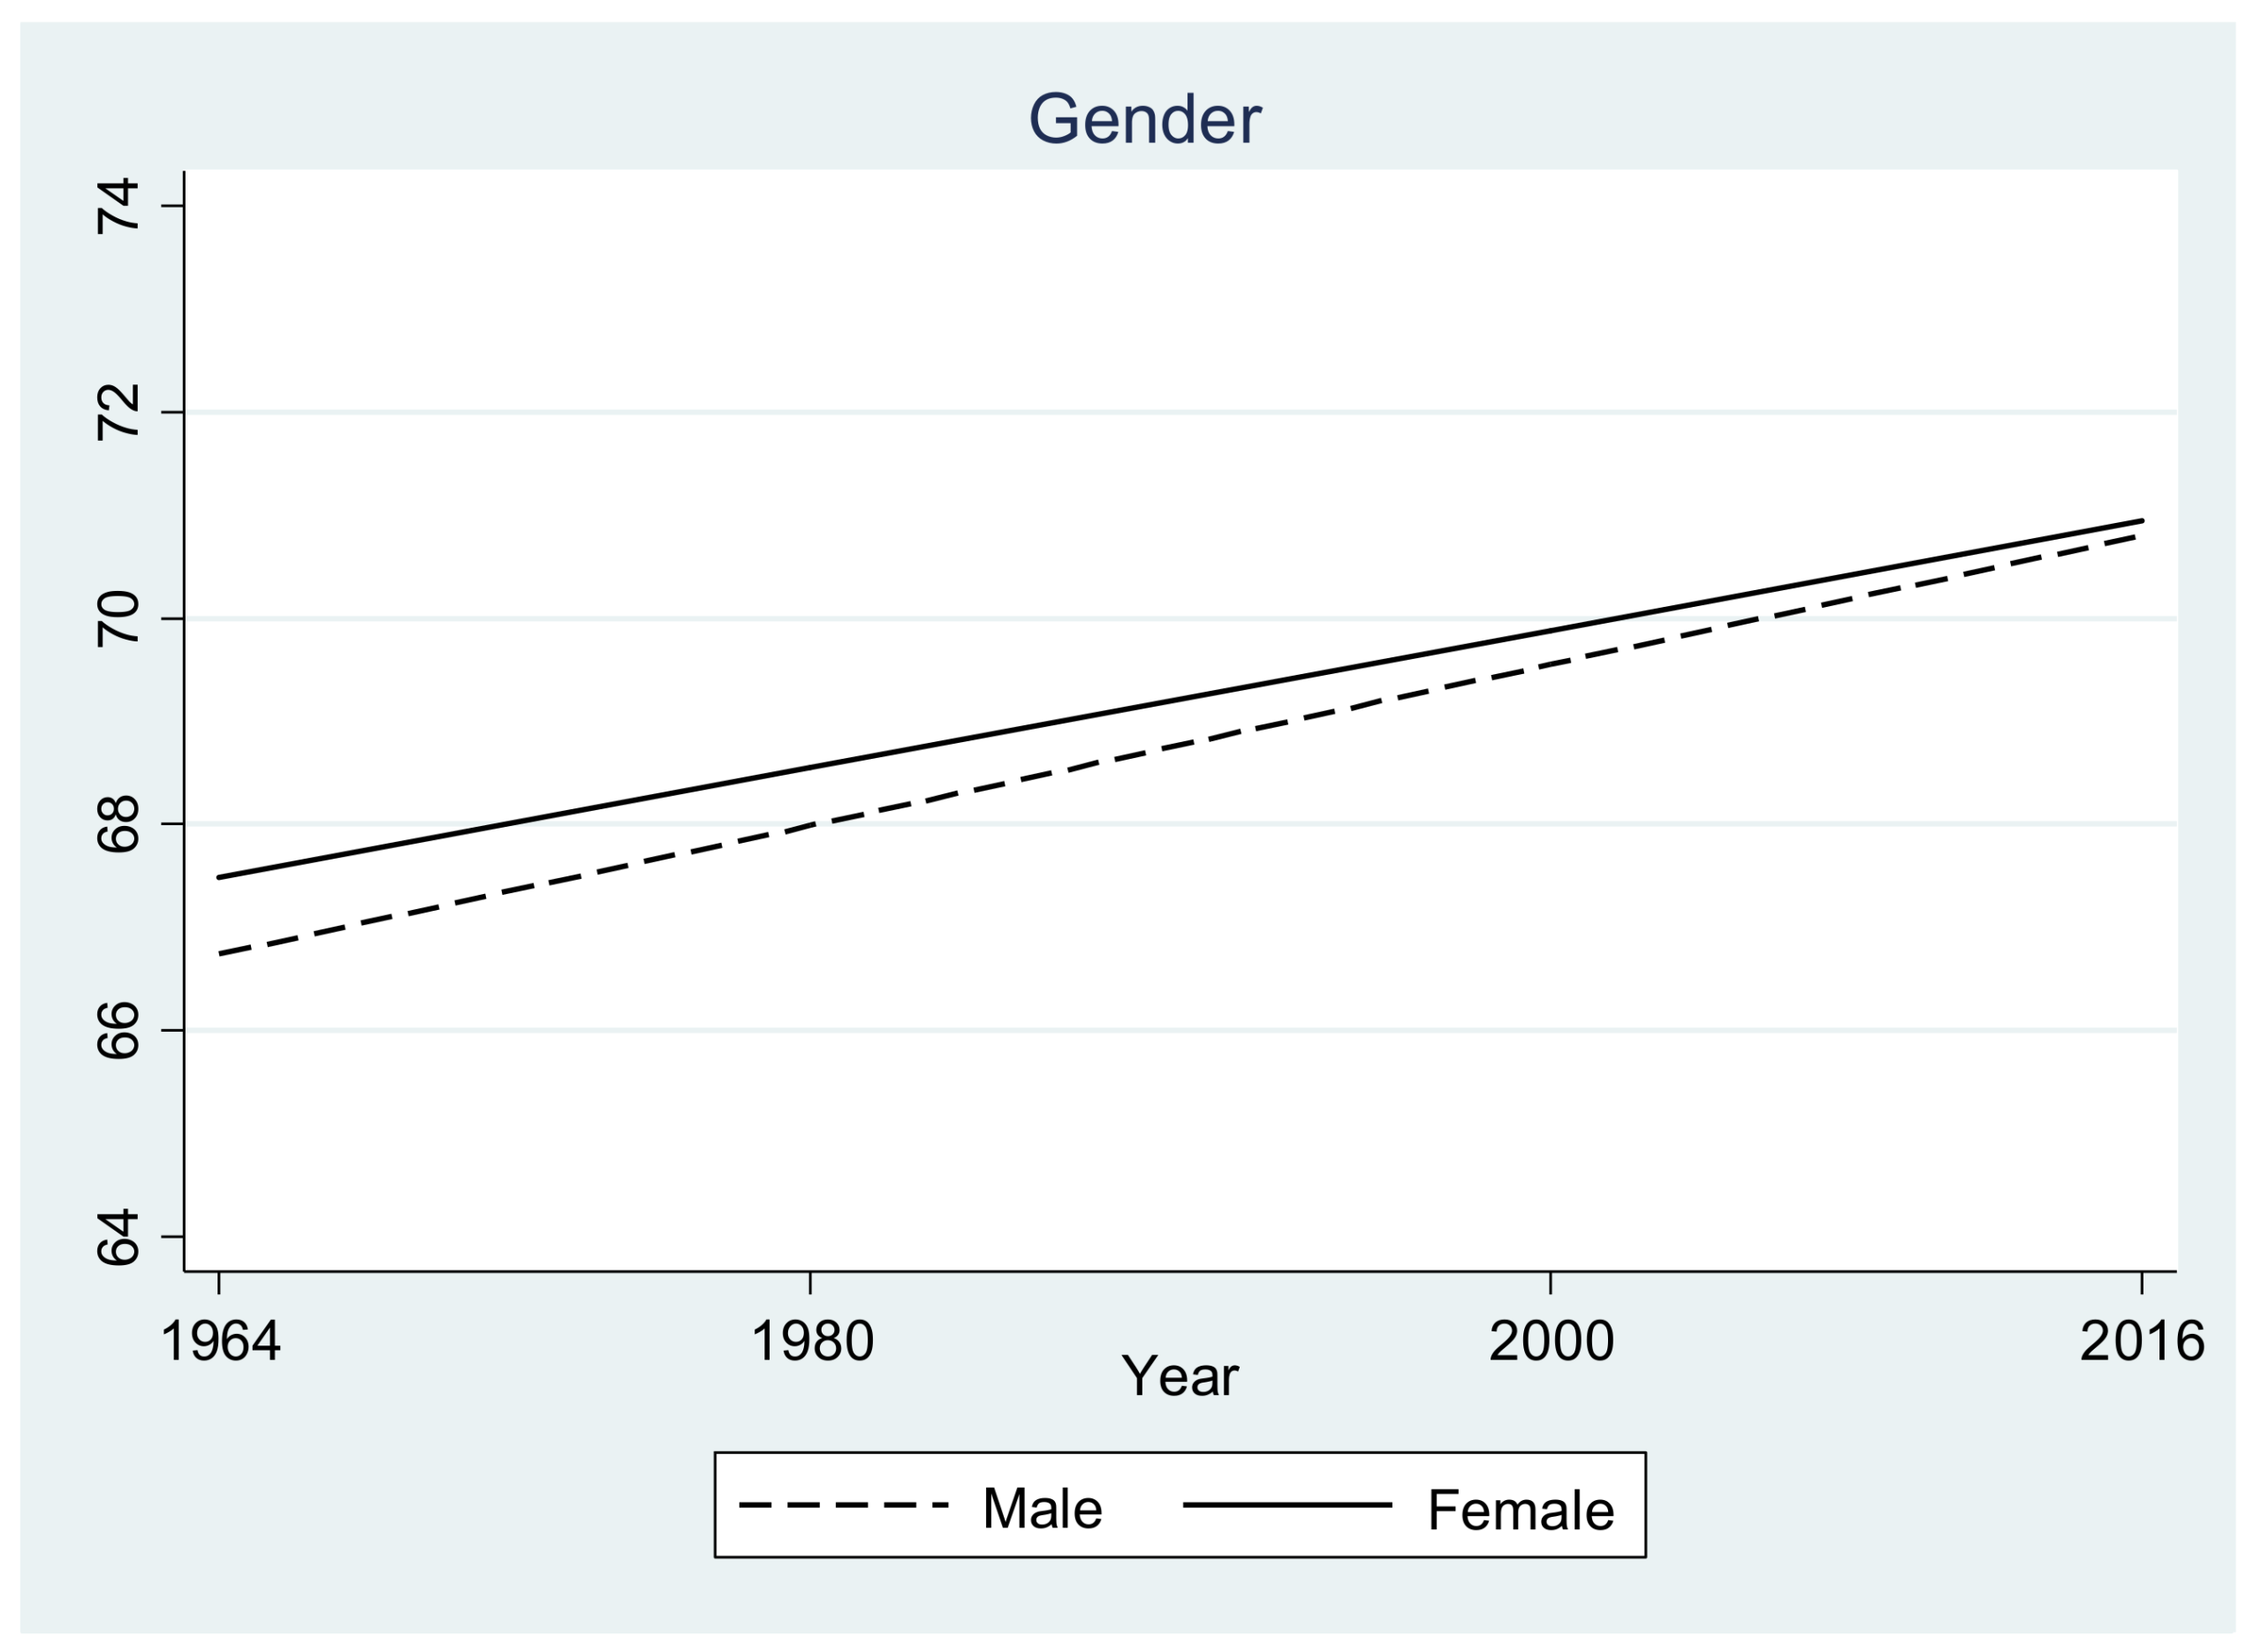
There is little appreciable difference between men and women when rating Jews, and both sexes have grown warmer. Where women rate Jews at 67.5 in 1964 and men 66.7, in 2016 both rate Jews at 71 (see Figure 6). The tiny 1964 gap had completely closed by 2016.
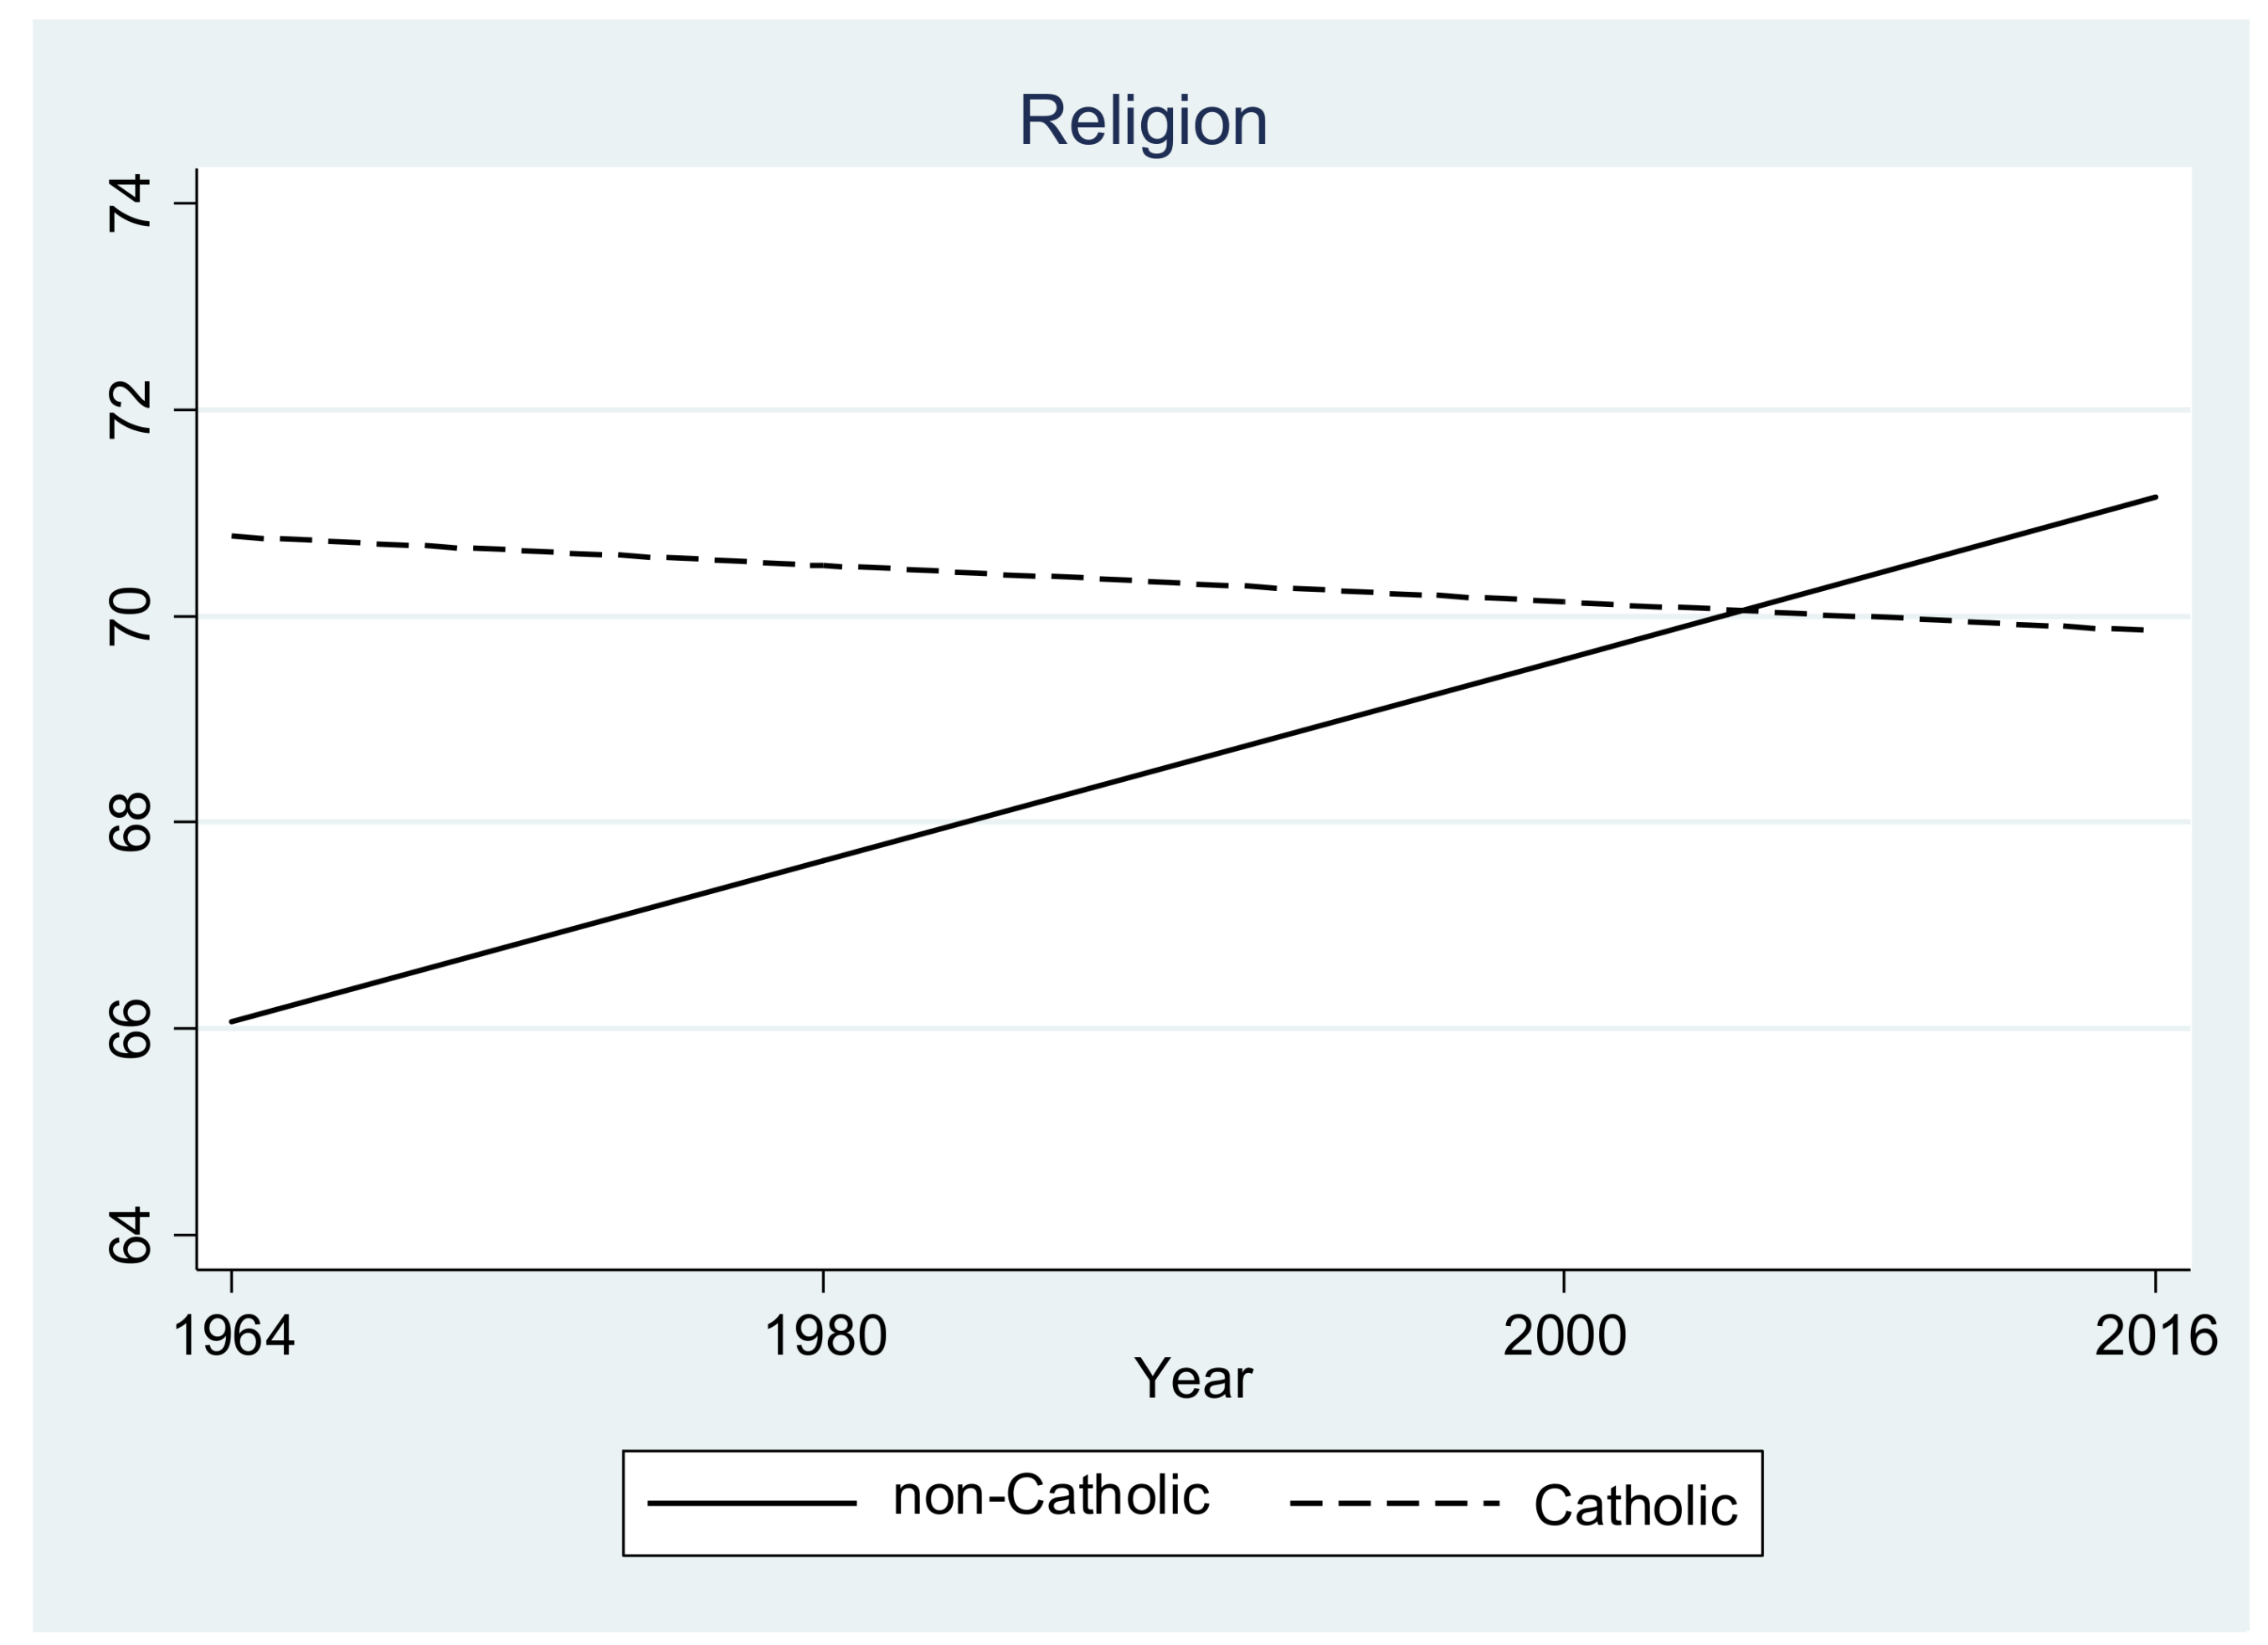
Catholics, in contrast, appear to have become cooler toward Jews over time, as the negative coefficient indicates. Figure 7 plots the trends in Catholic v. non-Catholic warmth. Where non-Catholics have grown increasingly warm, from about 66 in 1964 to 71 in 2016, Catholics exhibit a small drop in warmth, from about 71 in 1964 to 70 in 2016. From the 1960s through to the early 2000s, Catholics were warmer to Jews than non-Catholics, but from the early 2000s to the mid-2010s, the reverse is true, albeit not by much. Some have speculated that the changing composition of Catholics, especially the increase in the number of non-native-born Catholics, who are primarily Hispanic, may be driving this result (Smith 2007; King and Weiner 2007).
To test this Hispanic hypothesis, I turn to the 2016 ANES, when the warmth differential between Catholics and non-Catholics is greatest, and when the ANES has a question to distinguish Hispanics from non-Hispanics, which was not available in all of the other surveys used here. There is a suggestion of a Hispanic-Catholic effect in the 2016 data, as reported on Table 5. To test the hypothesis, I include the variables as used above (except for the time counter) and added a Hispanic dummy, and an interaction between Catholic and Hispanic.13 The sign on the interaction between Catholic-Hispanic is negative, as predicted, with a coefficient of −3.50, although the effect falls shy of statistical significance (p = 0.10). Marginal effects analysis indicates that non-Hispanic Catholics rate Jews at 70.9, compared to 69.0 for Hispanic Catholics, barely a 2-degree difference. However, this is a weak test of the underlying idea, that non-native-born Catholics are less warmly disposed to Jews than native-born Catholics, as the Hispanic variable includes native and non-native-born Hispanics.
7. Conclusions
Using the feeling thermometer on the American National Election Study surveys from 1964 to 2016, this research tracks trends in warmth to Jews. The ANES surveys are useful for tracking such trends because they constitute one of the longest time series studies using an identical question. Further, the inclusion of other group feeling thermometers, in particular for Blacks and Whites, allows for controls to help account for social desirability effects, which might lead respondents to say they have warm feelings toward Jews when their true feelings are colder. Finally, this paper extends the major research orientation on mass public antisemitic attitudes, which focuses on comparing those attitudes across different demographic groups.
Most groups have become increasingly warm toward Jews, suggesting a broad secular transformation in attitudes toward Jews. There do not appear to be differences in warmth across gender and party lines, with relevant subgroups increasing their warmth across the years. However, there are notable differences across other groups and differences in within-group trends. As found in past research, Blacks are cooler toward Jews than non-Blacks, but not by much. Repeating past research, more education is associated with greater warmth toward Jews, yet the gap in warmth between the highest and least educated has narrowed, with the least educated showing the highest increase in warmth among educational categories. Similarly, all age cohorts have grown warmer, but older Americans have warmed toward Jews at faster rates than younger individuals. The reason for this more steeply increased warmth rate is unclear.
Somewhat surprisingly, Catholics have become slightly cooler toward Jews, bucking the trend for other studied groups. The Catholic population in the US has undergone a major shift in composition over the years, due in large measure to the influx of Hispanic immigrants, who are primarily Catholic. Some have speculated that these newer immigrants bring with them to the US antisemitic attitudes, due to the long and deep history of antisemitism in their home countries. The ANES does not ask about Hispanic ethnicity across the entire series used here, so this paper supplemented the analysis by using the 2016 ANES to test the Hispanic hypothesis. Results suggest that Hispanic Catholics are cooler toward Jews than non-Hispanic Catholics, although Hispanics still display warm feelings on average. The increasing size of the Hispanic population, due in part to immigration, may have important implications for future rates of antisemitism in the US. For this reason, this question merits more research.
That Hispanic Catholics seem cooler to Jews than others suggest several new lines of inquiry for future research. First, it is not clear what process affects Hispanic Catholics this way. It could be that being raised outside of the US, in countries without the tradition of religious tolerance of the US, contributes to the difference in warmth between Hispanic and non-Hispanic Catholics. If so, then it would be worth testing this hypothesis among other immigrant groups to the US, which also come from historically less tolerant nations (Tausch 2018). But it may also be the case that the socially and economically marginal position of many Hispanic immigrants into the US drives their attitudes toward Jews, perhaps viewing Jews as a privileged group. Thus, it is not Jewishness per se, but perceptions of privilege that leads to antisemitic attitudes among Hispanics, and perhaps other groups.
Still, the analysis in this paper rests on one question series. The findings here need to be tested using other indicators of antisemitism, although the paucity of other long question series forecloses tracking long-term changes. Including some past used questions on new surveys may help in that regard to some degree. Further, it would be useful to pose multiple types of questions tapping antisemitic attitudes in a single survey, to compare how responses vary across questions. Thus, there is a large research agenda on the nature and sources of antisemitic attitudes, as well as linking such research to more general research on prejudice of various kinds in mass publics.
Finally, it is worth noting that, in an age of intense partisan polarization and political discord, the United States, at least with regard to religious tolerance toward Jews, has become a much more accepting nation. Studying the sources of this type of religious tolerance may help us understand the rise in partisan polarization, factors that may counterbalance the divisiveness between the parties and those loyal to their respective parties, and what processes may lead to a moderation of partisan polarization.
Conflicts of Interest
The author declares no conflict of interest.
References
- Adorno, Theodor W., Else Frenkel-Brunswik, Daniel J. Levinson, and R. Nevitt Sanford. 1950. The Authoritarian Personality. New York: Harper and Row. [Google Scholar]
- Alwin, Duane F. 1997. Feeling Thermometers Versus 7-Point Scales: Which Are Better? Sociological Methods & Research 25: 318–40. [Google Scholar]
- Anti-Defamation League of B’nai B’rith. 1964. Anti-Semitism in the United States Survey, October. USNORC.64BNAI.R26B. National Opinion Research Center, University of Chicago. Ithaca: Roper Center for Public Opinion Research, iPOLL, Cornell University, Available online: https://ropercenter.cornell.edu/CFIDE/cf/action/ipoll/ipollResult.cfm?keyword=USNORC.64BNAI.R26B&exclude=&topic=Any&organization=Any&fromDate=&toDate=&questionViewId=&label=&studyId=&sortBy=BEG_DATE_DESC&search=submit (accessed on 13 November 2017).
- Antoniou, Giorgos, Elias Dinas, Spyros Kosmidis, and L. Saltiel. 2015. Collective Victimhood and Social Prejudice: A Post-Holocaust Theory of Anti-Semitism. Available online: https://www.Researchgate.Net/Profile/Elias_Dinas/Publication/285236109_Collective_Victimhood_And_Social_Prejudice_A_Post-Holocaust_Theory_Of_Anti-Semitism/Links/565cd59f08aefe619b254404/Collective-Victimhood-And-Social-Prejudice-A-Post-Holocaust-Theory-Of-Anti-Semitism.pdf (accessed on 11 November 2017).
- Baum, Steven K. 2009. Christian and Muslim Anti-Semitic Beliefs. Journal of Contemporary Religion 24: 137–56. [Google Scholar] [CrossRef]
- Baum, Steven K., and Masato Nakazawa. 2007. Anti-Semitism Versus Anti-Israeli Sentiment. Journal of Religion & Society 9: 1–8. [Google Scholar]
- Beattie, Peter. 2017. Anti-Semitism and Opposition to Israeli Government Policies: The Roles of Prejudice and Information. Ethnic and Racial Studies 40: 2749–67. [Google Scholar] [CrossRef]
- Berinsky, Adam J., and Tali Mendelberg. 2005. The Indirect Effects of Discredited Stereotypes in Judgments of Jewish Leaders. American Journal of Political Science 49: 845–64. [Google Scholar] [CrossRef]
- Brodkin, Karen. 1999. How Jews Became White Folks and What That Says About Race in America. New Brunswick: Rutgers University Press. [Google Scholar]
- Cavari, Amnon. 2012. Religious Beliefs, Elite Polarization, and Public Opinion on Foreign Policy: The Partisan Gap in American Public Opinion toward Israel. International Journal of Public Opinion Research 25: 1–22. [Google Scholar] [CrossRef]
- Cohen, Florette, Lee Jussim, Gautam Bhasin, and Elizabeth Salib. 2011. The Modern Anti-Semitism Israel Model: An Empirical Relationship between Modern Anti-Semitism and Opposition to Israel. Conflict & Communication 10: 1–16. [Google Scholar]
- Crandall, Christian S., and Colby Cohen. 1994. The Personality of the Stigmatizer: Cultural World View, Conventionalism, and Self-Esteem. Journal of Research in Personality 28: 461–80. [Google Scholar] [CrossRef]
- D’Alessio, Stewart J., and Lisa Stolzenberg. 1991. Anti-Semitism in America: The Dynamics of Prejudice. Sociological Inquiry 61: 359–66. [Google Scholar] [CrossRef]
- Dinnerstein, Leonard. 2004. Is There a New Anti-Semitism in the United States? Society 4: 53–58. [Google Scholar] [CrossRef]
- Duckitt, John. 2008. Personality and Prejudice. In On the Nature of Prejudice: Fifty Years after Allport. Edited by John F. Dovidio, Peter Glick and Laurie A. Rudman. Malden: Blackwell, pp. 395–412. [Google Scholar]
- Duckitt, John. 2009. Authoritarianism and Dogmatism. In Handbook of Individual Differences in Social Behavior. Edited by Mark R. Leary and Rick H. Hoyle. New York: Guilford, pp. 298–317. [Google Scholar]
- Dunbar, Edward. 1995. The Prejudiced Personality, Racism, and Anti-Semitism: The PR Scale Forty Years Later. Journal of Personality Assessment 65: 270–77. [Google Scholar] [CrossRef] [PubMed]
- Dunbar, Edward, and Lucie Simonova. 2003. Individual Difference and Social Status Predictors of Anti-Semitism and Racism in US and Czech Findings with the Prejudice/Tolerance and Right-Wing Authoritarianism Scales. International Journal of Intercultural Relations 27: 507–23. [Google Scholar] [CrossRef]
- Ekehammar, Bo, Nazar Akrami, and Tadesse Araya. 2003. Gender Differences in Implicit Prejudice. Personality and Individual Differences 34: 1509–23. [Google Scholar] [CrossRef]
- Fiebert, Martin S., Lara Horgan, and Edger Peralta. 1999. Assessing African-American and Jewish Intergroup Perceptions and Attitudes. Perceptual and Motor Skills 88: 253–58. [Google Scholar] [CrossRef]
- Flowerman, Samuel H., and Marie Jahoda. 1946. Polls on Anti-Semitism. Commentary 1: 82–86. [Google Scholar]
- Forscher, Patrick S., Calvin Lai, Jordan Axt, Charles R. Ebersole, Michelle Herman, Patricia G. Devine, and Brian A. Nosek. 2016. A Meta-Analysis of Change in Implicit Bias. Available online: https://psyarxiv.com/dv8tu/ (accessed on 18 November 2017).
- Freedman, Mervin B. 1987. American Anti-Semitism Now: A Political Psychology Perspective. In Social Change and Personality: Essays in Honor of Nevitt Sanford. Edited by Mervin B. Freedman. New York: Springer, pp. 80–115. [Google Scholar]
- Frindte, Wolfgang, Susan Wettig, and Dorit Wammetsberger. 2005. Old and New Anti-Semitic Attitudes in the Context of Authoritarianism and Social Dominance Orientation—Two Studies in Germany. Peace and Conflict: Journal of Peace Psychology 11: 239–66. [Google Scholar] [CrossRef]
- Gallup Organization. 1958. Gallup Poll (AIPO), July. USGALLUP.58-602.Q008C. Ithaca: Roper Center for Public Opinion Research, iPOLL, Cornell University, Available online: https://ropercenter.cornell.edu/CFIDE/cf/action/ipoll/ipollResult.cfm?keyword=USGALLUP.58-602.Q008C&exclude=&topic=Any&organization=Any&fromDate=&toDate=&questionViewId=&label=&studyId=&sortBy=BEG_DATE_DESC&search=submit (accessed on 13 November 2017).
- Gallup Organization. 2015. Gallup Poll, June. USGALLUP.062215.R08A. Ithaca: Roper Center for Public Opinion Research, iPOLL, Cornell University, Available online: https://ropercenter.cornell.edu/CFIDE/cf/action/ipoll/ipollResult.cfm?keyword=USGALLUP.062215.R08A&exclude=&topic=Any&organization=Any&fromDate=&toDate=&questionViewId=&label=&studyId=&sortBy=BEG_DATE_DESC&search=submit (accessed on 13 November 2017).
- Gerstenfeld, Manfred. 2007. Anti-Israelism and Anti-Semitism: Common Characteristics and Motifs. Jewish Political Studies Review 19: 83–108. [Google Scholar]
- Glock, Charley Y., and Rodney Stark. 1966. Christian Beliefs and Anti-Semitism. New York: Harper & Row. [Google Scholar]
- Goldstein, Eric L. 2006. The Price of Whiteness: Jews, Race, and American Identity. Princeton: Princeton University Press. [Google Scholar]
- Gonsalkorale, Karen, Jeffrey W. Sherman, and Karl Christoph Klauer. 2009. Aging and Prejudice: Diminished Regulation of Automatic Race Bias Among Older Adults. Journal of Experimental Social Psychology 45: 410–14. [Google Scholar] [CrossRef]
- Green, Donald P., Peter M. Aronow, Daniel E. Bergan, Pamela Greene, Celia Paris, and Beth I. Weinberger. 2011. Does Knowledge of Constitutional Principles Increase Support for Civil Liberties? Results from a Randomized Field Experiment. The Journal of Politics 73: 463–76. [Google Scholar] [CrossRef]
- Greene, Jay P., and Ian Kingsbury. 2017. The Relationship between Public and Private Schooling and Anti-Semitism. Journal of School Choice 11: 111–30. [Google Scholar] [CrossRef]
- Jacobson, Matthew Frye. 1998. Whiteness of a Different Color: European Immigrants and the Alchemy of Race. Cambridge: Harvard University Press. [Google Scholar]
- Jaspal, Rusi. 2014. Antisemitism and Anti-Zionism: Representation, Cognition and Everyday Talk. New York: Routledge. [Google Scholar]
- Kane, James G., Stephen C. Craig, and Kenneth D. Wald. 2004. Religion and Presidential Politics in Florida: A List Experiment. Social Science Quarterly 85: 281–93. [Google Scholar] [CrossRef]
- Kaplan, Edward H., and Charles A. Small. 2006. Anti-Israel Sentiment Predicts Anti-Semitism in Europe. Journal of Conflict Resolution 50: 548–61. [Google Scholar] [CrossRef]
- Karpowitz, Christopher F., J. Quin Monson, and Kelly D. Patterson. 2016. Who’s in and Who’s Out: The Politics of Religious Norms. Politics and Religion 9: 508–36. [Google Scholar] [CrossRef]
- Kempf, Wilhelm. 2012. Antisemitism and Criticism of Israel: A Methodological Challenge for Peace Research. Journal for the Study of Antisemitism 4: 515–32. [Google Scholar]
- Kempf, Wilhelm. 2015. Anti-Semitism and Criticism of Israel: Methodology and Results of the Asci Survey. Conflict and Communication Online 14: 1–20. [Google Scholar]
- King, Ryan D., and Melissa F. Weiner. 2007. Group Position, Collective Threat, and American Anti-Semitism. Social Problems 54: 47–77. [Google Scholar] [CrossRef]
- Klug, Brian. 2003. The Collective Jew: Israel and the New Antisemitism. Patterns of Prejudice 37: 117–38. [Google Scholar] [CrossRef]
- Klug, Brian. 2013. Interrogating ‘New Anti-Semitism’. Ethnic and Racial Studies 36: 468–82. [Google Scholar] [CrossRef]
- Kosmin, Barry A., and Ariela Keysar. 2015. National Demographic Survey of American Jewish College Students 2014: Anti-Semitism Report. Available online: http://digitalrepository.trincoll.edu/cgi/viewcontent.cgi?article=1133&context=facpub (accessed on 5 November 2017).
- Krekó, Péter. 2012. Back to the Roots: Are Antisemites Still Authoritarians? Journal for the Study of Antisemitism 4: 495–514. [Google Scholar]
- Krumpal, Ivar. 2013. Determinants of Social Desirability Bias in Sensitive Surveys: A Literature Review. Quality & Quantity 47: 2025–47. [Google Scholar]
- Lipset, Seymour M. 1987. Blacks and Jews: How Much Bias? Public Opinion 10: 57–58. [Google Scholar]
- Marcus, Kenneth L. 2007. The Resurgence of Anti-Semitism on American College Campuses. Current Psychology 26: 206–12. [Google Scholar] [CrossRef]
- Martire, Gregory, and Ruth Clark. 1982. Anti-Semitism in the United States: A Study of Prejudice in the 1980s. New York: Praeger. [Google Scholar]
- Marx, Gary T. 1967. Protest and Prejudice: A Study of Belief in the Black Community. New York: Harper and Row. [Google Scholar]
- Nederhof, Anton J. 1985. Methods of Coping with Social Desirability Bias: A Review. European Journal of Social Psychology 15: 263–80. [Google Scholar] [CrossRef]
- Newsweek. 2000. PSRA/Newsweek Poll, August. USPSRNEW.081200.R18. Princeton Survey Research Associates. Ithaca: Roper Center for Public Opinion Research, iPOLL, Cornell University, Available online: https://ropercenter.cornell.edu/CFIDE/cf/action/ipoll/ipollResult.cfm?keyword=USPSRNEW.081200.R18&exclude=&topic=Any&organization=Any&fromDate=&toDate=&questionViewId=&label=&studyId=&sortBy=BEG_DATE_DESC&search=submit (accessed on 13 November 2017).
- Okami, Paul. 1992. Intolerable Grievances Patiently Endured: Referent Cognitions and Group Conflict as Mediators of Anti-Jewish Sentiment among African-Americans. Political Psychology 13: 727–53. [Google Scholar] [CrossRef]
- Oswald, Frederick L., Gregory Mitchell, Hart Blanton, James Jaccard, and Philip E. Tetlock. 2013. Predicting Ethnic and Racial Discrimination: A Meta-Analysis of IAT Criterion Studies. Journal of Personality and Social Psychology 105: 171–92. [Google Scholar] [CrossRef] [PubMed]
- Pew Research Center for the People & the Press, Pew Internet & American Life Project. 2004. Pew News Interest Index Poll, March. USPSRA.040204.R45. Princeton Survey Research Associates International. Ithaca: Roper Center for Public Opinion Research, iPOLL, Cornell University, Available online: https://ropercenter.cornell.edu/CFIDE/cf/action/ipoll/ipollResult.cfm?keyword=USPSRA.040204.R45&exclude=&topic=Any&organization=Any&fromDate=&toDate=&questionViewId=&label=&studyId=&sortBy=BEG_DATE_DESC&search=submit (accessed on 13 November 2017).
- Podsakoff, Philip M., Scott B. Mackenzie, Jeong-Yeon Lee, and Nathan P. Podsakoff. 2003. Common Method Biases in Behavioral Research: A Critical Review of the Literature and Recommended Remedies. Journal of Applied Psychology 88: 879–903. [Google Scholar] [CrossRef] [PubMed]
- Putnam, Robert D., and David E. Campbell. 2012. American Grace: How Religion Divides and Unites Us. New York: Simon and Schuster. [Google Scholar]
- Quinley, Harold E., and Charles Y. Glock. 1979. Anti-Semitism in America. New York: Free Press. [Google Scholar]
- Raden, David. 1998. American Blacks’ and Whites’ Preferred Social Distance from Jews. The Journal of Social Psychology 138: 265–67. [Google Scholar] [CrossRef]
- Raden, David. 1999. Is Anti-Semitism Currently Part of an Authoritarian Attitude Syndrome? Political Psychology 20: 323–43. [Google Scholar] [CrossRef]
- Reynolds, Matt. 2011. Pope Benedict Xvi Points Fingers on Who Killed Jesus. Christianity Today. March 2. Available online: http://www.Christianitytoday.Com/Ct/2011/Marchweb-Only/Popepointsfinger.html (accessed on 26 July 2017).
- Rudman, Laurie A., Anthony G. Greenwald, Deborah S. Mellott, and Jordan L. K. Schwartz. 1999. Measuring the automatic components of prejudice: Flexibility and generality of the Implicit Association Test. Social cognition 17: 437–65. [Google Scholar] [CrossRef]
- Selznick, Gertrude J., and Stephen Steinberg. 1969. The Tenacity of Prejudice: Anti-Semitism in Contemporary America. New York: Harper and Row. [Google Scholar]
- Sidanius, Jim, and Felicia Pratto. 1999. Social Dominance: An Intergroup Theory of Social Hierarchy and Oppression. New York: Cambridge University Press. [Google Scholar]
- Sigelman, Lee. 1995. Blacks, Whites, and Anti-Semitism. The Sociological Quarterly 36: 649–56. [Google Scholar] [CrossRef]
- Simes, Jessica T. 2009. Does Anti-Semitism Among African Americans Simply Reflect Anti-White Sentiment? The Social Science Journal 46: 384–89. [Google Scholar] [CrossRef]
- Smith, Tom W. 1993. A Review: Actual Trends or Measurement Artifacts? A Review of Three Studies of Anti-Semitism. Public Opinion Quarterly 57: 380–93. [Google Scholar] [CrossRef]
- Smith, Tom W. 1996. Anti-Semitism in Contemporary America: A Review. Research in Micropolitics 5: 125–78. [Google Scholar]
- Smith, Tom W. 1997. Factors Relating to Misanthropy in Contemporary American Society. Social Science Research 26: 170–96. [Google Scholar] [CrossRef]
- Smith, Tom W. 1999. The Religious Right and Anti-Semitism. Review of Religious Research 40: 244–58. [Google Scholar] [CrossRef]
- Smith, Tom W. 2007. Hispanic Attitudes toward Jews. American Jewish Committee. Available online: http://Research.Policyarchive.Org/11858.Pdf (accessed on 17 November 2017).
- Stember, Charles H. 1966. The Recent History of Public Attitudes. In Jews in the Mind of America. Edited by George Salomon. New York: Basic Books, pp. 31–234. [Google Scholar]
- Tausch, Arno. 2014. The New Global Antisemitism: Implications from the Recent ADL-100 Data. Middle East Review of International Affairs 18: 46–72. [Google Scholar] [CrossRef]
- Tausch, Arno. 2018. The Effects of ‘Nostra Aetate’: Comparative Analyses of Catholic Antisemitism More Than Five Decades after the Second Vatican Council. Unpublished manuscript. Available online: https://papers.ssrn.com/sol3/papers.cfm?abstract_id=3098079 (accessed on 27 March 2018).
- Wald, Kenneth D., and Lee Sigelman. 1997. Romancing the Jews: The Christian Right in Search of Strange Bedfellows. In Sojourners in the Wilderness: The Christian Right in Comparative Perspective. Edited by Corwin E. Schmidt and James M. Penning. Lanham: Rowman and Littlefield, pp. 139–68. [Google Scholar]
- Weil, Frederick D. 1985. The Variable Effects of Education on Liberal Attitudes: A Comparative-Historical Analysis of Anti-Semitism Using Public Opinion Survey Data. American Sociological Review 50: 458–74. [Google Scholar] [CrossRef]
- Welch, Susan. 2014. American Opinion toward Jews During the Nazi Era: Results from Quota Sample Polling During the 1930s and 1940s. Social Science Quarterly 95: 615–35. [Google Scholar] [CrossRef]
- Wilcox, Clyde, Lee Sigelman, and Elizabeth Cook. 1989. Some Like It Hot: Individual Differences in Responses to Group Feeling Thermometers. Public Opinion Quarterly 53: 246–57. [Google Scholar] [CrossRef]
- Wilson, Thomas C. 1996. Cohort and Prejudice: Whites’ Attitudes toward Blacks, Hispanics, Jews, and Asians. Public Opinion Quarterly 60: 253–74. [Google Scholar] [CrossRef]
- Wuthnow, Robert. 1982. Anti-Semitism and Stereotyping. In In the Eye of the Beholder: Contemporary Issues in Stereotyping. Edited by Arthur G. Miller. New York: Praeger, pp. 128–43. [Google Scholar]
| 1 | According to recent cross-national studies, such as the Pew Global Attitudes Project (http://www.pewglobal.org/), Americans rank as among the least antisemitic nation, finding in 2011 82% were favorable or very favorable. Only a handful of primarily Western nations—France, Great Britain, Germany, the Netherlands, and Canada—had similarly favorable attitudes. The World Values Survey (http://www.worldvaluessurvey.org) asks about objections to a Jew being a neighbor, finding in 1999, only 9% objected, compared to nearly 30% in the other nations at that time. The 2014 ADL Global 100 (http://global100.adl.org) poll finds 9% of Americans to be antisemitic, compared to a global average of 26%. |
| 2 | There is a minor wording change in this question. Originally Gallup used the phrase “happens to be a Jew”, which was later changed to “happen to be Jewish”. |
| 3 | There are some slight differences in wording. |
| 4 | There are minor question wording differences. |
| 5 | Gallup Organization. Gallup Poll, June, 2015 [survey question]. USGALLUP.062215.R08A. Gallup Organization [producer]. Cornell University, Ithaca, NY: Roper Center for Public Opinion Research, iPOLL [distributor], accessed 9 March 2018. |
| 6 | There are several other major available data sources, such as Pew’s Global Attitudes Project and the World Values Survey (WVS). Pew uses a favorability question, which has been posed to US respondents from 2004 to 2011. The Pew series did not begin early enough for long-term trends to be tracked. The WVS uses a question asking about objections to certain types of people as a neighbor. The Jewish neighbor question has been asked of US respondents on in 1999 and thus precludes trend analysis. Finally, the ADL Global 100 are not available at the individual level, but only national aggregated data from their webpage: http://global100.adl.org/, and again cannot be used for present purposes because of the limited US administration (2014 and 2015). These data sources are discussed more completely in Tausch (2018). |
| 7 | Two recent meta-analyzes of implicit bias have questioned whether implicit bias more strongly relates to behavior than explicit bias; see (Oswald et al. 2013; Forscher et al. 2016). |
| 8 | Greene and Kingsbury report 59% of Blacks with antisemitic attitudes 2015, compared to 31% for Whites (p. 121). |
| 9 | I used the cumulative 1948–2012 ANES data file, merged with relevant variables from the 2016 study. ANES did not field a 2014 study. |
| 10 | Education is measured as a four-point scale: 1 = 0–8 years of education, 2 = 9–12 years, 3 = some college, and 4 = college graduate or more education. |
| 11 | These are the only two demographic feeling thermometers asked each year that the Jewish feeling thermometer was asked. Still, there may be a greater tendency to give a socially desirable response for Jews than for Blacks and Whites. |
| 12 | A three-way interaction of time, education, and age finds that the most educated at age 25 have a warmth rating of 67 in 1964 and 71 in 2016. |
| 13 | About 80% of Hispanics also claim to be Catholic. |
Figure 1.
Jewish feeling thermometer kernel density plots, 1964, 2016. Source: American National Election Studies, 1964–2016.
Figure 1.
Jewish feeling thermometer kernel density plots, 1964, 2016. Source: American National Election Studies, 1964–2016.

Figure 2.
Impact of race on the Jewish feeling thermometer, 1964–2016. Based on results from Table 3. Source: American National Election Studies, 1964–2016.
Figure 2.
Impact of race on the Jewish feeling thermometer, 1964–2016. Based on results from Table 3. Source: American National Election Studies, 1964–2016.
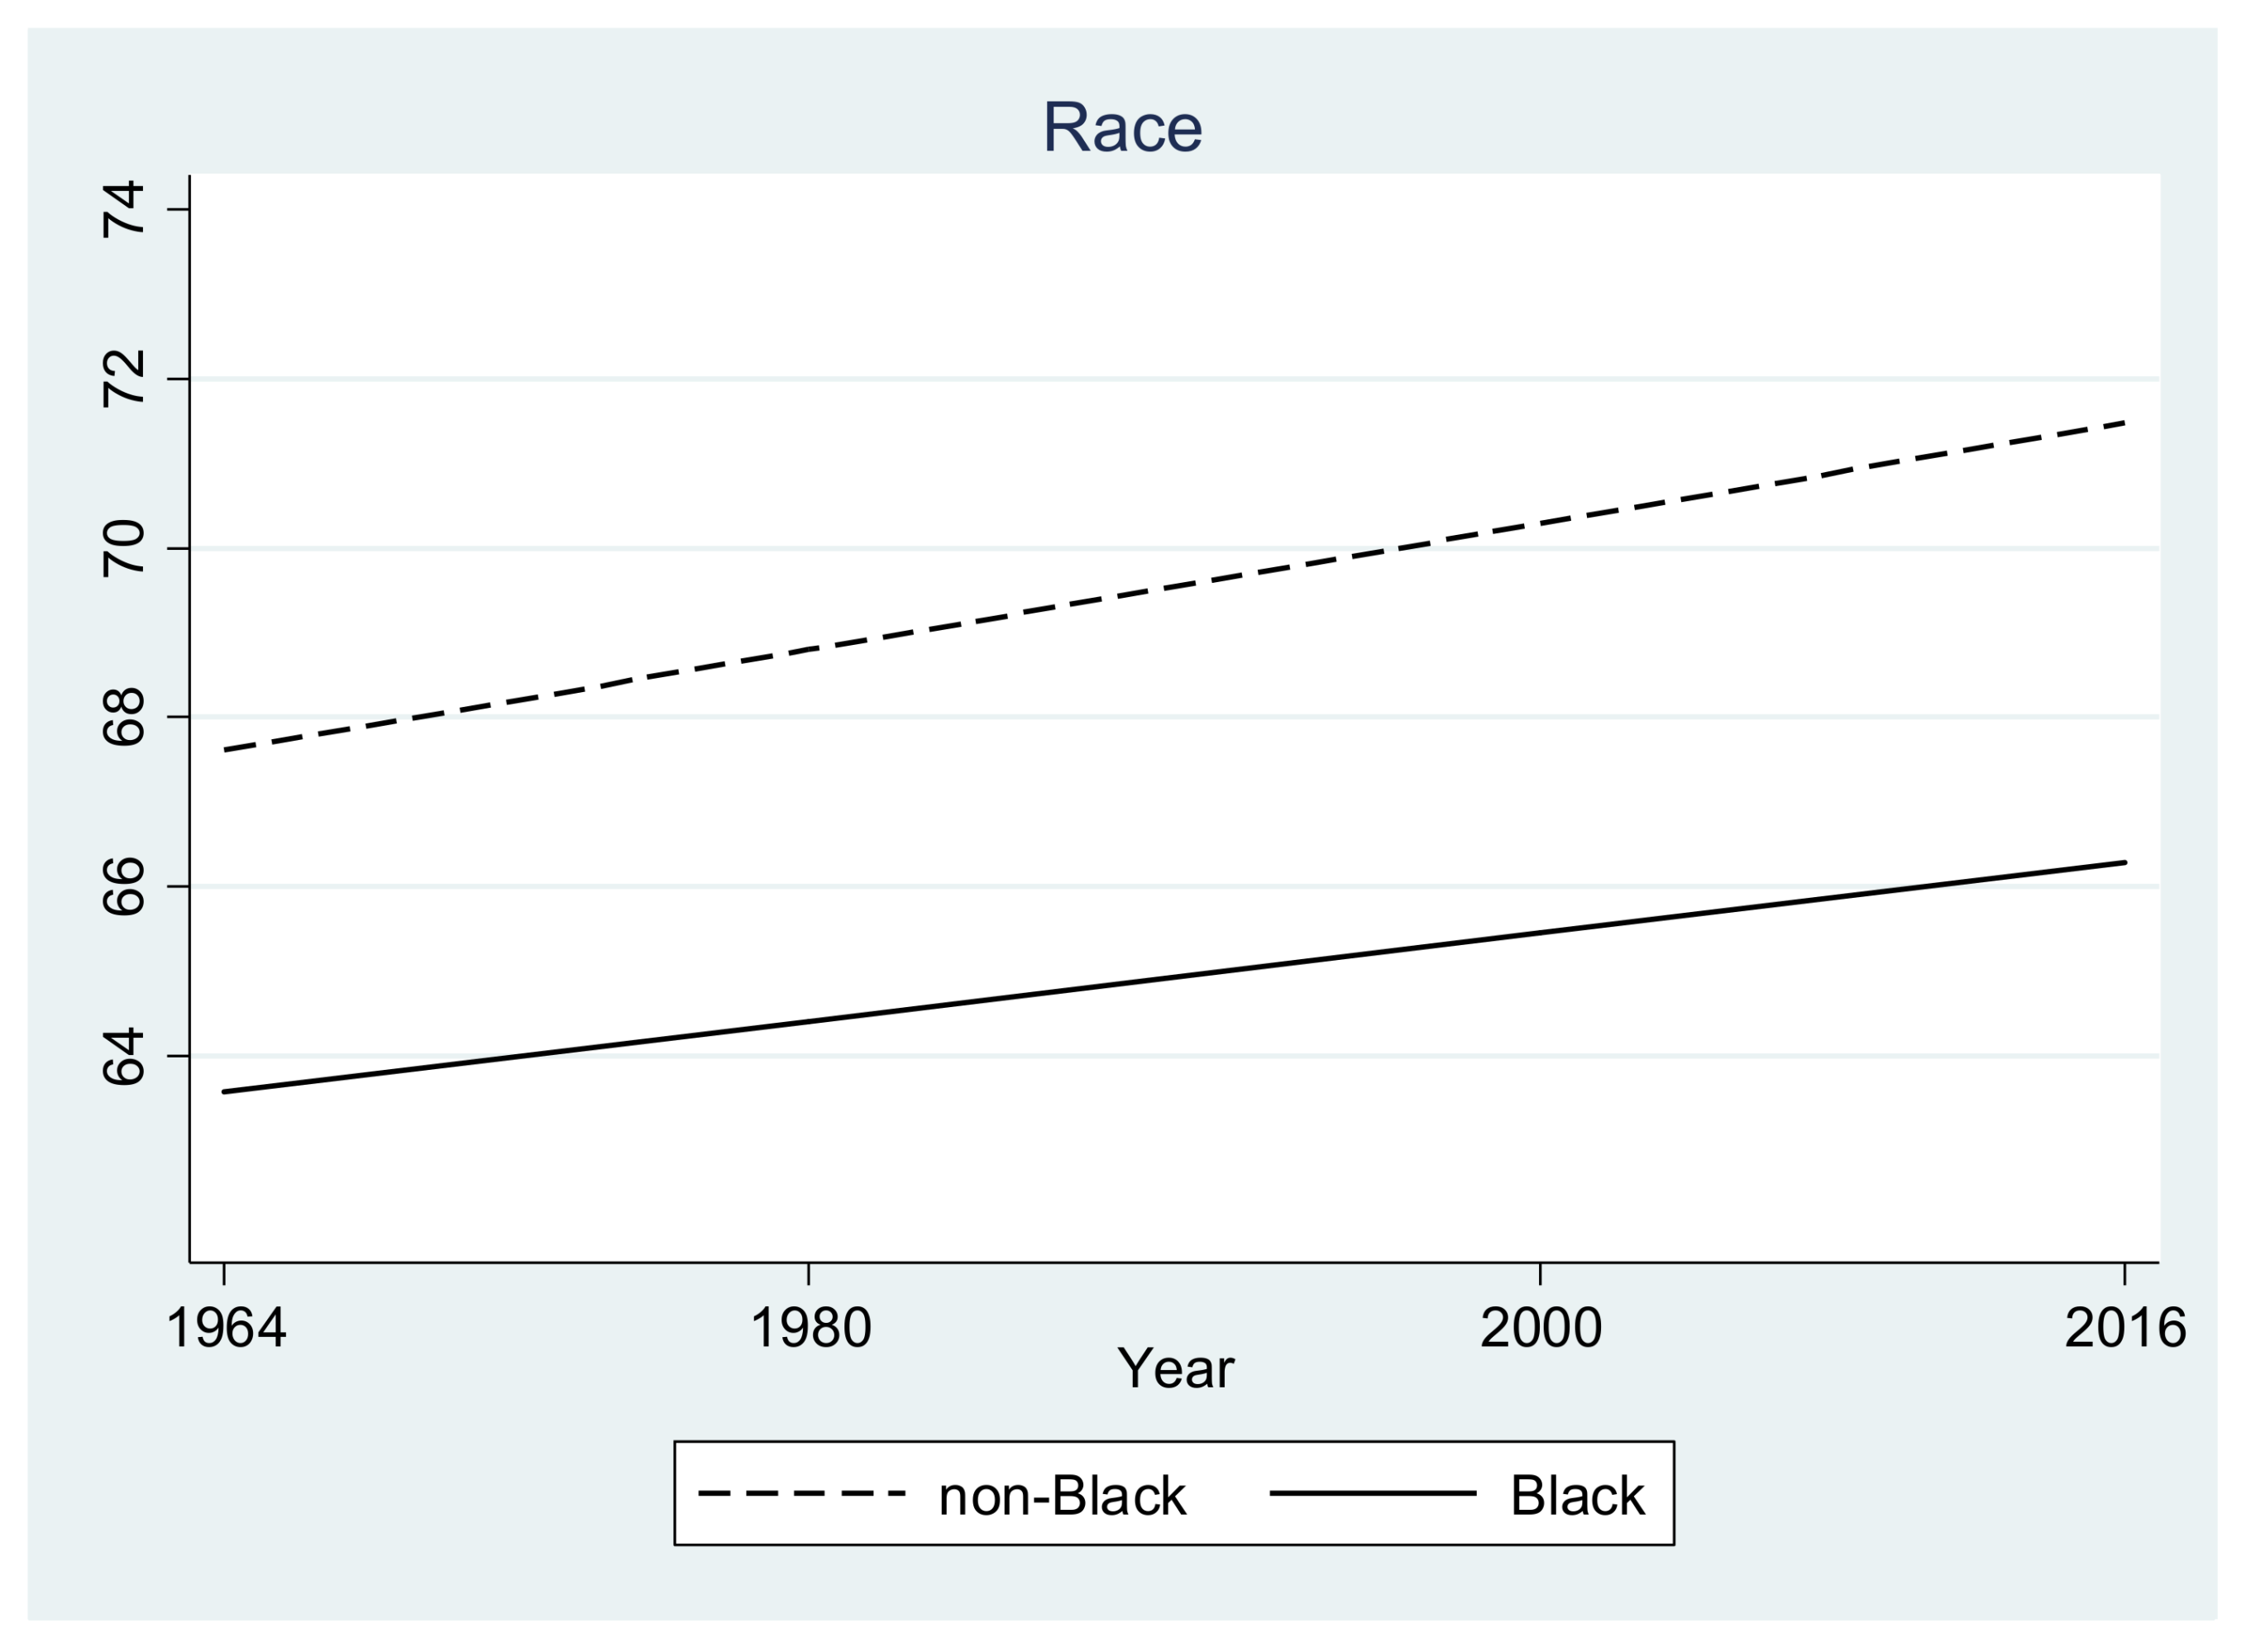
Figure 3.
Impact of party identification on the Jewish feeling thermometer, 1964–2016. Based on results from Table 3. Source: American National Election Studies, 1964–2016.
Figure 3.
Impact of party identification on the Jewish feeling thermometer, 1964–2016. Based on results from Table 3. Source: American National Election Studies, 1964–2016.

Figure 4.
Impact of education on the Jewish feeling thermometer, 1964–2016. Based on results from Table 3. Source: American National Election Studies, 1964–2016.
Figure 4.
Impact of education on the Jewish feeling thermometer, 1964–2016. Based on results from Table 3. Source: American National Election Studies, 1964–2016.

Figure 5.
Impact of age on the Jewish feeling thermometer, 1964–2016. Based on results from Table 3. Source: American National Election Studies, 1964–2016.
Figure 5.
Impact of age on the Jewish feeling thermometer, 1964–2016. Based on results from Table 3. Source: American National Election Studies, 1964–2016.

Figure 6.
Impact of gender on the Jewish feeling thermometer, 1964–2016. Based on results from Table 3. Source: American National Election Studies, 1964–2016.
Figure 6.
Impact of gender on the Jewish feeling thermometer, 1964–2016. Based on results from Table 3. Source: American National Election Studies, 1964–2016.

Figure 7.
Impact of religion on the Jewish feeling thermometer, 1964–2016. Based on results from Table 3. Source: American National Election Studies, 1964–2016.
Figure 7.
Impact of religion on the Jewish feeling thermometer, 1964–2016. Based on results from Table 3. Source: American National Election Studies, 1964–2016.


Table 1.
Trends in Jewish feeling thermometer ratings based on the American National Election Studies (ANES), 1964–2016.
Table 1.
Trends in Jewish feeling thermometer ratings based on the American National Election Studies (ANES), 1964–2016.
| Year | Mean | Standard Deviation | Median |
|---|---|---|---|
| 1964 | 62.39 | 20.99 | 60 |
| 1966 | 65.00 | 21.14 | 60 |
| 1968 | 64.79 | 21.42 | 60 |
| 1972 | 74.77 | 21.63 | 70 |
| 1976 | 67.29 | 23.79 | 60 |
| 1988 | 69.37 | 22.67 | 70 |
| 1992 | 68.84 | 20.78 | 70 |
| 2000 | 72.62 | 22.08 | 70 |
| 2002 | 67.87 | 22.55 | 65 |
| 2004 | 71.35 | 21.17 | 70 |
| 2008 | 68.69 | 20.81 | 70 |
| 2016 | 70.46 | 21.59 | 70 |
| All Years | 69.05 | 22.03 | 70 |
Table 2.
Impact of demographics and time on Jewish thermometer ratings, ANES 1964–2016.
| VARIABLES | (1) | (2) | (3) | (4) |
|---|---|---|---|---|
| Time | 0.07 *** | 0.05 *** | 0.07 *** | |
| (0.01) | (0.01) | (0.01) | ||
| Black | 2.86 *** | 2.69 *** | −4.64 *** | |
| (0.56) | (0.56) | (0.48) | ||
| Party ID (1 = SD, 7 = SR) | −0.19 * | −0.21 ** | 0.08 | |
| (0.08) | (0.08) | (0.06) | ||
| Education | 1.42 *** | 1.11 *** | 1.10 *** | |
| (0.17) | (0.18) | (0.14) | ||
| Age | 0.12 *** | 0.12 *** | 0.07 *** | |
| (0.01) | (0.01) | (0.01) | ||
| Female | 2.59 *** | 2.61 *** | 0.45 | |
| (0.32) | (0.32) | (0.24) | ||
| Catholic | 2.68 *** | 2.68 *** | 1.76 *** | |
| (0.37) | (0.37) | (0.27) | ||
| Black Thermometer | 0.46 *** | |||
| (0.01) | ||||
| White Thermometer | 0.33 *** | |||
| (0.01) | ||||
| Constant | 67.24 *** | 58.04 *** | 57.72 *** | 3.54 *** |
| (0.27) | (0.79) | (0.78) | (0.82) | |
| Observations | 23,800 | 23,108 | 23,108 | 23,059 |
| R2 | 0.00 | 0.02 | 0.02 | 0.42 |
| Adjusted R2 | 0.00289 | 0.0180 | 0.0194 | 0.416 |
| F | 57.66 | 57.92 | 58.37 | 1453 |
Robust standard errors in parentheses. *** p < 0.001; ** p < 0.01; * p < 0.05.
Table 3.
Impact of demographics, time, and their interaction on Jewish thermometer ratings, ANES 1964–2016.
Table 3.
Impact of demographics, time, and their interaction on Jewish thermometer ratings, ANES 1964–2016.
| VARIABLES | (1) | (2) | (3) | (4) | (5) | (6) |
|---|---|---|---|---|---|---|
| Time | 0.07 *** | 0.07 *** | 0.11 *** | 0.03 | 0.08 *** | 0.10 *** |
| (0.01) | (0.02) | (0.02) | (0.02) | (0.01) | (0.01) | |
| Black | −4.01 *** | −4.64 *** | −4.65 *** | −4.66 *** | −4.65 *** | −4.62 *** |
| (0.88) | (0.48) | (0.48) | (0.48) | (0.48) | (0.48) | |
| Party ID (1 = SD, 7 = SR) | 0.08 | 0.05 | 0.07 | 0.08 | 0.08 | 0.10 |
| (0.06) | (0.11) | (0.06) | (0.06) | (0.06) | (0.06) | |
| Education | 1.10 *** | 1.10 *** | 1.47 *** | 1.06 *** | 1.10 *** | 1.11 *** |
| (0.14) | (0.14) | (0.23) | (0.14) | (0.14) | (0.14) | |
| Age | 0.07 *** | 0.07 *** | 0.07 *** | 0.04 ** | 0.07 *** | 0.07 *** |
| (0.01) | (0.01) | (0.01) | (0.01) | (0.01) | (0.01) | |
| Female | 0.45 | 0.45 | 0.46 | 0.44 | 0.76 | 0.46 |
| (0.24) | (0.24) | (0.24) | (0.24) | (0.44) | (0.24) | |
| Catholic | 1.75 *** | 1.75 *** | 1.75 *** | 1.72 *** | 1.75 *** | 4.82 *** |
| (0.27) | (0.27) | (0.27) | (0.27) | (0.27) | (0.49) | |
| Black Thermometer | 0.46 *** | 0.46 *** | 0.46 *** | 0.46 *** | 0.46 *** | 0.46 *** |
| (0.01) | (0.01) | (0.01) | (0.01) | (0.01) | (0.01) | |
| White Thermometer | 0.33 *** | 0.33 *** | 0.33 *** | 0.33 *** | 0.33 *** | 0.33 *** |
| (0.01) | (0.01) | (0.01) | (0.01) | (0.01) | (0.01) | |
| Time x Black | −0.02 | |||||
| (0.03) | ||||||
| Time x Party ID | 0.00 | |||||
| (0.00) | ||||||
| Time x Education | −0.01 * | |||||
| (0.01) | ||||||
| Time x Age | 0.001 * | |||||
| (0.00) | ||||||
| Time x Female | −0.01 | |||||
| (0.02) | ||||||
| Time x Catholic | −0.12 *** | |||||
| (0.02) | ||||||
| Constant | 3.47 *** | 3.66 *** | 2.58 ** | 4.79 *** | 3.36 *** | 2.62 ** |
| (0.83) | (0.87) | (0.97) | (0.98) | (0.84) | (0.83) | |
| Observations | 23,059 | 23,059 | 23,059 | 23,059 | 23,059 | 23,059 |
| R2 | 0.42 | 0.42 | 0.42 | 0.42 | 0.42 | 0.42 |
| Adjusted R2 | 0.416 | 0.416 | 0.416 | 0.417 | 0.416 | 0.418 |
| F | 1310 | 1308 | 1308 | 1308 | 1308 | 1316 |
Robust standard errors in parentheses, *** p < 0.001, ** p < 0.01, * p < 0.05.
Table 4.
Impact of demographics, time, and their interaction in a single equation on Jewish thermometer ratings, ANES 1964–2016.
Table 4.
Impact of demographics, time, and their interaction in a single equation on Jewish thermometer ratings, ANES 1964–2016.
| VARIABLES | (1) |
|---|---|
| Time | 0.08 ** |
| (0.03) | |
| Black | −4.93 *** |
| (1.33) | |
| Party ID (1 = SD, 7 = SR) | 0.17 |
| (0.11) | |
| Education | 1.00 *** |
| (0.14) | |
| Age | 0.05 *** |
| (0.01) | |
| Female | 0.77 |
| (0.44) | |
| Catholic | 4.91 *** |
| (0.49) | |
| Black Thermometer | 0.46 *** |
| (0.01) | |
| White Thermometer | 0.33 *** |
| (0.01) | |
| Time x Black | −0.06 * |
| (0.03) | |
| Time x Party ID | 0.00 |
| (0.00) | |
| Time x Education | 0.87 * |
| (0.53) | |
| Time x Age | 0.001 * |
| (0.00) | |
| Time x Female | −0.01 |
| (0.02) | |
| Time x Catholic | −0.12 *** |
| (0.02) | |
| Constant | 3.26 ** |
| (1.06) | |
| Observations | 23,059 |
| R2 | 0.42 |
| Adjusted R2 | 0.418 |
| F | 886.1 |
Robust standard errors in parentheses. *** p < 0.001; ** p < 0.01; * p < 0.05.
Table 5.
Impact of Hispanic versus Catholic on the Jewish thermometer rating, 2016 ANES.
| VARIABLES | (1) |
|---|---|
| Black | −7.04 *** |
| (1.72) | |
| Party ID (1 = SD, 7 = SR) | 0.13 |
| (0.20) | |
| Education | 1.51 ** |
| (0.50) | |
| Age | 0.11 *** |
| (0.02) | |
| Female | 2.54 ** |
| (0.84) | |
| Catholic | 0.36 |
| (1.13) | |
| Black Thermometer | 0.36 *** |
| (0.03) | |
| White Thermometer | 0.10 *** |
| (0.03) | |
| Hispanic | 1.73 |
| (1.92) | |
| Catholic x Hispanic | −3.50 |
| (2.82) | |
| Constant | 28.12 *** |
| (2.92) | |
| Observations | 3295 |
| R2 | 0.18 |
| Adjusted R2 | 0.179 |
| F | 45.60 |
Robust standard errors in parentheses. *** p < 0.001; ** p < 0.01; * p < 0.05.
© 2018 by the author. Licensee MDPI, Basel, Switzerland. This article is an open access article distributed under the terms and conditions of the Creative Commons Attribution (CC BY) license (http://creativecommons.org/licenses/by/4.0/).
Share and Cite
MDPI and ACS Style
Cohen, J.E. From Antisemitism to Philosemitism? Trends in American Attitudes toward Jews from 1964 to 2016. Religions 2018, 9, 107. https://doi.org/10.3390/rel9040107
AMA Style
Cohen JE. From Antisemitism to Philosemitism? Trends in American Attitudes toward Jews from 1964 to 2016. Religions. 2018; 9(4):107. https://doi.org/10.3390/rel9040107
Chicago/Turabian StyleCohen, Jeffrey E. 2018. "From Antisemitism to Philosemitism? Trends in American Attitudes toward Jews from 1964 to 2016" Religions 9, no. 4: 107. https://doi.org/10.3390/rel9040107
Note that from the first issue of 2016, this journal uses article numbers instead of page numbers. See further details here.