
Geotechnical Approach to Early-Stage Site Characterisation of Shallow Wave Energy Sites


1
School of Civil Engineering, The University of Queensland, Brisbane, QLD 4072, Australia
2
Blue Economy CRC, Australian Maritime College, University of Tasmania, Swanson Building, Launceston, TAS 7250, Australia
3
Wave Swell Energy Ltd., Hawthorne East, VIC 3123, Australia
*
Author to whom correspondence should be addressed.
J. Mar. Sci. Eng. 2021, 9(6), 605; https://doi.org/10.3390/jmse9060605
Submission received: 5 May 2021
/
Revised: 28 May 2021
/
Accepted: 29 May 2021
/
Published: 31 May 2021
(This article belongs to the Special Issue Understanding Impacts of Marine Renewable Energy Structures on Nearshore Dynamics and/or the Environment)
Abstract
:Marine renewable energy is still in its infancy and poses serious challenges due to the harsh marine conditions encountered for wave or tidal installations and the survivability of devices. Geophysical and hydrodynamic initial site surveys need to be able to provide repeatable, reliable, and economical solutions. An oscillating water column wave energy converter is to be installed on the west coast of King Island, Tasmania. The location is in a high-energy nearshore environment to take advantage of sustained shoaling non-breaking waves of the Southern Ocean and required site-specific information for the deployment. We provide insight into scalable geophysical site surveys capable of capturing large amounts of data within a short time frame. This data was incorporated into a site suitability model, utilising seabed slope, sediment depth, and water depth to provide the terrain analysis needed to match deployment-specific characteristics. In addition, short-term hydrology and geotechnical work found a highly energetic seabed (near seafloor water velocities <1 m/s) with sufficient bearing capacity (6 MPa). In a highly energetic environment, care was taken to collect the relevant data needed for an assessment of critical information to an emerging technology companies primary project. This is in addition to the malleable methodology for a site suitability model that can incorporate various weighted parameters to prioritise the location for shallow wave energy sites in general.
1. Introduction
Renewable power generation has increased steadily year on year with 70% of the net addition to global power generation in 2017 [1] and accounts for 33% of the world’s total installed power generating capacity in 2018 [2]. Yet, ocean energy conversion from wave or tidal generation has remained stagnant with no new capacity added over 2017 [1] and only 2 MW added in 2018 as mostly pilot projects [2]. Nonetheless, estimates suggest ocean energy could contribute 11% of Australia’s energy needs by 2050 [3]. This lack of present-day contribution can largely be attributed to the “challenges associated with extracting energy from what can be a harsh marine environment” [4]. However, investment and development in the blue economy and the highest energy density among all renewable energies present opportunities to a current niche industry.
As ocean renewable energy companies seek to locate the best areas for deployments, often multiple sites will need to be assessed. Therefore, the evaluations required need to be cost-effective, particularly when introducing new technologies and tenuous funding arrangements [4]. Thus, early site assessments need to be economical and yet provide a robust geotechnical and hydrodynamic analysis in a dynamic ocean environment.
Large-scale modelling can determine geographic locations or regions best suited to a particular energy conversion [5] but narrowing down site-specific characteristics that are in line with a particular technology can be difficult and expensive [6]. These site assessments are typically difficult to access marine areas due to wave energy converters placed in regions with large oscillating wave potential. This requires careful planning for data collection during calm wind and wave conditions. Standards with which to guide companies are lacking with no guidance in Australia and the European Marine Energy Centre Ltd. (EMEC) providing an overview with little in the way of specifics [7], particularly geotechnical requirements.
The primary data sources for the seabed site characterisation usually include a suite of instruments: multi-beam bathymetry and backscatter, sub-bottom profiles, seabed imagery, benthic samples, and cores [6,8,9]. This is usually followed by detailed geotechnical and sediment dynamic studies to provide further information about site-specific parameters for the safe engineering of renewable marine energy installations [10]. The variety of environmental and geological conditions require experience in foundation and construction methods within a rational framework [11]. Thus, knowledge of the geological and geophysical characteristics of the seabed is critical to understanding the geotechnical conditions on which marine renewable conversion systems are anchored.
These geophysical characteristics are responsible for the seafloor or rock formations’ response to the foundation of a wave energy converter (WEC) [12]. This is the principal uncertainty and represents the primary cost to construction and maintenance of WECs and posing a serious risk to performance [13]. Site surveys are an attempt to mitigate this risk, yet typically only the top layer (<10 cm) of unconsolidated sediment is analysed [6] or even used to classify a region’s suitability [9]. The majority of published work largely pertains to the site selection criteria for offshore renewable energy platforms [14] with a larger focus on mooring systems [15] with little work pertaining to gravity-based foundations in nearshore high energy wave environments during an initial site assessment.
King Island, Tasmania (located on the western side of Bass Strait) was identified as a candidate site for deployment of an oscillating water column 1 MW wave energy converter (WEC). An initial bathymetric survey was conducted to identify potential site nearshores on the west coast of King Island. The Ettrick River mouth being used as the location for the incoming cable route for grid connection. The WEC requires a deployment depth of 8–12 m and takes advantage of the amplitude increase of shoaling waves to power a unidirectional air turbine. Once the area was identified to meet the constraints of the design, further site assessment was needed to ensure the environmental and geological conditions also suit the installation requirements for the WEC. We used a combination of an economical chirper sub-bottom acoustics and piston core samples to allow for an analysis of up to ~4–6 m of sandy sediment and 1 m of geotechnical analysis on the substrate while also ground-truthing the sub-bottom data.
This paper provides insight into a methodological approach for an early-stage seabed characterisation for which Barrie and Conway [8] suggest is a critical part of the engineering design process. The objective was to determine the geotechnical characteristics and specific deployment location in a nearshore high energy wave environment for the placement of gravity-based WECs. Additional survey methods were used to interpret the hydrodynamics and ground-truthing of piston core depths in the interpretation of acoustic sub-bottom data. Point kriging was used to minimise the variance of bedrock interpolation after careful consideration of experimental variogram models. Dive observations were also useful in discerning the in situ characteristics of the survey site. The data were then collated to produce a site-specific map of viable locations for Wave Swell Energy Ltd.’s WEC. The remainder of the paper is as follows: Section 2 describes the candidate site on the west coast of King Island and lays out the survey techniques with an emphasis on the acoustics used to penetrate the seabed; Section 3 combines our geotechnical and acoustic results with a kriging interpolation along with our examination of hydrodynamics; Section 4 discusses the implications and benefits of our low-cost survey methods before concluding with the major points in Section 5.
2. Materials and Methods
2.1. Study Site
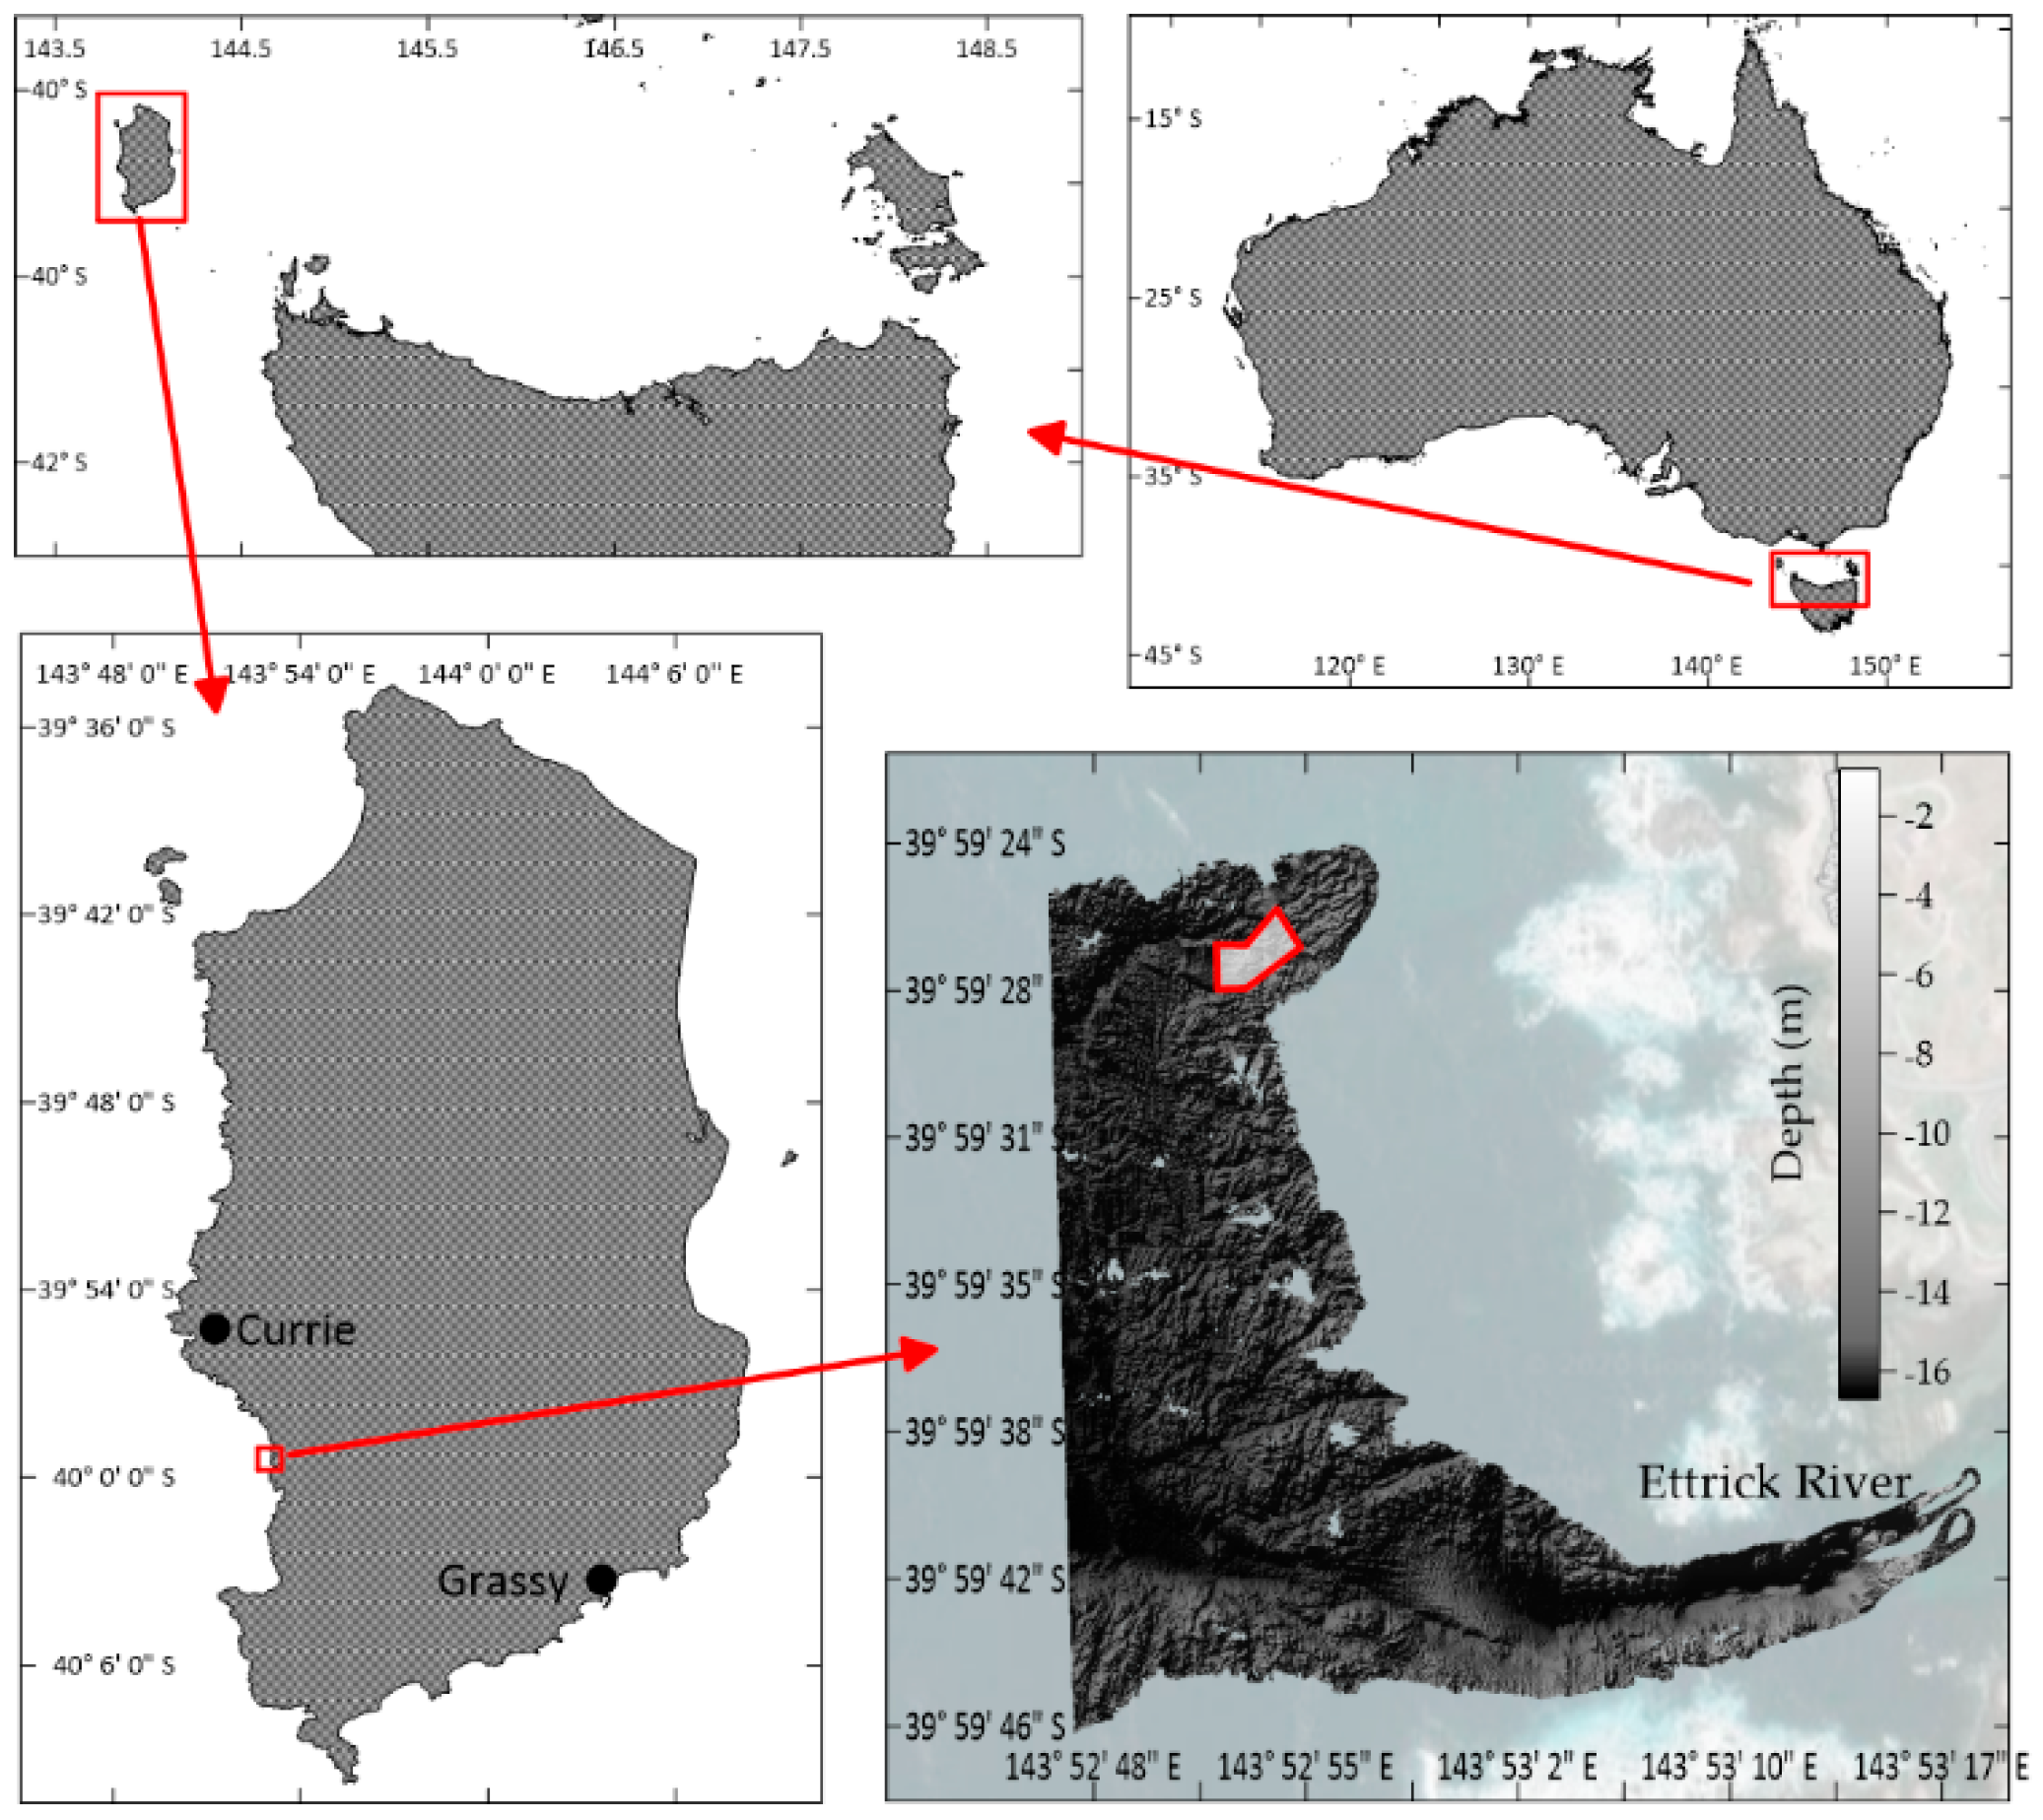
The deployment site for the WEC is the western side of King Island, Tasmania, 7.5 km south of the main township of Currie. King Island is on the western side of Bass Strait, roughly halfway from the mainland state of Victoria to the north and the main island of Tasmania to the south (Figure 1). The island has a population of approximately 1700 people and is currently powered by a hybrid system run by the King Island Renewable Energy Integration Project (KIREIP) and developed by Hydro Tasmania. This system consists of solar PV, wind farm, diesel/biodiesel generators, and is augmented by flywheel and battery storage to supply an integrated uninterrupted energy solution [16]. The geology of the island consists of mainly Proterozoic rocks and some Deconian granite [17]. The region specific to Ettrick River is composed of metasediments that are fine-grained, quartz-rich sandy turbidites, with a depositional age of 1350–1270 Ma, the oldest known rocks in Tasmania [17,18].
High wave energy potential is predominantly located on western coastlines due to prevailing westerlies and long fetch length in the southern. The estimated wave energy resource for the West Coast of King Island is 45 kW/m with an average significant wave height of ~Hs = 4 m and wave periods Tp ~10 s−14 s [19]. The Bass Strait atmospheric circulation is characterised by the progression of anticyclones moving west to east with troughs of low pressure [20] providing sustained wave energy with yields of half the median value only 10% of the time [19]. Thus, King Island has been identified as a wave climate resource to integrate into Hydro Tasmania’s hybrid power generation and as an optimal location for the prototype to be located [21]. If challenges such as extreme wave conditions can be overcome and anticipated capacity factors of >0.5 can be verified, the 1 MW prototype will allow for greater renewable energy generation and less reliance on Hydro Tasmania’s diesel generators. An initial bathymetric survey was conducted in early 2017 and identified a potential site (50 m × 50 m) in 10 m water depth near the Ettrick River mouth (Figure 1). The proposed deployment site is located between two rocky reefs which at its narrowest is 54 m. Between the reefs is a sandy trough with sporadic boulders oriented in a roughly NE to SW direction, providing a highly dynamic region that could funnel wave energy into the deployment site.
2.2. Survey Methods
The primary activities were to deploy the field logging equipment, undertake sediment coring dives, video transects (diver and towed), and sub-bottom acoustic profiling. After the initial video survey, the instrument array frame was deployed and secured (weights) to the seabed between Monday (3 April 2017) and Wednesday (5 April 2017) near the southern reef (143°52′55.20″ E 39°59′27.60″ S) to capture hydrodynamic conditions at the proposed deployment location. The array consisted of a pair of HR 2 MHz Nortek Aquadopp ADCPs (upward- and downward-looking) (Acoustic Doppler Current Profiler), and 1 RBR Concerto CTD (Conductivity, Temperature, Depth) in fast sampling mode equipped with a Cyclops 7 turbidity sensor.
Core sampling was carried out with a Dormer Piston Sampler (Dormer Soil Samplers, Murwillumbah South, NSW, Australia) specifically designed to sample saturated sands. The 1.2 m core length allowed for a maximum retrieved length of 1 m and a 50 mm diameter undisturbed sample. During coring dives, a star picket was placed at a predetermined location within the survey area. The coring locations were determined from the georeferenced centre point and subsequent cores at distances of 7.5 m and 15 m at major cardinal points: north, east, south, and west. All cores where the piston sampler did not penetrate more than 0.3 m were disposed of on the seabed. Some loss of sediment was possible during the retrieval of the sampler out of the seabed and compaction can occur when extruded into the larger plastic tube. Where the piston sampler was able to penetrate 1 m into the sediment, the sediment depth was determined to be greater than what could be determined via coring alone. The depth the core sampler was able to penetrate, or refusal depth, was recorded and used against extruded cores to determine compaction and also in the acoustic interpolation as additional data points for sediment depth (Figure 2).
Geotechnical analysis was carried out on three cores to determine the following: (i) soil classification; (ii) density and void ratio, internal angle of friction and cohesion; (iii) nominal bearing capacity. Based on these samples, the strength parameters of the sand for density, stress, and water content conditions in situ were quantified. Additionally, two methods of particle size were used. The sieving test was implemented to characterise the soil and sediment characteristics of the three cores used in the geotechnical analysis, and a Malvern Mastersizer 2000 was used on additional cores for particle size at 0.05 m and 0.40–0.50 m core depth (depending on the length of core).
2.3. Acoustics
To further characterise the benthic surfaces, a series of transects were undertaken using a sub-bottom profiling system (StrataBox 3510 HD, Syqwest Inc., Cranston, RI, USA) operating at 10 kHz. Differences in acoustic impedance (sediment layering) were examined to detect surface expression of boulder and reef formations as well as determine the sand layer thickness. Transects were focused on mapping the potential placement site (as seen in Figure 1) as well as a single transect along the proposed cable route. Survey lines were determined based on bathymetry coordinates of the target survey site as well as using the buoyed droplines at the outer edges of the target area. Transects were then performed along the sand bed channel and between the reefs in a criss-cross pattern before following the cable route to the Ettrick River. A second RBR concerto CTD was used for the speed of sound casts prior to and at the conclusion of the acoustic survey.
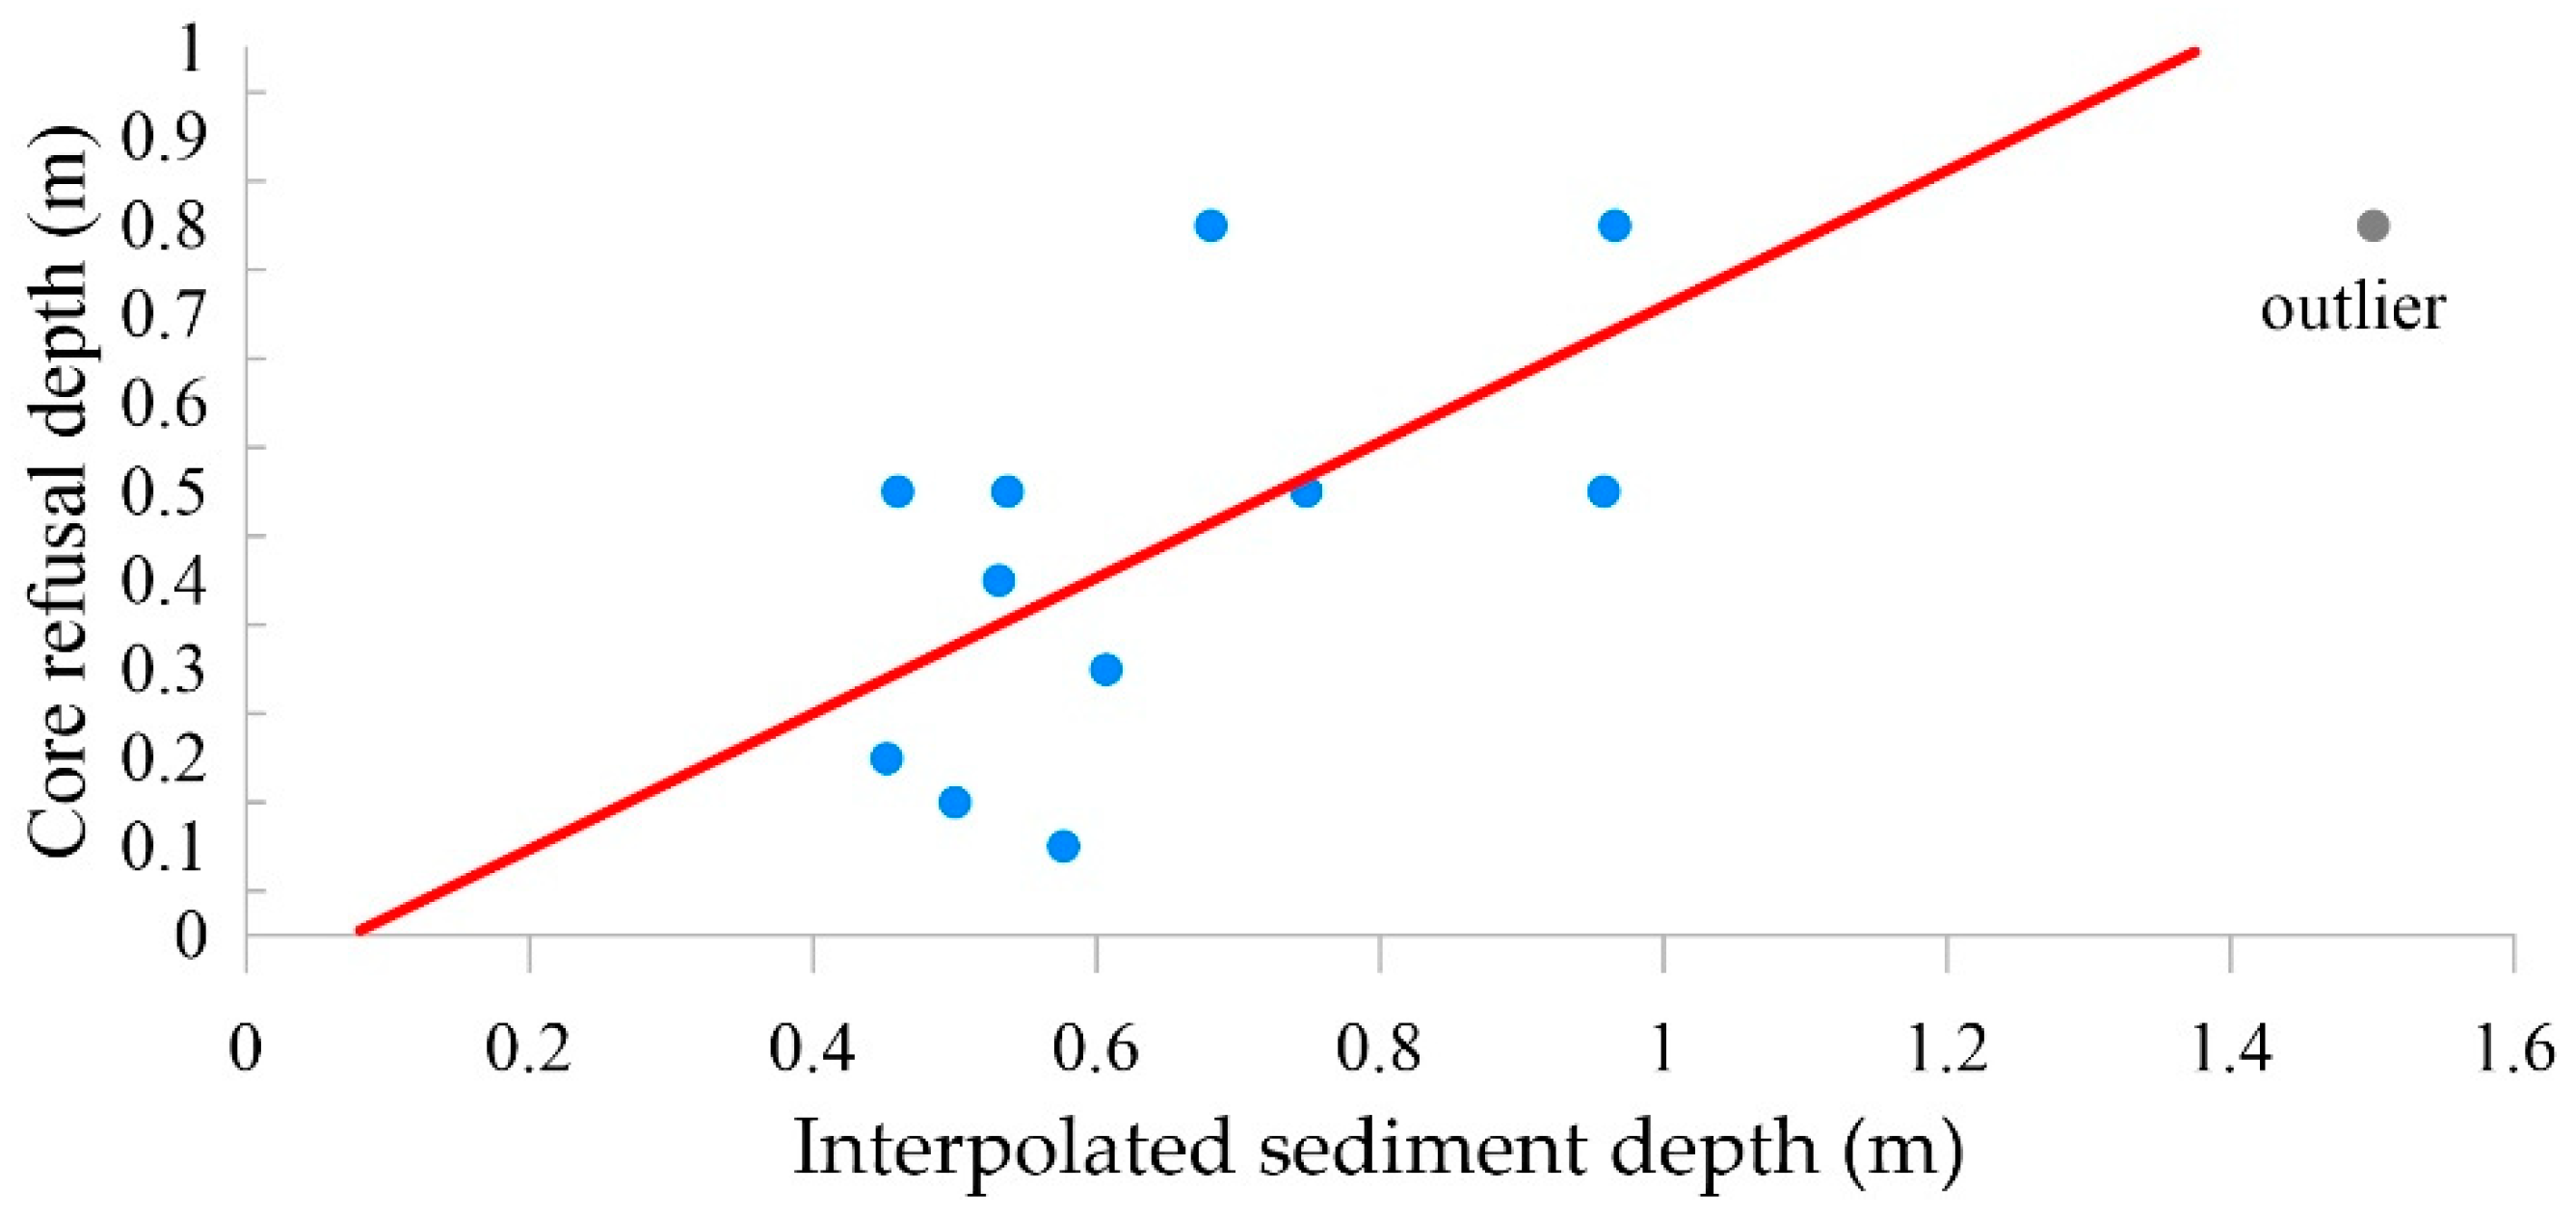
SyQwest Stratabox software v.2.45 (Syqwest Inc., Cranston, RI, USA) was used to record the acoustic return and initial interpretation. The Stratabox was set to a Bottom Gate Limit of 20 m depth in order to limit a ‘signal noise’ return via surface reverberation. Speed of sound was set later to 1510 m/s as determined by a CTD cast. Further post-processing was completed on SonarWiz v. 7.04.02 (Chesapeake Technology, Inc., Los Altos, CA, USA) with Kriging interpolation and visualisation using Golden Surfer v. 22.0.68 (Golden Software, LLC, Golden, CO, USA). Tidal data was initially taken from Seal Bay AusTides prediction. The sub-bottom acoustics was datum aligned to the previous bathymetry, eventually removing the need for wave and tidal corrections in the sub-bottom dataset. Interpretation of the results was based on several factors including in-situ diver experience, base map, backscatter information, and core sampling. This information along with a very strong single reflector under the seabed surface was used to outline the sand layer and determine its depth. Core sample information was georeferenced and implemented to show the length of the core relative to inferred stratigraphy from SBP. An initial point kriging interpolation of the rock/reef and the sand layer was performed, and interpolation depths were compared against the core refusal depths (Figure 3). The subsequent interpolation described in the following paragraph had the core sample locations and depths (12 cores that met refusal prior to 1 m depth) added to the outcomes of the acoustic analysis. Core #9 (most western core) was deemed an outlier due to the nature of the piston core extraction and acoustic data both agreeing sediment depth was deeper than core refusal depth.
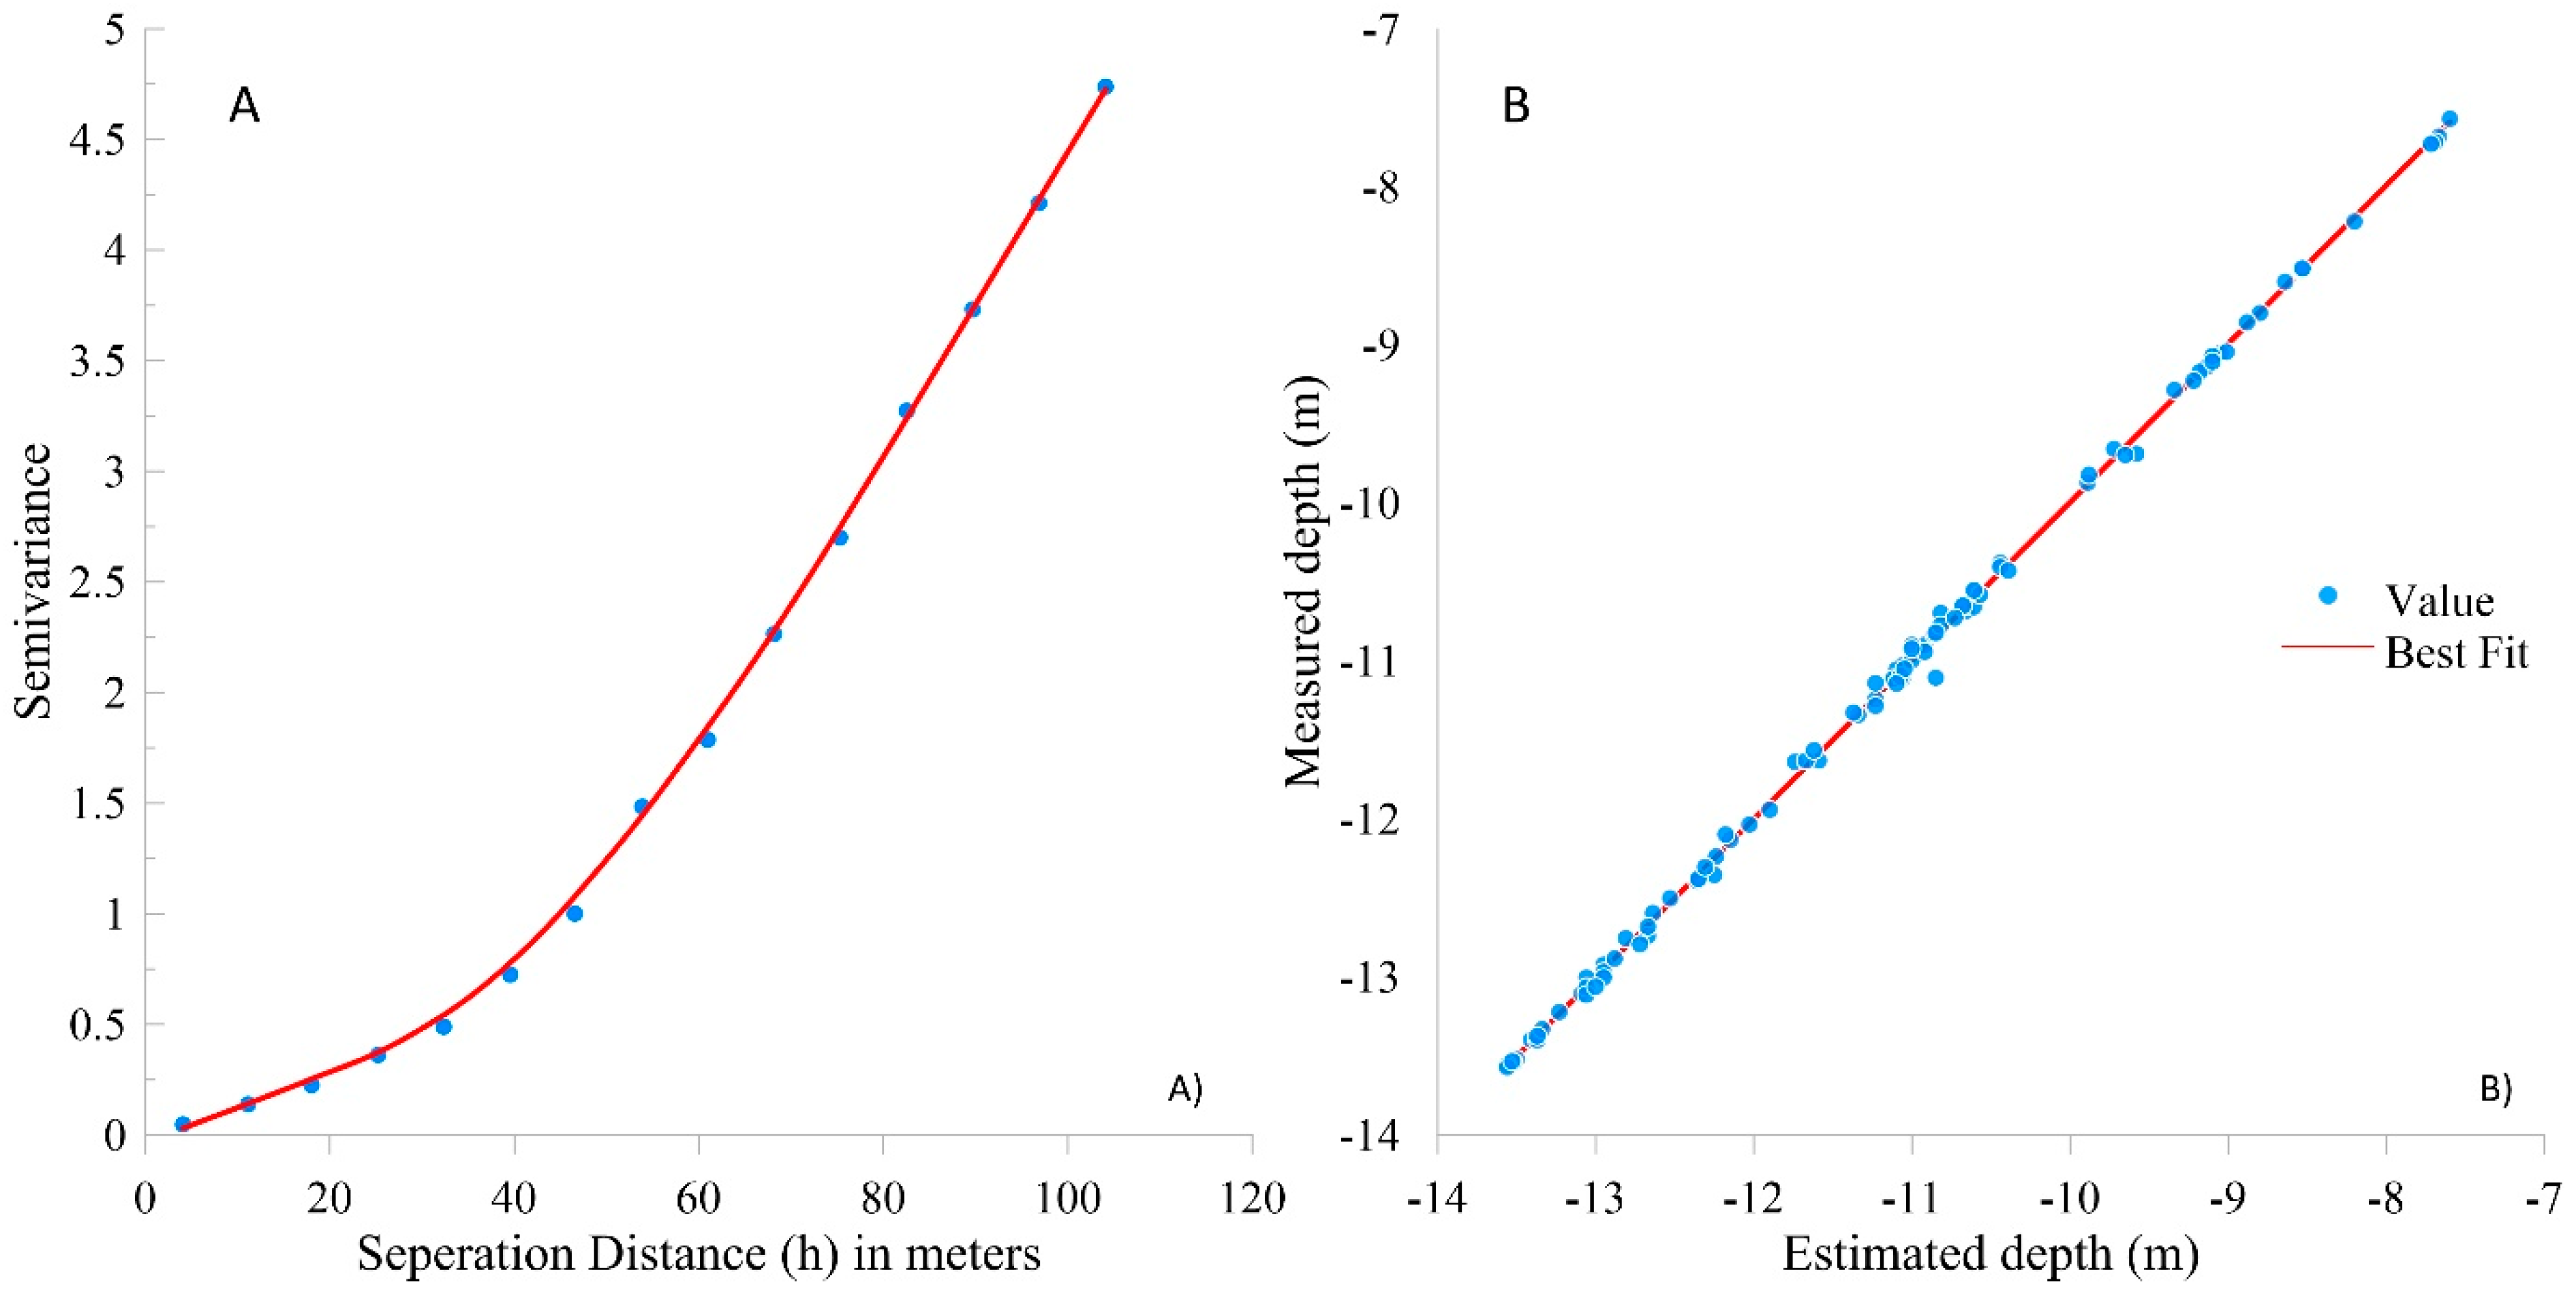
The first reflector (RF1) was indicated the seabed and the second reflector was outlined as a feature class or RF2, nominally the bedrock. In kriging modelling and creating a prediction map, two tasks are necessary: determining the dependency rules and making the predictions of the RF2 in between transects and core sample sites. The variogram model determines the first task while characterising the spatial continuity or roughness of the data set. The variogram was produced using the least squares fit criterion as discussed in Cressie [22] to minimise the sum of the squares for error. Gaussian distribution was able to best match the distribution, as seen at the top of Figure 4A. This is in lieu of Oliver and Webster [23] cautioning against its use, however, the other likely best fit (spherical) was unable to suitably define the lag distances. Using the variogram, the kriging interpolation then makes the predictions of the weights of surrounding values. Figure 4B shows the cross-validation of those estimated values against known values and validates our choice of Gaussian function. This was used in the ordinary point kriging interpolation to give weight to the data values as a function of distance to estimate the intervening values of the base reflector (RF2) between the reefs.
A site suitability model was then created; parameters for depth (8–12 m), slope (<15°), and sediment depth (≥1 m sand) were entered in order to find the preferred area according to the information provided by Wave Swell Energy ltd.
To aid interpretation of the benthic surface from sub-bottom profiling data, georeferenced video tows (ASX ActionPro-X 1080P Full HD Camera) were undertaken through the potential placement area at a low speed (<3 kt). Sections with little information about the bottom substrate were removed from the analysis.
3. Results
3.1. Core Samples and Geotechnical Analysis
In total, 25 cores were retrieved, of which three cores did not reach 300 mm (discarded) and three locations were over reef substrate. At the first coring location, the piston corer only reached a maximum of 500 mm due to boulder fields covered by a shallow layer of sand. The second coring area further west revealed a sufficient sand coverage with maximum penetration (>1000 mm) in 7 out of 13 cores (except core 9 with 800 mm). The third coring location (placed in-between the two previous sites) had an additional four cores at a 15 m distance from the picket in-between the major cardinal points. Two cores had a penetration depth of 800 mm while all others showed sufficient sediment cover of >1000 mm.
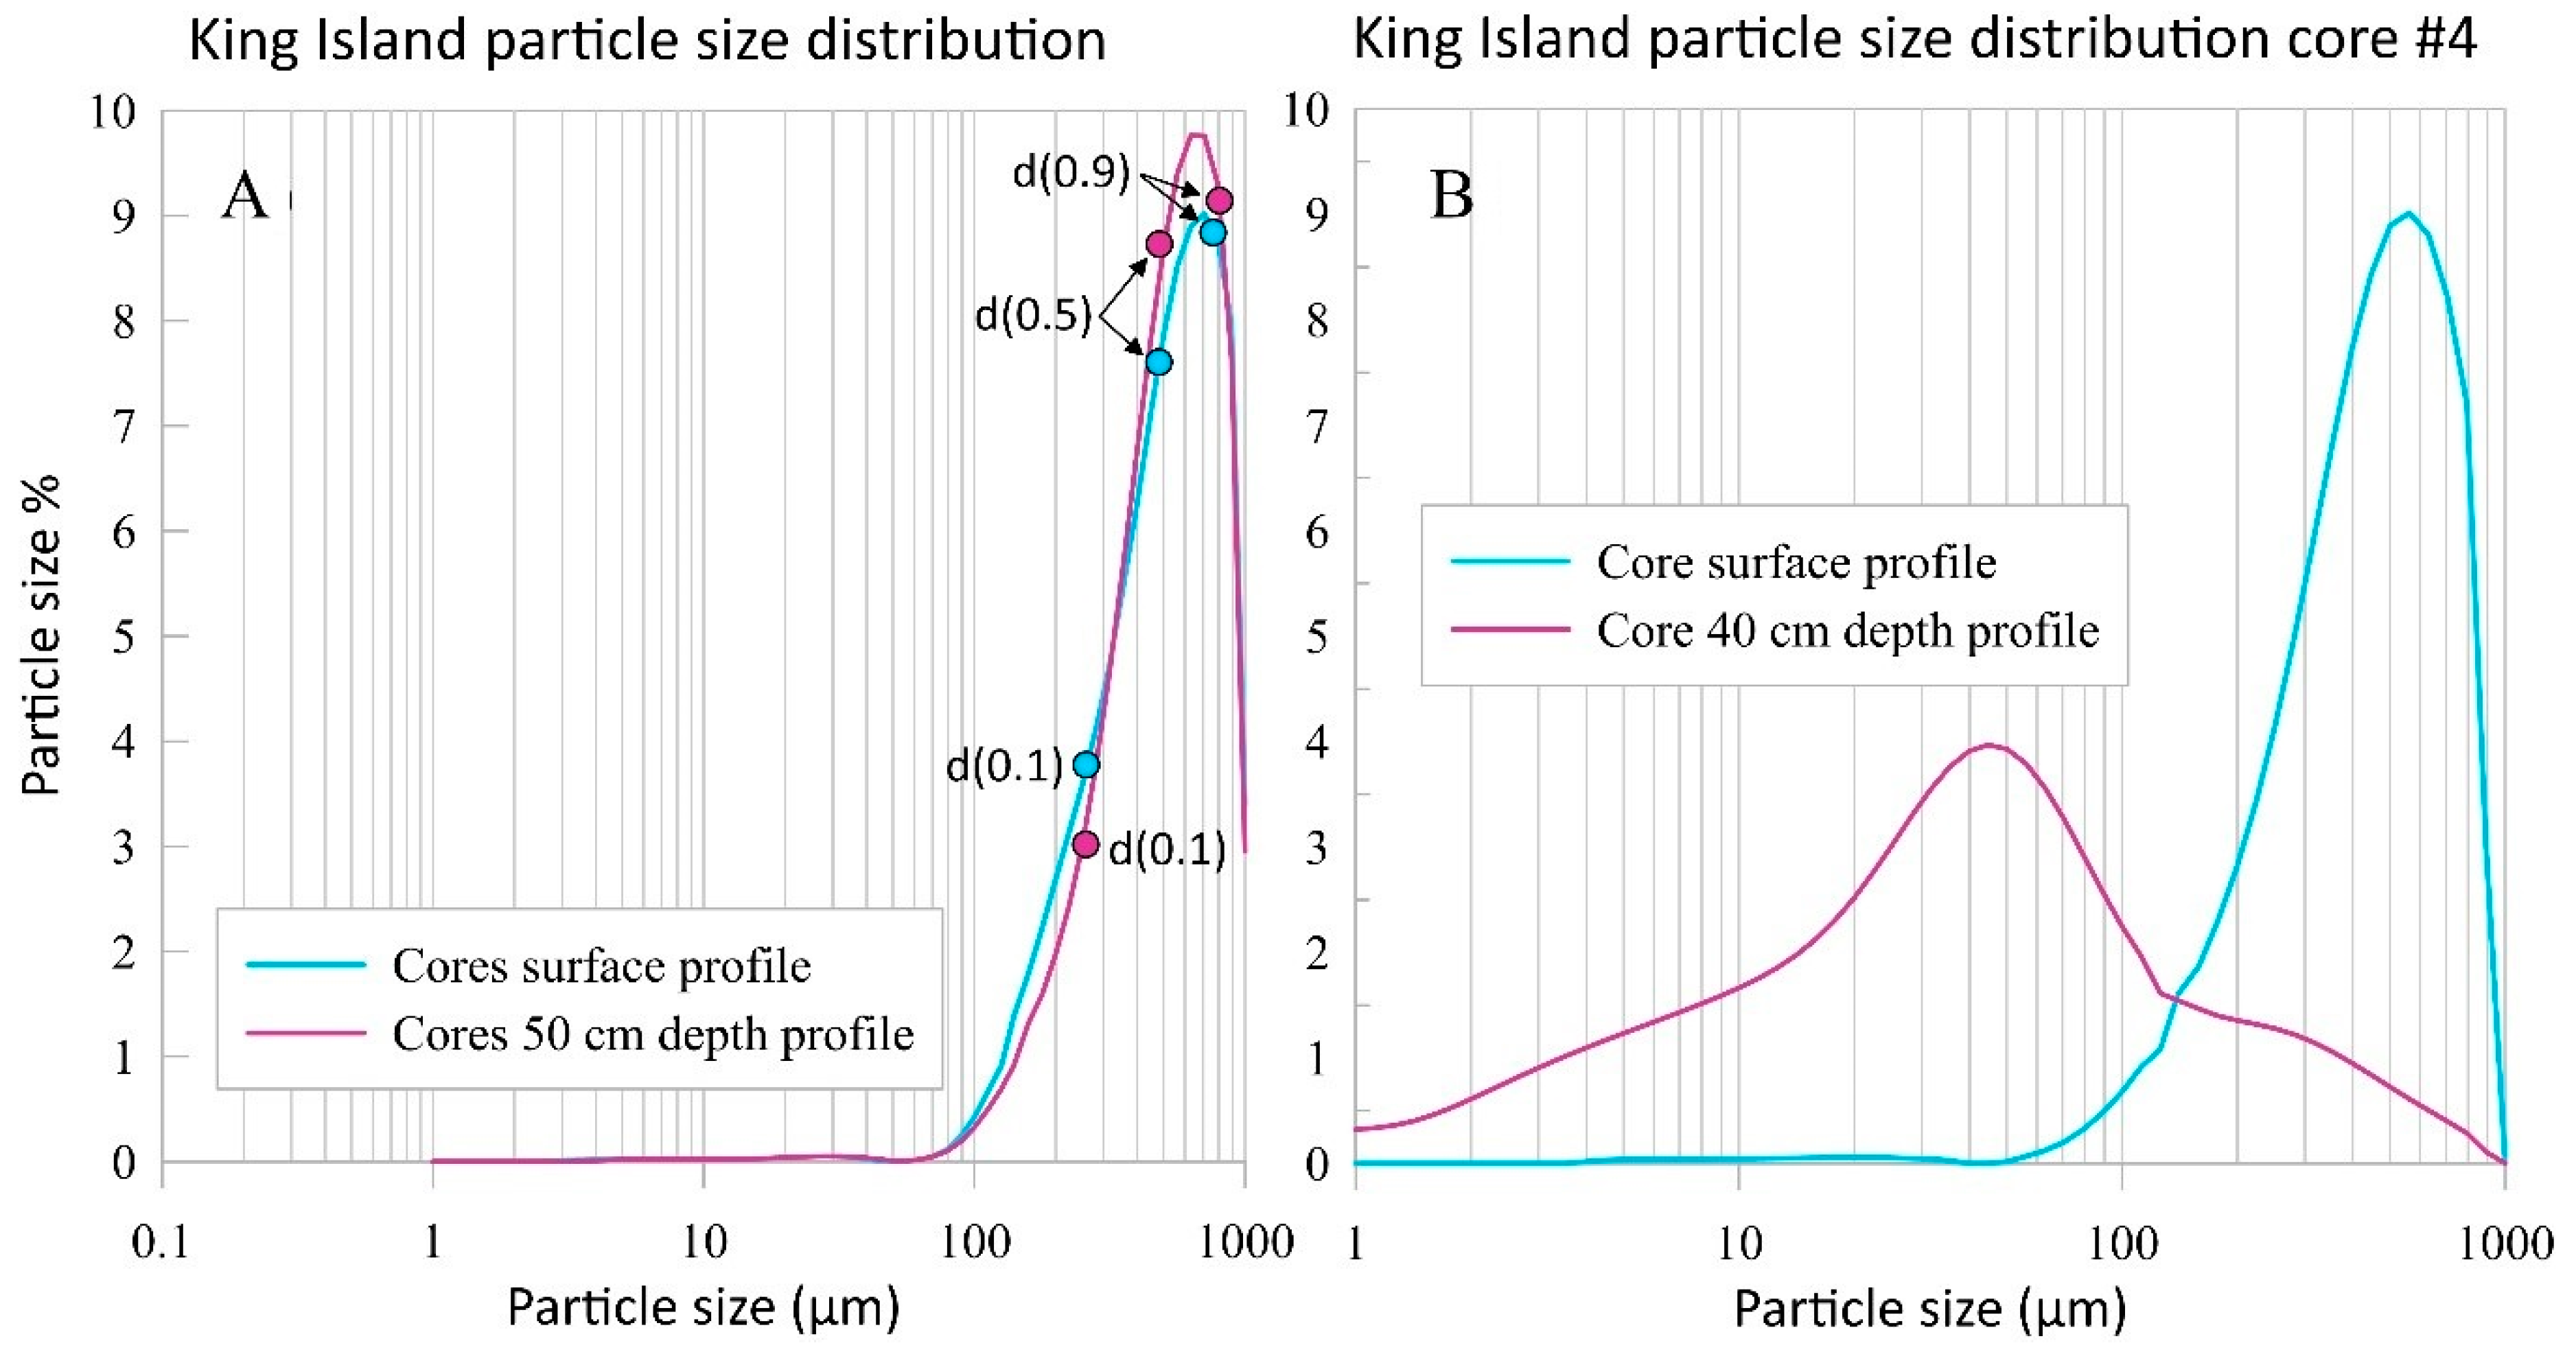
Figure 5A shows the particle size distribution averaged from ten cores samples. The sediment consists of 90% sand and 10% gravel with no fraction in the silt or clay class. The characteristic particle diameters at d10, d50, and d90 of surface sediments by percentage are 0.26 mm, 0.48 mm, and 0.75 mm, respectively. Based on these diameters, the coefficient of uniformity is Cu = 3.3 (<0.6) and the coefficient of curvature is Cc = 1.1, therefore, the sample material can be classified as poorly graded S and SP according to the Unified Soil Classification System [24]. The specific gravity of the sand was tested to be G = 2.657 kg/m3. The particle size distribution was also run on the 0.40–0.50 m depth mark; the d10, d50, and d90 by percentage are 0.25 mm, 5.0 mm, and 0.81 mm, respectively. Albeit slight, there is a difference with the sediments at depth trending to smaller particle size. The standard deviation from the surface d90 (149) and 0.50 m depth d90 (45) also show high variability in the particle size distribution at the surface of the seabed over a more uniform distribution only half a meter below. Core #4 was singled out for its dark organic matter at the base (40 cm). As noted in Figure 5B, and without treating for organics, the particle size skewed heavily towards the finer grains.
Fully drained triaxial tests were conducted with three sand samples. The corresponding Mohr circles tests define a yield surface without cohesion, and the friction angle was determined to be φ′ = 41.8°. Test 3 has verified the result of Test 1. Based on the friction angle of φ′ = 41.8°, a first simplified estimate was used to assess the bearing capacity of offshore footings [25,26]. Under the following simplified assumptions: (i) no eccentricity of the load, (ii) horizontal load is neglected, (iii) cohesion does not exist, and (iv) structure is sitting on the surface (shallow footing), the bearing capacity was calculated as
with sy = 1 − 0.4 B′/L (without eccentricity B′ = B) and with B ≈ L, we receive sy ≈ 0.6. According to Hansen and Inan [26], Nγ′ ≈ 100 for φ′ = 41.8°. With these parameters, the bearing capacity qf was calculated for a shallow footing with a width of approximately 20 m and an effective unit weight of the sediment of γ′ = 10 kN/m3 to be approximately qf = 6 MPa. If the width is reduced to 10 m due to eccentricity or loss of material under the footing, qf is reduced to qf = 3 MPa. Cyclic and dynamic loading due to wave impact or water currents were not considered. Further tests with more detailed information on the in situ conditions with regard to horizontal and cyclic load and building parameters are required for a more precise estimate of bearing capacity.
qf = Pv/BL = ½ γ′ Nγ′ B sy
3.2. Sub-Bottom Acoustics and Camera Transects/Tows
The primary acoustic survey area was successful in determining the sediment depth; whilst the survey route to Ettrick River revealed discernible depths on the N–S leg, the W–E leg towards Ettrick River continually found sediment depths beyond the resolution or penetration depth at 10 kHz into non-cohesive sandy sediment.
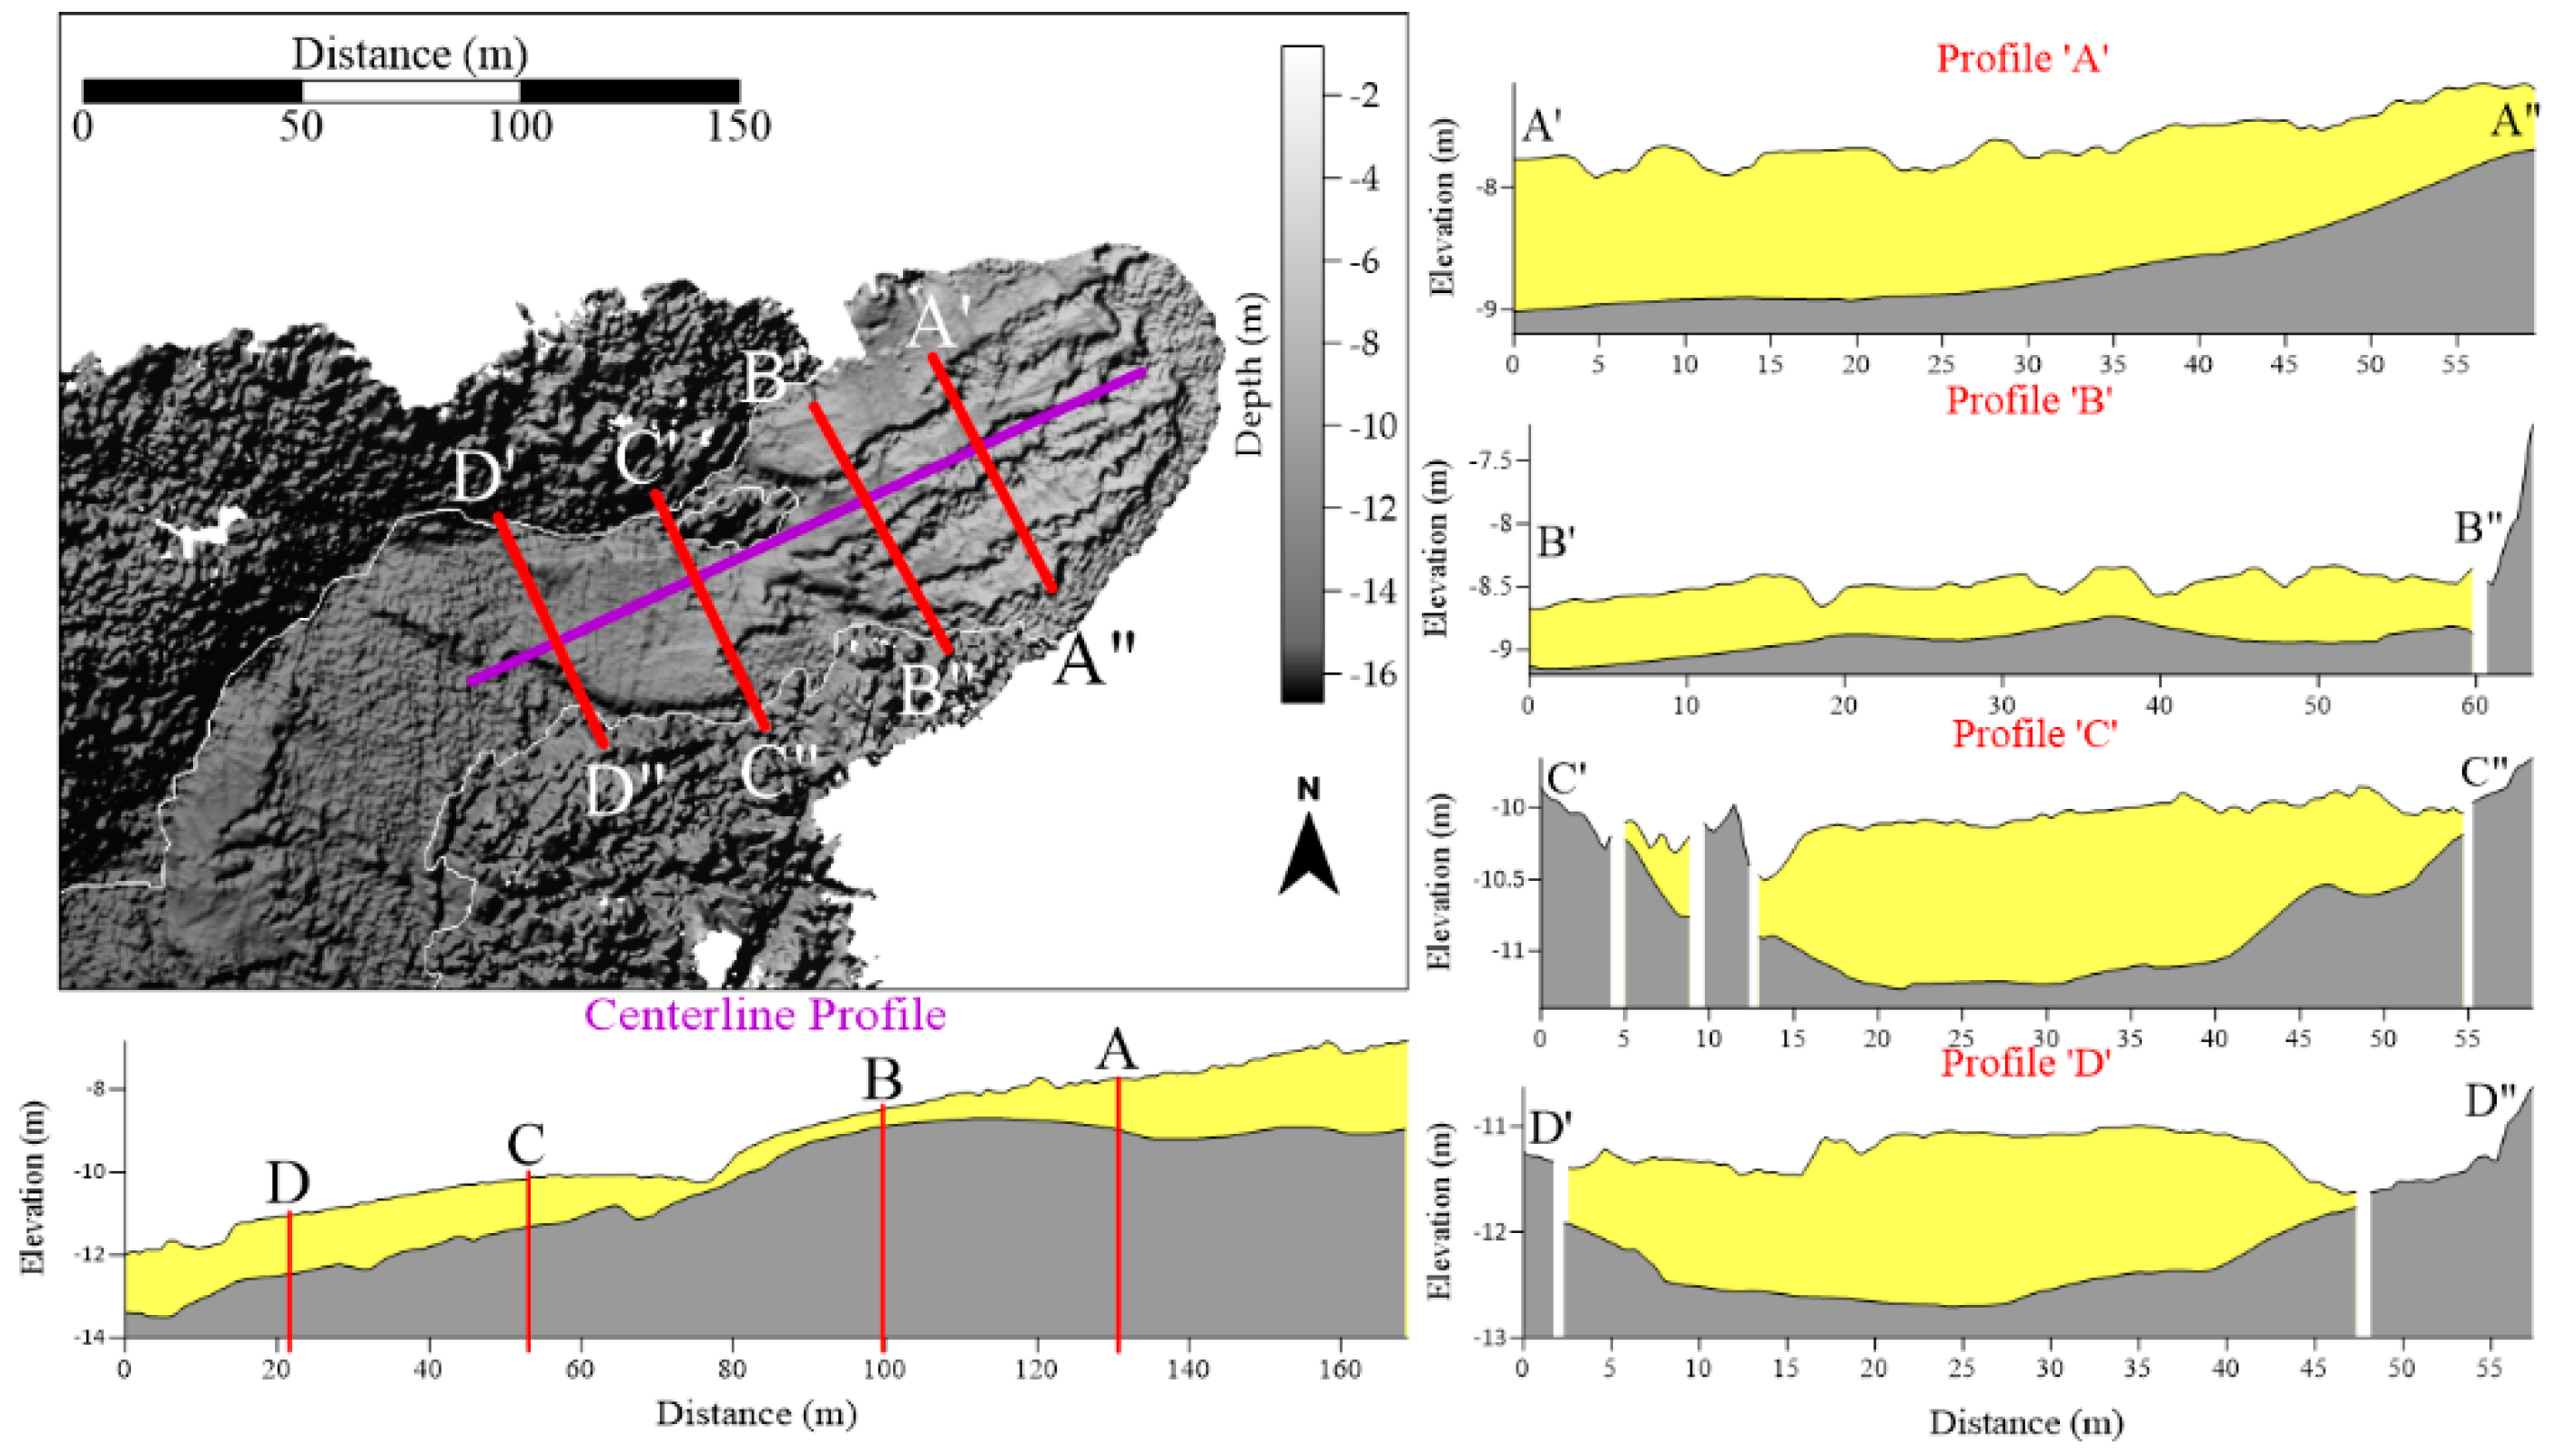
The interpolated grid of the rock/reef underneath the sand layer was then used to determine sediment depth in the target area and preference for the location of the WEC. Multiple profiles/slices of the stratigraphy were visualised (Figure 6) to aid interpretation in 2D. As detected in the core samples, the eastern side of the target area had a shallow sand layer (Figure 6B). Further up the slope had a large accumulation of sediment (Figure 6A) but too shallow water depth (<8 m). When analysing the western side of the target area, consistent sediment depths of >1 m can be found (Figure 6: Profiles C and D) in deeper waters.
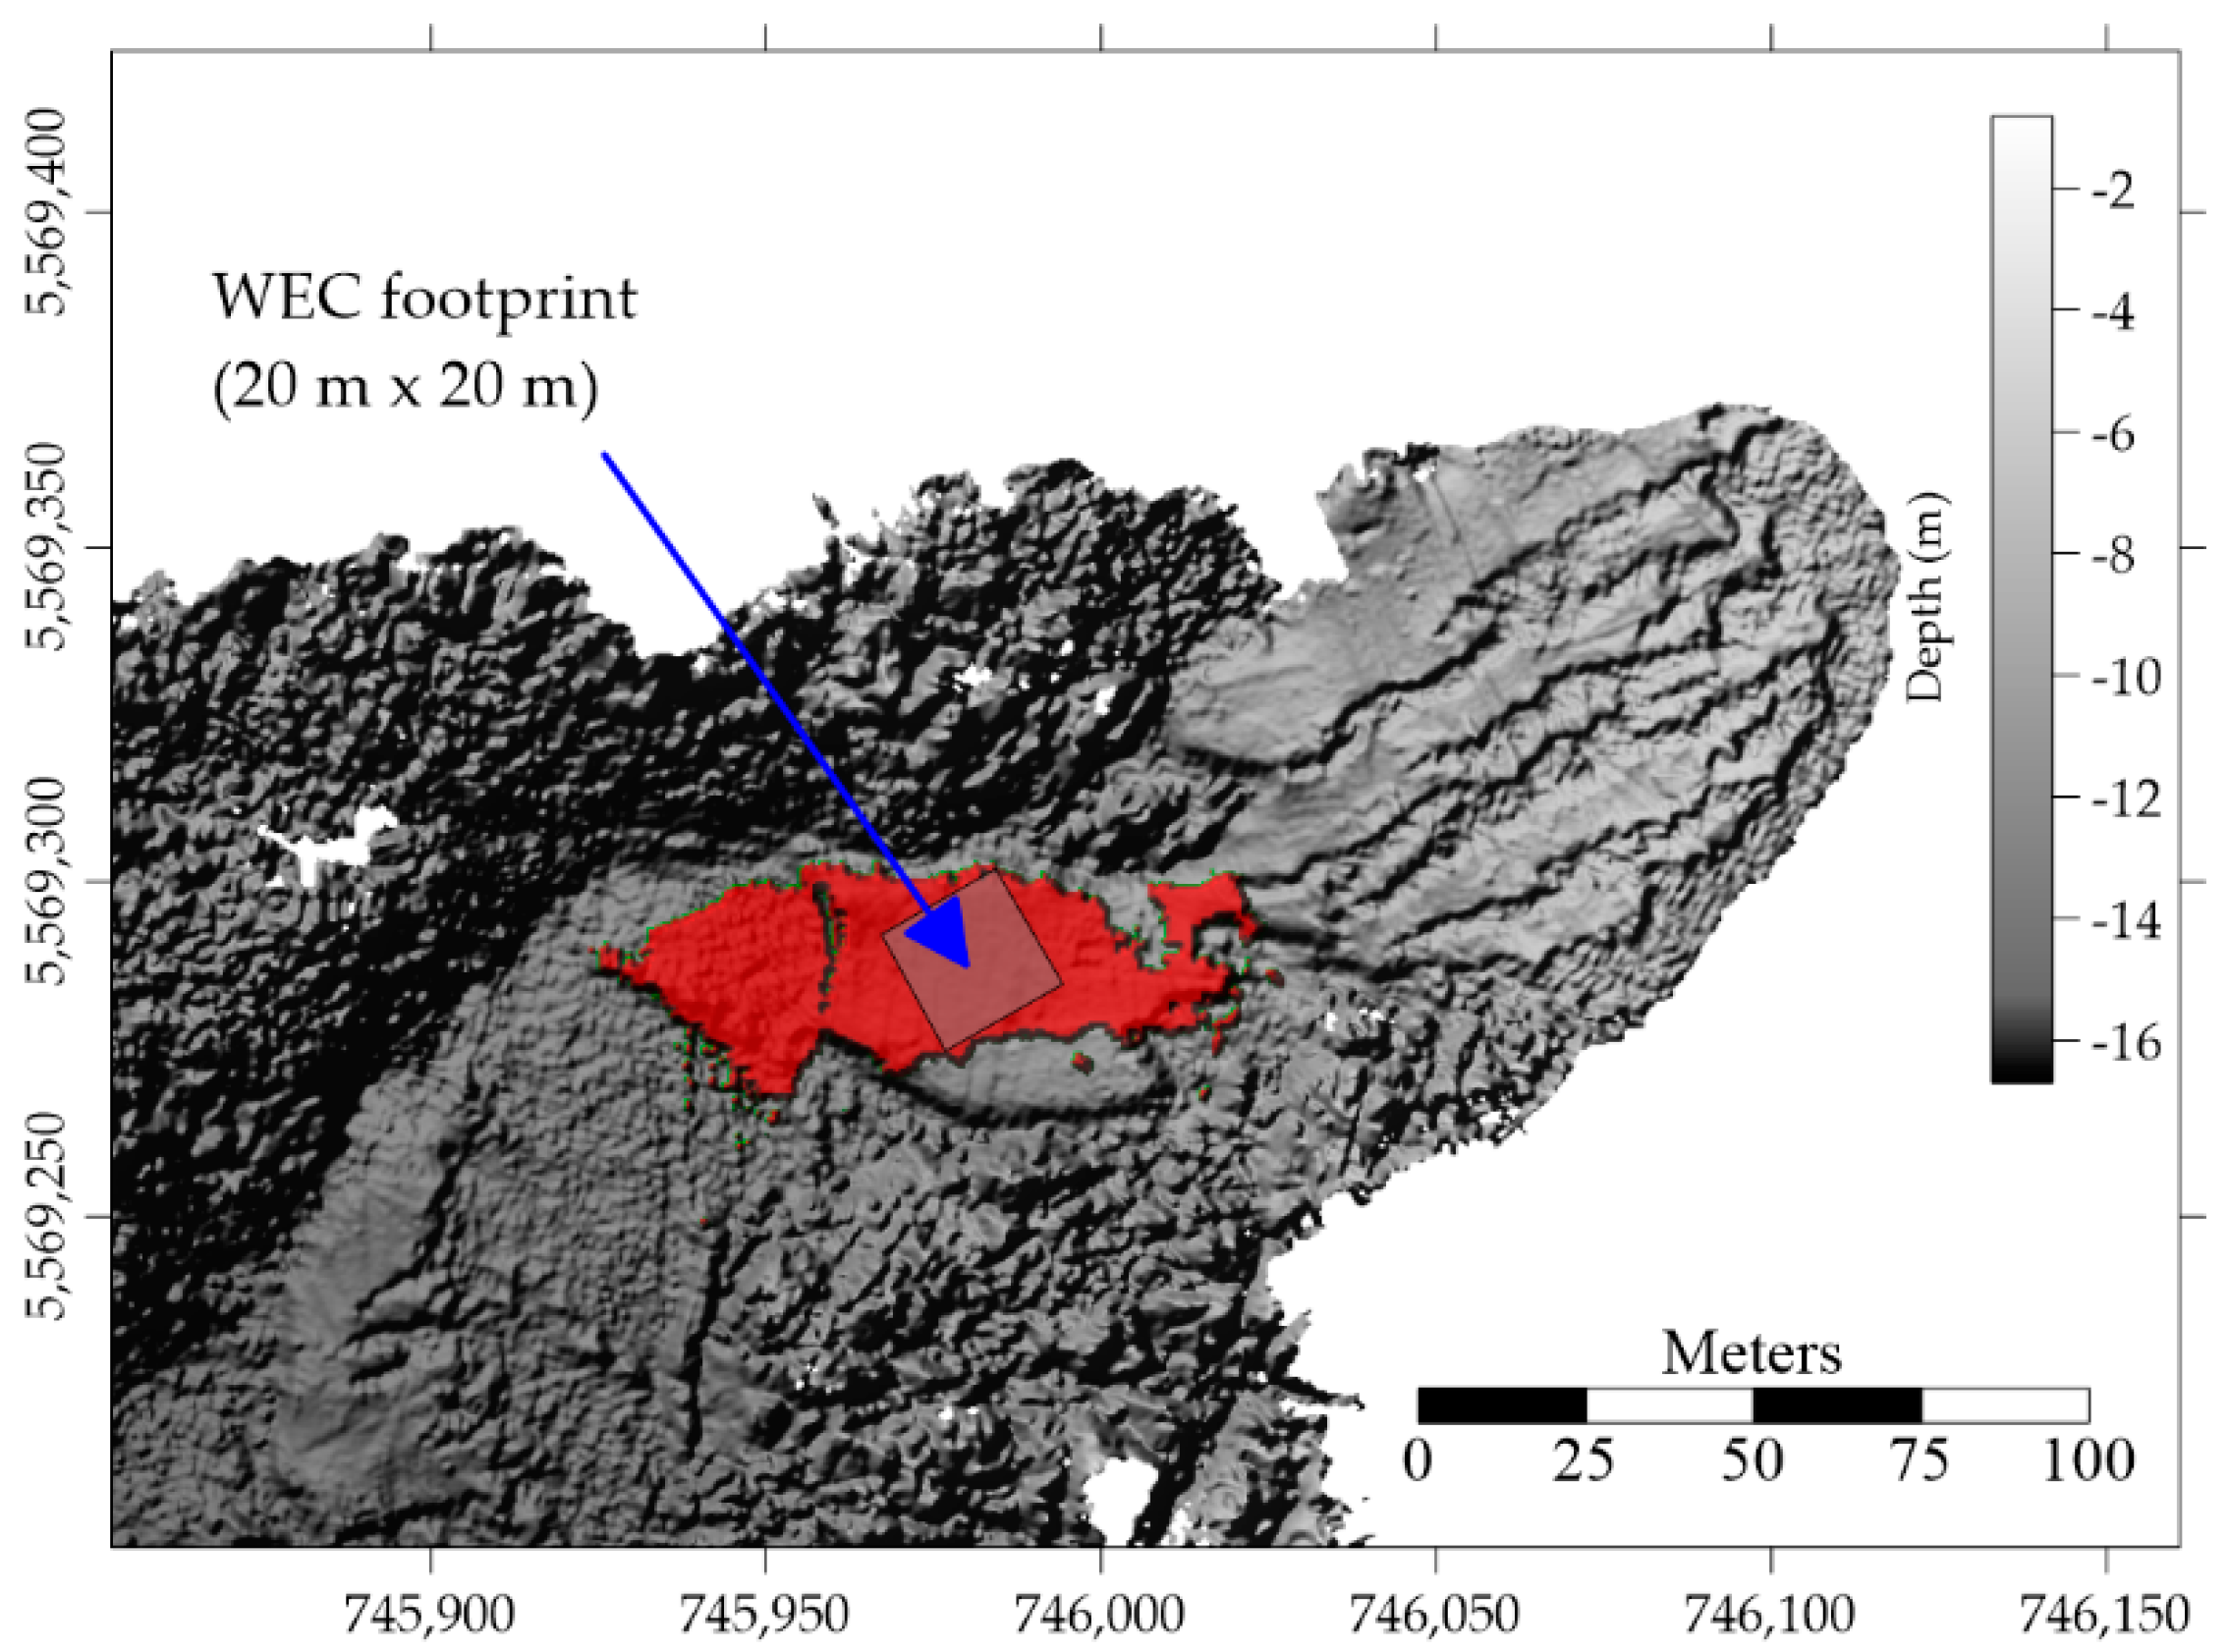
A site suitability model was created using the interpolated reflector data. Using requirements for the WEC, three main parameters (water depth, sediment thickness, slope) were input into the model and subtracted from each other. Depth was prioritised to 8 to 12 m, optimal slope under 15°, and sediment depth greater than 1 m. A representative WEC (20 m × 20 m) polygon was placed over the desired location within a depth range of −10.18 m and −10.94 m on the western survey side. The median depth was −10.53 m and the maximum slope in the polygon area was found to be 14.4°.
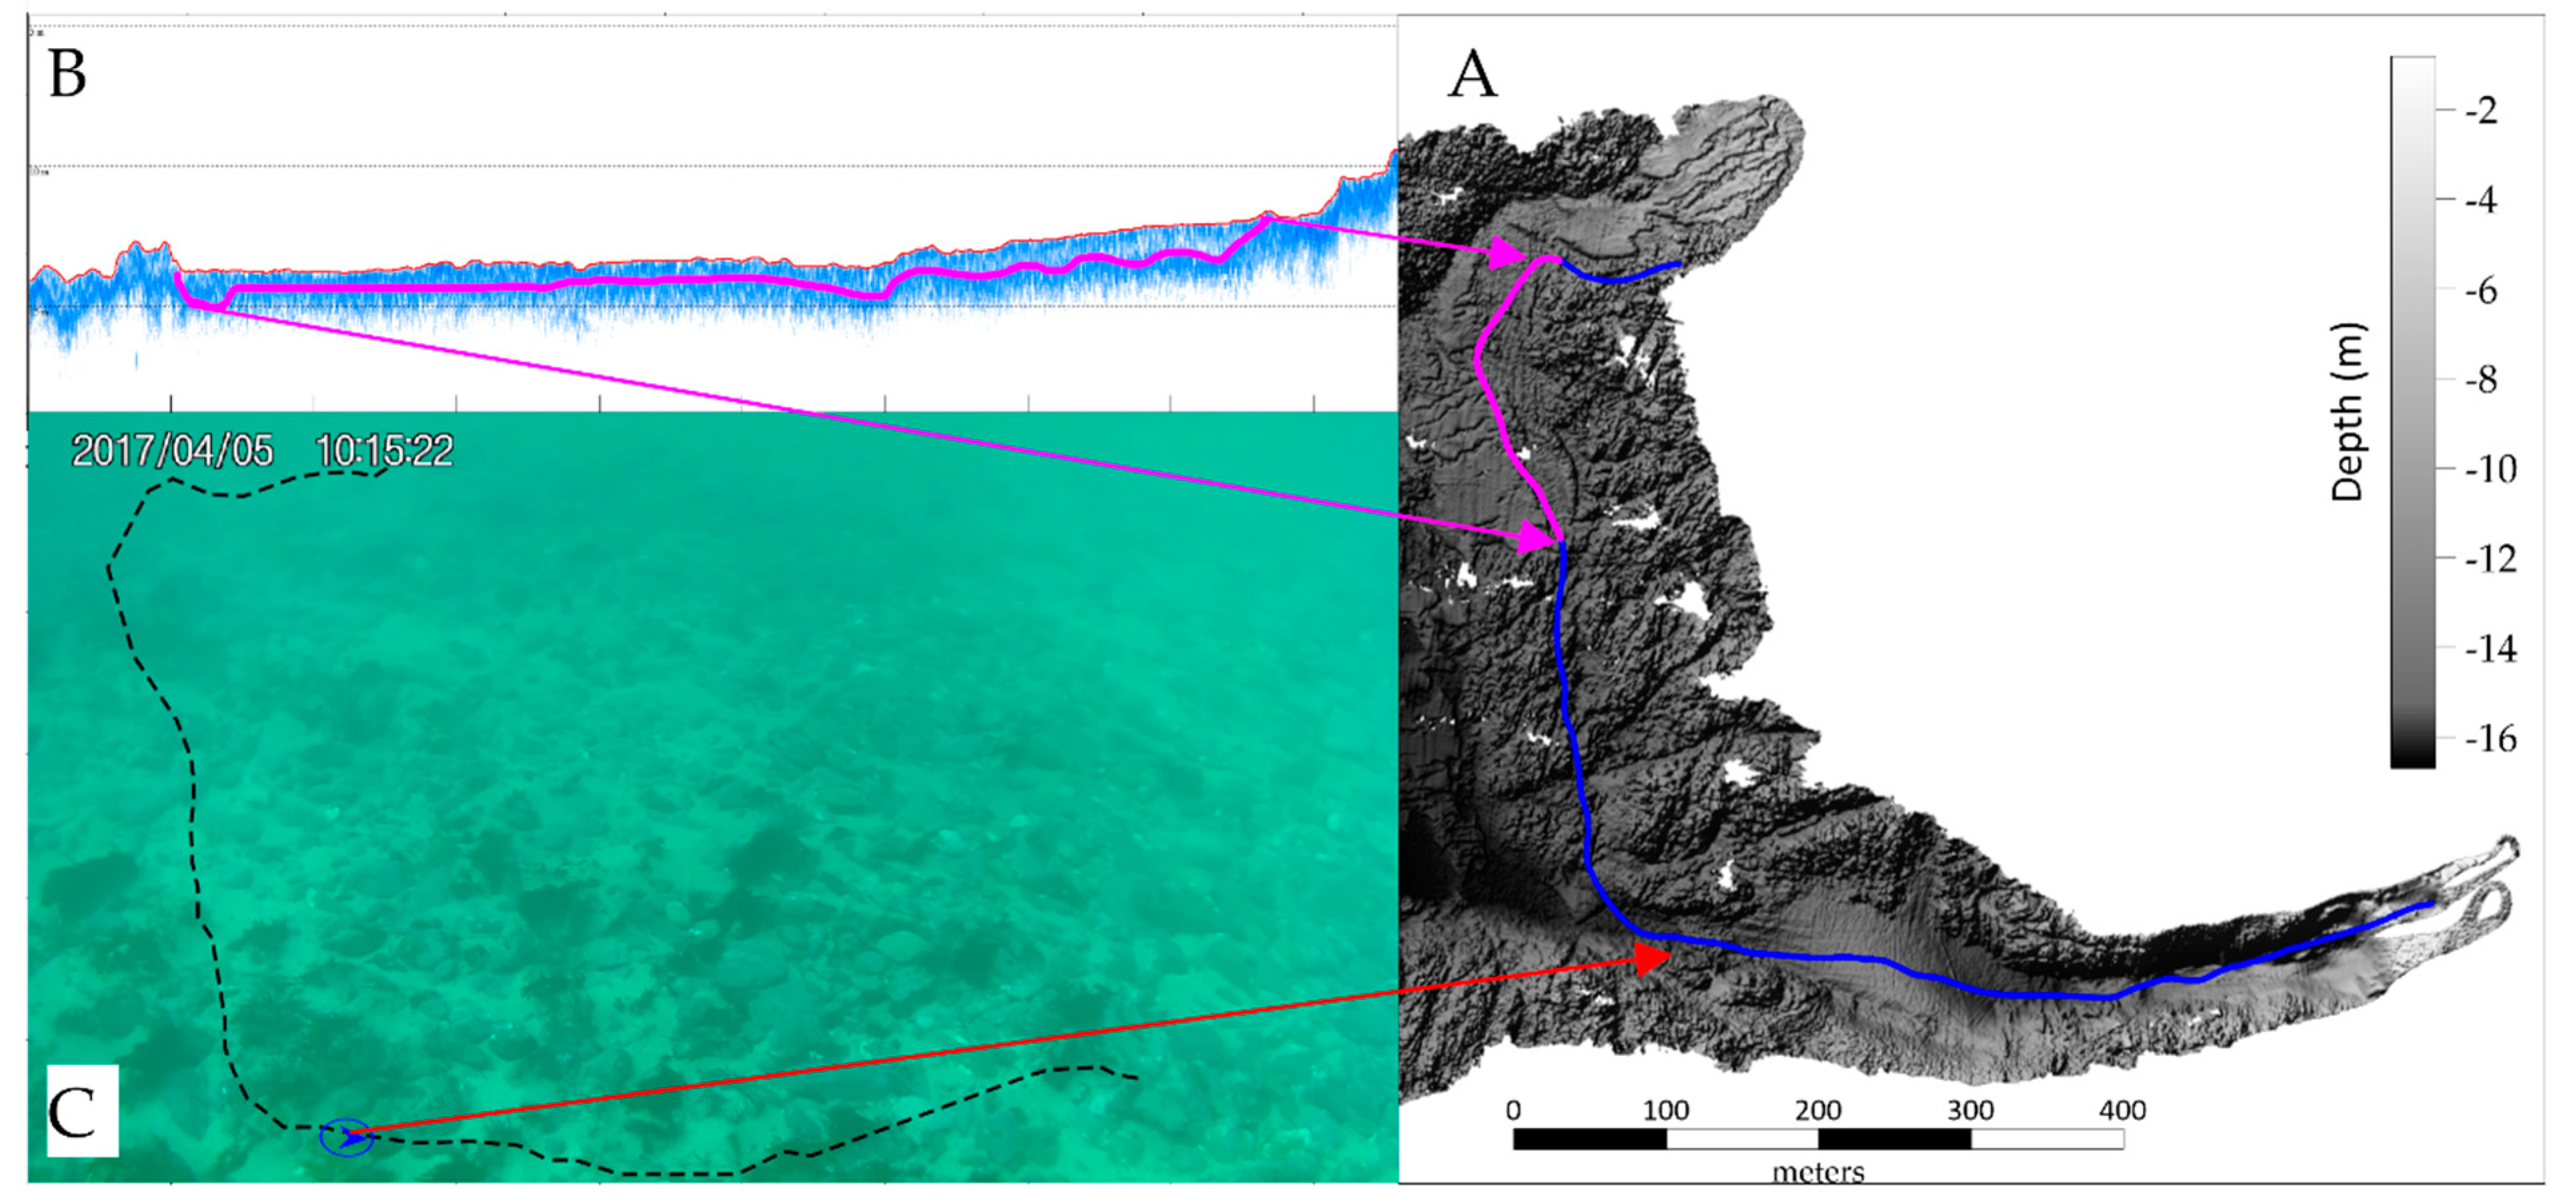
The cable route from the WEC to the shore was investigated and revealed a variety of substrates (Figure 7A). The area immediately south away from the target survey zone (Figure 7B) exhibits a shallow sandy substrate with an average thickness of 0.8 m sand over bedrock. This changed into an elevated rocky outcrop before reducing in depth and becoming partially covered with sand (Figure 7C). The final approach to the Ettrick River mouth consists of a thick sandy substrate through a narrow canyon, which the sub-bottom acoustics could not penetrate deep enough to determine the depth of the layer. This leads to a small protected embayment with calm surface waters suitable for the cables’ terrestrial transition.
3.3. Hydrodynamics
Generally, the survey period can be split up into two periods: (i) less favourable weather and wave conditions (3 April 2017), and (ii) reasonably fair conditions to conduct the sub-bottom profiling, video surveys, and sediment coring (4–5 April 2017). The wind on the survey days was relatively mild (<10 knots) but the swell from previous days was still prominent from 3 April 2017 to 4 April 2017 morning with wave heights (Hmax) exceeding 2 m. The wave heights are correlated to the wind conditions and showed a continuous decline between Monday morning and Tuesday afternoon. Maximum wave heights exceeded Hmax > 2 m on Monday, but the swell decreased to Hmax < 1.25 m. Tidal currents were relatively weak with maximum velocities of 0.2 m/s throughout the water column (not shown). The tidal range during the survey was in the micro-tidal range with maximum water level differences of 0.75 m between low tide and consecutive high tide.
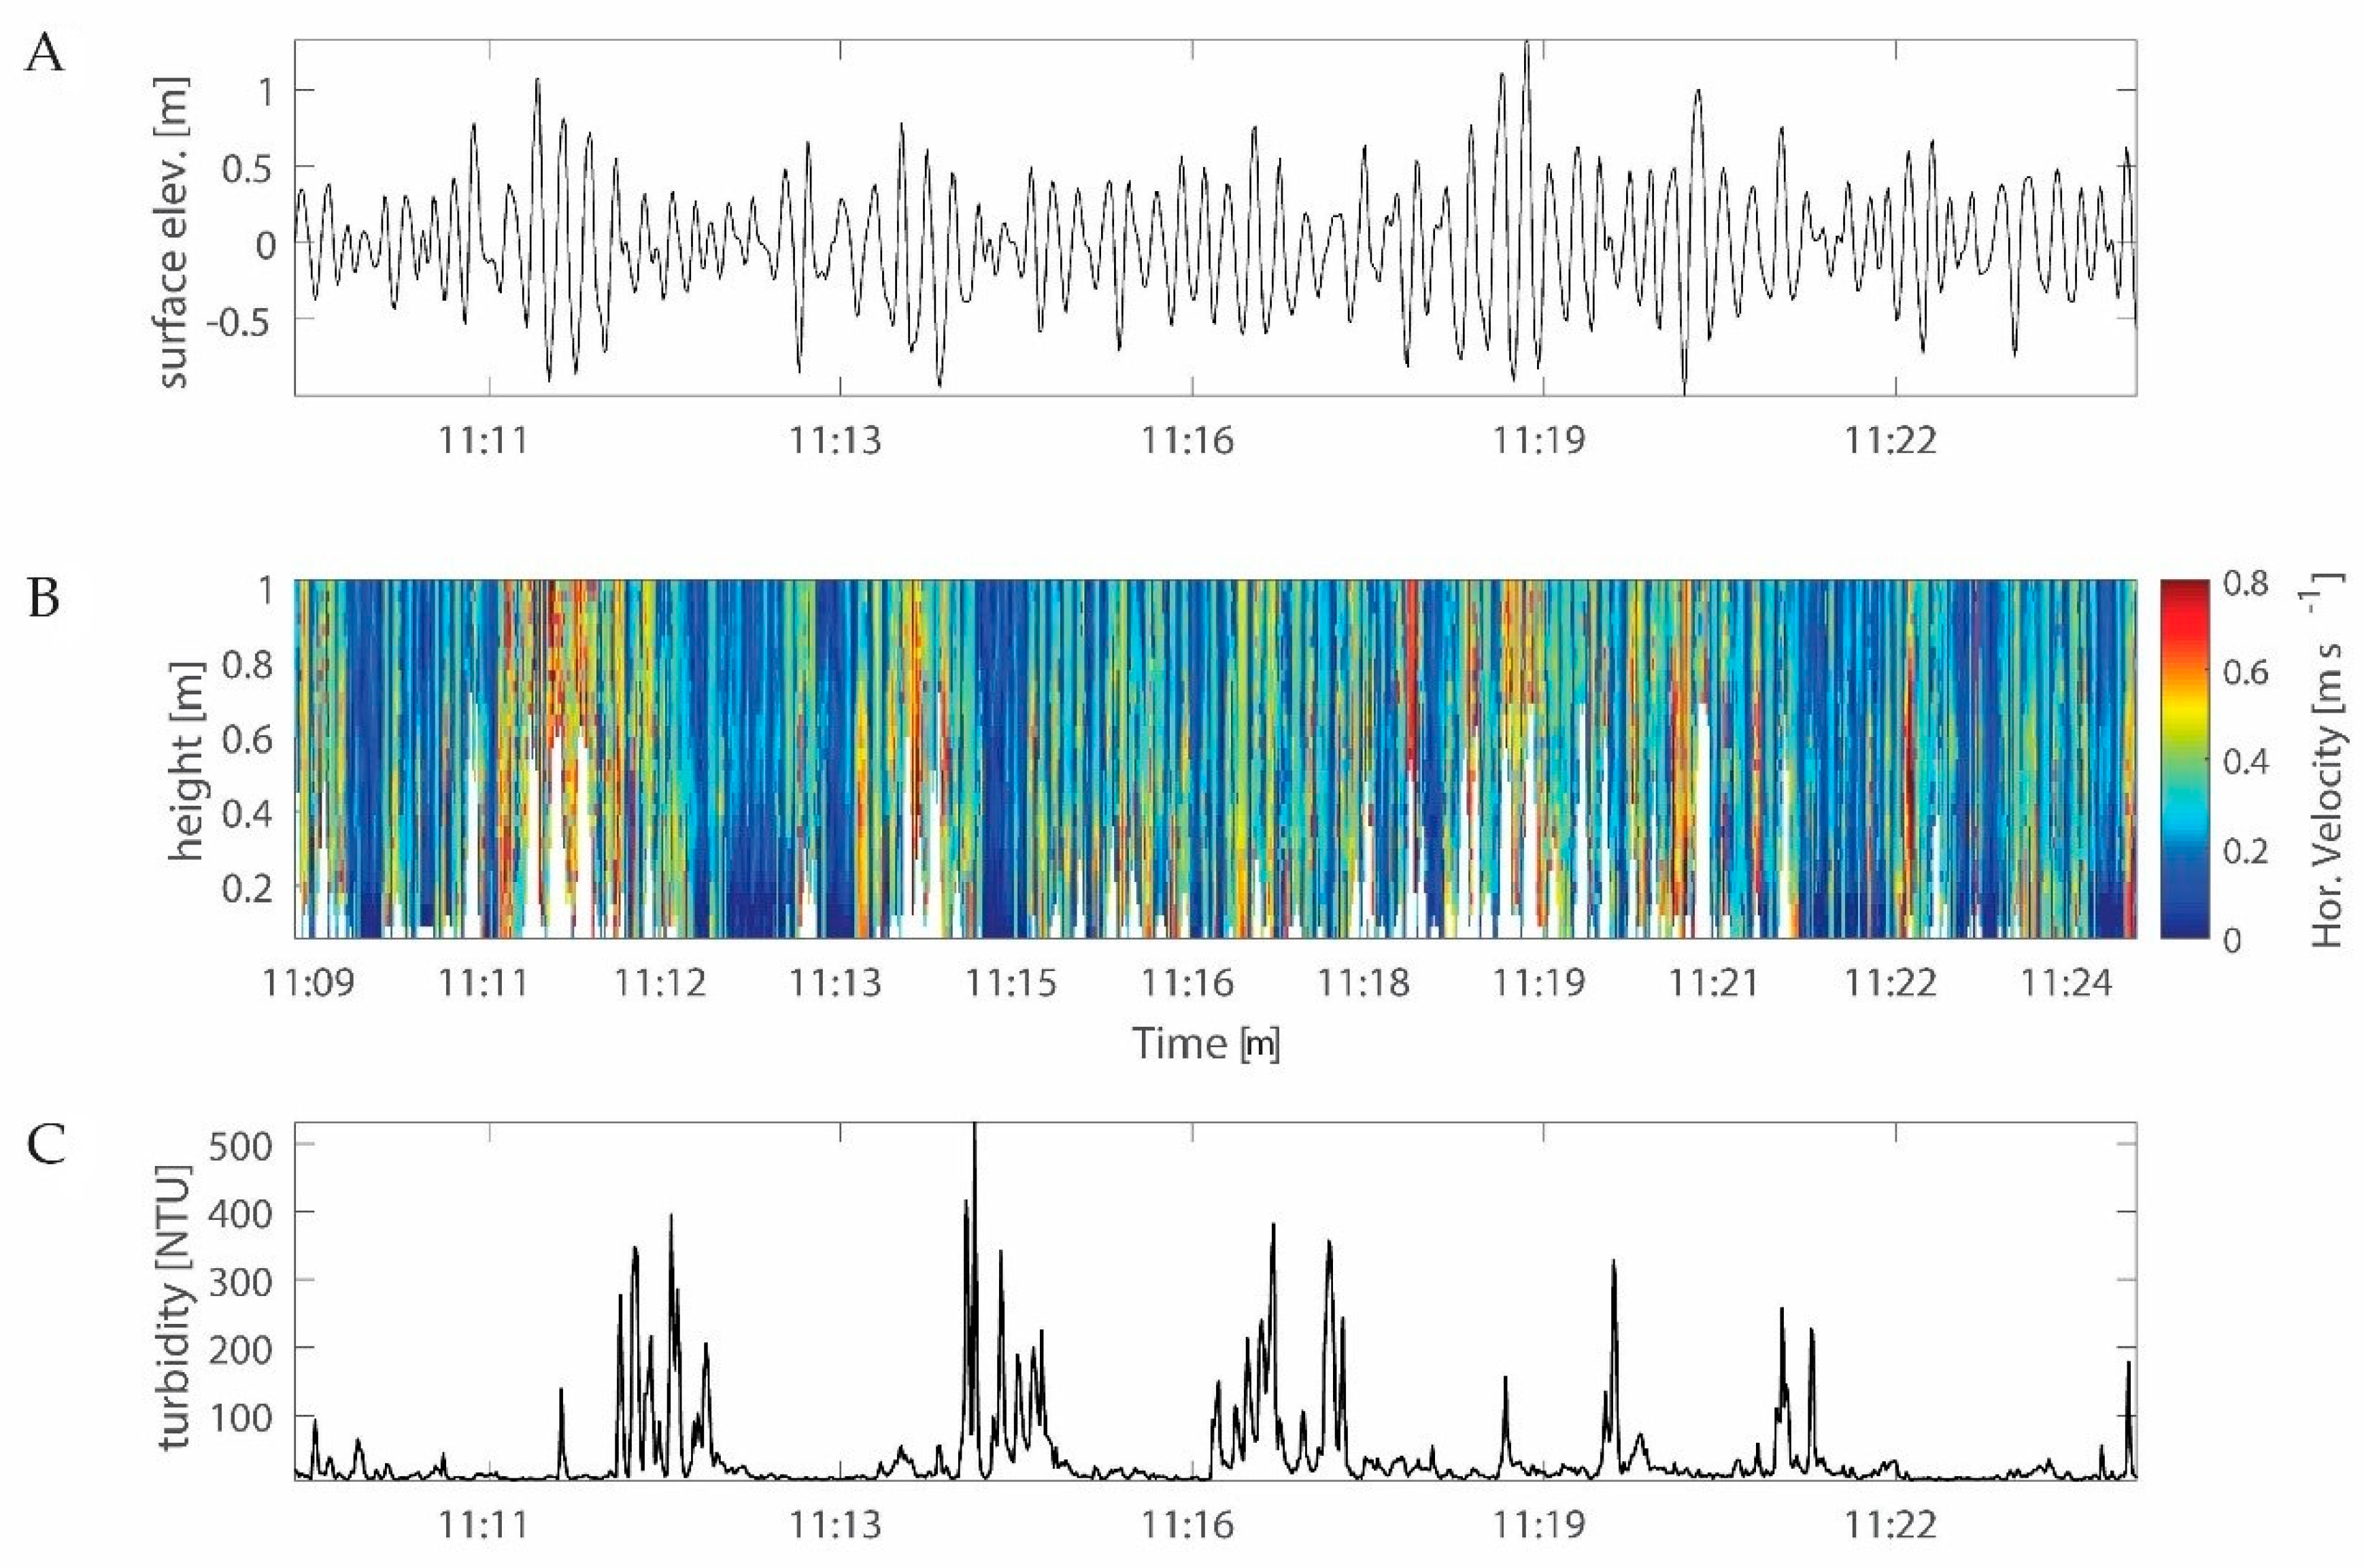
Figure 8 provides a description of the hydrodynamics observed during the more energetic conditions at the beginning of the survey period. Velocities near the seafloor reveal periodic velocity fluctuations which correlate well with passing waves. Small waves led to small increases in horizontal velocities whilst large wave groups generated velocities at the order of ubottom > 1 m/s. Turbidity levels were measured approximately 0.15 m and above the seafloor. Particularly, large waves in passing wave trains show good agreement with elevated turbidity levels (>100 NTU) which are much larger compared to ambient turbidity levels at the order of ~10 NTU. During the passage of small waves, velocities hardly exceeded 0.15 m/s (not shown) with a typical logarithmic profile near the bottom. In contrast, larger waves during the observation significantly accelerate the water in the bottom meter ranging from 0.7 m/s to > 1 m/s within the bottom meter above the seafloor (Figure 9A). It is evident from Figure 9B,C that periods of increased velocities can be directly linked to sediment resuspension near the seafloor.
4. Discussion
The region surrounding the Ettrick River is part of the Surprise Bay formation on Western King Island, a quartz-rich metasediment initially formed from turbidites with graded bedding [18]. A steep-walled submarine channel was incised by the Ettrick River through the metasediment bedrock during lower sea levels and now forms a prominent submarine feature; with a significant base of slope fan having an accumulation of sand around −14 m water depth. Moreover, 500 m to the north, is a less prominent submarine channel feature that has been the focus of this study for the purposes of the installation of a WEC. The potential deployment site has a gradual slope of 3°, a width that varies from 35 m to 50 m and fits the developer’s target water depth of 10 m with an average sediment depth of 1.14 m (Figure 10).
The identification of the most sufficient deployment area is a culmination of condensed field deployments and rigorous data analysis. The site suitability model was created using only three spatial parameters (water depth, sediment depth, and slope), however, more parameters can be included to ensure even further compliance with site-specific characteristics and terrain analysis. For this site assessment, directionality or aspect for wave climate was not considered, as the analysis of the bathymetry prior to deployment and a long-standing wave record led to the conclusion that the survey area was already supporting an ideal wave direction for the WEC. In addition, specific criteria were all given equal weighting. All three parameters reduced the deployment site area equally, yet different WEC form factors may have decidedly less reliance on the slope and put priority on other factors or whereby a sliding scale would be more appropriate. Further attributes could rely on distance to the grid, a rocky reef buffer distance, or even specific geotechnical properties such as optimal bearing capacity if the gravity structure design relies on heavyweight caisson structures.
The addition of geotechnical properties to site-suitability models would combine the acoustic and geotechnical analysis into one database. However, bearing capacity over large areas would be technically difficult and time-intensive in both the field (extra core samples) and the lab (triaxial shear test). This could be resolved with the primary site assessment method encouraged by Stark, Hay, and Trowse [6], whereby a portable free-fall penetrometer could be deployed to “allow rapid geotechnical probing of the sediment type, soil mechanical characteristics, and uppermost stratification”. However, this method does not replace the usefulness of core samples, or laboratory sediment investigations as only the top layer (<20 cm) is able to be penetrated in sandy environments. Yet, this was successfully used in further King Island assessments to determine the homogeneity of non-cohesive sediments within the survey region [27]. The aggregation of data in this method (site-suitability model) is able to go beyond the scope of most standards [7], particularly with the inclusion of ground-truthed core samples within the bedrock interpolation. Hence, the site suitability model is malleable to each site selection quantitative criteria and is a robust overachieving method compared to present-day standards and a key deliverable in initial site selection surveys.
Outside of quantitative analysis, the site exhibited large quantities of seaweed that could foul instrumentation and even impede the operation of the WEC. Shallow sand layers in the eastern region were observed with boulders protruding in increasing frequency, and evidence of scour was observed during video transects with exposed rocks devoid of marine growth up to 0.4 m above the seabed. Sand ripples with crests being over 1 m apart suggest strong wave action and water velocities on the seabed. None of these observations would be possible with the reduced view from drop cameras that have limited success in areas of low visibility that typically pertain to shallow high-energy marine environments. This is not to limit the inclusion of drop cameras, which at certain depths are preferable. Such as Barrie and Conway [8] being able to determine that the local wave regime was able to mobilize large gravels from the video of crustacean scars on large boulders at 44 m water depth. Even with the addition of robust qualitative observations, these observations are largely static and long-term hydrodynamic forces need further investigation.
While the region along the west coast of King Island is known for its heavy wind and wave events, quantitative wave data monitoring is lacking. Wave rider buoys to the north (200 km) are in the shallow water entrance to Melbourne’s Port Philip Bay, and further south (260 km) along mainland Tasmania west coast is the Cape Sorell wave rider in 100 m of water. Whilst needing direct measurement in the Bass Strait, wave climate models have shown the King Island region to have some of Australia’s highest wave energy flux [19] but also its highest variability [5]. The short two-day hydrodynamic deployment in favourable weather conditions provided only a snapshot of the hydrodynamic forcing due to waves on the seabed at 10 m water depth. However, a long-term deployment is required to monitor the wave regime and local seabed conditions for energy production feasibility and stability of the WEC as done on the east side of King Island [28].
The stability of the WEC is almost exclusively determined by the scour [29], and as noted previously was highly active in the area. The sediment transport in the area is likely onshore–offshore with little tidal flow and rocky reefs surrounding the region. Recent studies such as Lancaster et al. [30] and Qiqi et al. [31] demonstrated that significant scouring on a square caisson can occur at all four corners. Scour could hamper the integrity if sediments were removed from underneath the structure at specific points causing a seaward tilt and settlement, especially in such an energetic shallow water environment with poorly compacted sand and velocities near the bottom exceeding values of 1 m/s. Thus, high-resolution scour modelling under the local wave climate is recommended. Novel ways of investigating the effects of scouring will be imperative for the structural integrity during a long-term deployment in a high-energy wave environment.
The installation of such a WEC device in a limited suitable site would be logistically difficult. The area between the rocky outcrops is roughly 60 m across, with the site suitability model reducing the viable location to just 30 m. For a gravity anchored cement structure with a width of 20 m, this leaves little room for error. Certain deployment methods could be utilised; however, this still requires a weather window with calm conditions which are rare in the region of the roaring forties in the Southern Ocean. In addition, the lack of standards or guidelines for such developments are vague at best [7,12], yet it is just such challenges [10] that need to be overcome for the proliferation of nearshore WECs to harness the considerable wave energy fluxes along the Southern Australian margin [4,19].
5. Conclusions
This study provides insight into scalable geophysical site surveys leading to high-resolution datasets. In this instance, the data was used to make a ground-truthed 3D rendered interpolation of the deployment site and a site suitability model that when coupled with bearing capacity from laboratory geotechnical analysis an assessment of critical information could be made. Such that, the location of a footprint suitable to the WEC with an ideal depth profile and sufficient sediment to support the structure was found towards the northern side of the survey area. Further investigation would be required to understand the local wave regime, cyclic loading, scour, and establish deployment strategies.
Practical, economical, and thorough initial site assessments can ensure projects obtain the data required for progression into design and deployment. Single beam acoustics (sub-bottom) need to be designed with sufficient data density and ground-truthing, ideally with core penetration able to transit strata. Geotechnical site selection parameters can be combined with suitability models to determine preferred deployment sites. Our survey was able to combine multiple data sources (acoustic, geotechnical, hydrological) in our site assessment.
Author Contributions
Conceptualisation, A.G., S.H., I.P. and R.C.; methodology, C.H., A.G. and R.C.; formal analysis, C.H. and R.C.; investigation, C.H., A.G. and R.C.; writing—original draft preparation, C.H.; writing—review and editing, C.H., A.G. and R.C.; supervision, I.P. All authors have read and agreed to the published version of the manuscript.
Funding
This research received no external funding.
Institutional Review Board Statement
Not applicable.
Informed Consent Statement
Not applicable.
Data Availability Statement
The data that support the findings of this study are available from the corresponding author upon reasonable request.
Acknowledgments
The authors would like to thank and acknowledge the following people for their work and help to accomplish this study. WSE and AMCS for initiating and funding this project. Grant Jordan for his help on King Island including the use of his vessel ABSTAR, supply of diving equipment, field operations in general, and assisting with local knowledge in the planning stages. A/Prof Alex Scheuermann and the Geotechnical Lab staff at the University of Queensland for help with the analysis of the core samples.
Conflicts of Interest
The authors declare no conflict of interest.
References
- REN21. Renewables 2018 Global Status Report; REN21 Secretariat: Paris, France, 2018; p. 26. [Google Scholar]
- REN21. Renewables 2019 Global Status Report; 0312–1372; REN21 Secretariat: Paris, France, 2019; p. 336. [Google Scholar]
- CSIRO. Ocean Engery in Australia. Available online: https://www.csiro.au/en/Research/OandA/Areas/Marine-technologies/Ocean-energy (accessed on 24 May 2021).
- Hemer, M.A.; Manasseh, R.; McInnes, K.L.; Penesis, I.; Pitman, T. Perspectives on a way forward for ocean renewable energy in Australia. Renew. Energy 2018, 127, 733–745. [Google Scholar] [CrossRef]
- Hemer, M.A.; Zieger, S.; Durrant, T.; O’Grady, J.; Hoeke, R.K.; McInnes, K.L.; Rosebrock, U. A revised assessment of Australia’s national wave energy resource. Renew. Energy 2017, 114, 85–107. [Google Scholar] [CrossRef]
- Stark, N.; Hay, A.E.; Trowse, G. Cost-effective geotechnical and sedimentological early site assessment for ocean renewable energies. In Proceedings of the 2014 Oceans, St. John’s, NL, Canada, 14–19 September 2014; pp. 1–8. [Google Scholar]
- European Marine Energy Centre Ltd. Guidelines for Project Development in the Marine Energy Industry. In Marine Renewable Energy Guides; BSI: London, UK, 2009. [Google Scholar]
- Barrie, J.V.; Conway, K.W. Seabed Characterization for the Development of Marine Renewable Energy on the Pacific Margin of Canada. Cont. Shelf Res. 2014, 83, 45–52. [Google Scholar] [CrossRef]
- Ramsay, P.; Miller, W.; Murrell, D. Supporting Renewable Energy Projects Using High Resolution Hydrographic and Geophysical Survey Techniques, Garden Island, Western Australia. Underw. Technol. 2016, 33, 229–237. [Google Scholar] [CrossRef]
- Chatzigiannakou, M.A.; Dolguntseva, I.; Leijon, M. Offshore Deployments of Wave Energy Converters by Seabased Industry AB. J. Mar. Sci. Eng. 2017, 5, 15. [Google Scholar] [CrossRef]
- Chen, L.; Lam, W.H. Methods for predicting seabed scour around marine current turbine. Renew. Sust. Energy Rev. 2014, 29, 683–692. [Google Scholar] [CrossRef]
- Hill, P.; Barrie, J.; Kung, R.; Lintern, D.; Mullan, S.; Li, M.; Shaw, J.; Stacey, C.; Todd, B. Geological and Geophysical Site Characterization for Marine Renewable Energy Development and Environmental Assessment; CSA: Toronto, ON, Canada, 2015. [Google Scholar] [CrossRef]
- Heath, J.; Jensen, R.; Arguello, J.; Roberts, J.; Bull, D.; Weller, S.; Hardwick, J.; Johanning, L. Specific Requirements for MRE Foundation Analysis. Deliverable 4.2 of the DTOcean Project; University of Edinburgh: Edinburgh, UK, 2014. [Google Scholar]
- Cradden, L.; Kalogeri, C.; Barrios, I.M.; Galanis, G.; Ingram, D.; Kallos, G. Multi-criteria site selection for offshore renewable energy platforms. Renew. Energy 2016, 87, 791–806. [Google Scholar] [CrossRef] [Green Version]
- Xu, S.; Wang, S.; Guedes Soares, C. Review of mooring design for floating wave energy converters. Renew. Sustain. Energy Rev. 2019, 111, 595–621. [Google Scholar] [CrossRef]
- Hydro Tasmania. King Island Renewable Energy Integration Project (KIREIP). Available online: http://www.kingislandrenewableenergy.com.au/ (accessed on 29 May 2021).
- Calver, C.R. Some Notes on the Geology of King Island; Rosny Park, Tasmania, Australia, Department of Infrastructure, Energy and Resources—Mineral Resources Tasmania: Rosny Park, Australia, 2007; p. 21. [Google Scholar]
- Black, L.P.; Calver, C.R.; Seymour, D.B.; Reed, A. SHRIMP U–Pb detrital zircon ages from Proterozoic and Early Palaeozoic sandstones and their bearing on the early geological evolution of Tasmania. Aust. J. Earth Sci. 2004, 51, 885–900. [Google Scholar] [CrossRef]
- Hemer, M.A.; Griffin, D.A. The wave energy resource along Australia’s Southern margin. J. Renew. Sustain. Energy 2010, 2, 043108. [Google Scholar] [CrossRef] [Green Version]
- Silbert, M.N.; Barnett, T.P.; Peters, O.J.H.; Hamilton, R.C. Wave Hindcasts and Measurements Bass Strait. In Coastal Engineering 1980; Edge, B.L., Ed.; American Society of Civil Engineers: Sydney, Australia, 1980; pp. 394–411. [Google Scholar] [CrossRef]
- Wave Swell Energy Ltd. Sustainable Elecricity from the Ocean. Available online: https://waveswellenergy.com.au/ (accessed on 2 May 2021).
- Cressie, N. Statistics for Spatial Data; John Wiley & Sons, Incorporated: New York, NY, USA, 1993. [Google Scholar]
- Oliver, M.A.; Webster, R. A tutorial guide to geostatistics: Computing and modelling variograms and kriging. Catena 2014, 113, 56–69. [Google Scholar] [CrossRef]
- Sperazza, M.; Moore, J.N.; Hendrix, M.S. High-resolution particle size analysis of naturally occurring very fine-grained sediment through laser diffractometry. J. Sediment Res. 2004, 74, 736–743. [Google Scholar] [CrossRef]
- Bjerrum, L. Geotechnical problems involved in foundations of structures in the North Sea. Géotechnique 1973, 23, 319–358. [Google Scholar] [CrossRef]
- Hansen, J.B.; Inan, S. A Revised and Extended Formula for Bearing Capacity; Geoteknisk Institut: Copenhagen, Danmark, 1970. [Google Scholar]
- Cossu, R.; Heatherington, C.; Penesis, I.; Beecroft, R.; Hunter, S. Seafloor Site Characterization for a Remote Island OWC Device Near King Island, Tasmania, Australia. J. Mar. Sci. Eng. 2020, 8, 194. [Google Scholar] [CrossRef] [Green Version]
- Lancaster, O.; Cossu, R.; Boulay, S.; Hunter, S.; Baldock, T.E. Comparative Wave Measurements at a Wave Energy Site with a Recently Developed Low-Cost Wave Buoy (Spotter), ADCP, and Pressure Loggers. J. Atmos. Ocean. Technol. 2021, 38, 1019–1033. [Google Scholar] [CrossRef]
- Neill, S.P.; Hashemi, M.R. Fundamentals of Ocean Renewable Energy—Generating Electricity from the Sea; Elsevier: Amsterdam, The Netherlands, 2018. [Google Scholar]
- Lancaster, O.; Cossu, R.; Baldock, T.E. Experimental investigation into 3D scour processes around a gravity based Oscillating Water Column Wave Energy Converter. Coast. Eng. 2020, 161, 103754. [Google Scholar] [CrossRef]
- Qiqi, X.; Kai, W.; Fang, Q.; Changrong, Y.; Yadong, L. Experimental Study of Local Scour around Caissons under Unidirectional and Tidal Currents. Water 2020, 12, 640. [Google Scholar] [CrossRef] [Green Version]
Figure 1.
Location of Wave Swell Energy Ltd. survey in the Bass Strait on the west coast of King Island, Tasmania in ~10 m of water and the location of the Ettrick River which is the destination of the cable to the grid.
Figure 1.
Location of Wave Swell Energy Ltd. survey in the Bass Strait on the west coast of King Island, Tasmania in ~10 m of water and the location of the Ettrick River which is the destination of the cable to the grid.

Figure 2.
Location of the cores taken inside and outside of the primary survey area. Original survey polygon is depicted in the centre faded region. Coloured points depict sediment core locations measured at the cardinal point from a central georeferenced star picket at three locations. Colours represent penetration depth (in mm) before refusal when hitting a harder substrate.

Figure 3.
Scatterplot of core sample refusal depth against the initial acoustics point kriging interpolation sediment depths. The furthest sample to the west (greyed out) was removed for refusal (0.8 m) likely not being caused by sediment depth. Trendline = 0.76 × X − 0.06, R2 = 0.36.
Figure 3.
Scatterplot of core sample refusal depth against the initial acoustics point kriging interpolation sediment depths. The furthest sample to the west (greyed out) was removed for refusal (0.8 m) likely not being caused by sediment depth. Trendline = 0.76 × X − 0.06, R2 = 0.36.

Figure 4.
(A) Semi-variogram model showing the Gaussian best fit line with the very low residual sum of squares (0.0021) typically used for validation. (B) Cross-validation post kriging showing the linear fit between measured values and estimated values with the best fit at almost 1:1.
Figure 4.
(A) Semi-variogram model showing the Gaussian best fit line with the very low residual sum of squares (0.0021) typically used for validation. (B) Cross-validation post kriging showing the linear fit between measured values and estimated values with the best fit at almost 1:1.

Figure 5.
(A) Particle size distribution of the seabed sand and 40–50 cm depth, averaged from 10 core samples. (B) Core #4 showing the fine particles at the base, likely organics preserved from lower sea levels.
Figure 5.
(A) Particle size distribution of the seabed sand and 40–50 cm depth, averaged from 10 core samples. (B) Core #4 showing the fine particles at the base, likely organics preserved from lower sea levels.

Figure 6.
Acoustic slices/profiles of the survey region. The bedrock underneath the sandy substrate being a kriging interpolation of the sub-bottom acoustic reflector data.
Figure 6.
Acoustic slices/profiles of the survey region. The bedrock underneath the sandy substrate being a kriging interpolation of the sub-bottom acoustic reflector data.

Figure 7.
Cable route to the grid using acoustics and towed camera. (A) Bathymetry of the area showing the GPS track of the vessel. (B) Section of sub-bottom in the first region with a shallow layer of sand. (C) Image of the rocky outcrop in the second region of the track.
Figure 7.
Cable route to the grid using acoustics and towed camera. (A) Bathymetry of the area showing the GPS track of the vessel. (B) Section of sub-bottom in the first region with a shallow layer of sand. (C) Image of the rocky outcrop in the second region of the track.

Figure 8.
Vertical profile of horizontal velocities during large wave trains in the 15 min interval. Error bands depict the standard deviation.
Figure 8.
Vertical profile of horizontal velocities during large wave trains in the 15 min interval. Error bands depict the standard deviation.

Figure 9.
Hydrodynamic conditions during a 15 min interval, representative of the energetic sea state on Monday, 3 April 2017. (A) Water level fluctuations from mean sea level. (B) Horizontal velocity magnitudes in the water column at different heights above the bottom (hab). (C) NTU levels measured 0.15 m above the seafloor.

Figure 10.
The target area for the WEC with site suitability model of depth (8–12 m), slope (>15°), and sediment depth (≥1 m).
Figure 10.
The target area for the WEC with site suitability model of depth (8–12 m), slope (>15°), and sediment depth (≥1 m).

Publisher’s Note: MDPI stays neutral with regard to jurisdictional claims in published maps and institutional affiliations. |
© 2021 by the authors. Licensee MDPI, Basel, Switzerland. This article is an open access article distributed under the terms and conditions of the Creative Commons Attribution (CC BY) license (https://creativecommons.org/licenses/by/4.0/).
Share and Cite
MDPI and ACS Style
Heatherington, C.; Grinham, A.; Penesis, I.; Hunter, S.; Cossu, R. Geotechnical Approach to Early-Stage Site Characterisation of Shallow Wave Energy Sites. J. Mar. Sci. Eng. 2021, 9, 605. https://doi.org/10.3390/jmse9060605
AMA Style
Heatherington C, Grinham A, Penesis I, Hunter S, Cossu R. Geotechnical Approach to Early-Stage Site Characterisation of Shallow Wave Energy Sites. Journal of Marine Science and Engineering. 2021; 9(6):605. https://doi.org/10.3390/jmse9060605
Chicago/Turabian StyleHeatherington, Craig, Alistair Grinham, Irene Penesis, Scott Hunter, and Remo Cossu. 2021. "Geotechnical Approach to Early-Stage Site Characterisation of Shallow Wave Energy Sites" Journal of Marine Science and Engineering 9, no. 6: 605. https://doi.org/10.3390/jmse9060605
Note that from the first issue of 2016, this journal uses article numbers instead of page numbers. See further details here.