
Ship AIS Trajectory Clustering: An HDBSCAN-Based Approach


1
School of Navigation, Wuhan University of Technology, Wuhan 430063, China
2
Hubei Key Laboratory of Inland Shipping Technology, Wuhan University of Technology, Wuhan 430063, China
*
Author to whom correspondence should be addressed.
J. Mar. Sci. Eng. 2021, 9(6), 566; https://doi.org/10.3390/jmse9060566
Submission received: 21 April 2021
/
Revised: 14 May 2021
/
Accepted: 18 May 2021
/
Published: 24 May 2021
(This article belongs to the Section Ocean Engineering)
Abstract
:The Automatic Identification System (AIS) of ships provides massive data for maritime transportation management and related researches. Trajectory clustering has been widely used in recent years as a fundamental method of maritime traffic analysis to provide insightful knowledge for traffic management and operation optimization, etc. This paper proposes a ship AIS trajectory clustering method based on Hausdorff distance and Hierarchical Density-Based Spatial Clustering of Applications with Noise (HDBSCAN), which can adaptively cluster ship trajectories with their shape characteristics and has good clustering scalability. On this basis, a re-clustering method is proposed and comprehensive clustering performance metrics are introduced to optimize the clustering results. The AIS data of the estuary waters of the Yangtze River in China has been utilized to conduct a case study and compare the results with three popular clustering methods. Experimental results prove that this method has good clustering results on ship trajectories in complex waters.
1. Introduction
With the development of the marine industry and the rise of AIS data mining, more and more researchers use AIS to analyze maritime traffic problems [1,2,3]. Cluster analysis is to group or cluster data according to the inherent similarity and characteristics between data to achieve the purpose of data mining [4]. In maritime traffic applications, the clustering results may show the usual route and traffic volume distribution and regularity of marine environmental change [5,6,7]. As a commonly used data mining method, ship trajectory clustering integrates the trajectory data of different ships into different categories or clusters. It’s beneficial for the maritime traffic management stakeholders, such as Maritime Safety Administration (MSA), to obtain insights on the operation status and characteristics of the regional traffic. In the meantime, ship trajectory clustering is one of the fundamental methods for trajectory prediction, anomaly detection, and avoiding ship collision [8,9], which draws much attention from academia.
According to the literature, various clustering methods have been proposed to conduct data clustering in multiple disciplines [10]. Among them, the partition-based approach, the graph-based approach, the hierarchical-based approach, and the density-based approach are the frequently utilized clustering methods. K-means, as a representative of the partition-based clustering methods, have been widely utilized in related works with its simplicity and efficiency. Wang and Bai [11] applied Min-Max k-means clustering error method to modify the global k-means algorithm, and overcome the effect of bad initialization, through the modified algorithm. Tyagi and Trivedi [12] proposed a hybrid k-means algorithm to obtain the clustering results of color images, and the clustering results are refined using the Ant Colony Optimization (ACO) algorithm. Roiha et al. [13] applied the genetic algorithm to find the initial centroid and improve the k-means method. Based on the structure database technology and k-means clustering, Jiang et al. [14] proposed a classification and identification scheme to monitor the moving targets at sea. However, due to the drawbacks, such as sensitivity to the noises of data and the center of the cluster, such a method does not perform well for the data with noise.
Based on the graph theory, the spectral clustering algorithm transforms the clustering problem into the optimal division of graphs. Using the one-way distance between ship trajectories, Ma et al. [15] applied the spectral clustering algorithm to extract the regular motion patterns of ships in Qiongzhou Strait, China. Nataliani and Yang [16] proposed a powered Gaussian kernel function to improve the spectral clustering algorithm. Gao and Shi [17] proposed a new method for recognizing a unique ship-handling behavior pattern based on multi-step sub-trajectory spectral clustering analysis. However, these improved algorithms have a common drawback, i.e., it is difficult to converge for data sets when the shape of clusters is irregular, and the number of the cluster has to be pre-set before the trajectory clustering, especially for some data with complex sample distribution [10].
As another alternative for data clustering, density-based clustering is the data clustering method based on the density distribution of samples. Generally, density clustering starts from the perspective of sample density to check the connectivity between samples and continuously expands clustering, based on connectable samples, to obtain the final clustering result. DBSCAN has been widely used as a classic density clustering algorithm. A DBSCAN density clustering algorithm based on statistical methods to determine the parameters is proposed by Zhao et al. [18], and the trajectory of the ship is clustered in the waters where the trajectory of the ship is unevenly distributed. Similar work was conducted by Zhao and Shi [5]. The parameters of the DBSCAN algorithm were also determined by statistical methods. A large number of ship trajectories were evaluated and compared in the Beilun-Zhoushan Port of China. Zhao and Shi [19] adopted a density-based clustering method and recurrent neural network for maritime anomaly detection.
With the increase in port cargo throughput, the form of water transportation has become more and more complex, which poses a challenge to the management of the maritime transportation system. The classic density-based clustering algorithms, such as DBSCAN, are difficult to obtain expected results for clustering ship trajectories with different densities. To do this in this research, we applied HDBSCAN, which is a hierarchical-density-based approach to conduct the clustering of ship trajectories with improvements on the algorithm to better adjust to AIS data. Campello et al. [20] proposed a hierarchical clustering method that provides a clustering hierarchy from which a simplified tree of significant clusters can be constructed, and a novel cluster stability measurement to formalize the problem of maximizing the overall stability of selected clusters, and provides interpretable dendrogram plots. Zhang et al. [21], Ghamarian and Marquis [22], Lentzakis et al. [23] and Ibrahim, et al. [24] used HDBSCAN in their research and their conclusions prove that HDBSCAN has good results for clustering with different densities. Wilson et al. [25] applied HDBSCAN on the trajectory clustering of flight data in the United States, within which a distance geometry is integrated into the method to cluster the flight trajectory with their shape characteristics. Wang et al. [26] combined Dynamic Time Warping (DTW) and HDBSCAN to identify the main routes and speed profiles of water transportation in Shanghai and Ningbo ports. The results of the aforementioned researches have proved that the HDBSCAN method can perform well on trajectory clustering with noise. However, there are still some issues, for such methods, in practices with trajectory data containing complicated shape characteristics. Besides, the optimization of clustering performance and determination of number of clustering should also be improved.
In this research, an HDBSCAN-based ship trajectory clustering algorithm is adopted to propose a new ship trajectory clustering method with better performance and clustering flexibility compared with previous works. With the integration of the Hausdorff distance metric, the similarity between ship trajectories can be measured from the shape perspective. Besides, a new determination method on the number of clusters is also proposed to find the optimized number of clustering, based on comprehensive clustering performance metrics, to evaluate the clustering results. With such improvements, the HDBSCAN-based approach, proposed in our work, can have better performance on the ship trajectories data set where the traffic is complicated and can adaptively determine the optimized clustering number.
The contents of the paper are arranged as follows: Section 2 briefly describes the methodology of this research, followed by a detailed description of the method and models utilized in Section 3. On this basis, Section 4 applies the algorithm model to a case study of ship trajectories in the research waters. Then, it is discussed in Section 5 and is compared with some classic existing clustering algorithms. The results, discussion, and implication of the proposed method are concluded in Section 6.
2. Methodology
2.1. Methodological Overview of the Research
The objective of this research is to propose a clustering method that can perform ship trajectories in complex waters with different ship density distributions. To achieve such an objective, the first step is to exclude the abnormal data and improve the data quality for further process. The AIS trajectory data are preprocessed, briefly, with three steps: Coordinate transformation, trajectory trimming, and trajectory compression. Secondly, the similarity between the ship trajectories is measured with the utilization of Hausdorff distance to establish the similarity function from the shape characteristics perspective. Finally, the HDBSCAN method is applied to cluster the trajectory data and clustering performance metrics are proposed to test the performance of the method. The details of the methods utilized are elaborated in Section 2.2, Section 2.3 and Section 2.4, respectively. Figure 1 gives the methodological overview of the research:
2.2. Ship Trajectory Data Preprocessing
In this section, three methods are used to improve the accuracy of ship trajectory data. First, the geo-coordinates of the AIS data are transformed into Mercator coordinate system. The AIS data are then trimmed based on the time interval and MMSI (Maritime Mobile Service Identify) to avoid the connection between two trajectories, which has the same MMSI but a large time gap between each other. To improve the running speed of clustering, it is necessary to delete some redundant data points without affecting the shape characteristics of the original trajectory. The Douglas–Peucker (DP) algorithm has been proven to effectively eliminate redundant points in the ship’s trajectory [5,27], which is also utilized as a generalization method in cartography [28] to simplify the lines, and other shapes, in the tasks such as visualization, etc. In this case, the classic DP compression algorithm is adopted to compress the ship trajectory without losing its shape characteristics.
2.3. Hausdorff-Based Similarity Measures
The trajectory clustering is different from the point clustering, without loss of generality, the measurement of ship trajectory should be based on some common features of them, e.g., the shape characteristics of them. Because of the uncertainty of AIS transmission interval, the length of ship trajectory is always different. To perform a good clustering of ship trajectories, in complex waters, and with different ship density distributions, the shape of the trajectory is mainly considered to choose the method of similarity measurement. The Hausdorff Distance (HD) has proven to be an effective measurement method that considers the shape difference between two point sets of different lengths [27]. For this purpose, an Hausdorff-based similarity measures method is applied in this research.
2.4. HDBSCAN
Due to the characteristics of ship motion (i.e., the ship always sails in the channel where the implementation of Ship Routing System has been achieved.), the method based on density clustering has been recognized and used by most scholars in ship trajectory clustering. Although the density-based method can cluster the trajectory of any shape, the clustering effect of the classic density-based algorithm is poor for detecting clusters of data with different densities distributions in the density space [22].
Fortunately, such requirements have already been addressed with improved clustering methods. By introducing hierarchical clustering structure of the data, based on DBSCAN, HDBSCAN determines values of ε with a stable (persistent) function. Beyond that, this algorithm was developed to minimize the influence of user’s input and facilitate cluster identification through dendrogram plots. In this manner, compared with the traditional DBSCAN algorithm, HDBSCAN promotes higher efficiency to identify dense waters of ships, especially, in ship complex confluence waters.
3. Model Design
3.1. Definition of Ship Trajectory
In this research, the Maritime Mobile Service Identifier (MMSI) is utilized to distinguish different ship trajectories. The trajectory of one ship can be described by a set , where is the trajectory of ship i and n is the number of ships, and the trajectory of ship i is defined in Equation (1):
where k is the sequence index number of a ship trajectory length, m is the total length of a ship trajectory during the analysis period, and is the state vector of ship i at time , and are the coordinates of ship i at time .
3.2. Trajectory Data Preprocessing
The objective of this step is to preprocess the trajectory data obtained from the AIS. The first step is Mercator coordinate transformation, which transforms the spherical coordinates into the geodetic coordinates.
The second step is abnormal trajectory trimming with a time threshold. When analyzing the quality of the AIS data, there is a phenomenon that two trajectories of one ship, with a significantly large time difference, could be merged as one trajectory, which would hinder the results of the clustering. To avoid such an influence, a time threshold is utilized to differentiate these data. In the meantime, to improve the data quality, among all trajectory data traversal, trajectories will be cut into two segments if, and only if, the time interval among the datapoints exceeds the set threshold. The trajectory data will be separated into sub trajectories with a difference in the MMSI setting, i.e., the first part of the data continues to use the original MMSI and the second part of the data after the time difference is distinguished by a new artificial name, such as “MMSI” (e.g., the former MMSI is ‘431XXX431’, and after trajectory trimming, two substitutes could be found for MMSI—‘431XXX431’ and ‘431XXX431’).
The third step is to compress the data, based on the DP compression algorithm, to improve the clustering efficiency without losing the shape characteristics. The details of the algorithm setting in this research are as follows: For a curve composed of points, the first step is to set the distance threshold D, the second step is to connect the first and last two points of the curve line to find a straight-line segment, the third step is to calculate the Euclidean distance, from each point on the broken line, to the constructed straight-line segment to find the maximum value , and record the maximum point as P. if , the curve segment is divided into two parts with P as the boundary; if all points except the first and last points are deleted, and the third step is repeated until the curve can no longer be divided, the result is the simplified curve. Figure 2 shows an example of the process:
3.3. Similarity Measures
The critical step for trajectory clustering is the similarity measurement. In this part, The first stage is calculating the Hausdorff distances between ship trajectories to obtain the distance measurements, based on which, a similarity matrix of ship trajectories is obtained by a similarity function introduced.
3.3.1. Hausdorff Distance
For two coordinate-based trajectories represented by and , their Hausdorff distance is calculated as Equation (2):
where ‖·‖ represents the Euclidean distance between a coordinate point in ship trajectory A and a coordinate point in ship trajectory B. In this research, the relative distance between the data points is in the Marcato projection system. is the basic form of Hausdorff distance, which is the maximum between and . In such a design, the shape similarity between the two trajectories can be obtained without considering their lengths. An example of Hausdorff distance is shown in Figure 3:
3.3.2. A Similarity Function with Adaptive Scale Parameters
To enlarge the similarity between the ship trajectory, after the Hausdorff distance calculation, a similarity function is applied [27] as Equation (3):
where and are the mean values of Hausdorff distance between trajectory i, j, and other trajectories, and is the final similarity matrix.
3.4. Ship Trajectory Clustering with HDBSCAN
Clustering often does not have an optimization goal and learning process such as classification, but rather a statistical method that separates data based on their similarity characteristics. A good clustering algorithm should have a certain stability, and the results will not change greatly due to a few samples. Besides, the algorithm should also minimize manual intervention to ensure the objectivity of clustering.
HDBSCAN, based on density clustering, combining with hierarchical analysis, meets this requirement to a large extent. Based on the original literature, the input parameters are min_cluster_size and min_samples [20]. The former represents the minimum size of clusters and is the core parameter of HDBSCAN. The larger this parameter is, the smaller the final number of clustering species will be, and fewer points than this will be considered ‘noise.’ The latter is min_samples, which defines the number of samples in a neighborhood for a point to be considered a core point. In this research, the parameters are selected, with statistical methods, in Section 4. Besides this, there are some key definitions in the HDBSCAN method, which are as follows: (1) Core distance: the distance between the sample point and the nearest sample point; and (2) mutual reachability distance: the value is the maximum value of the core distance of two sample points and the distance between two sample points. The mutual reachability distance can be obtained with Equation (4):
where is the Euclidean distance between point a and point b. The advantage of this is that the sample distance in the dense region is not affected, while the distance between the sample points in the sparse region and other sample points is enlarged, which increases the robustness of the algorithm to noise points. On this basis, the procedure of utilizing HDBSCAN for ship trajectory clustering in our research is as follows:
First, establish a minimum spanning tree, with the mutual reachable distance between sample points as the edge, and transform the tree into a hierarchical structure. Next, use the input parameter min_cluster_size to find the compressed cluster tree. Finally, the density-adaptive clustering result is obtained through a stability function.
3.5. Clustering Performance Metrics
To evaluate the clustering results, this research proposes a synthetical clustering performance metrics for the clustering results produced by HDBSCAN. Considering practicability and objectivity of clustering performance metrics, two standard internal evaluation indices, the Silhouette Coefficient (SC) [29] and the Davies-Bouldin index (DBI) [30] are integrated to evaluate the performance of the clustering method.
SC measures the compactness of points in the same class compared with points in different classes. The SC value is within [–1, 1], as Equation (5) shows, closing to 1 means that the sample is far away from the adjacent class, which means it has a good clustering effect and high recognition rate. 0 means that the sample is almost on the decision boundary of two adjacent classes, and a negative value means that the sample is divided into the wrong class.
For given clusters, , the sum of the average distance between the samples of two clusters is divided by the distance between the center points of two clusters, . The smaller the average value of each cluster sample is (that is, the samples within the cluster are very close), the smaller the DBI is, and the better the clustering effect is. Then SC and DBI are defined as Equations (5) and (6), respectively.
where, is the cohesion, which measures the average distance between data points within the cluster and represents separation, which measures the minimum average distance of data points to other clusters.
Based on this, a comprehensive clustering performance metrics (CCPM) is proposed to evaluate the clustering results, Then CCPM is defined as Equation (7):
and the larger the CCPM value is, the better the clustering effect is.
3.6. Design of the Algorithm
The whole process of an HDBSCAN-based ship trajectory clustering method algorithm is implemented by Python. Figure 4 shows the flowchart of the whole algorithm:
4. Case Study
In this section, a case study on trajectory clustering with the proposed HDBSCAN-based ship trajectory clustering algorithm is illustrated to verify the method. To do this, an area for the case study is randomly chosen, and the geo-information of the region is extracted within the following boundary: Latitude: 30.8869° N to 31.2915° N; Longitude: 121.6321° E to 122.7477° E. To explicitly demonstrate the effectiveness of the proposed clustering algorithm, and avoid the influence of the poor AIS data, in this case study, the AIS data of the small workboat, pilot ship, work ship, etc. are excluded. The configuration of the case study is shown in Table 1 and the initial ship trajectories in researching waters are shown in Figure 5.
4.1. Data Processing and Similarity Measurement
The first step to apply HDBSCAN-based ship trajectory clustering is to process the AIS data and to measure the similarity of these ship trajectory data. Based on the geo-information of the research region and the setting boundary, we select the AIS data on May 1st in 2019. First, there are 697 ship trajectory sets for cargo ships by reading the initial AIS data. With the trajectory data cleaning method in Section 3.2, 710 ship trajectory sets are obtained. The second step comes to reduce the volume of ship trajectory data by the DP algorithm. To reduce the data points, while maintaining the shape characteristics of the trajectories, we have chosen 111 m as the threshold for each trajectory. In the meantime, the value of it was determined based on the characteristics of the local AIS data and could be further improved with adaptive design to optimize the results. However, since the objective of this step is to accelerate the computation of the similarity matrix, further refinement of the threshold is not included in this work. After the compression procedure, the total data points were then reduced from 373,688 to 7715, the compression ratio up to 97.9%.
On this basis, the similarity measurement method of Section 3.3. is used to measure the similarity of 710 ship trajectories, and the similarity matrix is then obtained. Table 2 shows a partial grid illustration of the final similarity matrix of the trajectories.
4.2. Hierarchical Density-Based Spatial Clustering
The HDBSCAN clustering algorithm clusters the ship trajectory sets using the similarity matrix obtained in Section 4.1. Without losing generality, we set the values of the input parameter from 2 to 100 for both min_cluster_size and min_samples. For the sake of illustration, we choose min_cluster_size = 18, min_samples = 4 as the example.
Firstly, the minimum spanning tree and the cluster hierarchy is established based on the compressed AIS trajectory. The aim is to convert the minimum spanning tree to a graph splitting hierarchy as Figure 6a shows. Secondly, condense the cluster tree from top to bottom through the cluster tree traversal (Figure 6b). i.e., split the condensed node into two parts if, and only if, the trajectory number of two split-generated trajectory clusters is greater than the min_cluster_size (in this example, the value sets as 18). The third step comes to extract the clusters. According to a stability function of the algorithm and the theory of hierarchical clustering, the clustering result is obtained when the clustering stability is optimal. In this example, 12 clusters are extracted, as Figure 6c shows. The final step is visualizing the result of trajectory clustering through the labels of 13 trajectory clusters produced by the HDBSCAN algorithm (Figure 7). Each trajectory cluster is shown in Figure 8.
Inevitably, no matter what clustering algorithm is adopted, noise data exists in the clustering results. Fortunately, HDBSCAN is able to screen out such noise trajectories, as shown in Figure 8(3b,3c). At the same time, the similarity distance among the clusters of some trajectories is so close that they were merged, as shown in Figure 8(2a,2b). A solution will be put forward in Section 5.
4.3. Adaptive Determination of Clustering Numbers
Some methods rely on experience or subjective determination in determining the number of clusters, which contributes to some errors such as k-means, spectral clustering, and DBSCAN. Without loss of generality, the range of the input parameters should be covered as large as possible. Both min_cluster_size and min_samples are set from 2 to 100. By setting this parameter as the optimization criterion, the optimal number of trajectory clusters is selected. With this statistical method, the selecting clustering result could be more objective to a certain extent. One of the problems that arises is to determine the optimal clustering number of the data set.
From an objective point of view, to filter out an appropriate result from the numerous clustering results, clustering performance metrics are used, which has been mentioned in Section 3.4, to select a series of trajectory clustering results when the clustering performance metrics reach the best score.
First, the clustering results of different parameters are classified according to the number of trajectory clustering results. Taking into account the traffic flow in the actual waters, the number of trajectory clusters of cargo ships is limited between 6 and 18. Then, calculate the SC, DBI, and CCPM of each class separately, and output the average score as the final score of the clustering result. Finally, the category with the highest score of CCPM is selected as the output object. The value of clustering performance metrics of each class is shown in Figure 9:
5. Discussion
In the previous section, a series of case studies are conducted to illustrate the process of the HDBSCAN algorithm on trajectory clustering in the area of ship complex confluence. In this section, the algorithm will be discussed in the comparison with the classic DBSCAN algorithm, k-means algorithm, and spectral clustering algorithm. Put forward the solution of a problem that trajectory clusters merge, since the similarity distance between clusters of some trajectories is too small, and the choice of the parameters min_cluster_size for HDBSCAN-based trajectory clustering.
5.1. Comparison with Other Clustering Algorithm
As a comparison, three cases of trajectory clustering with k-means spectral clustering and classic DBSCAN algorithms are shown in Figure 10, Figure 11 and Figure 12, respectively, which use the same AIS data and same similarity matrix. Table 3 gives the description of each method.
To select the best clustering sets of k-means, spectral clustering, and DBSCAN, the method based on the clustering performance metrics CCPM in Section 4.3 is applied, and CCPM change graphs of different algorithms are shown in Figure 10a, Figure 11a and Figure 12a, respectively.
According to the aforementioned figures, the CCPM scores of k-means and spectral clustering algorithms show a downward trend accompanied by oscillation, which means the trend of clustering results are worse with the value of parameter increasing. While the scores of DBSCAN and HDBSCAN both show intermediate peaks, which means both of them may have the best clustering result at the peak point. To prevent the occurrence of local optima, there are clustering results of the highest scoring point and the peak point of oscillation presented, respectively.
It can be seen, from the figures, that the four clustering algorithms all give the final clustering results, but due to the problem of data accuracy, and the character of the partition-based algorithm, they cannot identify the abnormal data and always deal with all data, the clustering effect using k-means and spectral clustering algorithms is not effective, i.e., they are not very good for the AIS trajectory of ships whose data quality is not very high (e.g., it can be seen from Figure 10b–d). Whatever the input parameter n_clusters is set, the clusters are always interspersed with each other, which is reflected, visually, that the colors are very mottled. The spectral clustering shows the same result (Figure 11b,c), but a little better than k-means. In contrast, the DBSCAN and HDBSCAN (Figure 7) mentioned in the case study, the clustering effect is effective, since they are density-based clustering algorithms and have a certain degree of robustness to noisy data, which means they have a better effect on low-quality data clustering (e.g., as shown in Figure 12b,c, there is almost no mottled color anymore, and those abnormal trajectories are either removed or merged into clusters.). Although both algorithms are based on density, the classification of HDSBCAN is clearer than that of DBSCAN. Under the best CCPM, the numbers of clusters of HDBSCAN and DBSCAN are 13 (Figure 9) and 10 (Figure 12a), respectively. This is because the density field parameter eps, used by DBSCAN, is a global variable, while HDBSCAN is density adaptive, that is, under different densities, the density field of HDBSCAN is self-adjusting, which is equivalent to a local variable. The trajectories at the bottom left of the graph are separated by HDBSCAN (Figure 7), which is hard to find with DBSCAN. During the clustering process, DBSCAN is not as robust to data as HDBSCAN. The DBSCAN algorithm treats more trajectories as noise during the clustering process, while HDBSCAN is more tolerant of trajectories. There are a lot of noise trajectories in the actual environment, and due to the accuracy of AIS data, the higher the effect of trajectory clustering and the greater the utilization of data, the more water information we can obtain from it. This demonstrates that the advantages of the HDBSCAN algorithm are self-evident.
5.2. Analysis of the Clustering Results
As shown in Figure 8, the clusters of those similar, but different, trajectories are hard to separate, as mentioned in some cases. In this part, aiming at the problem of it, a method of re-clustering is proposed to optimize the clustering results.
Obviously, the problem is caused by the trajectory similarity scaling, which cannot reach the desired effect. Without adjusting the similarity measure, it may be able to indirectly separate clusters of particularly similar but different trajectories by changing the clustering global variable min_cluster_size. The specific method is to extract those trajectory cluster data based on the results of the first trajectory clustering. Then repeat the clustering work. However, in this process, in order to identify multiple trajectory clusters that cannot be distinguished by the previous clustering, we need to adjust the clustering parameter min_cluster_size according to the actual situation.
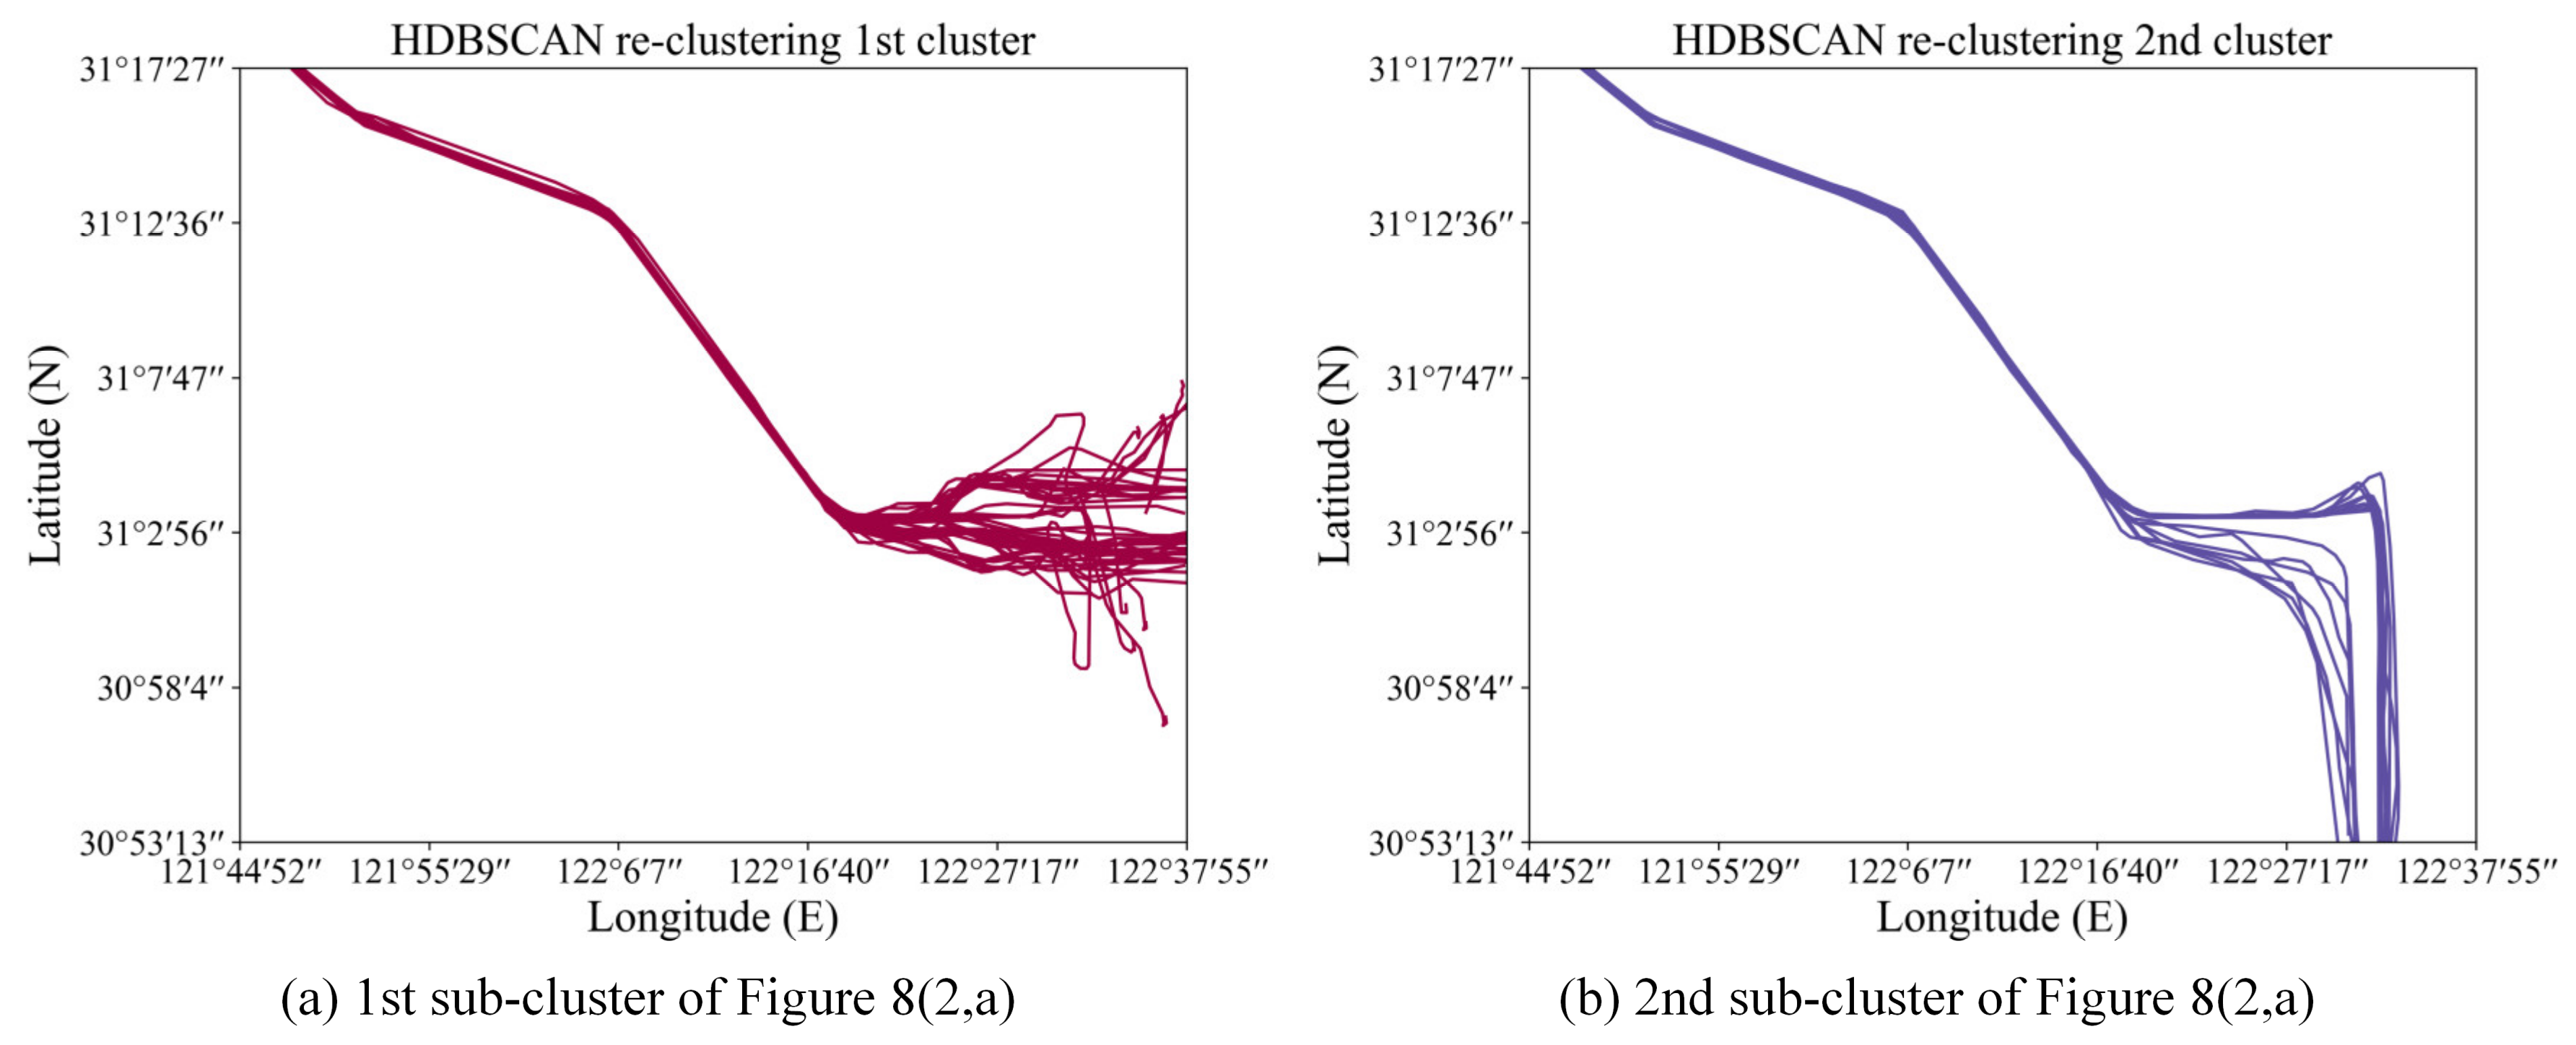
This method re-clusters the clustering results below as Figure 8 shows. The trajectory data in Figure 8(2a) is re-clustered first. As can be seen from Figure 8(2a), since the first half of the trajectory is close together, the two trajectory clusters, that should have been separated, have merged. Through the re-clustering method of trajectories, it optimized the clustering results to distinguish the original two overlapping trajectory segments as Figure 13 shows. The re-clustering result of merged trajectory clusters in Figure 8(2b) is shown in Figure 14. In the process, the only change is resetting the input parameter min_cluster_size and the values of each class are both 4.
The above results can prove that the re-clustering method is feasible. To a certain extent, this method solves the problem of insufficient cluster classification and optimizes the results of clustering.
5.3. Parameter Selection and Sensitivity Analysis
HDBSCAN is a clustering algorithm that combines hierarchy and density. Similar to the classic density-based clustering algorithm DBSCAN, HDBSCAN cannot directly determine the number of clusters through input parameters.
For the parameter min_cluster_size, it can directly control the number of samples of the smallest cluster. From the results of the HDBSCAN clustering analysis, the clustering results are not very sensitive to the minimum cluster size parameter, as long as this parameter is selected small enough to cover all cluster sizes in the data set and large enough to generate between clusters and noise to make a meaningful difference. The change graph of the cluster number n_clusters relative to the HDBSCAN input parameter min_cluster_size provides a relatively simple method. It can determine the appropriate interval of the minimum cluster parameter value through the change in the slope of the scatter plot (Figure 15). Figure 15 indicates that, when the HDBSCAN input parameter is the only min_cluster_size, and its value interval is defined as (2, 100) (considering that the total number of ship trajectories participating in the clustering is 710, the upper limit of the value of min_cluster_size is set to 100), the changing trend of the number of clusters in the clustering result with the value of this parameter.
As can be seen from the figure, as the parameter value increases, the number of clusters decreases sharply at first, then, at the curve, a turning point appears and stabilizes a distance between (13, 25), and the number of clusters is around 8 at this time. Then the curve continues downward, and then no matter how the parameter value increases, the curve tends to be flat. In the initial change of the curve, because the parameter is too small, the algorithm cannot separate the cluster and the noise, resulting in an excessive number of clusters. When the parameter value exceeds 25, the cluster basically tends to remain unchanged because the parameter is too large, and the algorithm has difficulty separating different clusters. Therefore, for this set of data, the value interval of the parameter min_cluster_size should be (13, 25), and the clustering result when the parameter value is 18 is shown in Figure 16.
Under normal circumstances, it is not enough to only determine the size of the smallest cluster, because too large min_cluster_size may merge some similar clusters (Figure 16). In this case, we can reduce the value of the second parameter min_samples (the default is equal to the parameter min_cluster_size) to separate similar clusters (e.g., when we set its value as 4, the clustering result is shown in Figure 7).
6. Conclusions
Ship trajectory records the navigation process and corresponding behavior characteristics of the ship. Through ship trajectory clustering, the behavior of ships can be further analyzed to provide empirical support for various applications, such as path planning and anomaly detection. In this paper, to ensure that trajectory clustering can be robust to noisy data, and to detect clusters with different densities in the process, an HDBSCAN-based ship trajectory clustering method is proposed. Then this method is tested by the AIS data from the Waters of the Yangtze River Estuary. To improve the objectivity of the clustering results and reduce the interference of human factors, based on the SC and the DBI, a clustering performance metrics CCPM is proposed to select clustering results. Moreover, in view of the problem that some clusters are difficult to distinguish, due to the inconspicuous contrast, a re-clustering method is applied to optimize the clustering results.
Besides, three cases based on k-means, spectral clustering, and DBSCAN algorithms of ship trajectory clustering are conducted. Based on the comparison, the advantage of HDBSCAN is proving with strong clustering scalability, which integrates both the advantages of density-based clustering algorithm and hierarchical analysis (i.e., It can not only identify the noise but also cluster ships trajectory of different densities). Besides, the selection method of clustering parameters still has certain limitations (the result is not one, but a series of clustering results), it needs to choose the best combination with the actual water traffic conditions. In the next stage, we will seek the HDBSCAN-based trajectory clustering method with adaptive input parameters.
Through the proposed HDBSCAN-based ship trajectory clustering method, this paper provides a new perspective for extracting the main routes of ships in the waters and seeking trajectory clusters in areas with different ship densities, which can better analyze the traffic conditions of ships in complex waters and facilitate maritime supervision.
Author Contributions
Conceptualization, Methodology, Formal analysis, Investigation, Visualization, Writing-Original manuscript L.W.; Conceptualization, Methodology, Supervision, Writing—Review & Editing P.C.; Methodology, Visualization, Funding acquisition, Writing—Review L.C.; Methodology, Resources, Supervision, Funding acquisition J.M. All authors have read and agreed to the published version of the manuscript.
Funding
This research is financially sponsored by the National Natural Science Foundation of China (Grant No. 52001242) and the Fundamental Research Funds for the Central Universities (WUT: 2021IVA049, 2021IVA051).
Institutional Review Board Statement
Not applicable.
Informed Consent Statement
Not applicable.
Data Availability Statement
Data available on request due to restrictions of privacy.
Conflicts of Interest
The authors declare no conflict of interest.
References
- Mou, J.M.; van der Tak, C.; Ligteringen, H. Study on collision avoidance in busy waterways by using AIS data. Ocean Eng. 2010, 37, 483–490. [Google Scholar] [CrossRef]
- Chen, P.F.; Huang, Y.M.; Mou, J.M.; van Gelder, P.H.A.J.M. Probabilistic risk analysis for ship-ship collision: State-of-the-art. Saf. Sci. 2019, 117, 108–122. [Google Scholar] [CrossRef]
- Chen, P.F.; Huang, Y.M.; Papadimitriou, E.; Mou, J.M.; van Gelder, P. Global path planning for autonomous ship: A hybrid approach of Fast Marching Square and velocity obstacles methods. Ocean Eng. 2020, 214. [Google Scholar] [CrossRef]
- Jain, A.K. Data clustering: 50 years beyond K-means. Pattern Recognit. Lett. 2010, 31, 651–666. [Google Scholar] [CrossRef]
- Zhao, L.B.; Shi, G.Y. A trajectory clustering method based on Douglas-Peucker compression and density for marine traffic pattern recognition. Ocean Eng. 2019, 172, 456–467. [Google Scholar] [CrossRef]
- Grifoll, M.; Karlis, T.; Ortego, M.I. Characterizing the Evolution of the Container Traffic Share in the Mediterranean Sea Using Hierarchical Clustering. J. Mar. Sci. Eng. 2018, 6, 121. [Google Scholar] [CrossRef] [Green Version]
- Malagon Santos, V.; Haigh, I.; Wahl, T. Spatial and Temporal Clustering Analysis of Extreme Wave Events around the UK Coastline. J. Mar. Sci. Eng. 2017, 5, 28. [Google Scholar] [CrossRef] [Green Version]
- Yang, D.; Wu, L.; Wang, S.; Jia, H.; Li, K.X. How big data enriches maritime research—A critical review of Automatic Identification System (AIS) data applications. Transp. Rev. 2019, 39, 755–773. [Google Scholar] [CrossRef]
- Liu, D.P.; Wang, X.; Cai, Y.; Liu, Z.H.; Liu, Z.J. A Novel Framework of Real-Time Regional Collision Risk Prediction Based on the RNN Approach. J. Mar. Sci. Eng. 2020, 8, 224. [Google Scholar] [CrossRef] [Green Version]
- Yuan, G.; Sun, P.; Zhao, J.; Li, D.; Wang, C. A review of moving object trajectory clustering algorithms. Artif. Intell. Rev. 2016, 47, 123–144. [Google Scholar] [CrossRef]
- Wang, X.; Bai, Y. The global Minmax k-means algorithm. Springerplus 2016, 5, 1665. [Google Scholar] [CrossRef] [Green Version]
- Tyagi, L.; Trivedi, M.C. Hybrid K-Mean and Refinement Based on Ant for Color Image Clustering. In Proceedings of the International Conference on ICT for Sustainable Development, Amsterdam, The Netherlands, 29 August–1 September 2016. [Google Scholar]
- Roiha, N.U.; Suprapto, Y.K.; Wibawa, A.D. The optimization of the weblog central cluster using the genetic K-means algorithm. In Proceedings of the Technology of Information & Communication, Moscow, Russia, 20–22 September 2017. [Google Scholar]
- Jiang, Y.; Li, B.; Zhang, H.; Luo, Q.; Zhou, P. A Novel Classification Scheme of Moving Targets at Sea Based on Ward’s and K-means Clustering. In Proceedings of the 2nd International Conference on Computer Science and Application Engineering (CSAE 2018) Hohhot, Hohhot, China, 22–24 October 2018; pp. 1–5. [Google Scholar]
- Ma, W.; Wu, Z.; Yang, J.; Li, W. Vessel Motion Pattern Recognition Based on One-Way Distance and Spectral Clustering Algorithm. In Proceedings of the International Conference on Algorithms & Architectures for Parallel Processing, Dalian, China, 24–27 August 2014. [Google Scholar]
- Nataliani, Y.; Yang, M.-S. Powered Gaussian kernel spectral clustering. Neural Comput. Appl. 2017, 31, 557–572. [Google Scholar] [CrossRef]
- Gao, M.; Shi, G.Y. Ship-handling behavior pattern recognition using AIS sub-trajectory clustering analysis based on the T-SNE and spectral clustering algorithms. Ocean Eng. 2020, 205. [Google Scholar] [CrossRef]
- Zhao, L.; Shi, G.; Yang, J. An adaptive hierarchical clustering method for ship trajectory data based on DBSCAN algorithm. In Proceedings of the IEEE International Conference on Big Data Analysis, Boston, MA, USA, 11–14 December 2017. [Google Scholar]
- Zhao, L.B.; Shi, G.Y. Maritime Anomaly Detection using Density-based Clustering and Recurrent Neural Network. J. Navig. 2019, 72, 894–916. [Google Scholar] [CrossRef]
- Campello, R.; Moulavi, D.; Sander, J. Density-based clustering based on hierarchical density estimates. In Proceedings of the Pacific-Asia Conference on Knowledge Discovery and Data Mining, Gold Coast, Australia, 14–17 April 2013. [Google Scholar]
- Zhang, D.Z.; Lee, K.; Lee, I. Hierarchical trajectory clustering for spatio-temporal periodic pattern mining. Expert Syst. Appl. 2018, 92, 1–11. [Google Scholar] [CrossRef]
- Ghamarian, I.; Marquis, E.A. Hierarchical density-based cluster analysis framework for atom probe tomography data. Ultramicroscopy 2019, 200, 28–38. [Google Scholar] [CrossRef] [PubMed]
- Lentzakis, A.F.; Seshadri, R.; Akkinepally, A.; Vu, V.A.; Ben-Akiva, M. Hierarchical density-based clustering methods for tolling zone definition and their impact on distance-based toll optimization. Transp. Res. Part C Emerg. Technol. 2020, 118. [Google Scholar] [CrossRef]
- Ibrahim, R.; Shafiq, M.O. Mining Trajectory Data and Identifying Patterns for Taxi Movement Trips. In Proceedings of the 2018 Thirteenth International Conference on Digital Information Management (ICDIM), Berlin, Germany, 24–26 September 2018; pp. 130–135. [Google Scholar]
- Wilson, A.T.; Rintoul, M.D.; Valicka, C.G. Exploratory Trajectory Clustering with Distance Geometry. Found. Augment. Cogn. Neuroergon. Oper. Neurosci. 2016, 9744, 263–274. [Google Scholar] [CrossRef]
- Wang, Z.H.; Hu, J.K.; Fan, Q.Q. Extracting the Main Routes and Speed Profiles Between Two Locations from Massive Uncertain Historical Trajectories. In Proceedings of the 2018 International Symposium in Sensing and Instrumentation in IoT Era (ISSI), Shanghai, China, 6–7 September 2018. [Google Scholar]
- Mou, J.; Chen, P.; Yixiong, H.E.; Zhang, X.; Zhu, J.; Rong, H. Fast self-tuning spectral clustering algorithm for AIS ship trajectory. J. Harbin Eng. Univ. 2018, 39, 428–432. [Google Scholar]
- Visvalingam, M.; Whyatt, J.D. The Douglas-Peucker Algorithm for Line Simplification: Re-evaluation through Visualization. Comput. Graph. Forum 1990, 9, 213–225. [Google Scholar] [CrossRef]
- Rousseeuw, P.J. Silhouettes: A graphical aid to the interpretation and validation of cluster analysis. J. Comput. Appl. Math. 1987, 20, 53–65. [Google Scholar] [CrossRef] [Green Version]
- Davies, D.L.; Bouldin, D.W. A cluster separation measure. IEEE Trans. Pattern Anal. Mach. Intell. 1979, 1, 224–227. [Google Scholar] [CrossRef] [PubMed]
Figure 1.
Methodological overview of the research.

Figure 2.
Principle diagram of DP algorithm.

Figure 3.
Principle diagram of Hausdorff distance.

Figure 4.
Flowchart of HDBSCAN based ship trajectory clustering.

Figure 5.
The initial ship trajectories in study waters.

Figure 6.
The procedure of HDBSCAN.

Figure 7.
Results of HDBSCAN clustering of the ship trajectories.

Figure 8.
Illustration of clusters obtained with the proposed method (rows are labelled with numeric value and column is labelled with alphabets).
Figure 8.
Illustration of clusters obtained with the proposed method (rows are labelled with numeric value and column is labelled with alphabets).

Figure 9.
Clustering performance metrics of the proposed method.

Figure 10.
Clustering performance of k-means clustering method with different configurations.

Figure 11.
Clustering performance of spectral clustering method with different configurations.

Figure 12.
Clustering performance of DBSCAN clustering with different configurations.

Figure 13.
Results of Re-clustering of Figure 8(2a) based on HDBSCAN.
Figure 13.
Results of Re-clustering of Figure 8(2a) based on HDBSCAN.

Figure 14.
Results of Re-clustering of Figure 8(2b) based on HDBSCAN.
Figure 14.
Results of Re-clustering of Figure 8(2b) based on HDBSCAN.

Figure 15.
The connection between the minimum cluster and the number of clusters.

Figure 16.
Result of clustering using HDBSCAN with min_cluster_size = 18.


Table 1.
Description of the case study.
| Item | Configuration |
|---|---|
| Boundary | Latitude: 30.8869° N to 31.2915° N; Longitude: 121.6321° E to 122.7477° E |
| The number of research ship trajectories | 791 |
| Trajectory data sources | Yangtze River Estuary, China on 1 May 2019, provided by Wuhan University of Technology |
Table 2.
Partial grid illustration of the final similarity matrix (710*710).
| Nr. | 1 | 2 | 3 | … | 708 | 709 | 710 |
|---|---|---|---|---|---|---|---|
| 1 | 1 | 0.4320 | 0.2169 | … | 0.9393 | 0.9427 | 0.9190 |
| 2 | 0.4320 | 1 | 0.9302 | … | 0.2926 | 0.3319 | 0.2930 |
| 3 | 0.2169 | 0.9302 | 1 | … | 0.1194 | 0.1498 | 0.1204 |
| … | … | ||||||
| 708 | 0.9393 | 0.2926 | 0.1194 | … | 1 | 0.9926 | 0.9556 |
| 709 | 0.9427 | 0.3319 | 0.1498 | … | 0.9926 | 1 | 0.9234 |
| 710 | 0.9190 | 0.2930 | 0.1204 | … | 0.9556 | 0.9234 | 1 |
Table 3.
Descriptions of comparing clustering algorithm.
| No. | Algorithm | Description |
|---|---|---|
| 1 | K-means | A distance-based clustering algorithm that combines simplicity and classics |
| 2 | spectral clustering | The algorithm evolved from graph theory has stronger adaptability to data distribution and less computation |
| 3 | DBSCAN | The classic density-based clustering algorithm can find clusters of arbitrary shape in noisy spatial database |
| 4 | HDBSCAN | A new clustering method combining density clustering and analytic hierarchy process |
Publisher’s Note: MDPI stays neutral with regard to jurisdictional claims in published maps and institutional affiliations. |
© 2021 by the authors. Licensee MDPI, Basel, Switzerland. This article is an open access article distributed under the terms and conditions of the Creative Commons Attribution (CC BY) license (https://creativecommons.org/licenses/by/4.0/).
Share and Cite
MDPI and ACS Style
Wang, L.; Chen, P.; Chen, L.; Mou, J. Ship AIS Trajectory Clustering: An HDBSCAN-Based Approach. J. Mar. Sci. Eng. 2021, 9, 566. https://doi.org/10.3390/jmse9060566
AMA Style
Wang L, Chen P, Chen L, Mou J. Ship AIS Trajectory Clustering: An HDBSCAN-Based Approach. Journal of Marine Science and Engineering. 2021; 9(6):566. https://doi.org/10.3390/jmse9060566
Chicago/Turabian StyleWang, Lianhui, Pengfei Chen, Linying Chen, and Junmin Mou. 2021. "Ship AIS Trajectory Clustering: An HDBSCAN-Based Approach" Journal of Marine Science and Engineering 9, no. 6: 566. https://doi.org/10.3390/jmse9060566
Note that from the first issue of 2016, this journal uses article numbers instead of page numbers. See further details here.