
A Visual Analysis Approach to Understand and Explore Quality Problems of AIS Data


1
Fujian Engineering Research Center of Safety Control for Ship Intelligent Navigation, College of Physics and Electronic Information Engineering, Minjiang University, Fuzhou 350108, China
2
National Engineering Research Center for Water Transport Safety, Wuhan University of Technology, Wuhan 430063, China
3
College of Mathematics and Data Science, Minjiang University, Fuzhou 350108, China
4
Engineering Research Center of Fujian University for Marine Intelligent Ship Equipment, College of Physics and Electronic Information Engineering, Minjiang University, Fuzhou 350108, China
5
Yonsei Frontier Lab, Yonsei University, 50 Yonsei-ro, Seodaemun-gu, Seoul 03722, Korea
*
Author to whom correspondence should be addressed.
J. Mar. Sci. Eng. 2021, 9(2), 198; https://doi.org/10.3390/jmse9020198
Submission received: 19 January 2021
/
Revised: 28 January 2021
/
Accepted: 11 February 2021
/
Published: 13 February 2021
(This article belongs to the Special Issue Control, Guidance, Coordination, and Localization of Autonomous Marine Vehicles)
Abstract
:Low quality automatic identification system (AIS) data often mislead analysts to a misunderstanding of ship behavior analysis and to making incorrect navigation risk assessments. It is therefore necessary to accurately understand and judge the quality problems in AIS data before a further analysis of ship behavior. Outliers were filtered in the existing methods of AIS quality analysis based only on mathematical models where AIS data related quality problems are not utilized and there is a lack of visual exploration. Thus, the human brain’s ability cannot be fully utilized to think visually and for reasoning. In this regard, a visual analytics (VA) approach called AIS Data Quality visualization (ADQvis) was designed and implemented here to support evaluations and explorations of AIS data quality. The system interface is overviewed and then the visualization model and corresponding human-computer interaction method are described in detail. Finally, case studies were carried out to demonstrate the effectiveness of our visual analytics approach for AIS quality problems.
1. Introduction
Automatic identification system (AIS) data are a primary source for maritime supervision and analysis of ship behaviors and they are significant for the research of waterway traffic laws and trends whose accuracy and reliability directly affect the analysis results. However, the raw AIS data usually have a few quality problems such as invalid data, errors, values missing, abnormal values and duplicate records due to the communication link, channel interference and human tampering on AIS equipment, which are also called “dirty” data. Their existence in AIS data significantly affects maritime supervision, ship navigation safety and understanding of the water traffic. For example, normal trajectories are hard to discern in the mixed trajectories when multiple ships share one Maritime Mobile Service Identity (MMSI) number and the assessment and decision-making of safety situations can be negatively influenced. Thus, dirty AIS data should be applied to improve the data quality before further analysis of AIS data.
AIS data quality management includes data profiling, cleaning and transforming and helps to clean up the dirty data and change the data format to meet the given requirements. It particularly needs to infer whether the abnormal AIS data represent any actual data errors by the professional understandings of AIS data profiling. The quality problems in AIS data are usually detected automatically by establishing mathematical models and using rules and thresholds. The quality of uncommon AIS data, which is consistent with the situation at that time, is easily misjudged using these methods. In the case of evaluating AIS data problems, their quality can be quickly and accurately identified by reasoning and judgment with the help of human visual thinking ability while AIS data are visualized. For example, the shapes and density of the trajectories can be utilized to quickly determine whether there are offset, missing or other quality problems in AIS data by drawing a ship’s trajectory in accordance with AIS data.
Raw data are usually filtered in accordance with certain rules or their combinations to clean AIS data. Those data that do not meet the requirements are then directly removed or repaired [1,2]. The evidence reasoning (ER) method was utilized to filter abnormal AIS data and restore the filtered data in combination with ship dynamics [3]. This means that abnormal and missing data would be entirely filtered out. Thus, existing dirty AIS data cleaning methods aim to eliminate the dirty data or ensure they can become “better” regardless of the value of the dirty AIS data and their exploration.
It was pointed out by Andrienko [4,5] and Hammond and Peters [6] that the hidden information in the dirty data should be fully understood. For example, missing AIS data can reflect that a ship may be located in a signal blind area. Thus, more attention should be paid to AIS dirty data. If the information and characteristics of AIS dirty data are effectively mined and utilized, vital supports can be provided for AIS data maintenance and management. Moreover, cleaning and exploration of the dirty data are a cyclic and repeated process. Visual analysis combines the powerful cognitive ability of humans with the efficient computing ability of machines to explore and mine big data through human-computer interactions whose integration with the visual model can be repeatedly utilized to explore different types of quality problems in AIS data for analysis and understanding of causes and the distribution of the quality problems. Thus, a combination of human judgment and human-computer interaction can dominate AIS data quality assessment.
A visual analytics method was put forward and a visual analytics system was developed here to analyze AIS data quality problems. Our major contributions are as follows:
1. A visual analytics method was presented to identify and evaluate the quality of AIS data;
2. A novel visualization model of AIS dirty data was proposed to visually analyze the base station information in AIS data;
3. AIS data with quality problems were explored and discussed by examples to excavate the corresponding hidden significance.
The main part of this study is divided into five sections as follows:
Section 2: Related work;
Section 3: Requirements;
Section 4: AIS Data Quality visualization (ADQvis);
Section 5: Application cases;
Section 6: Conclusions and prospects.
2. Related Work
AIS data quality as a broad research content primarily includes AIS data profiling, cleaning and transforming. Research of data cleaning and exploration of AIS dirty data (especially exploration and analysis of missing, abnormal and duplicate data) were focused here. The preprocessing of AIS dirty data mainly focused on data filtering and repairing in previous studies.
AIS data filtering is primarily used to find and remove data problems that deviate greatly from most AIS data such as data outliers and numerical redundancy in AIS data sources. Most researchers adopted mature data cleaning technologies in the field of database research. However, these technologies are only aimed at tabular data quality problems that are not fully applicable to trajectory data. On this basis, a few scholars have formulated filtering rules of ship attributes and set a threshold for certain attributes and corresponding filtered AIS dirty data. For example, while the range of MMSI and International Maritime Organization (IMO) numbers and the maximum average speed or acceleration of a ship are set and whether it goes beyond is determined, these abnormal data records should be cleared; however, there is no strict discussion on how to determine an appropriate threshold. In studies [3,7,8], by simply setting the filtering threshold, the velocity, heading angle and trajectory position information data are transformed into evidence credibility between 0 and 1. Evidence reasoning (ER) rules and evidential reasoning are utilized to synthesize and realize the identification and cleaning of abnormal data with high recognition accuracy. There can be a drift of trajectory points with the same MMSI for different ships by drawing AIS trajectories during the preprocessing [9]. A simple method was selected to directly remove such data and ensure the data were clean. Clearly, this method would directly result in the loss and waste of data resources; some abnormal ship behavior data would always cover up their behaviors by tampering their own MMSI. The trajectory was firstly segmented in accordance with the time threshold while the abnormal data of the mix trajectory were filtered in light of the speed threshold [10]. Finally, the processed data were utilized for ship classification and the clustering results were displayed on an electronic chart. Gao [11] suggested that the trajectories of different vessels with same MMSI are often mistaken as noise data points because of their usual zigzag shapes. Thus, median or average and Kalman and example filtering methods are usually used to filter these offset points in the preprocessing period. However, these methods only maintain the integrity of a certain trajectory rather than the extraction of multiple trajectories to lose other trajectory data. The abnormal values of raw data were detected and eliminated by means of artificial intelligence or filtering rules for the above method. Those data conforming to the rules were only retained as input for further analysis. Thus, the hidden meaning of the abnormal data cannot be correctly understood in loss and waste of AIS data resources.
AIS data repairing as an approach covers and eliminates those abnormal data with proper trajectory data; moreover, the ship maneuverability model and trajectory prediction method were mainly adopted to restore problem trajectory data. Due to the loss of packets causing the incompleteness of data during transmission or filtering of abnormal data, the trajectory should be necessarily reconstructed to repair AIS data [12]. Linear interpolation is one of the fastest and simplest algorithms being commonly applied in short-distance trajectory reconstructions [13]. The maneuverability of the ship is taken into account and the trajectory is repaired by dividing the ship’s trajectory into three parts (namely straight, curve and rotation) [7]. Unluckily, this is not suitable for long-distance trajectory repairing. A data-driven method was applied to predict a ship’s trajectory and fill the missing data in accordance with its historical trajectory data [14]. Experiments have shown that this method can effectively recover long-term missing trajectories. The above methods are primarily used to cover or fill in the missing and filtered abnormal data of the raw AIS data so that complete trajectory data can be reconstructed for subsequent analysis. However, missing AIS data cannot be ignored and they may also imply critical information. Thus, analysis results would be one-sided if the missing AIS data were not taken into account.
Data quality analysis as an iterative process is necessarily integrated with automatic calculating technology and the human experiences and expertise to make a comprehensive judgment. Thus, the means to combine the data visualization technology and human visual cognition ability based on human-computer interaction is suitable in data visualization analysis. Visual analysis was recently popular for data cleaning [15]. Studies on data quality management and visual analysis (especially those focusing on data cleaning) were summarized and discussed [16]. An iterative and progressive visual analysis framework was then proposed based on the data cleaning process designed by Van den Broeck. The data quality problems still existed at this stage after data cleaning. A visual analysis method was presented to not only deal with data quality problems after preprocessing but also to support data analysis [17]. Finally, the case study of Bogota’s public transport system presents such a fact that the method can achieve analysis (such as data quality assessment).
Visual analysis is applied in data quality analysis in many fields. Linked business data were taken as the research object; a visual analysis framework was correspondingly put forward by integrating the previous empirical rules and a visual display dashboard was designed to evaluate the data quality based on sharing business data [18]. Stacking charts and text display visualization methods were utilized to helpfully explore the data quality of open data and select high-quality data versions for analysis [19]. The quality metrics were applied to evaluate the quality of tabular data [20]. Different visual representations were then designed for various data metrics and the MetricDoc system was developed to support the exploration of quality problems based on the interaction of data quality metrics. Finally, an analysis of open network test data indicated that the system could accurately reveal the quality problems of the data. The design shortages of the visual analysis of the data quality were discussed previously [21]. The impact of various visualization models was revealed on the detection of data quality problems by cases and suggestions were provided on the visual analysis design of data quality. In view of the shortcomings of the previous data profiling methods that cannot support time series data cleaning, a two-dimensional heat map, table display and human-computer interaction methods were integrated to design a visual analytics system and support understanding of the quality issues in time series data [22].
AIS data as a kind of spatiotemporal data are different from tabular data in that they have spatiotemporal distribution characteristics. Similarly, AIS data have the characteristics of not only time series but also spatial distribution. Thus, the aforementioned methods cannot fully display the data quality problems but AIS dirty data, which mainly contains missing and abnormal data, cannot be explored comprehensively. The visualization of missing and abnormal data is elaborated on below.
Missing data are often overlooked. Even if they are crucial, a few visual analysis methods only use the remaining data and draws corresponding conclusions. Missing data have been visualized by means of the polyline with faults [23]. The visualization method was applied to display the missing data by lowering the hue while keeping the outline smooth and bright [24]. The possible range of missing data was calculated by the statistical method and the uncertainty of missing data was visualized by a boxplot [25]. Vacancy, ambiguity and vacancy annotation were applied in the visualization model [26]. A practical analysis showed that the vacancy annotation method is more helpful for users to understand the missing data. A visual analysis was performed by Andrienko [5] to discover the location of tunnels in cities by showing the absence of vehicle movement data. A set of processes and methods was proposed to understand data quality by visual analysis and different visualization models were applied to display and analyze mobile data. The results showed that missing data could be effectively found and their occurrence causes were explained clearly.
Overall, various visual models can be applied to display the missing data. Their effects are different where inappropriate visualization models can even mislead analysts. The problem of missing data in time series data was discussed to study how the visualization models and data repair methods affect the analysts’ judgment on the quality of raw data [27]. Design suggestions were then presented for a visual analysis of the missing data. Missing data were regarded as an uncertainty of data quality [28]. The uncertainty visualization method of cultural collection data was subsequently discussed and the feasibility of various visualization models was analyzed. Unfortunately, missing data were not explored in the above studies to reflect their hidden laws and surrounding environment characteristics.
In view of abnormal data visualization, abnormal AIS data refers to those data that deviate significantly from most data. Road network information was utilized for the abnormal trajectory and a two-dimensional map was projected for visualization [29]. As parallel coordinates can represent the hidden relationships of various dimensions in high-dimensional data, they were applied in network security anomaly detection [30] and the results indicated that this method could detect network risks in time. An abnormal visualization model was proposed based on the spherical visualization model in three dimensional space [31] and the results showed that it can represent network activities and achieve network security supervision. A semi-supervised active learning method was utilized and the visualization of trajectory features was applied to mine anomalies in taxi data and evaluate the data quality [31,32]. The visualization and human-computer interaction were combined to select abnormal data from raw positioning data and use machine learning to discover more abnormal values [33]. Data quality was then detected and evaluated. Further research was rarely carried out for the distribution patterns of those detected abnormal data so far.
Based on the above-mentioned shortcomings of AIS data quality research and application examples of data quality analysis, it was found that the current AIS quality analysis primarily lies in how to filter out or clean dirty data. Rather, the dirty data that are valuable inherently cannot be ignored in AIS data. Thus, a visual analytics system was designed here to overcome this shortcoming and explore and recycle the dirty data in massive AIS data. The specific requirements are described in detail in the next section.
3. Requirements
For filling the aforementioned gaps, a visual analytics approach was designed and developed to explore and analyze dirty data. Based on our discussion and review in Section 2, the tasks for exploring AIS data quality were configured as follows:
T1: Identifying and filtering out various kinds of data quality issues;
T2: Exploring the spatiotemporal distribution of dirty data;
T3: Exploring the relationship between dirty data and environmental factors;
T4: Analyzing causes of data quality problems.
For successfully implementing an environment that supported these analysis and exploration tasks, the following requirements were presented before the development of our ADQvis system:
R1: Data quality identification. The visual analytics (VA) approach should be able to help users to quickly identify data quality issues by a reasonable visualization model. Moreover, interactions with the visualization model should be supported to select specific dirty data.
R2: Dirty data distribution. A visual overview of the dirty data distribution should be provided. The details of the overall distribution should be observed and further explored by appropriate human-computer interactions.
R3: Dirty data relevance exploration. The relevance between dirty data and other factors such as navigation environment and vessel static features should be intuitively discovered by applying the customized visualization model. Users should be supported to interactively explore the association information between the different attributes.
R4: Data interactive filtering. It is necessary to help users to realize data interactive filtering and exploration using time-range screening tools such as a calendar and spatial brushing tools (area selection). Moreover, human-computer interactions should be designed to transform and interact with the data behind the designed visualization model.
4. ADQvis
The overall system architecture, analysis process, visual design and human-computer interaction of ADQvis, an environment for the visual analysis and exploration of AIS quality issues, are presented in detail here. Based on Bokeh’s server backend, ADQvis was developed by using a browser-server architecture that ensured that the system could have not only stronger data processing capabilities but also the stability for data management. In combination with the Bokeh library and interaction of the web browser, the system has a more flexible exploration environment and the ability for the analysis of AIS data quality with both dynamic and static information.
4.1. User Interface
The interface design of ADQvis (Figure 1a) included an AIS time filtering tool in the form of a calendar table. It could realize the filtering display of our object ship’s trajectory by combining the single selection and multi selection of MMSI. The overall distribution map based on the track of the OSM (Open street map, Figure 1b) showed the overview and details of the dynamical and interactive distribution of the ship’s geographical location by zooming in and out of the map. The scatter plot of the differential distance of trajectory points (Figure 1c) provided a visual exploration environment to quickly distinguish data quality problems. A custom configuration for various visualization models could be modified by a slider widget (Figure 1d). Moreover, the visualization model of a four image stacked graph (Figure 1e) was designed to realize the association analysis of AIS dirty data and other attribute features. In the figure, the symbol D represents the distance between the adjacent trajectory points of a unified ship and the symbol T represents the time between adjacent trajectory points. The symbol m is the unit of D, which means the meter. The symbols of s, min and h are the units of T, representing seconds, minutes and hours, respectively.
The analysis flow of the visual exploration is schematically shown in Figure 2. First of all, the differential distance was calculated from the raw data and displayed in a scatter plot. According to the visualization of distance in the scatter plot, the data quality problems were identified and their spatiotemporal distribution was displayed on the OSM by interacting with the scatter plot. Finally, the hidden values of dirty data were explored by interaction and observation with the distribution graph and the four quadrant stack graph.
4.2. Visual Exploration Environment
Our visualization design mainly consisted of an OSM, a scatter plot of differential distance, a ship track detail map and a stacking map. The details are as follows.
4.2.1. Scatter Plot of the Differential Distance
The scatter plot of the differential distance was composed of a horizontal axis and a vertical axis representing the time and distance differences of adjacent trajectory points of one vessel, respectively. In a schematic scatter plot (Figure 3), the maximum and minimum speed lines and the maximum timeline are in red, green and yellow, respectively. Figure 3 is divided into normal, abnormal, static and AIS data missing areas by these lines. The time and distance differences of a trajectory point that fell into the normal meant that it was normal. If the time difference was too small but the distance was large, it meant that the ship moved far in a short time and this was an abnormal point. If the time difference was large but the distance difference was small, the ship basically stayed in place for a long time so that there would be many redundant data. If the time and distance differences were large but the speed was in the normal range, it meant that data were missing. The actual effect is shown in Figure 4 where different kinds of trajectory points selected in the human-computer interaction tool are in red and yellow, respectively.
4.2.2. Four Quadrant Stack Graph
The four quadrant stack graph was composed of a stack and flow graph for local and global base stations in different colors. The data of the flow graph on the right side was composed of stacked data at different times. An analysis of the model adopted the clockwise system and the method of one-to-one comparative analysis is shown with arrows in Figure 5. It indicated that the proportion of each base station in the local flow graph could be analyzed based on a comparison of the local stack diagram in the upper left corner with the local flow graph in the upper right corner. The correlation of the volume in different periods was analyzed based on a comparison of the local flow graph on the upper right and the global flow graph on the lower right. The comparison between the lower right corner and the lower left corner could be applied to analyze the structure relationship of each base station stack in each flow graph. In the lower left corner and the upper left corner, the ratio between local traffic volume and global traffic volume in each period in a single base station was analyzed. A crosshair line was applied to facilitate a comparison of data flows in each graph at the same time.
4.2.3. Data Distribution
The OSM platform provided basic map editing components and supported common trajectory display operations. Due to its open source characteristics, users can draw points, lines and other data freely according to their own data. For this, the OSM map system (Figure 6) was applied as the geographic information background for data display where the geographical distribution of the trajectory points belonging to the selected MMSI was displayed in blue dots. The density distribution of the track points in different geographical locations was observed by adjusting the transparency. Moreover, details of the ship’s trajectory could be observed by connecting the trajectory points with selected MMSI.
4.3. Interaction
According to our design rules, overview, zoom, filtering and detailed interactive explorations were performed sequentially and then the corresponding visual model interaction tools were developed.
4.3.1. Selection on The Map
In addition to the basic operations such as zooming in/out and panning, the map part also included a Lasso Selection, Box Selection and so on. Lasso Selection could more freely filter the trajectory in any shape. As shown in Figure 7, a more free and convenient selection could be performed with the Lasso Selection when there were multiple tracks and they were relatively dense.
4.3.2. Selection on The Scatter Plot
The box selection of a scatter plot was similar to the above map. The selected data points were highlighted in red and the corresponding points being selected in the scatter plot were displayed similarly in the map. For example, those points in the left and right were in red (Figure 8).
In addition, hovering over the corresponding data points could display the specific information of data in the case of selecting the information tooltip such as time, MMSI and speed (Figure 9).
4.3.3. Interaction with a Four Quadrant Stack Graph
The interaction with a four quadrant stack graph shown in Figure 10 was mainly as follows:
1. Basic operations of a stack graph were zooming in/out, panning, view revoking and resetting and hovering the mouse on the graph to display the corresponding details.
2. By clicking the target base station stack diagram in the graph, the density distribution of the AIS trajectory points received by the base station could be shown on the map.
3. Through the box selection of the corresponding period, AIS data could be filtered in the time dimension. The density distribution of selected AIS trajectory points could be displayed on the map.
5. Use Cases
5.1. Abnormal Data Analysis
In a scatter chart of a spatiotemporal differential distance, any point located at the upper left corner referred to a trajectory segment that had a short time interval but long moving distance. As shown in Figure 11, the abnormal trajectory points of vessels could be extracted by observing and selecting the points in the upper left corner.
Selected points were then marked in red both on the OSM and scatter charts. Moreover, MMSI belonging to these points appeared in the list at the left side. By clicking specific MMSI numbers, the corresponding trajectories were displayed. Through the above interactions, it was found that there were two kinds of frequent trajectory anomalies.
The most remarkable findings of our analysis were that a zigzag shape trajectory (Figure 12a) was formed by moving and stationary vessels. According to the observation, it inferred that two vessels sharing same MMSI, which were tampered with by crews, caused such a case. Thus, the trajectory would be intertwined together when two vessels with the same MMSI displayed the same movement in the same period.
Additionally, the trajectory deviated frequently from the normal trajectory. When vessels were moving near to the land or a bridge, such phenomenon usually occurred (Figure 12b). It may suggest that AIS data transmitting was interfered with by the radio signal broadcast from the station on land and the buildings over a navigation channel so that the moving trajectory points may drift.
5.2. Data Missing Analysis
A large amount of AIS data missing to a certain extent represented the existence of blind spots in this area. A four quadrant stack graph was applied here to explore the missing data. Firstly, the area where AIS data were frequently lost were discovered by selecting points in a scatter plot. Secondly, the area of interest could be located on the map and the corresponding missing data could be filtered out to seek any pattern at the aspect of time attribute. Thirdly, the overview of AIS data in the area was displayed and the data receiving of the base station was visualized by a stacked graph. Finally, the base station and the amount of AIS data were analyzed at the moment when data were missing. If any user was interested in AIS data reported in river branches, they could brush this area to select the data. A combined selection of a multiple area was supported by holding on the shift key and brushing any area of interest.
As shown in Figure 13, the 24 h data flow graph of a base station could also be observed from the four quadrant stack graph according to the above process. The base station receiving the data and the time period of occurrence could be found out by an interactive selection in the map and the scatter plot. Thus, it was easy to judge and compare the data reception and loss at each base station.
For exploring the relationship between missing data and their load of each base station, the missing data were filtered through a scatter plot. As shown in Figure 14, the left side represented the base station where data were missing and the time and data distributions. The right side displayed the flow graph of the corresponding base station workload. Additionally, various base stations were marked in different colors and the number of each base station could be obtained by hovering the mouse over them.
Base Station No. 4121244 was focused on by the zooming tool. As shown in Figure 15, a comparison of the peak value of missing data on the left and that received by the base station on the right indicated that its total reception amount was proportional to its amount of missing data. A similar correlation existed for missing data of any other base station.
In addition, the geographic distribution of the missing data could be figured out by clicking on the stack graph on the left, which provided a reference for a further construction of the AIS base station (Figure 16).
5.3. Relevance Exploration of Dirty Data
The generation of dirty data is not an isolated phenomenon; it is related to the navigation environment, the coverage of the base station and other attributes of itself. Therefore, exploring the relevance between dirty data and their attributes helps the analyst to mine meaningful information from dirty data. The relevance between dirty data and their attributes such as base station information was explored here through a four quadrant stack graph.
1. The stack graph indicated that the receiving base station of a ship also changed as it traveled through different river channels with time. As shown in Figure 17, the main data were received by the light green base station at the beginning of the track and the dark green and purple base stations were evolved in sequence.
2. There was a positive correlation between the number of messages received by multiple base stations. As shown in Figure 18, the river section near Shipai Village was selected. Its upper left corner indicated that there was a remarkable simultaneous growth or reduction between the green and purple base stations. An observation of the specific track showed that the same track was commonly composed of data received by multiple base stations, which were not only received by a single base station. Thus, multiple base stations nearby received the data at the same time when a ship passed the river channel so that the phenomenon of rising and falling in the stack graph occurred. The overall curve envelope of the flow graph was also the same as that for most base stations.
Due to the mechanism of multiple base stations receiving the same part of the river when some base stations did not work, other base stations could receive ship data that the fault base station was responsible for. As shown in Figure 19, the blue base station had data disconnection near 6–8 o’clock in the morning. The main distribution of the trajectory points that were received could be displayed by selecting the data of the base station in any other period.
All data in a fault period for a base station could be selected by using the river map time filtering tool. The observation of received AIS data indicated that the nearby base stations would support the retrieving of the data in case the main base station was under failure so that the trajectory data of the river section could be presented completely during the failure period.
6. Conclusions and Prospects
A visual analytical approach for AIS dirty data exploration was established here based on an OSM where a scatter plot that displayed the spatiotemporal distance of AIS data was cut into various areas and AIS dirty data were selected in accordance with the differential distance between the trajectory points in the spatiotemporal space. Moreover, the relevance between the dirty data and the environmental factors were explored by interactions with our four quadrant stack graph. The primary conclusions of this study are listed as follows:
1. Compared with the traditional AIS data quality analysis method, our visual analytics approach presented the characteristics of intuitive display and flexible interactions to rapidly identify and explore AIS data quality issues.
2. Our ADQvis system that was applied in the empirical study of AIS data in the Wuhan Section focused on two kinds of typical dirty data (namely abnormal and missing data). The distribution of base station blind areas in the Wuhan Section and causes of AIS abnormal data could be obtained, which showed that our approach in data quality study could be put into practical applications.
Further research should be conducted from the following aspects:
1. The scalability of the system will necessarily be improved to meet the visual analysis of massive AIS historical data. Thus, the visual model can be generated and interacted more smoothly and quickly when a great number of data are input.
2. This study focuses on data quality analysis and the exploration of abnormal and missing data. However, AIS data quality issues are broad, which primarily include invalid, redundant and duplicate data. How to apply our visual analysis to these data shall be centralized in future.
Author Contributions
Conceptualization, X.C. and J.L.; methodology, S.X. and W.H.; software, Z.L, C.Z. and J.L.; writing—review and editing, W.H. and Z.L.; funding acquisition, W.H. All authors have read and agreed to the published version of the manuscript.
Funding
This research was funded by the Fujian Province Natural Science Foundation (No: 2018J01506,2020J01860) and University-industry cooperation program of the Department of Science and Technology of the Fujian Province (No.2019H6018) and The Key Project of Science and Technology of Wuhan (No.201701021010132).
Institutional Review Board Statement
Not applicable.
Informed Consent Statement
Not applicable.
Data Availability Statement
Not applicable.
Acknowledgments
We thank two anonymous reviewers for their constructive comments, which helped us to improve the manuscript.
Conflicts of Interest
The authors declare no conflict of interest.
References
- Lei, J.L.; Chu, X.M.; He, W.; Zhou, Y.P. Visual analytic system of vessel traffic in bridge waterway. J. Shanghai Jiaotong Univ. 2017, 51, 840–845. [Google Scholar]
- Shi, J.H.; Liu, Z.J. Deep Learning in Unmanned Surface Vehicles Collision-Avoidance Pattern Based on AIS Big Data with Double GRU-RNN. J. Mar. Sci. Eng. 2020, 8, 682. [Google Scholar] [CrossRef]
- Liu, X.L.; Chu, X.M.; Ma, F.; Lei, J.Y. Discriminating method of abnormal dynamic information in AIS messages. J. Traffic Transp. Eng. 2016, 16, 142–150. [Google Scholar]
- Andrienko, G.; Andrienko, N.; Bak, P.; Keim, D.; Wrobel, S. Visual Analytics of Movement; Springer Science & Business Media: Berlin, Germany, 2013. [Google Scholar]
- Andrienko, G.; Andrienko, N.; Fuchs, G. Understanding movement data quality. J. Locat. Based Serv. 2016, 10, 31–46. [Google Scholar] [CrossRef]
- Hammond, T.R.; Peters, D.J. Estimating AIS coverage from received transmissions. J. Navig. 2012, 65, 409–425. [Google Scholar] [CrossRef] [Green Version]
- Sang, L.Z.; Wall, A.; Mao, Z.; Yan, X.P.; Wang, J. A novel method for restoring the trajectory of the inland waterway ship by using AIS data. Ocean Eng. 2015, 110, 183–194. [Google Scholar] [CrossRef] [Green Version]
- Ma, F.; Chu, X.M.; Liu, C.G. The error distinguishing of automatic identification system based on improved evidence similarity. In ICTIS 2013: Improving Multimodal Transportation Systems-Information, Safety, and Integration; American Society of Civil Engineer: Wuhan, China, 2013. [Google Scholar]
- Wei, Z.K. The Vessels Trajectory Clustering and Its Applications Based on AIS. Master Thesis, Dalian Maritime University, Dalian, China, 2015. [Google Scholar]
- Kraus, P.; Mohrdieck, C.; Schwenker, F. Ship classification based on trajectory data with machine-learning methods. In Proceedings of the International Radar Symposium, Bonn, Germany, 20–22 June 2018. [Google Scholar]
- Gao, Q.; Zhang, F.L.; Wang, R.J.; Zhou, F. Trajectory big data: A review of key technologies in data processing. J. Softw. 2017, 28, 959–992. [Google Scholar]
- Pietrzykowski, Z.; Wielgosz, M.; Breitsprecher, M. Navigators’ Behavior Analysis Using Data Mining. J. Mar. Sci. Eng. 2020, 8, 50. [Google Scholar] [CrossRef] [Green Version]
- Pu, J.S.; Qu, H.M.; Ni, L. Survey on visualization of trajectory data. J. Comput. -Aided Des. Comput. Graph. 2012, 24, 1273–1282. [Google Scholar]
- Zhong, C.; Jiang, Z.L.; Chu, X.M.; Liu, L. Inland ship trajectory restoration by recurrent neural network. J. Navig. 2019, 72, 1359–1377. [Google Scholar] [CrossRef]
- Wang, Z.; Yuan, X.; Ye, T.; Hao, Y.; Chen, S.; Liangk, J.; Wu, Y. Visual data quality analysis for taxi GPS data. In Proceedings of the IEEE Conference on Visual Analytics Science and Technology, Chicago, IL, USA, 25–30 October 2015. [Google Scholar]
- Liu, S.; Andrienko, G.; Wu, Y.; Cao, N.; Jiang, L.; Shi, C.; Hong, S. Steering data quality with visual analytics: The complexity challenge. Vis. Inform. 2018, 2, 191–197. [Google Scholar] [CrossRef]
- Triana, J.A.; Zeckzer, D.; Hagen, H.; Hernandez, J.T. VafusQ: A methodology to build visual analysis applications with data quality features. Inf. Vis. 2019, 18, 384–404. [Google Scholar] [CrossRef]
- Gürdür, D.; El-khoury, J.; Nyberg, M. Methodology for linked enterprise data quality assessment through information visualizations. J. Ind. Inf. Integr. 2019, 15, 191–200. [Google Scholar] [CrossRef] [Green Version]
- Bors, C.; Gschwandtner, T.; Kriglstein, S.; Miksch, S.; Pohl, M. Visual interactive creation, customization, and analysis of data quality metrics. J. Data Inf. Qual. 2018, 10, 1–26. [Google Scholar] [CrossRef]
- Bors, C.; Gschwandtner, T.; Miksch, S. Visually Exploring Data Provenance and Quality of Open Data. In Proceedings of the European Conference on Visualization, Brno, Czech Republic, 4–8 June 2018. [Google Scholar]
- Borovina Josko, J.M.; Ferreira, J.E. Visualization properties for data quality visual assessment: An exploratory case study. Inf. Vis. 2017, 16, 93–112. [Google Scholar] [CrossRef]
- Gschwandtner, T.; Erhart, O. Know your enemy: Identifying quality problems of time series data. In Proceedings of the IEEE Pacific Visualization Symposium, Kobe, Japan, 10–13 April 2018. [Google Scholar]
- Kandel, S.; Heer, J.; Plaisant, C.; Kennedy, J.; Van Ham, F.; Riche, N.H.; Buono, P. Research directions in data wrangling: Visualizations and transformations for usable and credible data. Inf. Vis. 2011, 10, 271–288. [Google Scholar] [CrossRef] [Green Version]
- Twiddy, R.; Cavallo, J.; Shiri, S.M. Restorer: A visualization technique for handling missing data. In Proceedings of the IEEE Proceedings on Visualization, Washington, DC, USA, 21 October 1994. [Google Scholar]
- Bögl, M.; Filzmoser, P.; Gschwandtner, T.; Miksch, S.; Aigner, W.; Rind, A.; Lammarsch, T. Visually and statistically guided imputation of missing values in univariate seasonal time series. In Proceedings of the 2015 IEEE Conference on Visual Analytics Science and Technology, Chicago, IL, USA, 25–30 October 2015. [Google Scholar]
- Andreasson, R.; Riveiro, M. Effects of visualizing missing data: An empirical evaluation. In Proceedings of the International Conference on Information Visualisation, Paris, France, 16–18 July 2014. [Google Scholar]
- Song, H.; Szafir, D.A. Where’s my data? Evaluating visualizations with missing data. Ieee Trans. Vis. Comput. Graph. 2018, 25, 914–924. [Google Scholar] [CrossRef] [PubMed]
- Windhager, F.; Salisu, S.; Mayr, E. Exhibiting uncertainty: Visualizing data quality indicators for cultural collections. Informatics 2019, 6, 29. [Google Scholar] [CrossRef] [Green Version]
- Liu, C.H. Visual Cleaning System for Traffic Positioning Data. Master Thesis, Zhejiang University of Technology, Hangzhou, China, 2017. [Google Scholar]
- Lee, C.P.; Trost, J.; Gibbs, N.; Beyah, R.; Copeland, J.A. Visual firewall: Real-time network security monitor. In Proceedings of the IEEE Workshop on Visualization for Computer Security, Minneapolis, MN, USA, 26 October 2005. [Google Scholar]
- Wang, M.J.; Pan, Q.M.; Liu, Z.; Chen, W. Survey of visualization data cleaning. J. Image Graph 2015, 20, 468–482. [Google Scholar]
- Liao, Z.; Yu, Y.; Chen, B. Anomaly detection in GPS data based on visual analytics. In Proceedings of the IEEE Symposium on Visual Analytics Science and Technology, Salt Lake City, UT, USA, 25–26 October 2010. [Google Scholar]
- Wu, Y.D.; Jiang, H.Y.; Zhao, S.R.; Li, B. 3D visualization method for network security data. J. Univ. Electron. Sci. Technol. China 2015, 44, 594–598. [Google Scholar]
Figure 1.
User interface of automatic identification system (AIS) Data Quality visualization (ADQvis). The interface design of ADQvis (a) included an AIS time filtering tool in the form of a calendar table. The overall distribution of ship’s location showed in the OSM (Open street map, b). The scatter plot of the differential distance of trajectory points (c) provided a visual exploration environment. A custom configuration for various visualization models could be modified by a slider widget (d). Moreover, the visualization model of a four image stacked graph (e) was designed to realize the association analysis.
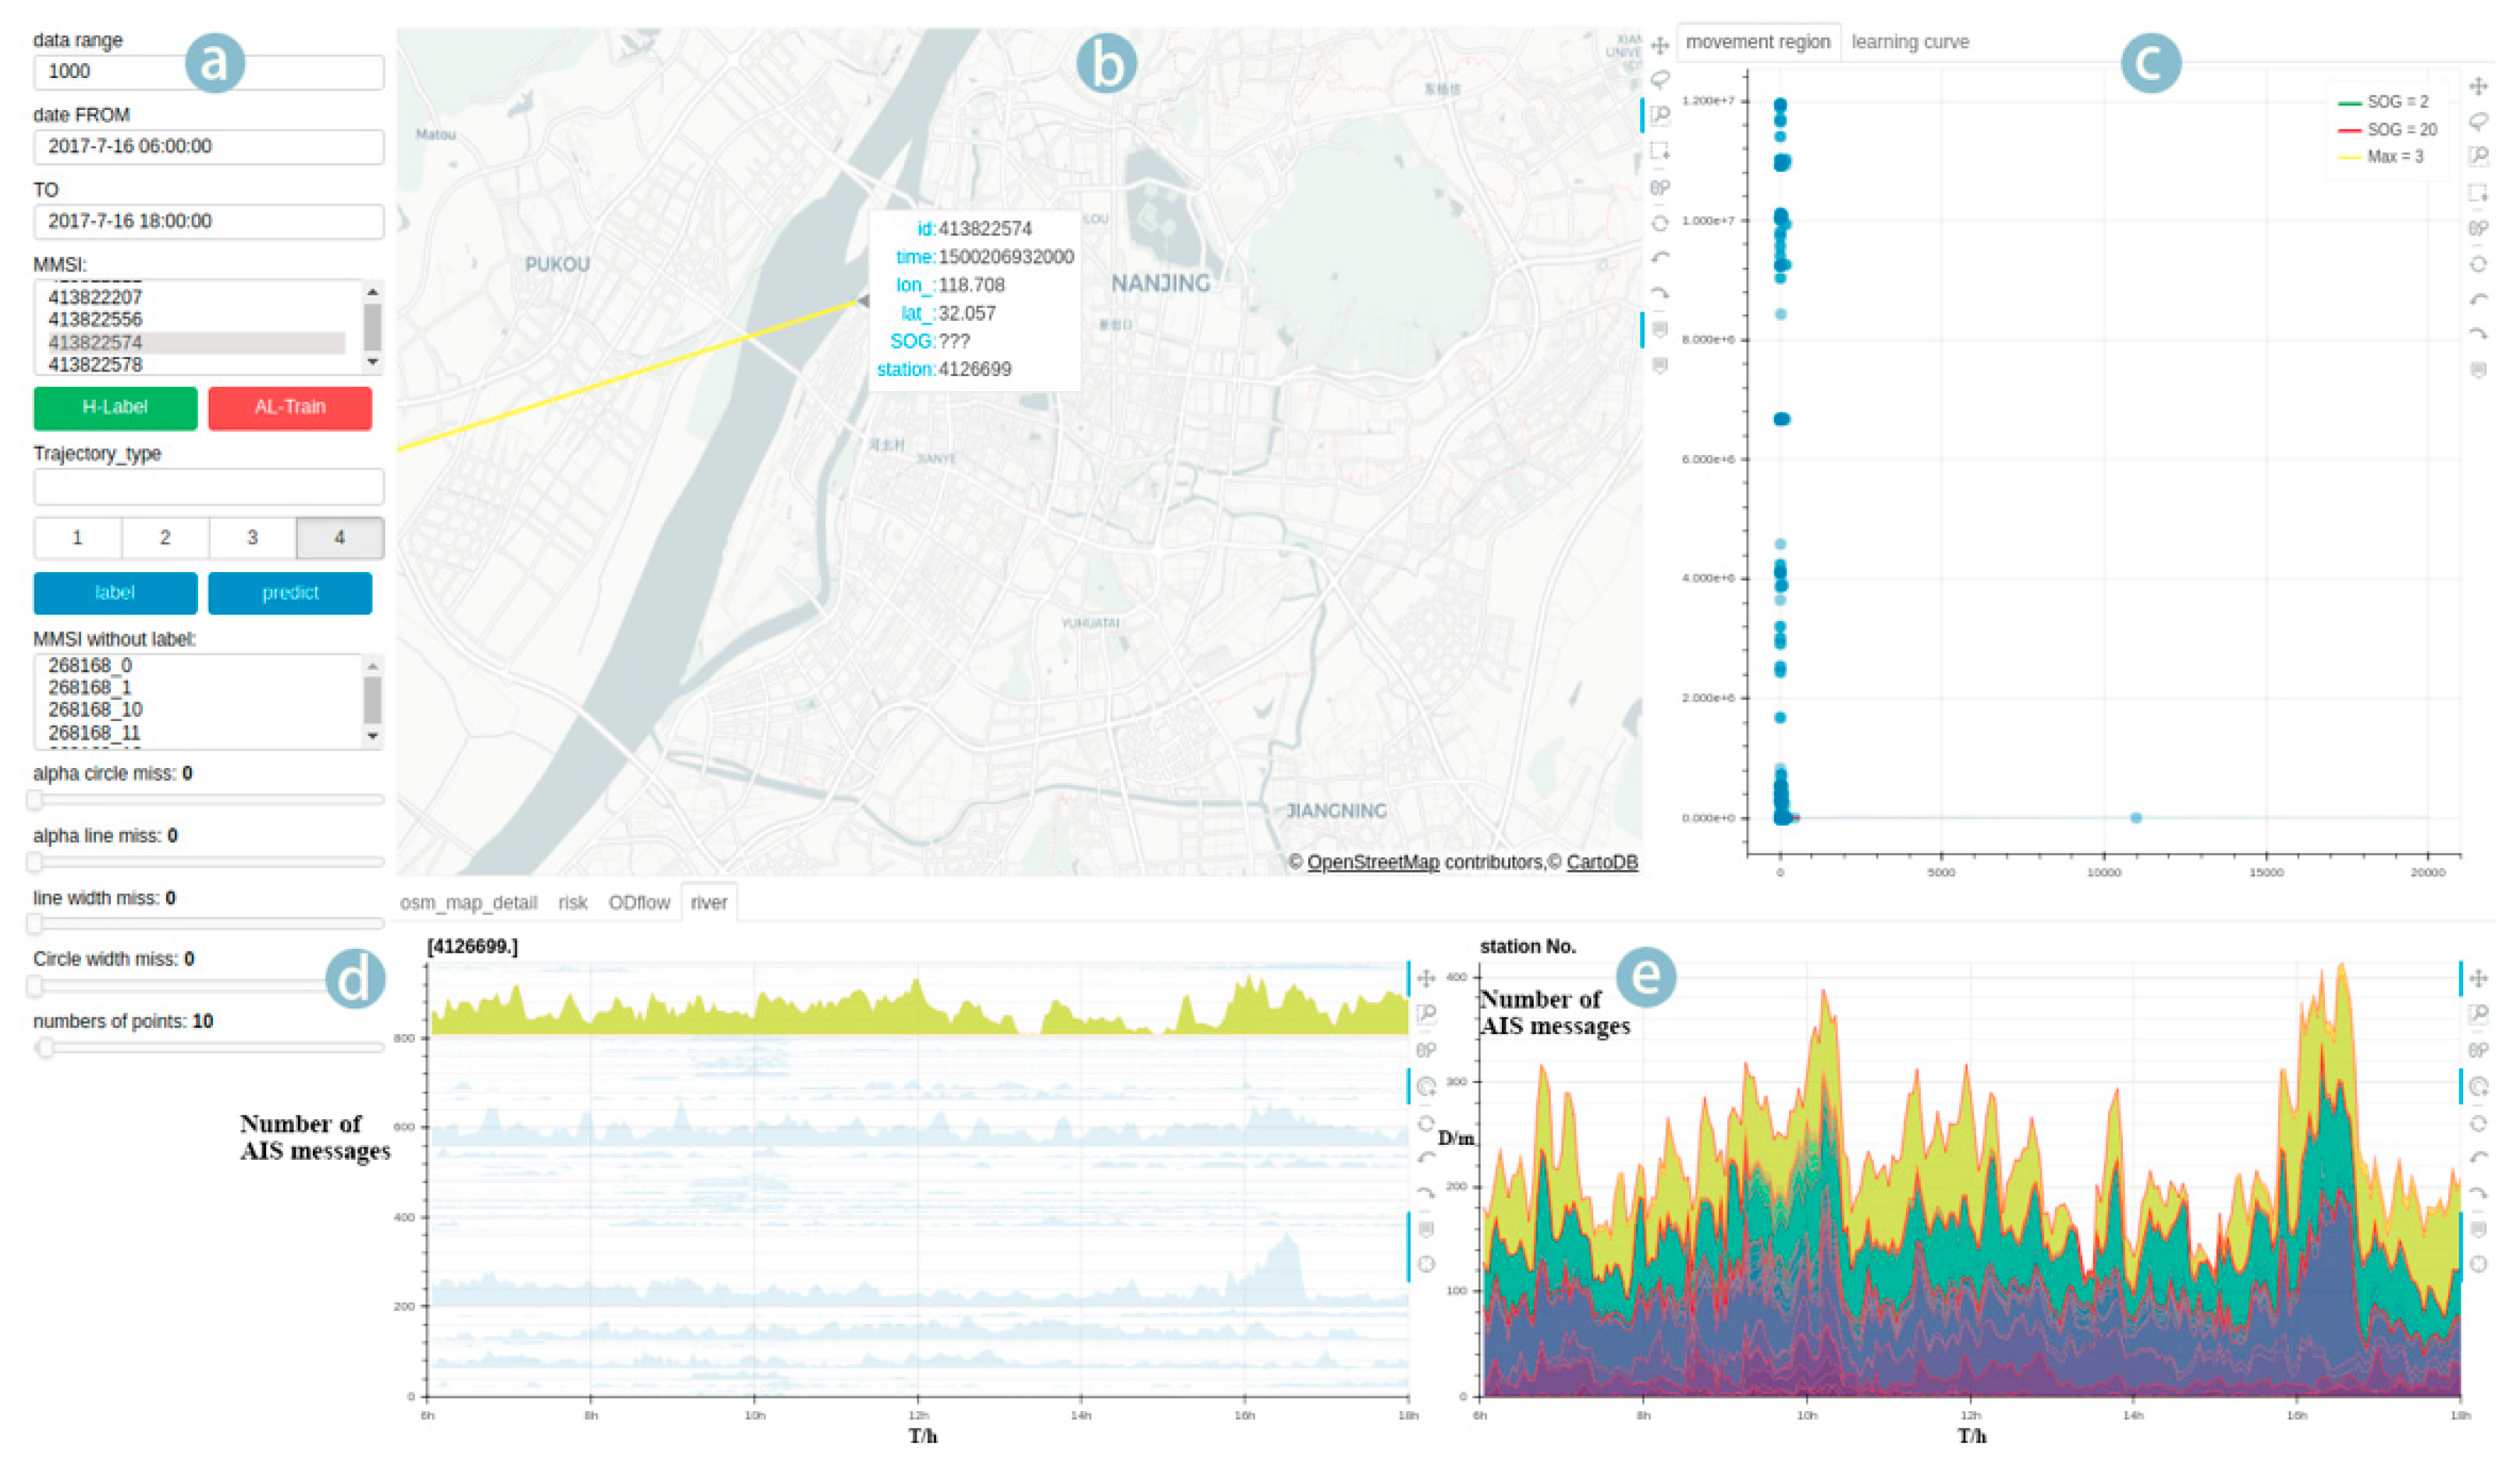
Figure 2.
Analysis flow diagram.
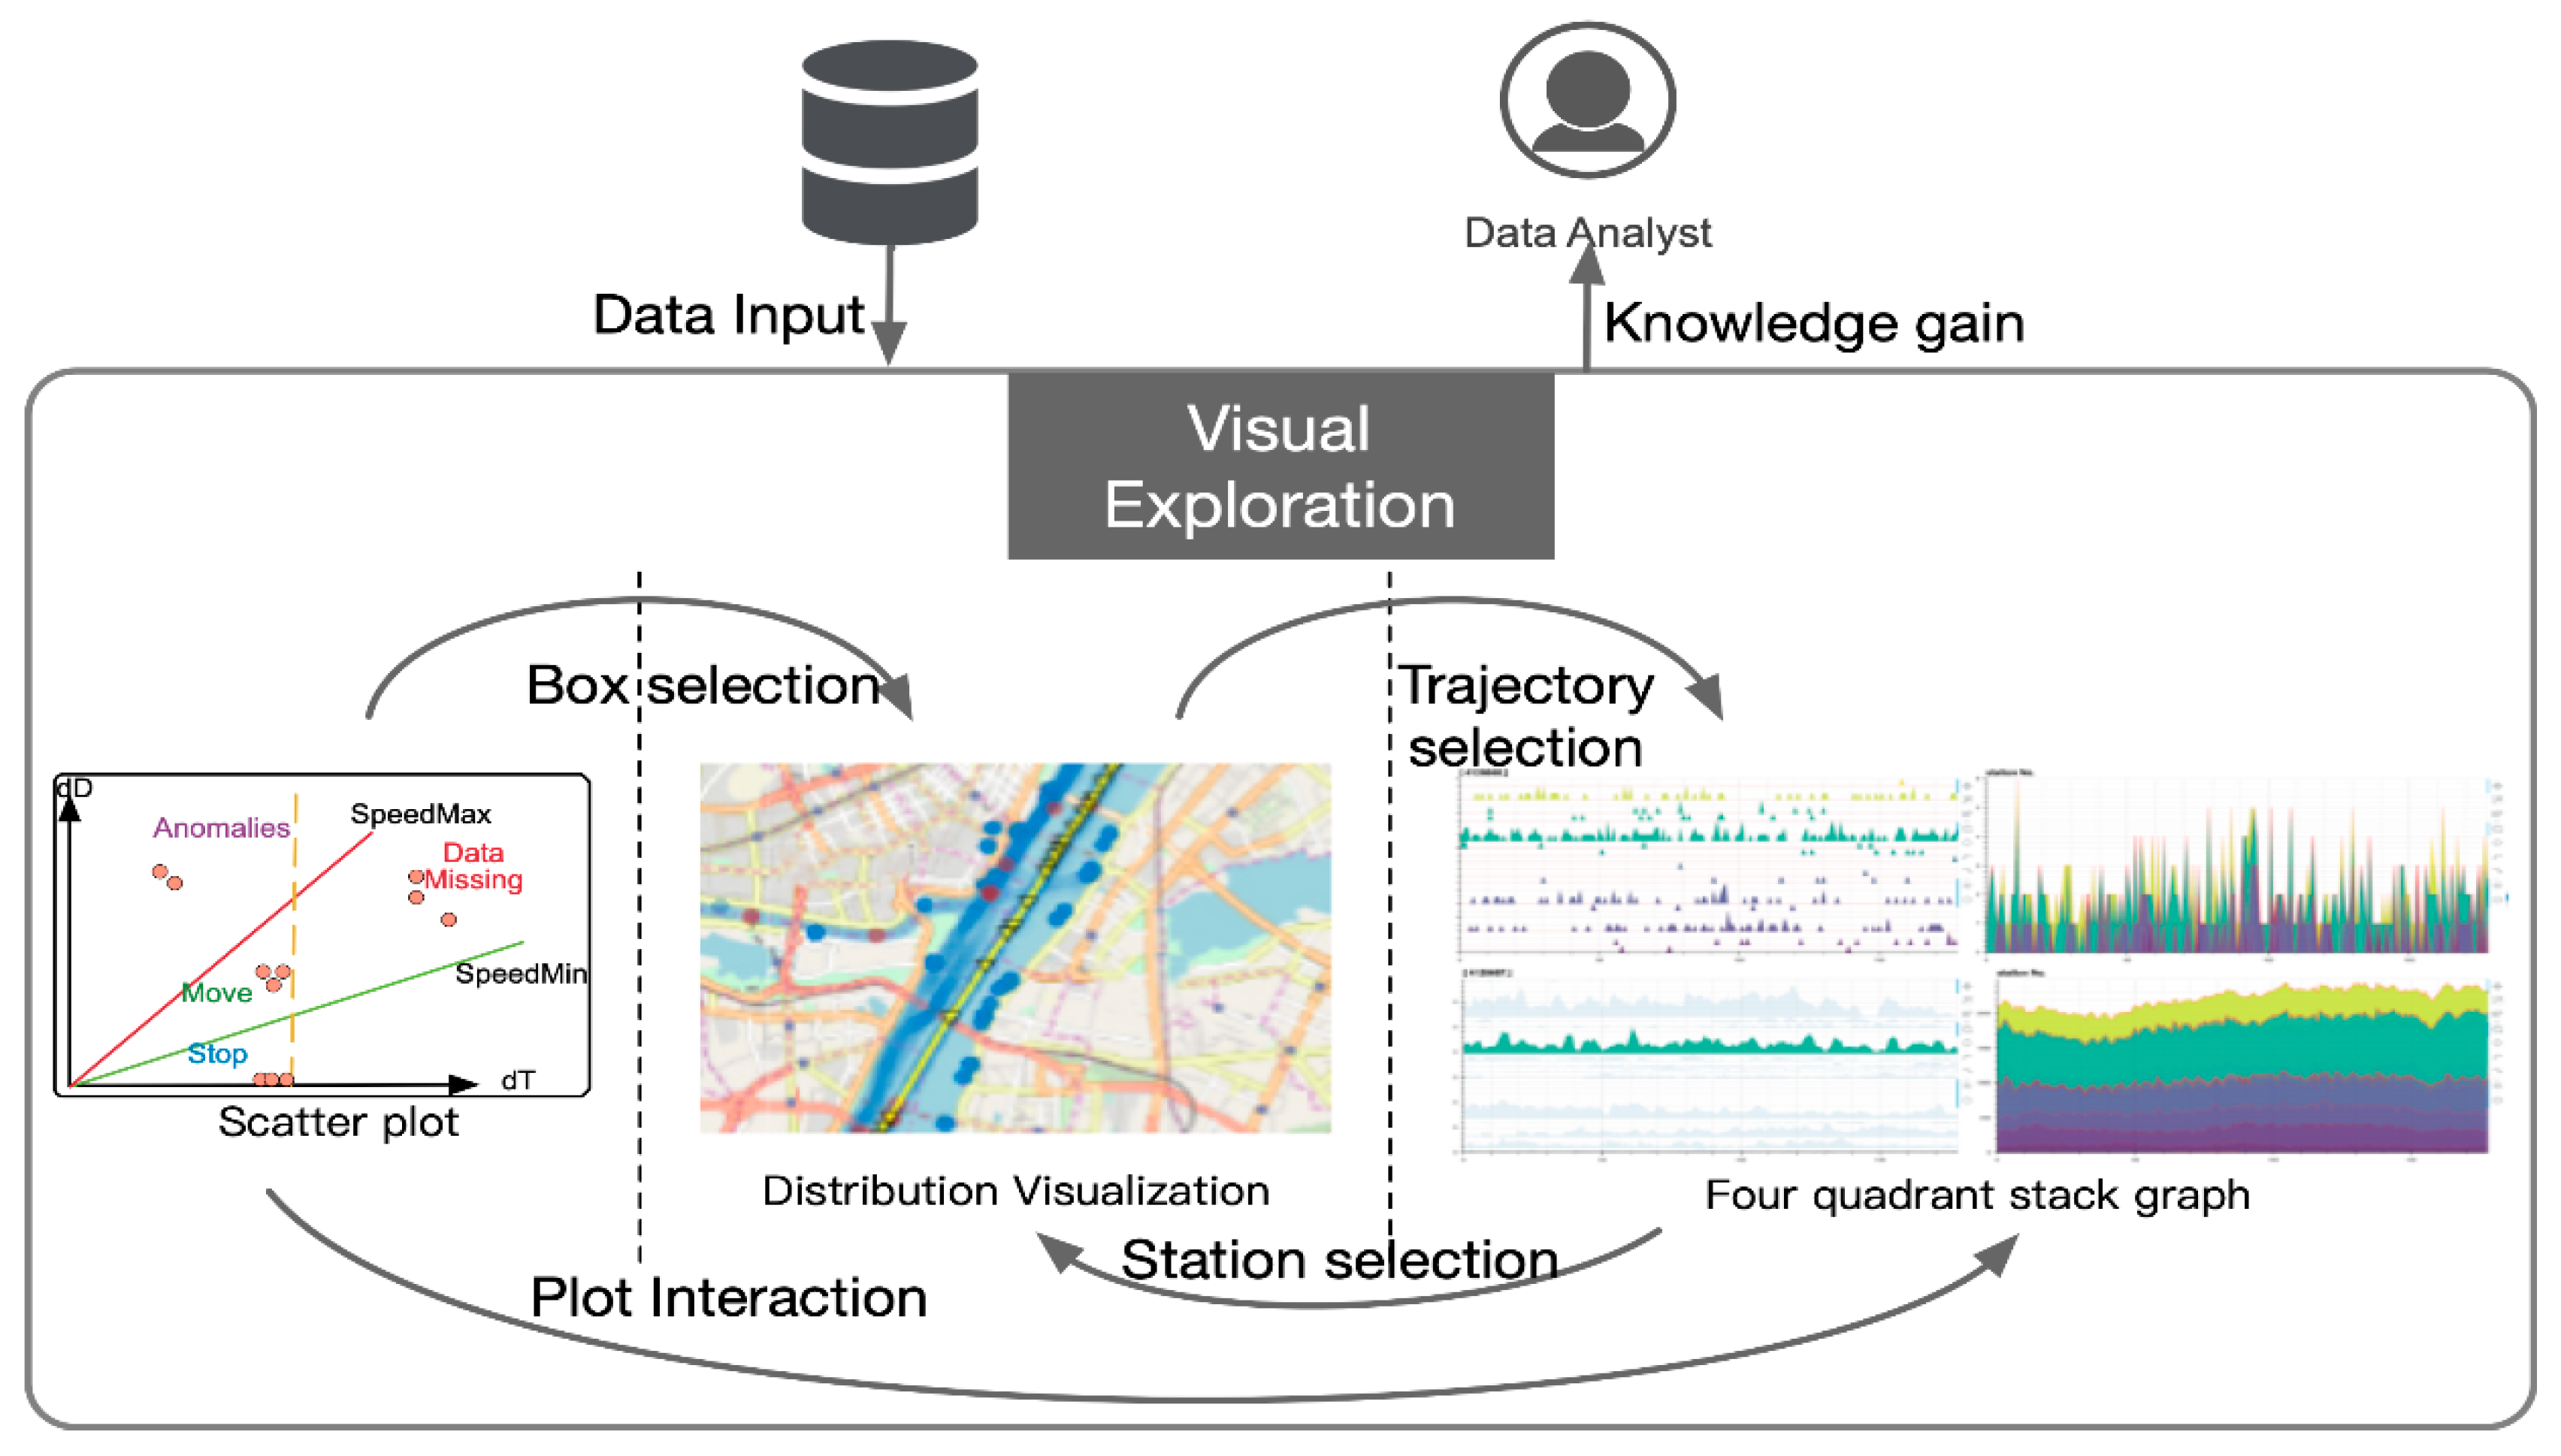
Figure 3.
Scatter plot schematics.

Figure 4.
Scatter plot of the differential distance in the spatiotemporal space.

Figure 5.
Four quadrant stack graph.

Figure 6.
Geographical distribution of the trajectory in an open street map (OSM).

Figure 7.
Lasso selection of trajectory points.

Figure 8.
Box selection of the differential distance.

Figure 9.
Information hovering.

Figure 10.
Interaction with a four quadrant stack graph.

Figure 11.
Selection of abnormal trajectory points.

Figure 12.
Abnormal AIS trajectory.

Figure 13.
Analysis of the blind spots of a base station.

Figure 14.
Visualization of missing data.

Figure 15.
Local details of a stack graph.

Figure 16.
Distribution of missing data.

Figure 17.
Stack graph of AIS data report.

Figure 18.
Stack graph of a base station in the river branch.

Figure 19.
Stack graph of a base station.

Publisher’s Note: MDPI stays neutral with regard to jurisdictional claims in published maps and institutional affiliations. |
© 2021 by the authors. Licensee MDPI, Basel, Switzerland. This article is an open access article distributed under the terms and conditions of the Creative Commons Attribution (CC BY) license (http://creativecommons.org/licenses/by/4.0/).
Share and Cite
MDPI and ACS Style
He, W.; Lei, J.; Chu, X.; Xie, S.; Zhong, C.; Li, Z. A Visual Analysis Approach to Understand and Explore Quality Problems of AIS Data. J. Mar. Sci. Eng. 2021, 9, 198. https://doi.org/10.3390/jmse9020198
AMA Style
He W, Lei J, Chu X, Xie S, Zhong C, Li Z. A Visual Analysis Approach to Understand and Explore Quality Problems of AIS Data. Journal of Marine Science and Engineering. 2021; 9(2):198. https://doi.org/10.3390/jmse9020198
Chicago/Turabian StyleHe, Wei, Jinyu Lei, Xiumin Chu, Shuo Xie, Cheng Zhong, and Zhixiong Li. 2021. "A Visual Analysis Approach to Understand and Explore Quality Problems of AIS Data" Journal of Marine Science and Engineering 9, no. 2: 198. https://doi.org/10.3390/jmse9020198
Note that from the first issue of 2016, this journal uses article numbers instead of page numbers. See further details here.