A Study on Barge-Bank Interaction Forces Considering the Reflected Waves

1
Kyongnam Regional Division, Korea Marine Equipment Research Institute, Kyongnam 53207, Korea
2
Division of Marine Industry Transportation Science and Technology, Kunsan National University, Jeonbuk 54150, Korea
*
Author to whom correspondence should be addressed.
J. Mar. Sci. Eng. 2020, 8(6), 451; https://doi.org/10.3390/jmse8060451
Submission received: 16 May 2020
/
Revised: 16 June 2020
/
Accepted: 17 June 2020
/
Published: 19 June 2020
(This article belongs to the Special Issue Modeling of Ship Hydrodynamics)
Abstract
:Because of the relative location between the ship and the bank, the fluid flow becomes complicated such that unstable hydrodynamic forces result in the yaw movement of the ship in an unintended direction. To consider the nonlinear effect, this study calculated the lateral force and yaw moment of barges with different shapes in confined waters, using computational fluid dynamics (CFD). We analyzed the effect of the reflected waves from the bank on the barges. The sway force tended to increase as both barges became closer to the bank, because it worked as a suction force that pulled them toward the closest bank. The yaw moment increased as the barges became closer to the bank, regardless of the shape of the bow. At y′ = 0.2B, when the barges were at the closest to the bank, it rapidly soared. The wave pattern showed that the diverging waves from the shoulder did not disperse, and were blocked by the bank and returned to the ship; such phenomena resulted in changing the hydrodynamic force on the barge. It is determined that the effect of free surface must be considered when conducting a comprehensive analysis of the bank effect when the ship is close to the bank.
1. Introduction
The barge, which is useful in various fields, has no self-propelled ability compared to other types of ships, and performs maritime transportation while being exposed to difficulties in operation. In the case of a barge drawn from the stern of a tugboat, the stability of the course is very unstable, which is accompanied by a large yaw movement during towing.
The hydrodynamic forces applied to ships on narrow waters, compared to those on open waters, cause the following differences that result in significant impact on the ship’s maneuvering performance. On narrow waters, if the ship deviates from the center of the channel, even though it moves straightforward, the flow between port and starboard becomes unbalanced, causing the ship to be under the lateral force sucked into the closest bank, and the yaw moment where the bow is expelled from the closest bank. Because of the relative location between the ship and the bank, the fluid movement becomes complicated such that unstable hydrodynamic forces result in the yaw movement of the ship in an unintended direction.
Note that, in terms of safety issues, there have been various studies on the bank effect of the hydrodynamic forces on the ship. Norrbin [1] proposed an empirical equation to predict lateral force and yaw moment, while Li et al. [2] and Vantorre et al. [3] examined the ship–bank interaction via model tests. The studies based on empirical equations make it difficult to realize the free surface and viscosity effects; however, analytical methods based on water tank tests lead to considerable time and cost.
Recently, there have been studies that use the computational fluid dynamics (CFD) method to analyze the effects of the free surface, viscous, and rotating propeller on the bank effect. Van Hoydonck et al. [4] conducted a wide range of water tank tests for KVLCC2. By comparing the results to the CFD solver and potential flow solver, they analyzed various factors that affect the bank effect. Note that Zou and Larsson [5] analyzed the characteristics of hydrodynamic forces on KVLCC2 because of the difference in the distance from the ship to two different bank forms, i.e., the vertical bank and the slope bank, based on CFD. Ma et al. [6] performed a simulation to examine the hydrodynamic interaction between the hull, rudder, and bank, because of the change in ship–bank distance and rudder angles. Lo et al. [7] studied the bank effect and speed effect based on CFD, and confirmed that the closer the ships get to the bank and the faster the speed of the ship becomes, the greater the additional increase in the yaw angle and sway force.
There have been other studies to analyze the course stability of ships close to the bank. Liu et al. [8] determined the hydrodynamic derivatives near the vertical bank, based on CFD, and used those values to evaluate the directional stability based on the bank distance. Yasukawa [9] conducted an analysis of pure car carrier (PCC) course stability, by performing the captive model test under different water depths, as well as the distance between ship and bank, drift angle, and heel angle.
Lataire et al. [10] performed a water tank test on a wide range of bank effects. Based on the test results, they proposed a mathematical model by which the bank effect can be predicted. In particular, they separated the lateral force into the force that works on the forward perpendicular and aft perpendicular, and analyzed the characteristics of the forces separated, based on the difference in ship speed, ship–bank distance, blockage ratio, and propeller action.
In the references Zou and Larsson [5], Ma et al. [6], and Liu et al. [8] that used CFD for bank effect analysis, the effect of free surface was not considered; however, Hoydonck et al. [4], which did consider the effect of free surface, compared the calculation results at y′ = 3/4B, the relatively large distance at intermediate depth such that they reported that the effect of free surface modelling was not significant. As ships will be influenced more by the reflected waves from the bank as they become closer to the bank, it is necessary to determine how this will affect the hydrodynamic forces on the ships.
Because the characteristics of the yaw movement differ depending on the bow shape of the barges [11], this study will determine the characteristics of hydrodynamic forces that act on barges with different bow shapes, using the simulation results and analyzing the bank effects on the maneuvering stability of barges. To consider the nonlinear effect, this study calculates the surge force, sway force, and yaw moment on barges with different shapes in confined waters, using CFD. Moreover, it analyzes the effects of the flow field near the barges, particularly the effect of the free surface, such as the reflected waves from the bank.
2. Numerical Analysis
2.1. Governing Equation and Numerical Analysis Method
To perform numerical simulations, this study used STAR-CCM+, a CFD commercial program based on finite volume method. The continuous and momentum equations for the noncompressive fluid analysis are shown below [12].
where is density, is the averaged Cartesian components of the velocity vector, is the Reynolds stresses, is the mean pressure, and are the mean viscous stress tensor components.
The first-order implicit method was used for time discretization, whereas the SIMPLE method was used for the velocity–pressure coupling. The realizable k-ε model was used for the turbulence model, and the wall function was implemented. Offering advantages in the economic performance in the CPU calculation time [13], the k-ε model is one of the useful turbulence models, as reported in Sung and Park [14], who used it for the stability and efficiency of numerical calculation for dynamic tests of ships.
The free surface was resolved using volume of fluid (VOF). This study considered only heaving and pitching; moreover, for other movement modes, the numerical calculation was performed under the fixed state.
2.2. Calculation Domain and Grid System
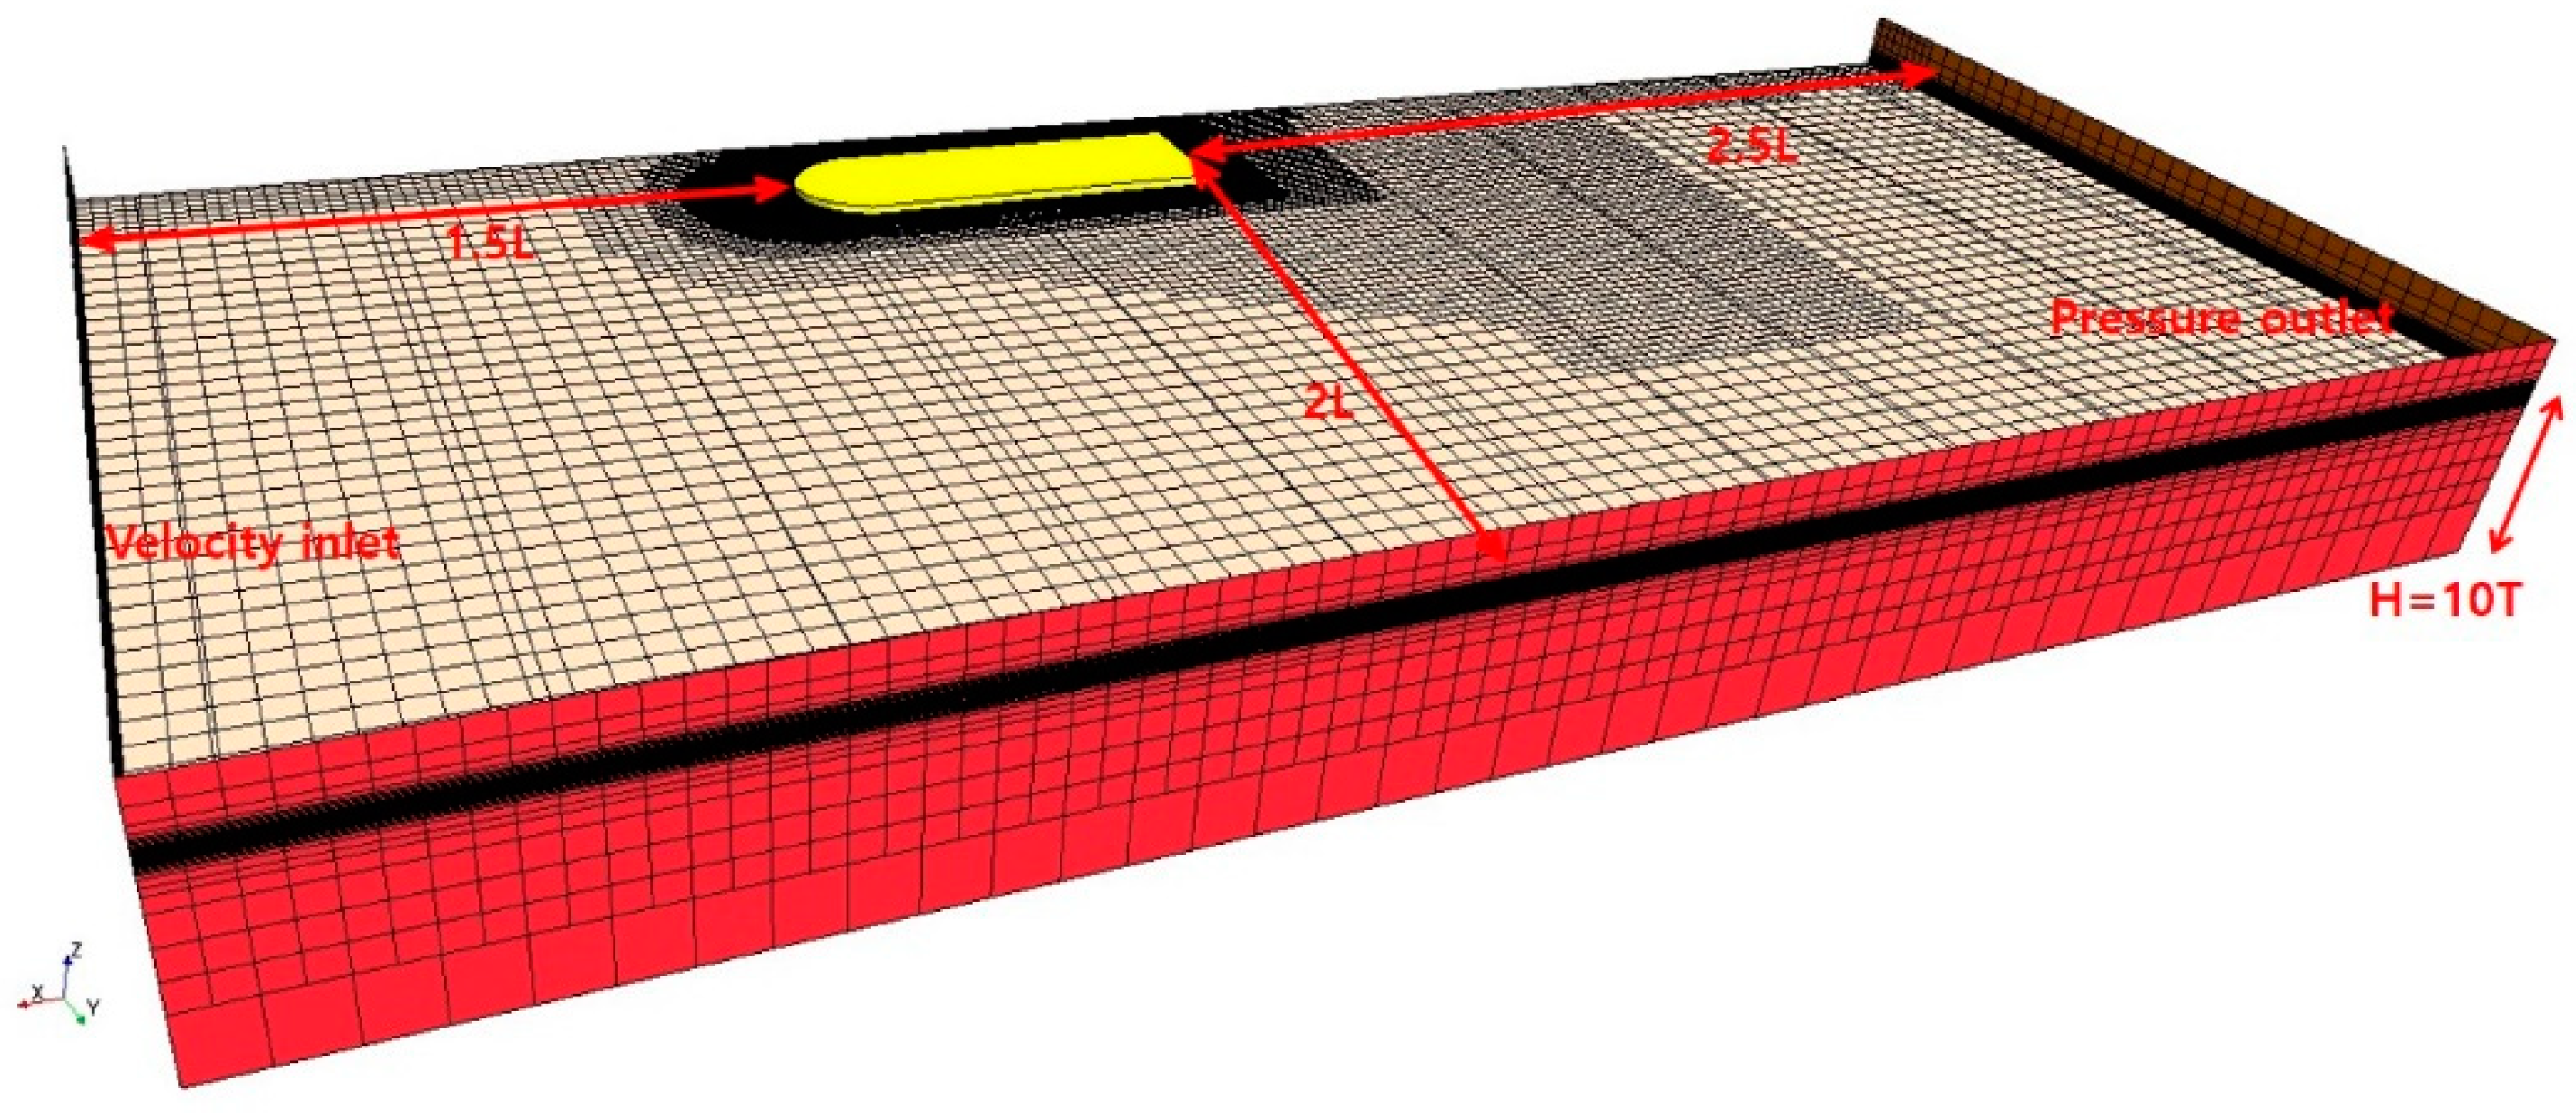
Figure 1 shows the calculation domain and grid system used in this study. It is an orthogonal grid system where +x axis is the forward direction, +y axis is the port, and +z axis is the opposite to the gravitational direction. The origin of the ship-fixed coordinate system is located at the center of mass of the body. The calculation domain for the numerical analysis is 1.5L from fore perpendicular, 2.5L from aft perpendicular, 3.0T from the water surface to the top, and 10.0T from the water surface to the seabed.
To examine the change of the hydrodynamic forces and flow field because of the ship-bank distance, the distance from the starboard to the bank, as shown in Figure 2, was defined as y′. The simulation was performed under five states: 0.2B, 0.5B, 0.75B, 1.0B, and 1.5B. When y′ = 0.5B, the port distance was set to 2.0L lateral from the center line.
Furthermore, both the trimmed mesh and prism layers were used for the spatial grid and ship surface grid, respectively. To precisely realize the surroundings of the ship, free surface, the diverging wave areas, and the flow nearer the bank, the study used the grid system, which was smaller than the base size using volumetric control. The hull used the no-slip condition and the boundary condition of the starboard side, and the closest bank from the ship used the moving no-slip condition. In the numerical calculation, the bottom, top, and port sides used the velocity inlet conditions.
Toxopeus et al. [15] conducted extensive research on KVLCC2, comparing several CFD methods for water depth and wall effect. Among several CFD methods, the method using STAR-CCM+ applied moving no-slip condition to the bottom boundary to consider the seabed close to the hull in the shallow water. As a result, it showed good calculation results with no significant errors from experimental data. In this study, simulation was performed by assigning a moving no-slip condition so that the wall adjacent to the barge could move with the free stream speed.
2.3. Ship Model and Test Conditions
To perform numerical simulations of the hydrodynamic force characteristics on the barge near the bank, the study selected two real-size barges in a 90-m class with different bow shapes as the target ships. Table 1 and Figure 3 show the basic specifications and shapes. In calm water, the numerical calculation was performed based on the ship’s speed at 7 knots (Fn = 0.120, Fnh = 0.182) and Re = 3.281 × 10⁸. At y′ = 0.5B, the average y+ of KNU-020 and KNU-030 with skeg was 199 and 219, respectively. y+ denotes the dimensionless wall distance.
Many studies have been conducted to show that skeg improves the course stability of a barge in open water [11,16,17]. However, the effect of skeg in confined waters is not well known. In this study, in order to investigate the skeg effect according to the distance from the wall, simulation was performed for each case with, and without, skeg.
3. Numerical Results and Discussion
3.1. Verification
The Grid Convergence Index (GCI) method, based on the Richardson extrapolation, was used to estimate the grid convergence uncertainty of the numerical simulations in this study.
The verification process using the GCI method was followed according to the method described by Celik et al. [18]. The expression of the use of GCI method for verification is described with reference to [19].
The numerical convergence ratio is calculated as follows:
Here, it is obtained by and , each of which represents the difference in the solution value between medium-fine and coarse-medium, respectively. , , or each represent the solution calculated for the fine, medium, or coarse mesh.
The order of accuracy can be obtained as follows, using a constant refinement ratio , :
The extrapolated values are calculated as shown in Equation (5):
In addition, the approximate relative error and extrapolated relative error are obtained by the following equations, respectively:
Finally, the medium-grid convergence index is calculated as follows:
The number of meshes for the grid convergence study is shown in Table 2. The surge force (XH) was calculated using the number of coarse, medium, and fine grids, and the results are shown in Table 3. As shown in the calculation results, the numerical uncertainty for the medium mesh using the GCI method was estimated to be 1.40%. According to the results of the grid convergence uncertainty study, it was concluded that efficient numerical simulation is possible, using the medium mesh. Therefore, the medium mesh was selected as the base size in this study.
The authors conducted the research in the same way as the CFD method used in this paper for KVLCC2 and DTC ships in 2017, to take into account the shallow water effect [20]. As a result, it was found that the numerical value was similar to the experimental value. In the medium mesh, KVLCC2 showed an error of 2.99%, and DTC 4.82%. Although this study did not directly compare with the experimental data, it is believed that there would be no significant errors in this study, because the authors confirmed good results from previous research.
3.2. Bank Effects on Hydrodynamic Forces and Moment
Figure 4 and Figure 5 show the hydrodynamic force changes, based on the difference in the distance from KNU-020 and KNU-030 barge to the bank, respectively. Surge force (XH), sway force (YH), and yaw moment (NH) used the nondimensionalized value shown below, which shows cases with, and without, skeg.
First, as for the results of the surge force, both barges demonstrated that the surge force value corresponding to the total resistance increased, because of the installation of the skeg. KNU-030 with a square-shaped bow demonstrated a higher surge force compared to KNU-020 with the round-shaped bow. KNU-020 showed the largest X′ at y′ = 0.2B when it was closest to the bank. However, the X′ of KNU-030 decreased, because it was closer to the bank. Zou and Larsson [5] and Van Hoydonck et al. [4] studied the bank effect of KVLCC2, showing that X′ increased as the ships became closer to the bank. The bow of KNU-030 used in this study is different from that of KVLCC2 or KNU-020; thus, the distribution of surge force was shown differently.
Note that the sway force does not seem to be significantly affected by the installation of skeg. For KNU-030, there is a very small difference in sway force if the ship with skeg is closer to the bank. Regardless of the shape of the bow, both barges demonstrated that the suction force, the pulling force toward the bank, increased as they become closer to the bank.
The yaw moment gradually increased in both barges until y′ = 0.5B; however, at y′ = 0.2B, when the barges became closest to the bank, it tended to drastically increase; the bank effect had a significant effect from the distance that corresponded to 1/5 of the barge width. In particular, KNU-030 with skeg demonstrated that yaw moment rapidly increased; thus, it was determined that the bank effect at this condition might have been considerable.
3.3. Analysis of Flow Field and Hydrodynamic Pressure
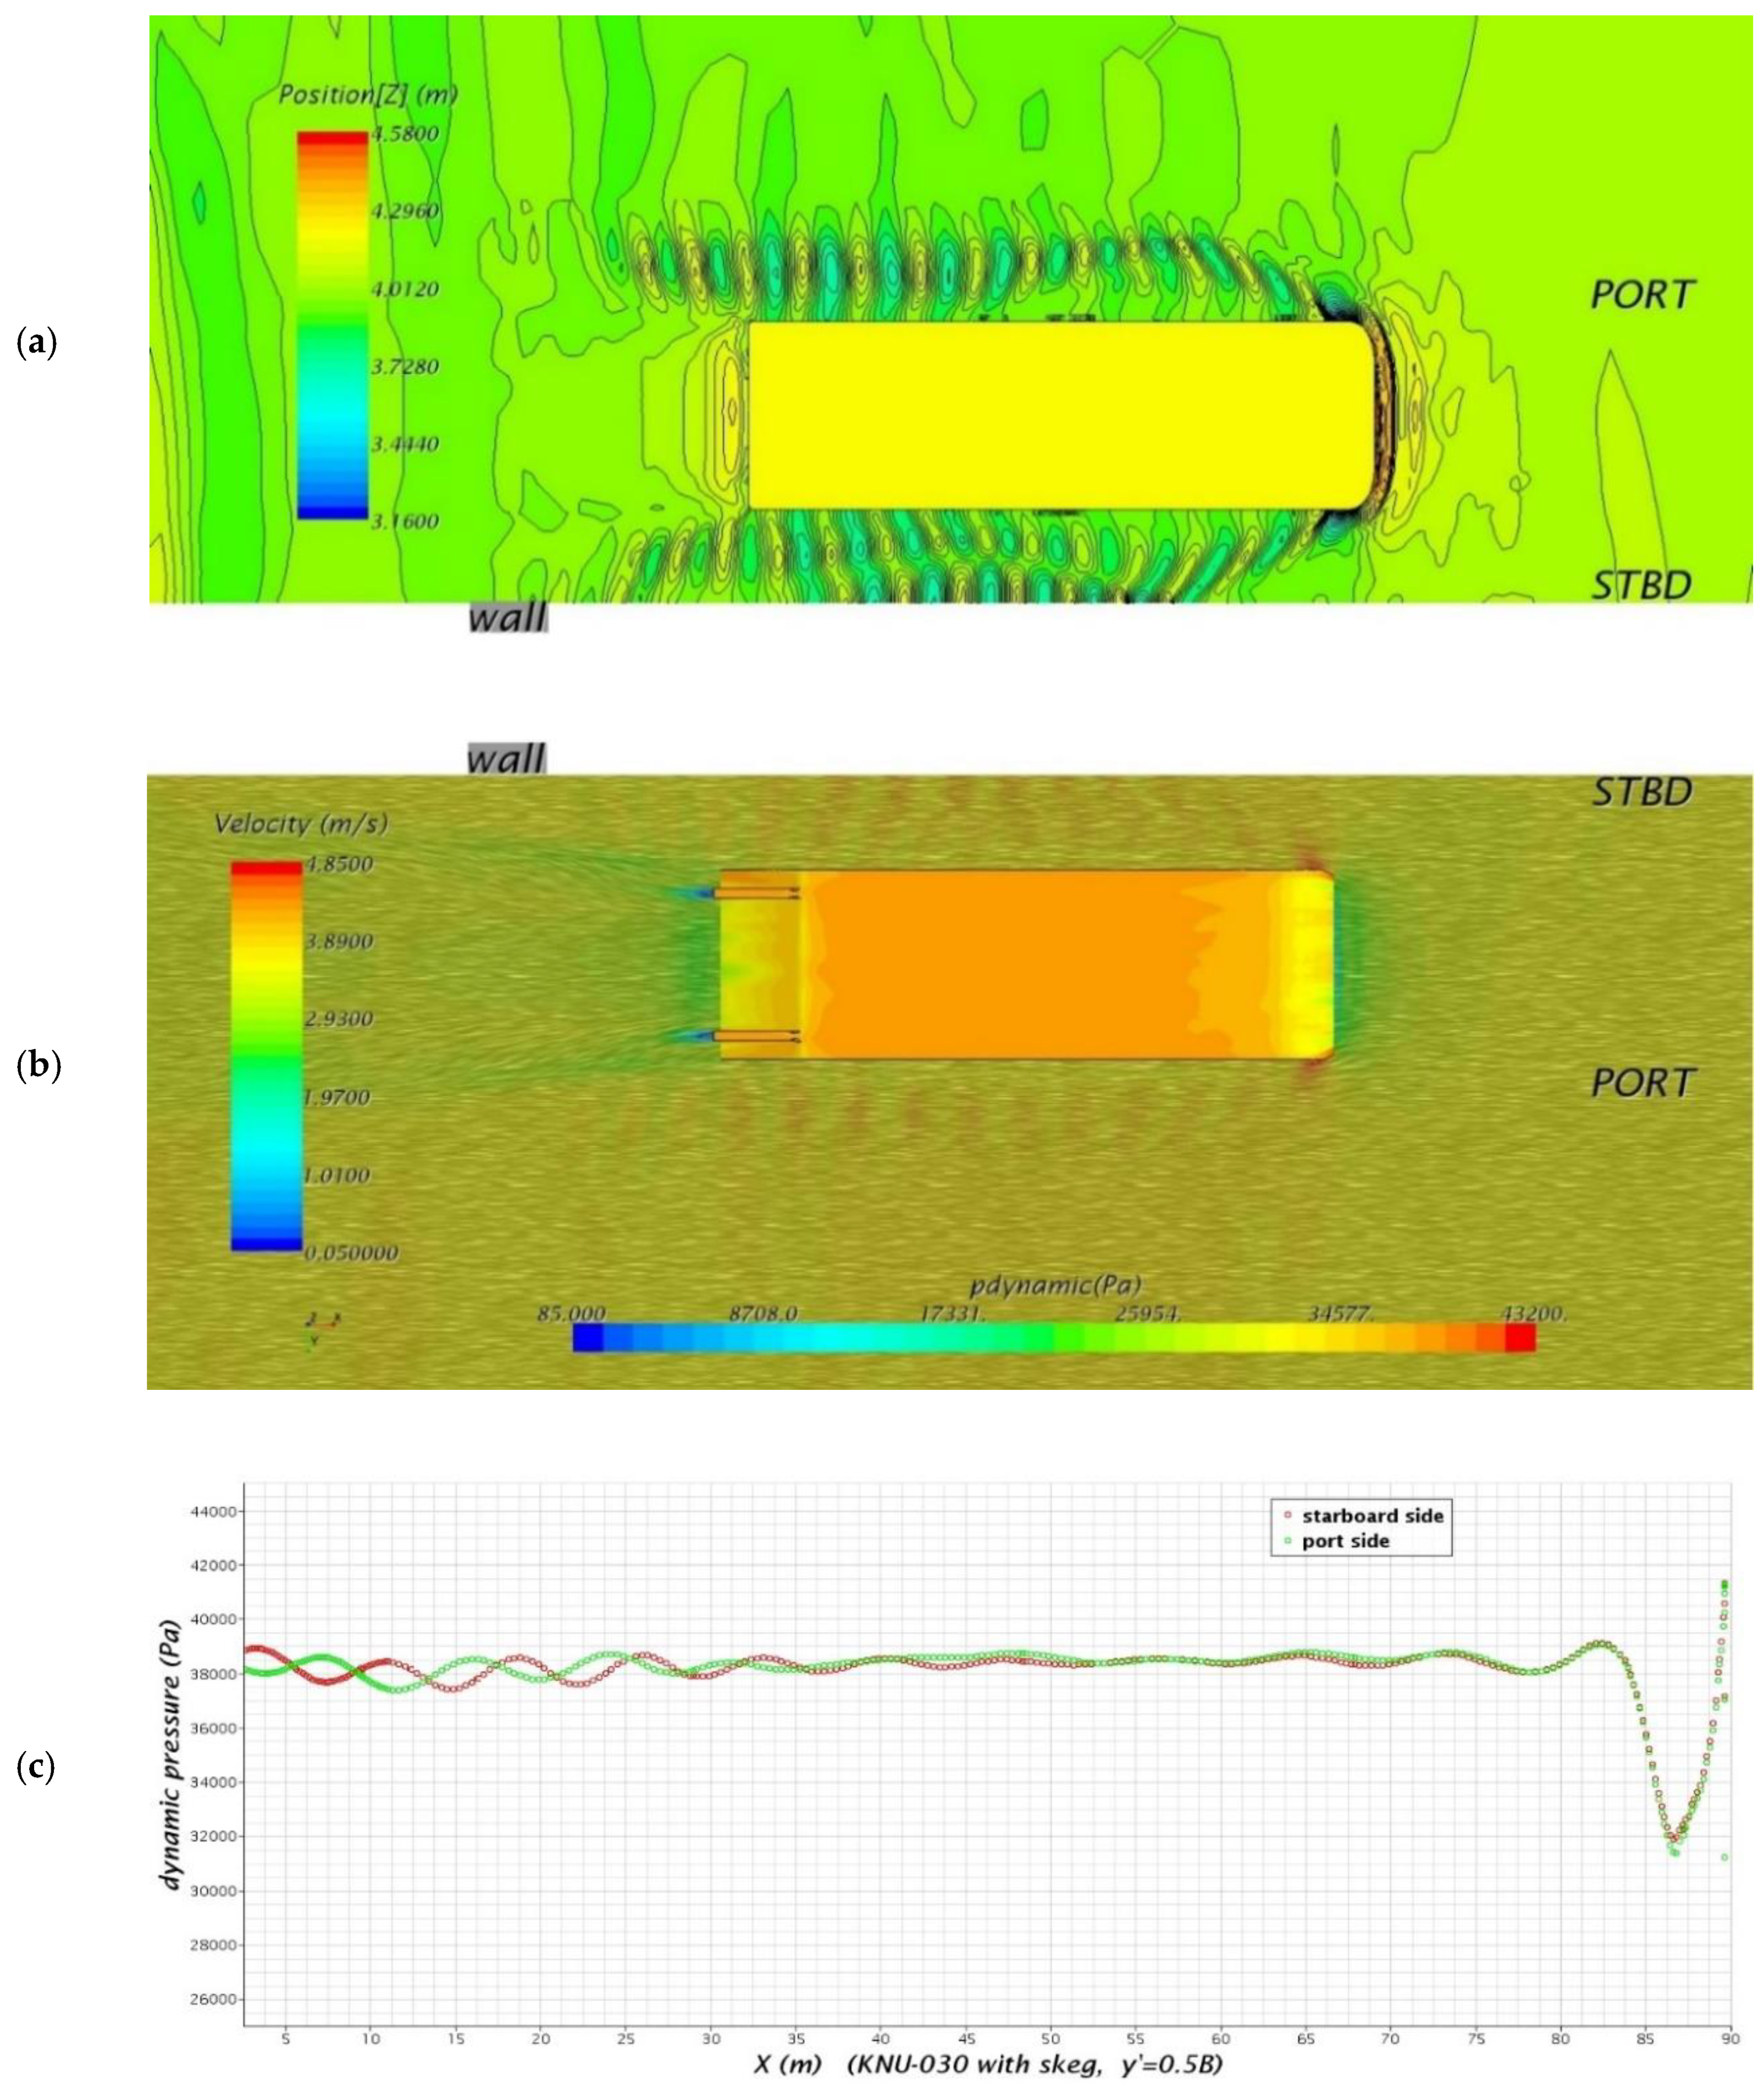
Next, the study compared the characteristics of the flow field, based on the barge-bank distance and the subsequent hydrodynamic pressure distribution on the barge because of such fluid flow. Figure 6 shows the (a) wave pattern, (b) velocity field with line integral convolution and hydrodynamic pressure distribution on the bottom, and (c) hydrodynamic pressure on the starboard and port side of KNU-020 barge at y′ = 0.2B, when it is closest to the bank. The hydrodynamic pressure is attributed to the subtraction of the hydrostatic pressure from the total pressure. Hydrodynamic pressure in Figure 6c indicates the pressure distribution of 3 m up from the bottom of the barge. Note that the starboard side is closer to the bank. Figure 6b,c show the increase in flow speed, and the pressure decrease because of the bank effect in the shoulder of the starboard side of the bow. The flow speed in the port side relatively decreases such that the pressure becomes higher than that of the starboard. However, the area toward the end of the bow from the shoulder demonstrated that the pressure on the starboard side becomes higher as the flow speed in the starboard becomes slower compared to the port side. It is estimated that because of this pressure difference from the shoulder to the end of the bow, the bow-out moment that pushes the bow outward from the bank occurs. The analysis of the pressure distribution from the shoulder to the stern demonstrates that the port side pressure gradually increases more than the starboard side pressure. Because the port side pressure tends to be higher than the starboard side pressure, the suction force that pushes the barge from port to starboard side occurs. The starboard side pressure shows oscillating because of the reflective waves from the bank, which can be shown in Figure 6a. It is believed that the diverging waves due to the progress of the barge do not move away from the barge, and return to the barge after being reflected from the bank, causing the change in the hydrodynamic force.
Figure 7 shows KNU-020 at y′ = 0.5B. The port–starboard pressure difference in the shoulder was not significant, and the pressure in the area toward the end of the bow shows that the starboard side was somewhat higher than the port side. The port side pressure was somewhat higher at the end of the stern; thus, this and the higher starboard pressure from the shoulder to the end of the bow may have caused the bow-out moment.
Overall, the port side pressure is higher from the shoulder to the stern, which causes the suction force on the barge. A careful look at the reflected waves in Figure 8a shows that the part where the diverging waves hit the quay wall and affects the ship again is from the center of the hull toward the stern. In other words, it is possible to understand the phenomenon in which the hydrodynamic force acting on the hull is changed by the bank effect, even at the current distance from the quay wall (50% of the ship width).
Figure 8 shows the simulation result at y′ = 1.0B, i.e., when the barge is distant from the bank by the barge width. This shows that the pressure distribution between the port and starboard sides is almost identical from the bow to about ¼L of the stern; however, from ¼L of the stern toward the stern, the port pressure is somewhat higher than the starboard pressure, which may have caused the bow-out moment and suction force.
The analysis of KNU-030 is shown in Figure 9 at y′ = 0.2B, the closest to the bank. As shown in Figure 9b, the flow speed at the bow shoulder is somewhat faster in the port side, further from the bank. Thus, the starboard pressure is higher than the port side, causing the bow-out moment. This flow speed in the bow is different from that shown in KNU-020 with the round-shaped bow. The stern pressure from the shoulder is higher in the port side than in the starboard side, causing the suction force that pushes the barge to the bank. Similar to KNU-020, the wave pattern shows that the diverging waves from the shoulder do not disperse, and are blocked by the bank and returned to the barge.
Figure 10 shows the calculation result at y′ = 0.5B, when the barge-bank distance is half of the barge width. Note that starboard pressure is slightly higher than in the port bow shoulder. The port pressure is slightly higher than the starboard side from the shoulder to the near center of the barge. However, from the center to the stern, the pressure changes between the port and starboard sides, such that the port side pressure becomes a bit higher than the starboard side pressure. As shown in Figure 10a, such phenomena result in changing the hydrodynamic force on the barge, because the reflective waves from the bank interfere with the hydrodynamic force from the center of the barge.
Finally, Figure 11 shows the result at y′ = 1.0B, where the pressure by fluid flow is very similar between the port and starboard sides. When the barge-bank distance is about the same as the barge width, the bank effect is negligible, such that the sway force and yaw moment on the barge are small.
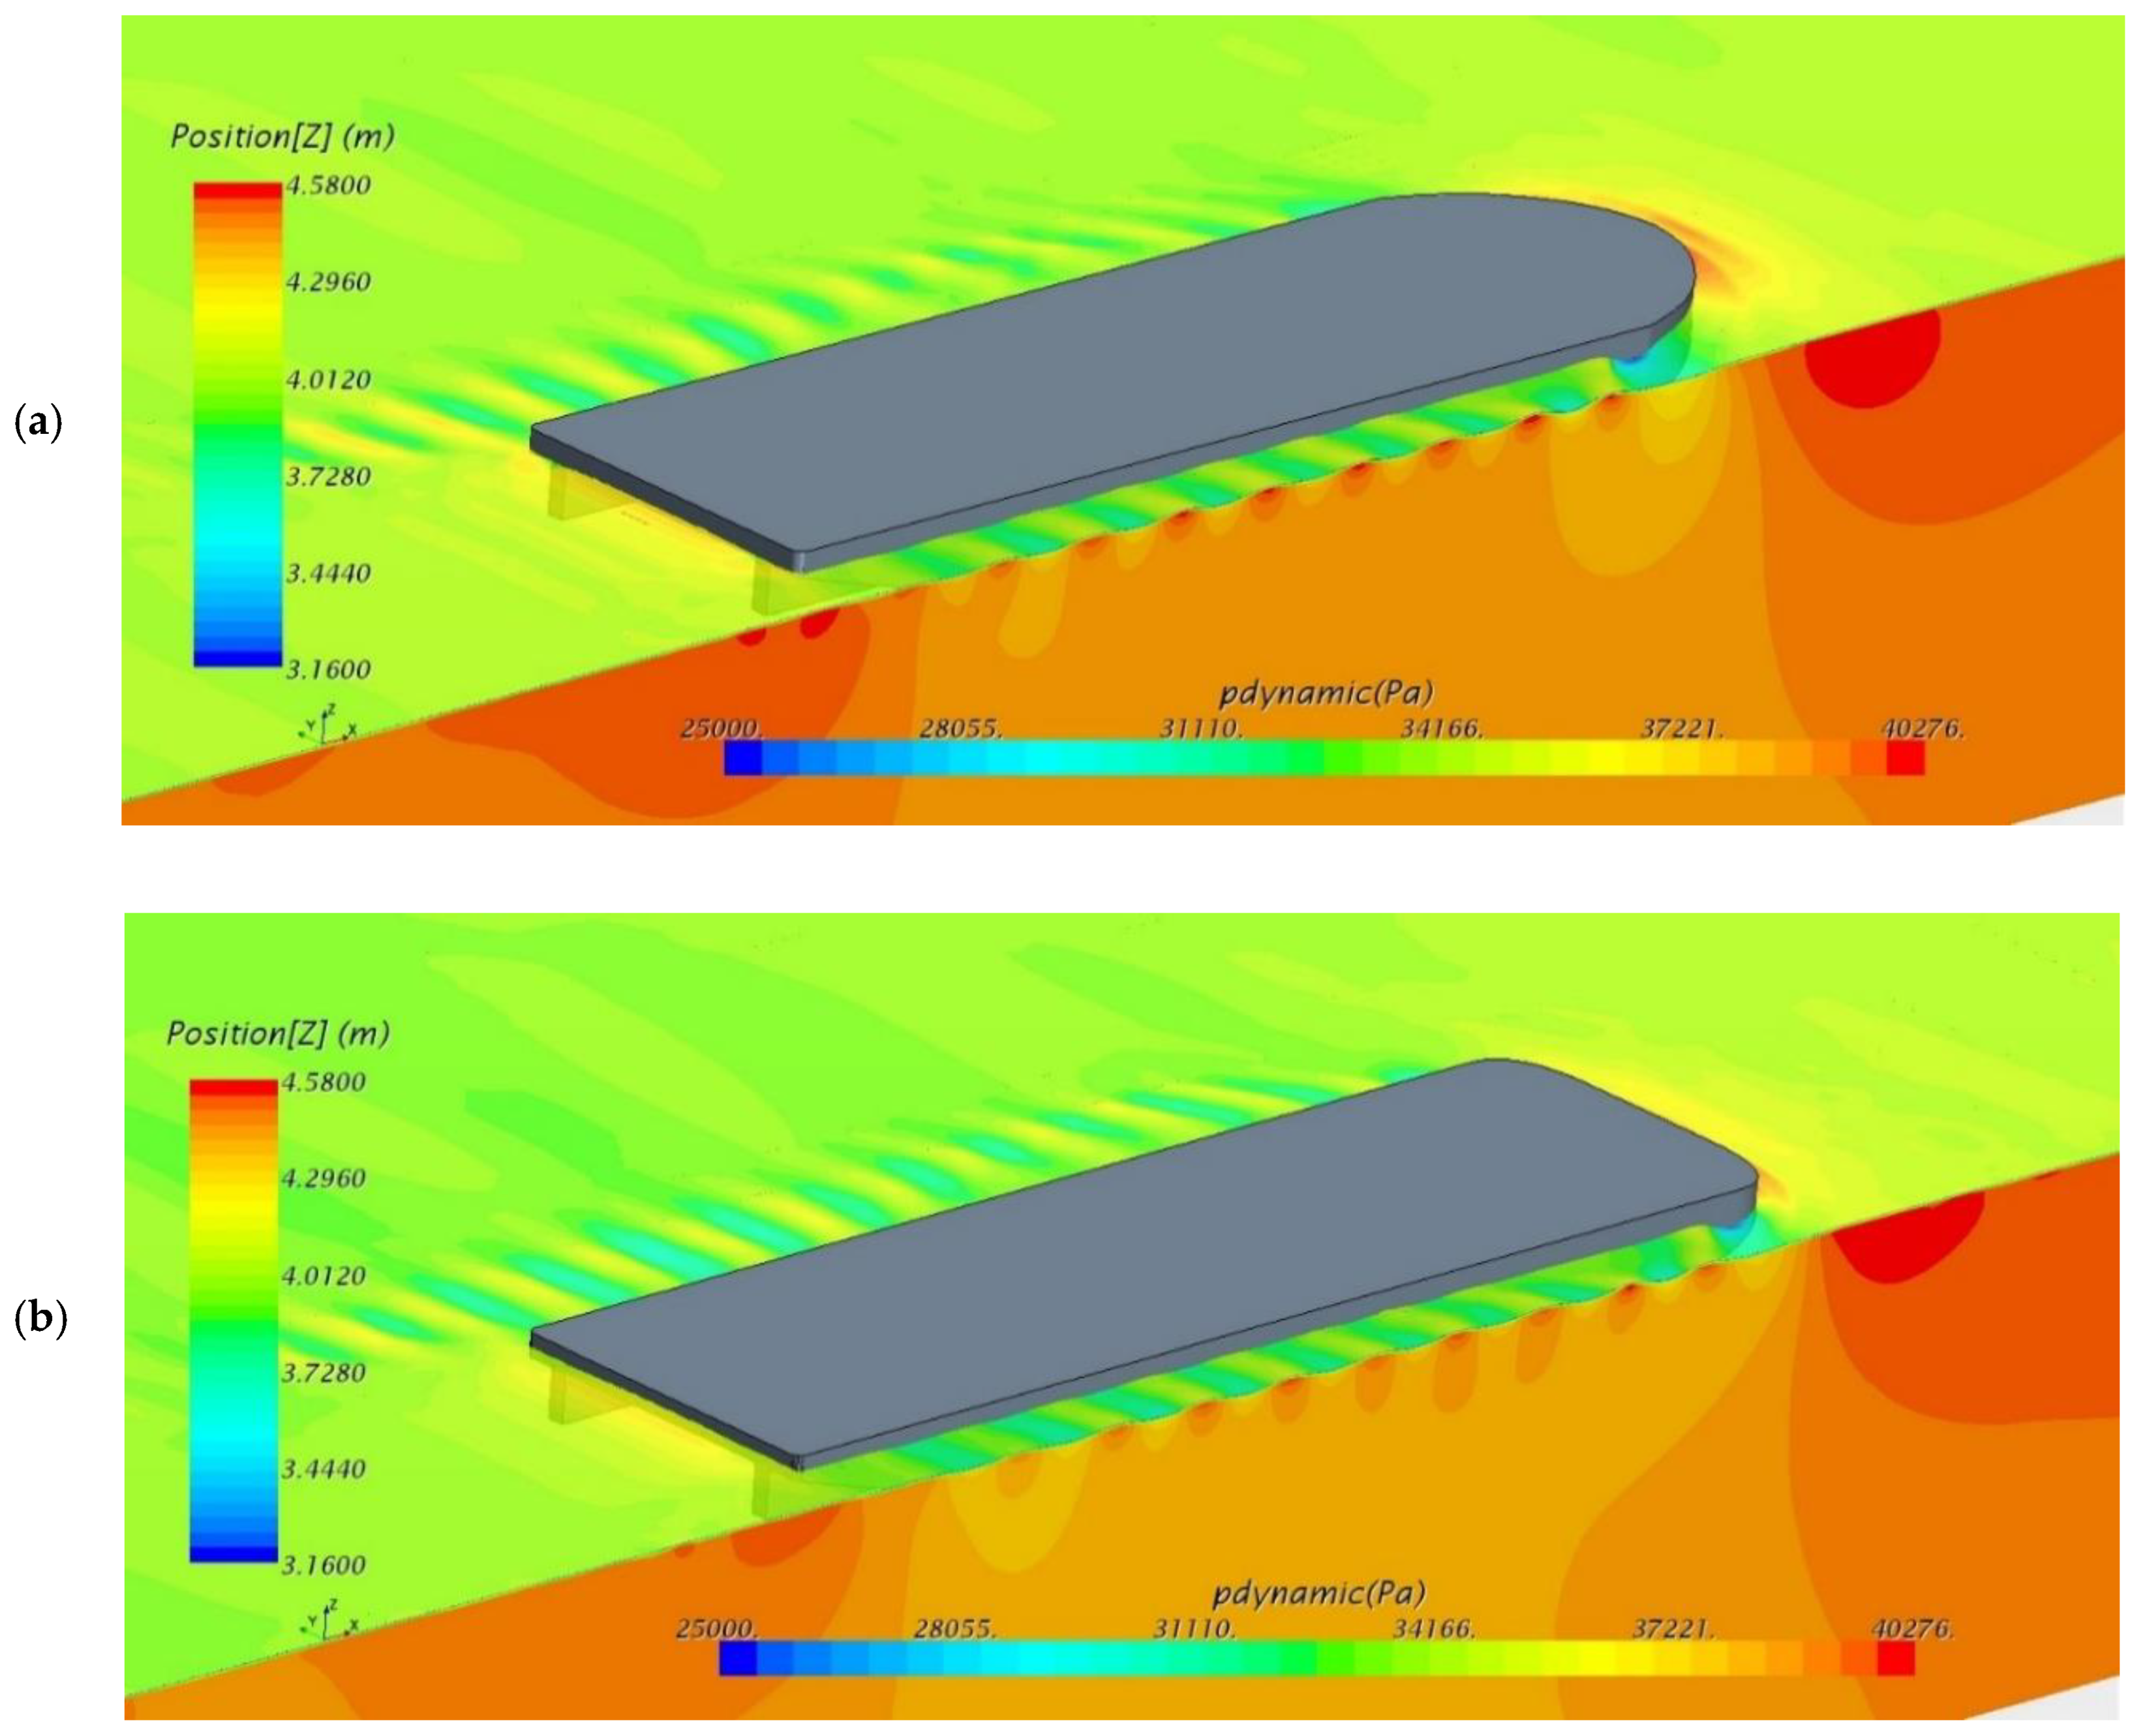
Figure 12 shows the reflected waves from the bank when KNU-020 and KNU-030 are closest to the bank (y′ = 0.2B). The diverging waves from KNU-020 are reflected from the bank after the shoulder, and those from KNU-030 are reflected from the bank from a bit further toward the bow, such that they are reflected toward the barge along the bank. Such reflective waves from the bank do not push the close barge away; however, they cause pressure imbalance because of the difference in the height of free surface at the opposite of the bank, causing the suction force and bow-out moment that pull the ship toward the bank. Indeed, it is clear that the pressure change caused by the difference in the speed of flow coming into the narrow gap between the ship and the bank is an important factor to generating the bank effect. However, it is determined that the effect of free surface must be considered when conducting a comprehensive analysis of the bank effect when the ship is close to the bank.
4. Conclusions
In this study, we conducted a simulation on the change of hydrodynamic forces because of the bank effect and the generation and characteristics of reflected waves due to the bank, by targeting two barges with different bow shapes based on CFD; the results of the analysis are as follows.
X′ value, which represents the surge force, tended to differ, according to the bow shape of the two barges. In other words, KNU-020 with the round-shaped bow showed a higher X′ as the barge became closer to the bank, whereas KNU-030 with the square-shaped bow showed a smaller X′. Y′ value, which represents the sway force, tended to increase as both barges became closer to the bank, because it works as a suction force that pulls them toward the closest bank. N′ value, which represents the yaw moment, increased as the barges became closer to the bank, regardless of the shape of the bow. At y′ = 0.2B, when the barges were at the closest to the bank, it rapidly soared. The moment direction works as the bow-out moment that pushes the bow away from the bank.
As both vessels got closer to the bank, the suction force and bow-out moment were increasing, so caution must be taken to avoid contact with the bank when navigating near the quay wall. In particular, in the case of the KNU-030 barge with the skeg installed, the bow-out moment grew rapidly, so it seems to be necessary to operate with special attention.
The flow speed distribution by the bow shape showed different tendencies between the barges. For KNU-020, the flow speed near the shoulder toward the bank was faster than that of the port side, which is toward the opposite side. It was somewhat slow from the shoulder to the end of the bow; thus, these caused pressure differences in these areas, which resulted in the bow-out moment. However, the flow speed in the port side shoulder became faster, such that the pressure decreased compared to the pressure in the starboard side for KNU-030. This may cause the bow-out moment. Note that, in the port side, the pressure distribution from the shoulder toward the stern was higher than in the starboard side, such that the suction force that pushes the ship towards the bank was identical in both barges. The waves reflected from the bank were imbalanced with the diverging waves from the port side of the barges; thus, it is estimated that such a difference in free surface height may change the pressure on barges.
Author Contributions
Conceptualization: C.H. and S.L.; methodology: S.L.; analysis: C.H.; writing—original draft preparation: S.L.; writing—reviewing and editing: C.H.; supervision: S.L. Both authors have read and agreed to the published version of the manuscript.
Funding
This research was supported by the Basic Science Research Program through the National Research Foundation of Korea (NRF), funded by the Ministry of Education (2017R1D1A3B03030193).
Conflicts of Interest
The authors declare no conflicts of interest.
Nomenclature
| B | Breadth of ship (m) |
| Cb | Block coefficient |
| Fn | Froude number based on length |
| Fnh | Froude number based on water depth |
| GCI | Grid convergence index |
| L | Length overall (m) |
| Re | Reynolds number |
| T | Draft of ship (m) |
| U | Speed of ship (m/s) |
| VOF | Volume of fluid |
| x, y, z | Longitudinal, lateral and vertical axis |
| X | Distance from AP to forward direction (m) |
| XH, YH, NH | Surge force, sway force (N) and yaw moment (Nm) |
| X′, Y′, N′ | Nondimensionalized surge force, sway force and yaw moment |
| y′ | Distance between bank and starboard side (m) |
| Z | Free surface elevation from keel (m) |
References
- Norrbin, N.H. Bank effects on a ship moving through a short dredged channel. In Proceedings of the 10th Symposium on Naval Hydrodynamics, Cambridge, MA, USA, 24–28 June 1974; pp. 71–88. [Google Scholar]
- Li, D.Q.; Ottoson, P.; Tragardh, P. Prediction of bank effects by model tests and mathematical models. In Proceedings of the International Conference on Marine Simulation and Ship Maneuverability (MARSIM 2003), Kanazawa, Japan, 25–28 August 2003; pp. 803–814. [Google Scholar]
- Vantorre, M.; Delefortrie, G.; Eloot, K.; Laforce, E. Experimental investigation of Ship-Bank interaction forces. In Proceedings of the International Conference on Marine Simulation and Ship Maneuverability (MARSIM 2003), Kanazawa, Japan, 25–28 August 2003; pp. 815–823. [Google Scholar]
- Van Hoydonck, W.; Toxopeus, S.; Eloot, K.; Bhawsinka, K.; Queutey, P.; Visonneau, M. Bank effects for KVLCC2. J. Mar. Sci. Technol. 2019, 24, 174–199. [Google Scholar] [CrossRef] [Green Version]
- Zou, L.; Larsson, L. Computational fluid dynamics (CFD) prediction of bank effects including verification and validation. J. Mar. Sci. Technol. 2013, 18, 310–323. [Google Scholar] [CrossRef]
- Ma, S.J.; Zhou, M.G.; Zou, Z.J. Hydrodynamic interaction among hull, rudder and bank for a ship sailing along a bank in restricted waters. J. Hydrodyn. 2013, 25, 809–817. [Google Scholar] [CrossRef]
- Lo, D.C.; Su, D.T.; Chen, J.M. Application of computational fluid dynamics simulations to the analysis of bank effects in restricted waters. J. Navig. 2009, 62, 477–491. [Google Scholar] [CrossRef]
- Liu, H.; Ma, N.; Gu, X. Numerical prediction of ship hydrodynamic derivatives in close proximity to a vertical bank and maneuvering stability analysis. In Proceedings of the ASME 2016 35th International Conference on Ocean, Offshore and Arctic Engineering, Busan, Korea, 19–24 June 2016. [Google Scholar]
- Yasukawa, H. Maneuvering hydrodynamic derivatives and course stability of a ship close to a bank. Ocean Eng. 2019, 188, 106149. [Google Scholar] [CrossRef]
- Lataire, E.; Vantorre, M.; Delefortrie, G. The influence of the ship’s speed and distance to an arbitrarily shaped bank on bank effects. J. Offshore Mech. Arct. Eng. 2018, 140, 021304. [Google Scholar] [CrossRef] [Green Version]
- Im, N.K.; Lee, S.M.; Lee, C.K. The influence of skegs on course stability of a barge with a different configuration. Ocean Eng. 2015, 97, 165–174. [Google Scholar] [CrossRef]
- Ferziger, J.H.; Peric, M. Computational Methods for Fluid Dynamics, 3rd ed.; Springer: Berlin, Germany, 2002. [Google Scholar]
- Terziev, M.; Tezdogan, T.; Oguz, E.; Gourlay, T.; Demirel, Y.K.; Incecik, A. Numerical investigation of the behaviour and performance of ships advancing through restricted shallow waters. J. Fluids Struct. 2018, 76, 185–215. [Google Scholar] [CrossRef] [Green Version]
- Sung, Y.J.; Park, S.H. Prediction of ship manoeuvring performance based on virtual captive model tests. J. Soc. Nav. Arch. Korea 2015, 52, 407–417. [Google Scholar] [CrossRef] [Green Version]
- Toxopeus, S.L.; Simonsen, C.D.; Guilmineau, E.; Visonneau, M.; Xing, T.; Stern, F. Investigation of water depth and basin wall effects on KVLCC2 in manoeuvring motion using Viscous-Flow calculations. J. Mar. Sci. Technol. 2013, 18, 471–496. [Google Scholar] [CrossRef]
- Inoue, S.; Kijima, K.; Doi, M. On the course stability of a barge. Trans. West Jpn. Soc. Nav. Arch. 1977, 54, 193–201. [Google Scholar]
- Chun, H.H.; Kwon, S.H.; Ha, D.D.; Ha, S.U. An experimental study on the course-keeping of an 8000 DWT barge ship. J. Soc. Nav. Arch. Korea 1997, 34, 1–11. [Google Scholar]
- Celik, I.B.; Ghia, U.; Roache, P.J.; Freitas, C.J.; Coleman, H.; Raad, P.E. Procedure for estimation and reporting of uncertainty due to discretization in CFD applications. J. Fluids Eng. 2008, 130, 078001. [Google Scholar] [CrossRef] [Green Version]
- Tezdogan, T.; Incecik, A.; Turan, O. A numerical investigation of the squat and resistance of ships advancing through a canal using CFD. J. Mar. Sci. Technol. 2016, 21, 86–101. [Google Scholar] [CrossRef] [Green Version]
- Lee, S.M.; Hong, C.B. Study on the course stability of very large vessels in shallow water using CFD. Ocean Eng. 2017, 145, 395–405. [Google Scholar] [CrossRef]
Figure 1.
Calculation domain and grid system.

Figure 2.
Calculation conditions for barge-bank distance, y′.

Figure 3.
View of front, rear, bottom, and side: (a) KNU-020; and (b) KNU-030.

Figure 4.
(a) Dimensionless surge force X′, (b) sway force Y′ and (c) yaw moment N′ on KNU-020, according to the barge-bank distance.
Figure 4.
(a) Dimensionless surge force X′, (b) sway force Y′ and (c) yaw moment N′ on KNU-020, according to the barge-bank distance.


Figure 5.
(a) Dimensionless surge force X′, (b) sway force Y′ and (c) yaw moment N′ on KNU-030, according to the barge-bank distance.
Figure 5.
(a) Dimensionless surge force X′, (b) sway force Y′ and (c) yaw moment N′ on KNU-030, according to the barge-bank distance.

Figure 6.
Simulation results for KNU-020 at y′ = 0.2B: (a) wave pattern; (b) velocity field with line integral convolution and hydrodynamic pressure distribution on the bottom; and (c) hydrodynamic pressure on the starboard and port side.
Figure 6.
Simulation results for KNU-020 at y′ = 0.2B: (a) wave pattern; (b) velocity field with line integral convolution and hydrodynamic pressure distribution on the bottom; and (c) hydrodynamic pressure on the starboard and port side.


Figure 7.
Simulation results for KNU-020 at y′ = 0.5B: (a) wave pattern; (b) velocity field with line integral convolution and hydrodynamic pressure distribution on the bottom; and (c) hydrodynamic pressure on the starboard and port side.
Figure 7.
Simulation results for KNU-020 at y′ = 0.5B: (a) wave pattern; (b) velocity field with line integral convolution and hydrodynamic pressure distribution on the bottom; and (c) hydrodynamic pressure on the starboard and port side.


Figure 8.
Simulation results for KNU-020 at y′ = 1.0B: (a) wave pattern; (b) velocity field with line integral convolution and hydrodynamic pressure distribution on the bottom; and (c) hydrodynamic pressure on the starboard and port side.
Figure 8.
Simulation results for KNU-020 at y′ = 1.0B: (a) wave pattern; (b) velocity field with line integral convolution and hydrodynamic pressure distribution on the bottom; and (c) hydrodynamic pressure on the starboard and port side.

Figure 9.
Simulation results for KNU-030 at y′ = 0.2B: (a) wave pattern; (b) velocity field with line integral convolution and hydrodynamic pressure distribution on the bottom; and (c) hydrodynamic pressure on the starboard and port side.
Figure 9.
Simulation results for KNU-030 at y′ = 0.2B: (a) wave pattern; (b) velocity field with line integral convolution and hydrodynamic pressure distribution on the bottom; and (c) hydrodynamic pressure on the starboard and port side.

Figure 10.
Simulation results for KNU-030 at y′ = 0.5B: (a) wave pattern; (b) velocity field with line integral convolution and hydrodynamic pressure distribution on the bottom; and (c) hydrodynamic pressure on both starboard and port side.
Figure 10.
Simulation results for KNU-030 at y′ = 0.5B: (a) wave pattern; (b) velocity field with line integral convolution and hydrodynamic pressure distribution on the bottom; and (c) hydrodynamic pressure on both starboard and port side.

Figure 11.
Simulation results for KNU-030 at y′ = 1.0B: (a) wave pattern; (b) velocity field with line integral convolution and hydrodynamic pressure distribution on the bottom; and (c) hydrodynamic pressure on the starboard and port side.
Figure 11.
Simulation results for KNU-030 at y′ = 1.0B: (a) wave pattern; (b) velocity field with line integral convolution and hydrodynamic pressure distribution on the bottom; and (c) hydrodynamic pressure on the starboard and port side.

Figure 12.
Wave pattern and pressure distribution on bank at y′ = 0.2B: (a) KNU-020; and (b) KNU-030.
Figure 12.
Wave pattern and pressure distribution on bank at y′ = 0.2B: (a) KNU-020; and (b) KNU-030.


Table 1.
Principal particulars of the barge.
| Principal Particulars | KNU-020 | KNU-030 |
|---|---|---|
| Length overall (L) (m) | 91.5 | 91.5 |
| Ship breadth (B) (m) | 27.5 | 27.5 |
| Ship draft (T) (m) | 4.0 | 4.0 |
| Displacement (Δ) (ton) | 9076 | 9209 |
| Block coefficient (Cb) | 0.885 | 0.904 |
Table 2.
Mesh numbers for each mesh configuration.
| Mesh Configuration | Total No. of Cells |
|---|---|
| Coarse | 835,800 |
| Medium | 1,366,588 |
| Fine | 3,100,512 |
Table 3.
Grid convergence study for XH on KNU-020 at y′ = 0.5B.
| Parameter | XH (N) |
|---|---|
| 89,789.0 | |
| 90,615.5 | |
| 95,049.6 | |
| 0.186 | |
| 4.847 | |
| 89,599.6 | |
| 4.89% | |
| 1.13% | |
| 1.40% |
© 2020 by the authors. Licensee MDPI, Basel, Switzerland. This article is an open access article distributed under the terms and conditions of the Creative Commons Attribution (CC BY) license (http://creativecommons.org/licenses/by/4.0/).
Share and Cite
MDPI and ACS Style
Hong, C.; Lee, S. A Study on Barge-Bank Interaction Forces Considering the Reflected Waves. J. Mar. Sci. Eng. 2020, 8, 451. https://doi.org/10.3390/jmse8060451
AMA Style
Hong C, Lee S. A Study on Barge-Bank Interaction Forces Considering the Reflected Waves. Journal of Marine Science and Engineering. 2020; 8(6):451. https://doi.org/10.3390/jmse8060451
Chicago/Turabian StyleHong, Chunbeom, and Sangmin Lee. 2020. "A Study on Barge-Bank Interaction Forces Considering the Reflected Waves" Journal of Marine Science and Engineering 8, no. 6: 451. https://doi.org/10.3390/jmse8060451
Note that from the first issue of 2016, this journal uses article numbers instead of page numbers. See further details here.