Development of Machine Learning Strategy for Predicting the Risk Range of Ship’s Berthing Velocity


1
Ocean Science and Technology School, Korea Maritime & Ocean University, Busan 49112, Korea
2
Graduate School, Korea Maritime & Ocean University, Busan 49112, Korea
3
Division of Global Maritime Studies, Korea Maritime & Ocean University, Busan 49112, Korea
*
Author to whom correspondence should be addressed.
J. Mar. Sci. Eng. 2020, 8(5), 376; https://doi.org/10.3390/jmse8050376
Submission received: 8 April 2020
/
Revised: 15 May 2020
/
Accepted: 21 May 2020
/
Published: 24 May 2020
(This article belongs to the Special Issue Maritime Safety)
Abstract
:Ships are prone to accidents when approaching in a berthing velocity greater than that allowed when determining the risk range corresponding to a port. Therefore, this study develops a machine learning strategy to predict the risk range of an unsafe berthing velocity when the ship approaches in port. To perform analysis, the input parameters were based on the factors affecting the berthing velocity, and the output parameter, i.e., the berthing velocity, was measured at a tanker terminal in the Republic of Korea. Nine machine learning classification algorithms were used to analyze each model, and the top four optimal models were selected through evaluation methods based on the confusion matrix. As a result of the analysis, extra trees, random forest, bagging, and gradient boosting classifiers were identified as good models. As a result of testing using the receiving operator characteristic curve, it was confirmed that the area under the curve of the most dangerous range of berthing velocity was the highest, thus, the risk range was appropriately classified. As such, the derived models can classify and predict the risk range of unsafe berthing velocity before approaching a port; therefore, it is possible to safely berth a ship.
1. Introduction
To load and discharge a ship moored at a terminal, the following procedure is primarily used [1]. First, the ship enters the port and approaches the terminal at a safe approaching speed. Second, when the ship is approaching the terminal facility, parallel to the facility, the hull comes into contact with part of the facility, such as a fender. Berthing energy is generated when the ship first makes contact with the terminal facility; it is then absorbed by the fender so that the ship can safely berth [2]. However, if the ship exceeds the permissible berthing energy of the pier or jetty, accidents might occur, such as damage to the terminal facility and damage to the hull; thus, safety managers, such as the port manager and the ship operator, must pay close attention as the ship berths.
Design guidelines such as PIANC (the world association for waterborne transport infrastructure), British standards, EAU, and Spanish ROM propose designing the berthing energy of a terminal by applying safety margins [3,4,5,6,7]. However, as the increasingly large-scale development of ships rapidly progresses, berthing that exceeds the berthing ability of the terminal facility frequently occurs. According to the Republic of Korea’s Ministry of Oceans and Fisheries survey, an analysis of 14 trade ports reveals that, on average, approximately 30% of ships entering and exiting ports exceed the pier design standards of said ports. In addition, the average excess rate of the ship scale was approximately 200% [8]. For example, in October 2017, a terminal facility at the Jebel Ali Port in Dubai was destroyed as a ship exceeding the berthing ability berthed at a velocity that exceeded the port’s limitations [9].
Ueda et al.’s study mentions that berthing velocity is the most important factor in estimating berthing energy [10]. Therefore, the control of berthing velocity, rather than the size of ship, which has already been determined before berthing, has become more important as the berthing of large ships has increased. Because the importance of berthing velocity has been recognized, relevant research is actively being conducted. In Cho et al.’s study, a basic statistical analysis of berthing velocity was conducted that confirmed that several cases exceeding the design criteria occurred [2]. Lee et al. confirms that the berthing velocity data follows a lognormal distribution [1]. Robous et al. analyze the correlation between the measured values and influential factors of berthing velocity [11]. Lee et al. analyzed the importance of the influence factor of the ship’s berth velocity using machine learning techniques [12]. However, they focused on the design and maintenance of the terminal facilities. Little research has been conducted regarding the berthing velocity with respect to port managers and ship operators.
To prevent potential berthing accidents, it is necessary to conduct an analysis of the risk range of the ship’s berthing velocity from the perspective of the port managers and ship operators. In particular, accidents can be prevented if the risk range of the berthing velocity can be predicted in advance before the ship approaches the port. The risk range of the berthing velocity that can cause an accident includes velocities that exceed the allowable berthing velocity established in the design of the port. Ozturk et al. note that, in terms of maritime transport, risk analyses consist mainly of experts’ judgments, and that risk should be analyzed using quantitative indicators [13]. In particular, Paltrinieri et al. present machine learning methods to quantitatively assess risk in safety-critical industries [14]; Shenping et al. also conducted risk assessment studies using machine learning in relation to the maritime field [15].
Therefore, this study develops a machine learning strategy for predicting the risk range of an unsafe berthing velocity when a ship approaches a port. The algorithm uses nine methods of supervised machine learning classification. To construct models, the input parameters were based on the factors affecting the berthing velocity in PIANC WG (Working Group) 145 [16]. Berthing velocity corresponding to the output parameter was measured at a tanker terminal in the Republic of Korea. The machine learning algorithm, which has good performance in all evaluation models, was adopted to predict and classify the risk range of the berthing velocity.
2. Materials and Methods
The methodology of this study is illustrated in Figure 1. First, the ship’s berthing velocity and risk range were defined and measured. Data was collected based on factors affecting the berthing velocity mentioned by PIANC WG145 [16]. Using the collected data, a basic statistical analysis was performed, and the data was preprocessed so it could be applied to machine learning algorithms. We applied machine learning classification algorithms and compared and evaluated them to enable the selection of models with good performance.
2.1. Berthing Velocity
2.1.1. Definition of Berthing Velocity
Figure 2 illustrates a ship’s berthing process. When the ship comes into contact with the terminal facility, berthing energy is generated. Equation (1), which is based on kinetic energy, can be used to calculate berthing energy. The parameters of berthing energy consist of the ship mass (tonnes), the berthing velocity (cm / s), the eccentricity coefficient , the mass coefficient , the softness factor , and the berth configuration factor [1,2,3].
The most important factor of the parameters for calculating is the squared value of berthing velocity, which is defined as the velocity when the ship first comes into contact with the terminal facility. In particular, because the berthing velocity is a factor that can be adjusted, it can be considered the most important factor in preventing berthing accidents. Berthing velocity is determined by numerous factors [2]; those pertaining to PIANC WG145 are shown in Table 1 [16].
2.1.2. Measured Data
The berthing velocity measurement used in the analysis was obtained in a tanker terminal in the Republic of Korea composed of three jetties. The designed berthing velocity for each jetty was 12, 15, and 15 cm/s. According to the terminal’s operating regulations, critical velocity is set. If a tanker violates the regulations, it will be blacklisted and held accountable when damage is applied to the terminal facility [17]. A photograph and particulars of tanker terminal is shown in Figure 3 and Table 2, respectively.
The device used to measure the berthing velocity was a fixed laser-type docking aid system (DAS). A laser DAS measures the distance as time changed from the wharf to the ship’s hull, as shown in Figure 4 [18], and then calculates the berthing velocity. In this study, 426 berthing velocities were measured using a DAS from March 2017 to November 2019. Especially in the Republic of Korea, the ”Act on the arrival, departure, etc. of ships,” emphasizes the safe berthing of ships by establishing the provision that safety equipment such as DAS should be installed on docks that are used to handle dangerous cargo [19].
2.1.3. Safety Management of Berthing Velocity
Before analyzing the berthing velocity, it is necessary to understand Brolsma’s curve, which provides guidance with respect to the berthing velocity [20]. It is a graph that depicts the appropriate berthing velocity according to ship size by dividing berthing velocity into five nautical conditions. The terminal measuring the berthing velocity in this study is a representative Korean port that is sheltered from the open sea, and it has difficult docking conditions; thus, it corresponds to the “difficult, sheltered” segment of Brolsma’s curve. An evaluation of the data obtained from 426 ships confirms that several cases exceeded the applicable criteria. This data is demonstrated in the graph shown in Figure 5.
In particular, according to Table 2, in this terminal, the berthing velocity is defined as the operated velocity and the designed velocity, is also mentioned. However, even when the terminal’s regulation was applied, it was confirmed that many ships berth with an excessive berthing velocity. In the operated velocity, 166 ships which docked at critical velocity were identified. Moreover, 11 ships exceeded the designated velocity of the jetties (10 Jetty No. 1, 10 No. 2, and 3 No. 3). This indicates that a significant number of ships are in danger of causing accidents, and it can be seen that ship operators and port managers need safety management measures to prevent accidents. In this study, the berthing velocity as the output parameter was classified as either “Safety”, “Warning,” and “Critical” according to the regulations enforced at this terminal, and the risk range is defined as “Critical”.
2.2. Data Acquisition and Statistics
The factors affecting the berthing velocity mentioned in PIANC WG145 were set as the input parameters, and data was collected as shown in Table 1 [21,22,23,24]. In the case of the “closed/open quay/jetty” variable, the jetty that measures the berthing velocity is set as the closed jetty, so Jetty 1, Jetty 2, and Jetty 3 representing the jetty of the berthing have been replaced. In the case of the “human” variable, they were classified as a class representing the pilot’s experience. Regarding “ship type,” the terminal is a tanker terminal, and the type of ship is fixed. State and DWT data indicating the cargo loading conditions and the sizes of the ships were collected. “Berthing maneuver” is an element indicating whether the ship was affected by berthing as a result of external force or as a result of bringing the ship alongside the dock using only tugs and an engine. In this study, the MaxAngle data was collected using the maximum berthing angle. “Equipment/tugs” is the sum of the horse powers of the tugs used. The wind speed and significant wave height were investigated to obtain the “Effect wind” and “Effect wave” data, respectively. In the case of “Current,” this pier was a closed jetty, so it was excluded because the current itself had little effect. Also, according to terminal regulation, the allowable maximum tidal current speed is 0.5 knots or less when the ship is berthing [17]. Therefore, the ship in this terminal is allowed to berth under the negligible current influence. Lastly, “Berthing aids” was used to measure the maximum berthing angle value and the dependent parameter berthing velocity. Table 3 shows a summary of the variables.
Thus, the data about Jetty No. and MaxAngle could be collected through DAS, which measured the berthing velocity. State and DWT were obtained using Port-MIS (Port Management Information System) operated by the Ministry of Oceans and Fisheries in the Republic of Korea [22]. Pilot and Tug H.P. are referred to the harbor pilot’s associations in the port [23]. Finally, for the Wind and Wave variables, the data from the nearest sea buoy to the jetty was referenced [24].
Based on the collected data, data object and attribute type, basic statistical descriptions of data, data visualization, and correlation analysis were performed. Through this process, it was possible to grasp the basic properties of the data necessary to classify berthing velocity; the process was also useful for data preprocessing [25]. Furthermore, by analyzing the correlation between the input and output parameters, we attempted to improve the performance of the final model by excluding certain variables. In this way, selected variables and basic statistics can be used to check characteristics of variables to be used before building a machine learning model.
2.3. Data Preprocessing
Data preprocessing is the process of transforming data into a form suitable for analysis so that it can be applied to machine learning models. This is a necessary process of data analysis; specifically, the initial data must be processed to improve the performance of the machine learning models [26]. In this study, to improve the performance of predicting the risk range of berthing velocity, data was processed using missing value processing, scaling, sampling, and one-hot encoding.
2.3.1. Missing Values
When collecting data, missing values occur due to inevitable circumstances such as mechanical error. Primarily, a measure of central tendency is used for the substitute (e.g., the mean or median) to determine the missing value [27]. For normal (symmetric) data distributions, the mean can be used, while the median should be employed for skewed data distributions.
2.3.2. Scaling
Scaling is the process of standardizing data units. Multi-dimensional data should be standardized and analyzed so that, in the analysis results, there are no errors that might have occurred due to differences in data units [28]. When the data shows normality, standardization by variance and standard deviation is used, and when a non-normal distribution is used, min–max normalization and robust normalization are used.
In this study, continuous data was preprocessed through robust normalization. The robust method is presented in Equation (2) and uses an interquartile range (IQR, and median (). This method is advantageous in that, compared with other techniques, it minimizes the influence of outliers.
2.3.3. Sampling
Sampling is used to reduce errors and improve the performance of classification algorithms using unbalanced datasets. If an unbalanced dataset is used, the original abnormal value may be incorrectly classified as a normal value. Therefore, in this study, the synthetic minority over-sampling technique (SMOTE), which is a general method of over-sampling the minority (abnormal) class, was used [29].
SMOTE is based on the theory that the feature spaces of minority class instances are similar to one another. For each instance in a minority class, SMOTE searches its -nearest neighbors (KNNs), and one neighbor is randomly selected as (instances and are referred to as seed samples). Then, a random number between [0, 1] is generated. The new artificial sample is calculated as [29]:
2.3.4. One-Hot Encoding
One-hot encoding, referred to as a temporary variable, is a method of displaying categorical variables as binary vectors, as shown in Figure 6. In other words, the categorical variable is marked as 0 for all items that do not correspond to the enumeration; for corresponding items, the variable is marked as 1 [30]. This is to prevent the categorical variable from being recognized as a continuous variable when applying the algorithm. In this study, this method was applied to Jetty No., State, and Pilot corresponding to categorical variables.
2.4. Cross Validation
In this study, the k-fold method was used as a cross-validation method in which all of the data is randomly divided into k pieces, as shown in Figure 7. One sample was used as validation data, and the remaining k-1 samples were used as training data [31]. This method was used in this study because it improves the accuracy of datasets with a small number of data samples.
2.5. Machine Learning Algorithms
All modeling methodologies presented below are methodologies related to classification analysis. The models used in this study correspond to multiclass classification [32]; nine algorithms were used.
2.5.1. Decision Tree Classifier
Decision tree classifier (DTC) is an algorithm that uses node segmentation and pruning to predict and classify the input values [33]. There are various algorithms that employ node division criteria, one of the most common techniques being a classification and regression tree (CART) [34]. This is a method of binary splitting when dividing from a node. The tree splitting method used in this algorithm is the Gini index [35]. The Gini index is measure of how often data are misclassified. When the total data ( is separated based on an arbitrary region, it is the multiplication of the ratio of the class belonging to the category ‘’ and the ratio that does not belong to the aforementioned category. The equation is as follows:
2.5.2. Ensemble Methods using Random Forest, Bagging, Extra Trees and Boosting Classifier
The basic concept of ensemble methods is to derive a predictive model by combining several simple models based on boosting and bagging. Four classification models related to ensemble methods were used in this study: a random forest classifier (RFC), bagging, an extra trees classifier (ETC), and a gradient boosting classifier (GBC).
Random forest is a method of learning a model in the form of a forest by many decision trees [36]. The method of constructing the forest is based on bagging (bootstrap aggregating), in which several different train datasets are created, trained, and combined through bootstrapping. A random forest randomly generates each decision tree () divided into b such as . The ensemble learning that classifies the most voted class among , which is the predicted value of several trees generated by bagging, is expressed as Equation (5). Extra (i.e., extremely randomized) trees are algorithms that are added in a randomized step as an extended algorithm in the random forest method [37]. However, the difference from random forest ( is that each tree uses the entire train dataset, not the bootstrap sample.
Boosting is a method in which multiple weak classifiers are gathered to create a strong classifier. That is, weak classifiers are supplemented step by step, and weight is applied to transform them into one strong classifier. In particular, gradient boosting (GBC) generalizes the model by optimizing arbitrary differentiable loss functions as a weight [38].
2.5.3. Gaussian Naive Bayes Classifier
Gaussian naive Bayes (GNB) is based on Bayesian estimation, which is a method of inferring posterior probability through the subject’s prior probability and additional information. It is especially appropriate when the dimension of the feature space is large. In this study, The naive Bayes model assumes that given a class , the features (k point nearest to X) are independent [39]:
2.5.4. K-Nearest Neighbors Classifier
K-nearest neighbors (KNN) is a method wherein the data of KNNs is grouped into a single major category. The constant k is defined by the user, and when the training sample is , let be a reordering of {1,…,m}; for , it is defined by Equation (7) [40]:
2.5.5. Support Vector Machine
A support vector machine (SVM) is a non-stochastic linear and nonlinear classification model that, based on the given data, determines to which category new data belongs [41]. In other words, by learning the distance between each piece of data in two groups and finding the center point, SVM learns how to divide the group by obtaining the optimal hyperplane from the center. Here, if data can be divided into a straight line, a linear classification model is applied; if it cannot be divided into a straight line, a nonlinear classification model is used.
2.5.6. Multi-Layer Perceptron Classifier
A multi-layer perceptron (MLP), also known as a neural network, is a computational model inspired by the neural network structure of the brain [42]. It has the advantage of being able to conclude complex and unrelated datasets. The structure of the MLP consists of an input layer for receiving data, an output layer for classifying and predicting data, and a hidden layer that calculates the data. The MLP of this study uses a feedforward method, where the value transmitted from the input layer is transferred to the hidden layer, and the calculated value is transferred to the output layer and then classified into three output values.
2.6. Evaluation Methods
The machine learning classification algorithm is evaluated based on the confusion matrix [35]. The evaluation measures used in this study—accuracy, recall, and precision—are shown in Figure 8. The evaluation method that can be used considering both recall and precision is the F1 score, which is calculated as follows:
The receiver operating characteristic (ROC) curve consists of a true positive rate (TPR) that corresponds to recall and a false positive rate (FPR), calculated as 1-specificity [43]. The area under the ROC curve is referred to as the area under the curve (AUC), and it is as demonstrated in Equation (9) when TPR (T): and FPR (T): :
In this study, multiclass evaluation is performed because the output parameters are classified into three categories: “Safety”, “Warning”, and “Critical”. In multiclass evaluation, two types of means are used to extract a single number. The first is macro averaging, i.e., computing the metric independently for each class and then computing the average. The second calculates the measure based on the sum of the numerator and denominator, i.e., micro averaging, and is useful to create a bias toward a large number of classes.
3. Results
3.1. Data Statistics and Preprocessing
After the data acquisition is complete, a basic statistical analysis of the collected data is conducted. According to the analysis results, data preprocessing was performed on meaningful variables.
3.1.1. Categorical Variables
Figure 9 and Table 4 show the analysis results of variables corresponding to berthing velocity and categorical variables, respectively. According to the results, 19.5% of the ships that docked had a berthing velocity that was classified as “Critical”. In addition, it can be seen that 11.7%, 29.9%, and 16.8% of the ships docking in Jetty 1, Jetty 2, and Jetty 3, respectively, have “Critical” velocities. In case of State, the ratio of critical velocity was 31.3% (Ballast), 15.3% (Half), and 10.9% (Laden), respectively. Pilots exhibited critical velocity ratios of 17.9% (1st), 23.1% (2nd), 27.8% (3rd), and 26.5% (4th). Therefore, Jetty 2, Ballast, and 3rd class Pilot have the highest critical velocity ratio among the three categorical variables. Table 5 shows the correlation between the dependent and categorical independent variables; the Pilot variable has a p-value of 0.748, which is not significant. It judged that the propensity and competence of the pilot rather than the pilot’s experience have a greater effect on the berthing velocity. Therefore, to improve the performance of machine learning algorithms, the Pilot variable was excluded, and the Jetty No. and State variables were preprocessed using one-hot encoding.
3.1.2. Continuous Variables
Table 6 shows the descriptive statistics of the continuous variables, and the results of the normality test are given in Table 7; none of the variables were normal. Therefore, if there is a missing value, such as Tug H.P., Wind, or Wave, it is processed as a median value. Robust normalization of all continuous variables is applied to data scaling. Figure 10 is a visualization of the continuous dataset. Table 8 shows the correlation between continuous variables. In particular, according to Table 8, the correlation coefficient between the dependent variable Berthing Velocity and the independent variable are −0.11 (DWT), 0.13 (MaxAngle), −0.12 (Tug H.P.), −0.01 (Wind), and −0.01 (Wave), respectively. Accordingly, Wind and Wave variables with low correlation indices and dependent variables were excluded from the construction of the machine learning model. This increases or decreases the tug pushing force depending on the weather, or the ship operator performs berthing more carefully when the weather worsens. Therefore, it seems that the weather parameters and berthing velocity are not related in this terminal.
3.2. Sampling and Cross Validation
To improve the performance of machine learning classification, the analysis excluded Pilot, Wind, and Wave. However, the data divided into Safety (110), Warning (233), and Critical (83) of this study have a problem of imbalance. Due to this, the original abnormal value may be incorrectly classified as a normal value. Therefore, sampling was performed using the SMOTE technique as shown in Table 9. The sampled dataset using the SMOTE technique was divided into a train dataset and test dataset by 8:2 (559:140). To obtain consistent results for model performance, the results were averaged after 10-fold cross validation was performed on the train dataset. The 10-fold train dataset consists of 9 folds with 59 data and the other 1 fold with 58 data.
Therefore, the dataset that has completed all preprocessing is applied to the machine learning model through 10-fold method cross validation.
3.3. Application of Machine Learning Algorithms
Each machine learning classification model was trained using Scikit-learn [44] hyperparameters. The results are shown in Figure 11 and Table 10.
Most models had an accuracy greater than 50%. The extra trees classifier showed the highest accuracy value at 0.6495, and the random forest, bagging, and gradient boosting classifier, in turn, gave good results of over 60%. The F1-score value that considers both recall and precision values was the best performance model with ETC (macro: 0.6349, micro: 0.6495), RFC (0.6245, 0.6351), bagging (0.6050, 0.6153), and GBC (0.5960, 0.6079). Therefore, ensemble methods corresponding to ETC, RFC, bagging, and GBC best classify into three ranges of berthing velocity: “Safety”, “Warning’ and “Critical”.
4. Discussion
This study proposed an algorithm to predict the risk range of a ship’s unsafe berthing velocity. This study does not focus on the safe berthing velocity as it relates to the design of the pier [1,2,3,11]; rather, it centers on ship operators and port managers. In addition, it is more advantageous to use the machine learning technique, which is a quantitative evaluation method, rather than factors such as the opinions of experts as a safety management method [14,15].
The risk classification algorithm of berthing velocity showed accuracy and F1 scores greater than 60% when using ETC, RFC, bagging, and GBC along with ensemble methods. The average AUC value corresponding to velocity classified as “Critical” was 0.6744, and the risk associated with “Critical” berthing velocity was better classified than velocities classified as “Safety” or “Warning.” In particular, despite the lowest accuracy value, macro F1 score, and micro F1 score of 0.6077, 0.5960, and 0.6079, respectively, that were obtained with GBC, the classification performance of “Critical” velocity was high at 0.7578. Therefore, regarding safety management, if ensemble methods are used to construct a classification algorithm used to determine the risk range associated with berthing velocity, the ship operator and port manager can predict the risk of berthing velocity prior to docking and thus prevent accidents.
To prevent accidents from the viewpoint of the purpose of this study, namely risk management of berthing velocity, it is necessary to accurately classify and predict “Critical” velocity. In the previous section, a model was selected for classifying measured berthing velocity into three risk ranges, and predicting said velocity. Moreover, AUC was calculated by entering a test dataset using ensemble methods to examine the classification performance of “Critical” velocity. According to Table 11 and Figure 12, it was found that the performance of classifying “Critical” velocity (class 2) was higher than that of “Safety” and “Warning” in AUC of four models (0.6742, 0.6190, 0.6465, and 0.7578), respectively. Therefore, it can be said that the ensemble methods selected in this study are suitable for classifying and predicting the risk associated with berthing velocity.
As described above, the results of this study can classify and predict critical velocity, which is a dangerous range when ship berthing, through the ensemble method. Through this, the practical aspect of the paper is as follows. First, it is possible to provide a program for classifying and predicting berthing velocities based on ensemble methods, to assist ship operators such as navigators and pilots. It is a method to help to adjust the berthing velocity in advance by providing the range of expected berthing velocities based on the data corresponding to the input parameters used in the study: Jetty No., State, DWT, MaxAngle, and Tug H.P. For example, if the range of berthing velocity output through the input data held at the time the ship enters the port indicates the "Critical" category, berthing can be done with more care. Second, it can be used in the port to manage the berthing of the ship, to predict and classify the danger range of berthing velocity through input parameters provided by the ship. This allows the port manager to warn the vessel when berthing into a critical range category while monitoring the velocity in real-time using the DAS. Third, this result is only for the terminal used in this study, but it can be changed and applied in the same way as this analysis method through data measured in other ports.
This study does have limitations, however. One is that the performance of the risk classification algorithm is not as high as 60%. This means that the rate of error is approximately 40%. To build a more accurate algorithm, data must be accumulated from more than 426 samples. In addition, the data analyzed in this study is limited to a terminal in Korea, and tankers were the only type of ship from which the data was collected. Therefore, it is necessary to collect berthing velocity data of various types of ship from various terminals.
5. Conclusions
In this study, to prevent and prepare for accidents, an algorithm was constructed by predicting the risk range of unsafe berthing velocity prior to docking, and the input parameters based on the factors affecting the berthing velocity were entered. The summary of the research conducted is as follows:
- To build a berthing velocity classification algorithm, berthing velocity was measured at a tanker terminal in the Republic of Korea. According to the regulations under which the tanker terminal operates, the velocities were classified as “Safety”, “Warning” and “Critical”. Therefore, velocity was considered a dependent variable. Also, considering factors affecting berthing velocity, Jetty No., State, Pilot, DWT, MaxAngle, Tug H.P., Wind, Wave were collected and designated as independent variables for analysis.
- As a result of basic statistical analyses performed on the collected data, in the case of categorical variables, the ratio of critical velocity data in all berthing velocity data accounted for the highest proportion for the variables: Jetty No. 2, Ballast, and 1st class with 29.9%, 31.3%, and 17.9%, respectively. In particular, the Pilot variable was not significant as a result of berthing velocity and correlation analysis, with a p-value of 0.748. All continuous variables were concluded to have no normality, so the missing values were processed as median values and scaled using robust normalization. In addition, as a result of correlation analysis, Wind and Wave variables were insignificant.
- Therefore, Pilot, Wind, and Wave variables were excluded from machine learning, while Jetty No., State, DWT, MaxAngle, and Tug H.P. variables were used to construct machine learning classification models. To improve the performance of the model, data sampling was performed using SMOTE. Nine types of machine learning classification models were applied: DTC, RFC, bagging, ETC, GBC, GNB, KNN, SVM, and MLP.
- Accuracy, recall, precision, and F1 score values through the confusion matrix were used to evaluate the performance of machine learning classification models. As a result of the evaluation, ETC, RFC, bagging, and GBC performed best. Using these models, the classification performance of “Critical” velocity was found to be higher than that of “Safety” and “Warning” velocity, confirming that it is a suitable algorithm for safety management. Therefore, by using ensemble methods such as ETC, RFC, bagging, and GBC to predict the risk range of unsafe berthing velocity, berthing accidents can be prevented.
Author Contributions
Conceptualization, H.-T.L. and I.-S.C; data curation, H.-T.L.; formal analysis, H.-T.L.; investigation, H.-T.L.; methodology, H.-T.L.; software, H.-T.L.; supervision, I.-S.C.; validation, H.-T.L., W.-J.S., J.-S.L. and I.-S.C.; visualization, H.-T.L.; writing—original draft preparation, H.-T.L.; writing—review and editing, I.-S.C. All authors have read and agreed to the published version of the manuscript.
Funding
This research received no external funding.
Conflicts of Interest
The authors declare no conflict of interest.
References
- Lee, S.W.; Cho, J.W.; Cho, I.S. Estimation of Berthing velocity using probability distribution characteristics in tanker terminal. Korean Inst. Navig. Port Res. 2019, 25, 809–818. [Google Scholar]
- Cho, I.S.; Cho, J.W.; Lee, S.W. A basic study on the measured data analysis of berthing velocity of ships. J. Korean Soc. Coast. Disaster Prev. 2018, 5, 61–71. [Google Scholar] [CrossRef]
- Roubos, A.; Peters, D.J.; Groenewegen, L.; Steenbergen, R. Partial safety factors for berthing velocity and loads on marine structures. Mar. Struct. 2018, 58, 73–91. [Google Scholar] [CrossRef] [Green Version]
- PIANC (The World Association for Waterborne Transport Infrastructure). Guideline for Design of Fender Systems; PIANC Marcom Working Group 33: Brussels, Belgium, 2002. [Google Scholar]
- BS 6349-4. Maritime Works: Code of Practice for Design of Fendering and Mooring Systems; British Standards: London, UK, 2014. [Google Scholar]
- Grabe, J. Recommendations of the Committee for Waterfront Structures Harbours and Waterways EAU 2012, 9th ed.; EAU: Hamburg, Germany, 2012. [Google Scholar]
- ROM 0.2-90. Maritime Works Recommendations: Action in the Design of Maritime and Harbor Works; Spanish ROM: Madrid, Spain, 1990. [Google Scholar]
- MOF (Ministry of oceans and fisheries). Analysis on causes of damage to fender facilities and ship’s hulls. In Optimal Installation and Maintenance Efficiency of Fender Facilities; MOF: Sejong, Korea, 2018; Volume 2, pp. 303–314. [Google Scholar]
- TradeWinds. Speed and Confusion Blamed for CMA CGM Dock Smash. Available online: https://www.tradewindsnews.com/safety/speed-and-confusion-blamed-for-cma-cgm-dock-smash/2-1-454412 (accessed on 18 March 2020).
- Ueda, S.; Yamase, S.; Okada, T. Reliability design of fender systems for berthing ship. In Proceedings of the 32nd PIANC International Navigation Congress 2010, Liverpool, UK, 10–14 May 2010; Curran Associates, Inc.: New York, NY, USA, 2010; Volume 3, pp. 604–614. [Google Scholar]
- Roubos, A.; Groenewegen, L.; Peters, D.J. Berthing velocity of large seagoing vessels in the port of Rotterdam. Mar. Struct. 2017, 51, 202–219. [Google Scholar] [CrossRef]
- Lee, H.T.; Lee, S.W.; Cho, J.W.; Cho, I.S. Analysis of Feature Importance of Ship’s Berthing Velocity Using Classification Algorithms of Machine Learning. J Korean Soc. Mar. Environ. Saf. 2020, 26, 139–148. [Google Scholar]
- Ozturk, U.; Birbil, S.I.; Cicek, K. Evaluating navigational risk of port approach manoeuvrings with expert assessments and machine learning. Ocean Eng. 2019, 192, 106558. [Google Scholar] [CrossRef]
- Paltrinieri, N.; Comfort, L.; Reniers, G. Learning about risk: Machine learning for risk assessment. Saf. Sci. 2019, 118, 475–486. [Google Scholar] [CrossRef]
- Shenping, H.; Cunqiang, C.; Quangen, F. Risk assessment of ship navigation using Bayesian learning. In Proceedings of the 2007 IEEE International Conference on Industrial Engineering and Engineering Management, Singapore, 2–5 December 2007; pp. 1878–1882. [Google Scholar]
- PIANC. Berthing Velocity Analysis of Seagoing Vessels Over 30,000 DWT; PIANC Marcom Working Group 145: Brussels, Belgium, 2020. [Google Scholar]
- Oilhub Korea Yeosu Co., Ltd. OKYC Terminal Information and Regulations (A-TQI-3007-01) Rev.1. Available online: http://www.okyc.co.kr/file (accessed on 28 April 2020).
- Trelleborg. MARIMATECH Berthing Aid System for the Safe Approach. Available online: http://www.dockingassist.eu/partnerDetail/2 (accessed on 20 March 2017).
- National Law Information Center. Act on the arrival, Departure, etc. of Ships. Ministry of Government Legislation in Republic of Korea. Available online: http://www.law.go.kr/LSW/eng/engLsSc.do?menuId=2§ion=lawNm&query=Act+on+the+arrival%2C+departure&x=41&y=27#liBgcolor0 (accessed on 20 January 2020).
- Brolsma, J.U.; Hirs, J.A.; Langeveld, J.M. On fender design and berthing velocities. In Proceedings of the PIANC 24th International Navigation Congress, Leningrad, Russia, 6–14 September 1977; PIANC: Leningrad, Russia, 1977. Section II, Subject 4. pp. 87–100. [Google Scholar]
- IMO (International Maritime Organization). Global Integrated Shipping Information System (GISIS). Available online: https://gisis.imo.org/Public/Default.aspx (accessed on 23 January 2020).
- MOF (Ministry of oceans and fisheries). PORT-MIS. Available online: https://new.portmis.go.kr/portmis/ (accessed on 23 January 2020).
- Yeosu Harbor Pilot’s Association. Pilot Forecast. Available online: http://www.yspilot.co.kr/ (accessed on 25 January 2020).
- KMA (Korea Meteorological Administration). Weather Data Release Portal. Available online: https://data.kma.go.kr/cmmn/static/staticPage.do?page=intro (accessed on 23 January 2020).
- Han, J.; Pei, J.; Kamber, M. Getting know your data. In Data Mining: Concepts and Techniques, 3rd ed.; Elsevier: Waltham, MA, USA, 2011; pp. 39–82. [Google Scholar]
- Zheng, A.; Casari, A. Fancy Tricks with Simple Numbers. In Feature Engineering for Machine Learning: Principles and Techniques for Data Scientists, 1st ed.; O’Reilly Media, Inc.: Sevastopol, CA, USA, 2018; pp. 5–40. [Google Scholar]
- Han, J.; Pei, J.; Kamber, M. Data Preprocessing. In Data Mining: Concepts and Techniques, 3rd ed.; Elsevier: Waltham, MA, USA, 2011; pp. 83–124. [Google Scholar]
- Chawla, N.V.; Bowyer, K.W.; Hall, L.O.; Kegelmeyer, W.P. SMOTE: Synthetic minority over-sampling technique. J. Artif. Intell. Res. 2002, 16, 321–357. [Google Scholar] [CrossRef]
- Zheng, Z.; Cai, Y.; Li, Y. Oversampling method for imbalanced classification. Comput. Inform. 2016, 34, 1017–1037. [Google Scholar]
- Harris, D.; Harris, S. Sequential Logic Design. In Digital Design and Computer Architecture, 1st ed.; Elsevier: San Francisco, CA, USA, 2007; pp. 103–166. [Google Scholar]
- Hastie, T.; Tibshirani, R.; Friedman, J. Model Assessment and Selection. In The Elements of Statistical Learning: Data Mining, Inference, and Prediction, 2nd ed.; Springer Science & Business Media: New York, NY, USA, 2009; pp. 219–260. [Google Scholar]
- Har-Peled, S.; Roth, D.; Zimak, D. Constraint Classification for Multiclass Classification and Ranking. In Advances in Neural Information Processing Systems; Becker, B., Thrun, S., Obermayer, K., Eds.; MIT Press: Cambridge, MA, USA, 2003; pp. 809–816. [Google Scholar]
- Hastie, T.; Tibshirani, R.; Friedman, J. Additive Models, Trees, and Related Methods. In The Elements of Statistical Learning: Data Mining, Inference, and Prediction, 2nd ed.; Springer Science & Business Media: New York, NY, USA, 2009; pp. 295–336. [Google Scholar]
- Breiman, L.; Friedman, J.; Stone, C.J.; Olsen, R.A. Classification and Regression Trees; Wadsworth: Monterey, CA, USA, 1984. [Google Scholar]
- Han, J.; Pei, J.; Kamber, M. Classification: Basic Concepts. In Data Mining: Concepts and Techniques, 3rd ed.; Elsevier: Waltham, MA, USA, 2011; pp. 327–392. [Google Scholar]
- Breiman, L. Random Forest. Mach. Learn. 2001, 45, 5–32. [Google Scholar] [CrossRef] [Green Version]
- Geurts, P.; Ernst, D.; Wehenkel, L. Extremely randomized trees. Mach. Learn. 2006, 63, 3–42. [Google Scholar] [CrossRef] [Green Version]
- Friedman, J.H. Greedy function approximation: A gradient boosting machine. Ann. Stat. 2001, 29, 1189–1232. [Google Scholar] [CrossRef]
- Hastie, T.; Tibshirani, R.; Friedman, J. Kernel Smoothing Methods. In The Elements of Statistical Learning: Data Mining, Inference, and Prediction, 2nd ed.; Springer Science & Business Media: New York, NY, USA, 2009; pp. 191–218. [Google Scholar]
- Shalev-Shwartz, S.; Ben-Davied, S. Nearest Neighbor. In Understanding Machine Learning: From Theory to Algorithms, 1st ed.; Cambridge University Press: New York, NY, USA, 2014; pp. 258–267. [Google Scholar]
- Cortes, C.; Vapnik, V. Support-vector networks. Mach. Learn. 1995, 20, 273–297. [Google Scholar] [CrossRef]
- Shalev-Shwartz, S.; Ben-Davied, S. Neural Network. In Understanding Machine Learning: From Theory to Algorithms, 1st ed.; Cambridge University Press: New York, NY, USA, 2014; pp. 268–284. [Google Scholar]
- Fawcett, T. An introduction to ROC analysis. Pattern Recognit. Lett. 2006, 27, 861–874. [Google Scholar] [CrossRef]
- Pedregosa, F.; Varoquaux, G.; Gramfort, A.; Michel, V.; Thirion, B.; Grisel, O.; Blondel, M.; Prettenhofer, P.; Weiss, R.; Bubourg, V. Scikit-learn: Machine learning in Python. J. Mach. Learn. Res. 2011, 12, 2825–2830. [Google Scholar]
Figure 1.
Flowchart of study.

Figure 2.
Ship’s berthing process.
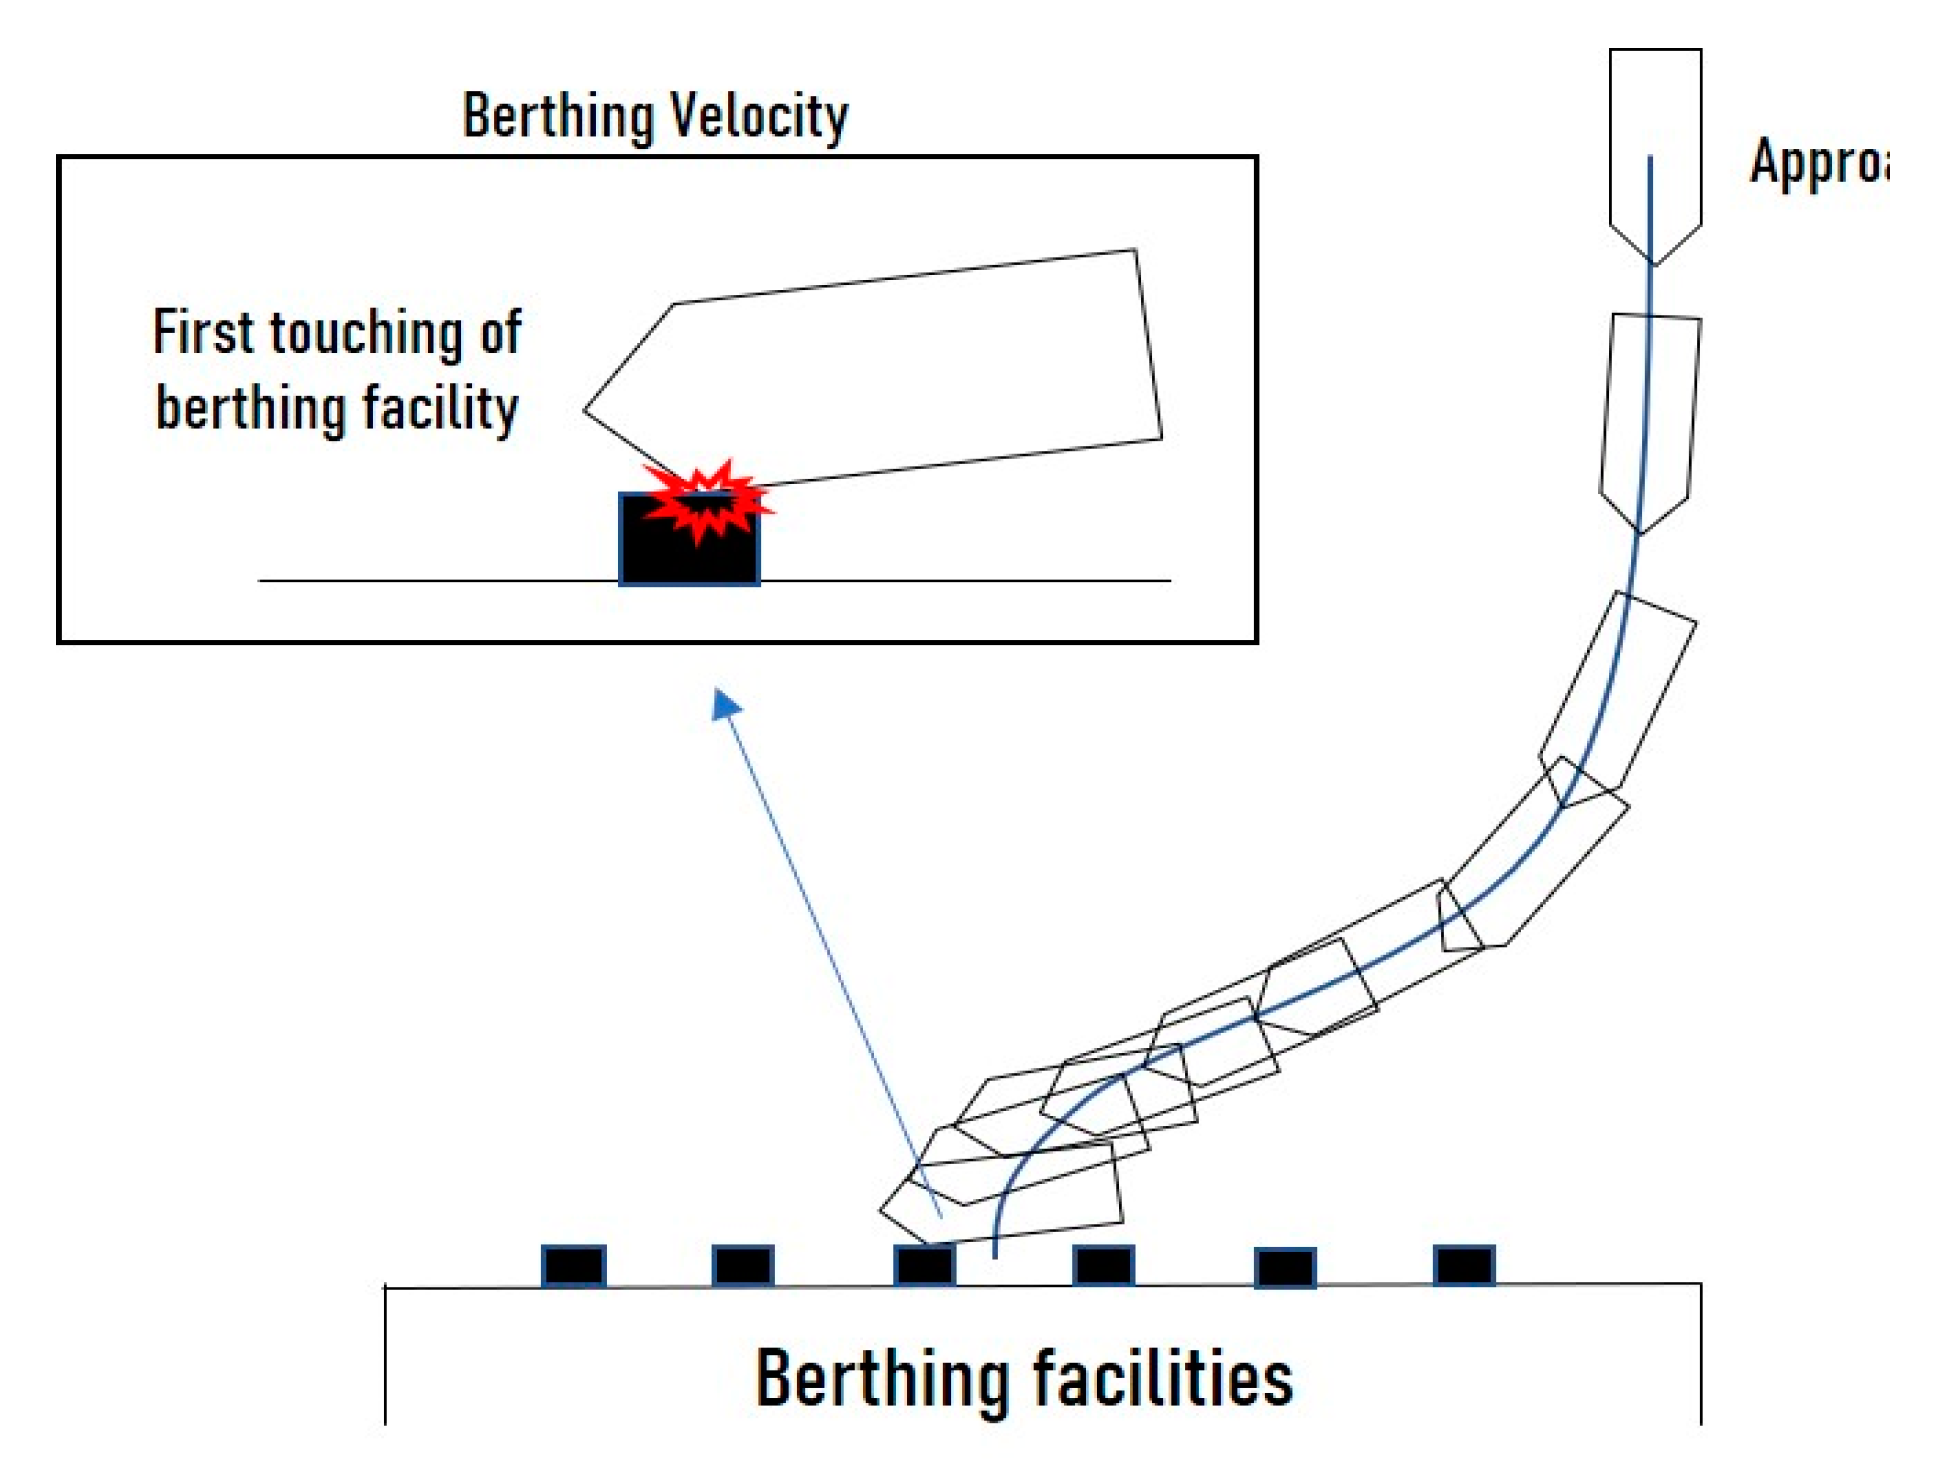
Figure 3.
Photograph of the tanker terminal.

Figure 4.
Fixed laser docking aid system (DAS).

Figure 5.
Brolsma’s curve.

Figure 6.
Example of one-hot encoding.

Figure 7.
Example of k-folding.

Figure 8.
Example of an evaluation measure.

Figure 9.
Visualization of the categorical dataset: (a) Jetty No.; (b) State; and (c) Pilot.

Figure 10.
Visualization of the continuous dataset.

Figure 11.
Box plot of the (a) accuracy; (b) macro F1; (c) micro F1; obtained machine learning classification in k-folding. The upper part of the box represents the highest data point at 1.5 interquartile range (IQR), and the lower part represents the lowest data point at 1.5 IQR. The average value of the result is indicated by an orange line, and the outlier value is individually indicated by a hollow circle. DTC = decision tree classifier, RFC = random forest classifier, ETC = extra trees classifier, GBC = gradient boosting classifier, GNB = Gaussian naive Bayes, KNN = k-nearest neighbors, SVM = support vector machine, MLP = multi-layer perceptron.

Figure 12.
Receiver operating characteristic (ROC) curve of the (a) ETC; (b) RFC; (c) Bagging; (d) GBC.
Figure 12.
Receiver operating characteristic (ROC) curve of the (a) ETC; (b) RFC; (c) Bagging; (d) GBC.


Table 1.
Overview of factors influencing the berthing velocity.
| Factors | Positive Contribution | Negative Contribution |
|---|---|---|
| Closed/open quay/jetty | Closed quay | Open jetty |
| Human factor | Highly experienced | Limited experience |
| Vessel type | Container and LNG vessels | Bulk and tanker |
| Berthing maneuver | Horizontal berthing angle | Large angle of berthing |
| Equipment/tugs | Use of sufficient tugs | Only use of thrusters |
| Effect wind | Low | High |
| Effect waves | Small | Large |
| Current | Weak | Strong |
| Berthing aids | Berthing assistance | None |
Table 2.
Particulars of the tanker terminal.
| Jetty 1 | Jetty 2 | Jetty 3 | |
|---|---|---|---|
| Depth | 17.0 m | 18.0 m | 19.5 m |
| Capacity | 80,000 DWT1 | 120,000 DWT | 320,000 DWT |
| Max LOA2 | 295 m | 321 m | 382 m |
| Berthing velocity (Designed) | 12 cm/s | 15 cm/s | 15 cm/s |
| Berthing velocity (Operated) | Safety: 5 cm/s, Warning: 6~10 cm/s, Critical: over 10 cm/s | ||
1 deadweight tonnage, 2 length overall.
Table 3.
Summary of variables.
| # | Name | Type | Description | Unit |
|---|---|---|---|---|
| 1 | Jetty No. | Categorical | Jetty Number (No. 1–3) | - |
| 2 | State | Categorical | Ballast, Half, Laden | - |
| 3 | Pilot | Categorical | Pilot Class (1st–4th) | - |
| 4 | DWT | Continuous | Deadweight tonnages | tonne |
| 5 | MaxAngle | Continuous | Max berthing angle | degree |
| 6 | Tug Horse Power | Continuous | Tugs total horse power | H.P. |
| 7 | Wind | Continuous | Wind speed | m/s |
| 8 | Wave | Continuous | Significant wave height | m |
| 9 | Berthing Velocity | Categorical | Safety, Warning, Critical (0, 1, 2) | cm/s |
| Continuous | Ship’s berthing velocity | cm/s |
Table 4.
Descriptive statistics for the categorical dataset.
| Berthing Velocity | Jetty No. | State | Pilot | Total | |||||||
|---|---|---|---|---|---|---|---|---|---|---|---|
| No.1 | No.2 | No.3 | Ballast | Half | Laden | 1st | 2nd | 3rd | 4th | ||
| Safety | 55 | 28 | 27 | 26 | 51 | 33 | 86 | 10 | 4 | 10 | 110 |
| Warning | 96 | 80 | 57 | 73 | 87 | 73 | 189 | 20 | 9 | 15 | 233 |
| Critical | 20 | 46 | 17 | 45 | 25 | 13 | 60 | 9 | 5 | 9 | 83 |
| Total | 171 | 154 | 101 | 144 | 163 | 119 | 335 | 39 | 18 | 34 | 426 |
Table 5.
Results of correlation analysis for the categorical dataset.
| Coefficient | Value | p-Value | |
|---|---|---|---|
| Jetty No. | Phi | 0.221 | 0.000 |
| Cramer’s V | 0.156 | 0.000 | |
| State | Phi | 0.232 | 0.000 |
| Cramer’s V | 0.164 | 0.000 | |
| Pilot | Phi | 0.090 | 0.748 |
| Cramer’s V | 0.067 | 0.748 |
Table 6.
Descriptive statistics for the continuous dataset.
| DWT (tonne) | MaxAngle (degree) | Tug H.P. (H.P.) | Wind (m/s) | Wave (m) | Berthing Velocity (cm/s) | |
|---|---|---|---|---|---|---|
| Count | 426 | 426 | 408 | 413 | 413 | 426 |
| Mean | 74814 | 7.6 | 11,225 | 5.3 | 0.9 | 7.4 |
| Std | 61,980 | 3.8 | 4886 | 3.1 | 0.5 | 3.6 |
| Min | 3445 | 0.1 | 2600 | 0.0 | 0.1 | 0.3 |
| 25% | 46,176 | 5.1 | 8600 | 3.0 | 0.5 | 4.9 |
| 50% | 49,990 | 7.1 | 10,000 | 4.9 | 0.7 | 6.7 |
| 75% | 100,927 | 9.7 | 12,405 | 7.2 | 1.1 | 9.1 |
| Max | 321225 | 31.8 | 30,218 | 14.2 | 2.8 | 21.2 |
Table 7.
Descriptive normality test.
| Count | Statistic | p-Value | Decision at Level (5%) | |
|---|---|---|---|---|
| DWT | 426 | 0.35153 | 2.3039E−46 | Reject normality |
| MaxAngle | 426 | 0.07043 | 0.02862 | Reject normality |
| Tug H.P. | 408 | 0.24329 | 1.67069E−21 | Reject normality |
| Wind | 413 | 0.07945 | 0.01061 | Reject normality |
| Wave | 413 | 0.14548 | 4.70307E−8 | Reject normality |
| Berthing Velocity | 426 | 0.08211 | 0.00623 | Reject normality |
Table 8.
Correlation analysis of continuous variables.
| Berthing Velocity | DWT | MaxAngle | Tug H.P | Wind | Wave | |
|---|---|---|---|---|---|---|
| Berthing Velocity | 1 | −0.11 * | 0.13 ** | −0.12 * | −0.01 | −0.01 |
| DWT | 1 | −0.13 ** | 0.86 *** | −0.03 | −0.02 | |
| MaxAngle | 1 | −0.12 * | 0.08 | 0.01 | ||
| Tug H.P. | 1 | 0.0 | 0.0 | |||
| Wind | 1 | 0.73 *** | ||||
| Wave | 1 |
p * < 0.1, p ** < 0.05, p *** < 0.01.
Table 9.
Result of sampling using the synthetic minority over-sampling technique (SMOTE). technique.
Table 9.
Result of sampling using the synthetic minority over-sampling technique (SMOTE). technique.
| Berthing Velocity | Original Data | SMOTE Sampling |
|---|---|---|
| Safety | 110 | 233 |
| Warning | 233 | 233 |
| Critical | 83 | 233 |
| Total | 426 | 699 |
Table 10.
Evaluation indices for machine learning classification approaches.
| Algorithm | Accuracy | Recall | Precision | F1 Score | Remark | |||
|---|---|---|---|---|---|---|---|---|
| Macro | Micro | Macro | Micro | Macro | Micro | |||
| DTC | 0.5688 | 0.5711 | 0.5688 | 0.5678 | 0.5688 | 0.5594 | 0.5688 | |
| RFC | 0.6351 | 0.6390 | 0.6351 | 0.6333 | 0.6351 | 0.6245 | 0.6351 | 2) |
| Bagging | 0.6153 | 0.6146 | 0.6153 | 0.6160 | 0.6153 | 0.6050 | 0.6153 | 3) |
| ETC | 0.6495 | 0.6473 | 0.6495 | 0.6433 | 0.6495 | 0.6349 | 0.6495 | 1) |
| GBC | 0.6077 | 0.6029 | 0.6079 | 0.5974 | 0.6079 | 0.5960 | 0.6079 | 4) |
| GNB | 0.4562 | 0.4470 | 0.4562 | 0.4010 | 0.4562 | 0.4011 | 0.4592 | |
| KNN | 0.5744 | 0.5780 | 0.5744 | 0.5772 | 0.5744 | 0.5594 | 0.5744 | |
| SVM | 0.5277 | 0.5275 | 0.5277 | 0.5185 | 0.5277 | 0.5036 | 0.5277 | |
| MLP | 0.5367 | 0.5362 | 0.5367 | 0.5256 | 0.5367 | 0.5206 | 0.5367 | |
Table 11.
Area under the curve (AUC) indices for ensemble methods.
| Micro | Macro | Safety | Warning | Critical | |
|---|---|---|---|---|---|
| ETC | 0.5976 | 0.5973 | 0.6222 | 0.4947 | 0.6742 |
| RFC | 0.5215 | 0.5255 | 0.4855 | 0.4720 | 0.6190 |
| Bagging | 0.5654 | 0.5620 | 0.5912 | 0.4474 | 0.6465 |
| GBC | 0.6477 | 0.6476 | 0.6207 | 0.5486 | 0.7578 |
| Average | 0.5831 | 0.5831 | 0.5799 | 0.4907 | 0.6744 |
© 2020 by the authors. Licensee MDPI, Basel, Switzerland. This article is an open access article distributed under the terms and conditions of the Creative Commons Attribution (CC BY) license (http://creativecommons.org/licenses/by/4.0/).
Share and Cite
MDPI and ACS Style
Lee, H.-T.; Lee, J.-S.; Son, W.-J.; Cho, I.-S. Development of Machine Learning Strategy for Predicting the Risk Range of Ship’s Berthing Velocity. J. Mar. Sci. Eng. 2020, 8, 376. https://doi.org/10.3390/jmse8050376
AMA Style
Lee H-T, Lee J-S, Son W-J, Cho I-S. Development of Machine Learning Strategy for Predicting the Risk Range of Ship’s Berthing Velocity. Journal of Marine Science and Engineering. 2020; 8(5):376. https://doi.org/10.3390/jmse8050376
Chicago/Turabian StyleLee, Hyeong-Tak, Jeong-Seok Lee, Woo-Ju Son, and Ik-Soon Cho. 2020. "Development of Machine Learning Strategy for Predicting the Risk Range of Ship’s Berthing Velocity" Journal of Marine Science and Engineering 8, no. 5: 376. https://doi.org/10.3390/jmse8050376
Note that from the first issue of 2016, this journal uses article numbers instead of page numbers. See further details here.