Article

Comparison of Five TRIzol-Based Protein Preparation Methods for 2-DE Production From Challenging Marine Dinoflagellate Samples: A Case Study on Two Benthic Prorocentrum Species

by
Thomas Chun-Hung Lee
,
Kaze King-Yip Lai
,
Celia Sze-Nga Kwok
,
Steven Jing-Liang Xu
and
Fred Wang-Fat Lee
*
Department of Science, School of Science and Technology, The Open University of Hong Kong, Hong Kong, China
*
Author to whom correspondence should be addressed.
J. Mar. Sci. Eng. 2020, 8(5), 363; https://doi.org/10.3390/jmse8050363
Submission received: 14 April 2020 / Revised: 9 May 2020 / Accepted: 18 May 2020 / Published: 21 May 2020
(This article belongs to the Special Issue Biocomplexity and Microbial Diversity in a Marine System)

Abstract

:
Two-dimensional gel electrophoresis (2-DE) is a major element of conventional gel-based proteomics, which resolves complex protein mixtures. Protein extraction with the removal of interfering substances from the sample remains the key to producing high-quality 2-DE profiles. Marine dinoflagellates contain large endogenous amounts of salts, nucleic acids, polysaccharides, phenolic compounds, pigments, and other interfering compounds. These substances are detrimental to the quality of gel images. Protein preparation using TRIzol reagent is a promising method for producing high-quality 2-DE profiles for dinoflagellate samples. In addition to its remarkable performance, the TRIzol method’s several advantages have made it a popular and widely used method in the field of 2-DE sample preparation. Nonetheless, the quality of 2-DE of samples from certain dinoflagellate species is not as high as previously reported when the same TRIzol protocol is applied. Therefore, modifications to the original TRIzol method are required to remove interfering substances from those challenging dinoflagellate samples. In this study, the original TRIzol method and four modified methods, namely the aliquot TRIzol method, re-TRIzol method, TRIzol method with a commercial clean-up kit, and TRIzol method with trichloroacetic acid/acetone precipitation, were compared. Performance of these five methods in terms of protein yield, background signal, and resolution and number of protein spots was investigated on samples from two benthic Prorocentrum species: P. lima and P. hoffmannianum. Our results demonstrated that high-quality 2-DE could be achieved from P. lima samples prepared using both the original TRIzol method and the TRIzol method with a commercial clean-up kit. However, the original TRIzol method failed to produce high-quality 2-DE profiles for P. hoffmannianum samples. Among the four modified TRIzol methods, only the TRIzol method with a commercial clean-up kit could yield substantially improved high-quality 2-DE profiles for P. hoffmannianum samples. This combination of the conventional TRIzol method with a commercial clean-up kit potentially represents a promising protein extraction methodology for obtaining high-quality 2-DE profiles for difficult dinoflagellate samples.

1. Introduction

Harmful algal blooms (HABs) are natural phenomena that occur as a result of the massive growth of microalgae in water bodies. These events may be induced by eutrophication, which in turn is caused by various human activities [1]. HABs negatively affect aquatic ecosystems, and, during these blooms, even some algal species are capable of producing shellfish toxins [2]. These toxins accumulate in shellfish through the food chain and eventually threaten human health. However, much remains unknown regarding the mechanisms of blooming and shellfish toxin production. Scientists have applied “omics” technologies to uncover the cellular pathways and mechanisms of physiological responses from the gene to the protein level. Proteomics involves examining the protein spots patterns of harmful microalgae, and it is a useful approach to understanding the mechanisms of HABs. Classical gel-based proteomics comprises separation of proteins using two-dimensional gel electrophoresis (2-DE) followed by protein identification using mass spectrometry (MS) such as matrix-assisted laser desorption/ionization time-of-flight MS or liquid chromatography with tandem mass spectrometry (LC-MS/MS). The 2-DE method, which was invented in 1975, 45 years ago, is an essential tool for resolving proteins in proteomics [3,4]. It is a powerful and widely used method for the analysis of complex protein mixtures extracted from cells, tissues, or other biological samples. Despite the advances in non-gel-based proteomic technologies, 2-DE remains one of the most commonly used techniques in proteomic research because it is relatively inexpensive and simple to set up and provides a fast overview of the proteome of interest. Currently, commercial MS analysis services on protein spot identification is available and the cost would be much cheaper than the service on non-gel based MS analysis. The 2-DE method is a useful alternative for laboratories struggling to access the expensive equipment needed for MS for non-gel-based proteomic analysis. In addition, a major strength of 2-DE is its ability to detect proteins with posttranslational modifications (PTMs), which are easily visualized on a 2-DE gel image. In many instances, post-translationally modified proteins appear as distinct spot trains on the horizontal axis of 2-DE gels. In contrast to 2-DE, non-gel-based mass spectrometric analytical methods provide information on the isoelectric points and molecular masses of intact proteins only if the proteins can be identified. Such information can be easily read from the gel image. Notably, 2-DE analysis not only provides information on protein abundance and their PTMs, but also allows isolation of proteins in considerable amounts (up to microgram levels if required) for downstream structural analysis or de novo peptide sequencing using LC-MS/MS. For instance, a group of novel nitrogen-associated (NAP) proteins and their amino acid sequences were successfully identified in Alexandrium species by using 2-DE and de novo sequencing on the isolated protein spots [5]. The authors also generated the antiserum against NAP in-house by the injection of NAP protein spots from the 2-DE into the rats [5].
A high-quality 2-DE with well-resolved protein spots is a critical prerequisite for finding proteins in different abundant and successful subsequent identification of protein spots. However, marine dinoflagellate samples contain large endogenous amounts of salts, nucleic acids, polysaccharides, phenolic compounds, pigments, and other interfering compounds. These compounds interfere in the first dimension of 2-DE, namely isoelectric point focusing (IEF), and cause serious streaking in the gels. Chan et al. [6] were the first to develop a protein preparation method for the dinoflagellate Prorocentrum triestinum, but this method required many laborious procedures, such as protease inhibition, RNase, DNase, and endonuclease treatments, in addition to desalting steps. Furthermore, lengthy protein extraction and purification steps were not only time consuming but also induced a reduction in the number of protein spots. Lee and Lo [7] previously demonstrated the successful application of TRIzol reagent for the production of high-quality 2-DE of Alexandrium sp. and Scrippsiella sp. Using TRIzol reagent for the production of 2-DE profiles has some benefits. First, this method is simple and fast, requiring only several hours, and the procedures are easy to follow. Most importantly, TRIzol reagent can extract DNA, RNA, and proteins simultaneously from a single sample, which enables sampling for different omics analyses [8]. TRIzol is a monophasic solution of phenol and guanidine isothiocyanate. DNA, RNA, and protein can be separated by phase separation after adding chloroform. RNA can be extracted by precipitation from upper aqueous layer after adding isopropanol. DNA and protein are precipitated from interphase/organic layer with ethanol and phenol-ethanol supernatant by isopropanol precipitation, respectively. Moreover, guanidine isothiocyanate denatures protease to prevent further degradation of proteins and enhances the recovery of the samples without the need of additional protease inhibitor [7,9]. Owing to these advantages, protein extraction through the use of TRIzol reagent for 2-DE has become popular and has been applied in several proteomic studies of various algal species (Table 1), such as planktonic P. donghaiense [10], the toxin-producing A. catenella (responsible for paralytic shellfish poisoning) [11,12,13,14], yessotoxin-producing Linulodinium polyedrum [15], diarrhetic shellfish poisoning toxin producing Prorocentrum [16], unarmed dinoflagellate, Gymnodinium [17], and Eustigmatophyte, Microchloropsis gaditana [18]. In a comparative proteomic study of a cold-water diatom Fragilariopsis cylindrus, almost a thousand protein spots were observed and compared in 2-DE profiles of TRIzol-extracted diatom samples with a clear background [9]. Although the TRIzol method is promising and has produced remarkable results for most dinoflagellate samples, a few research groups have reported that they were unable to achieve 2-DE profiles for some dinoflagellate samples that were as high-quality as those reported by others. Wang et al. were the first to indicate that the intensity of protein spots obtained from using the TRIzol method was always somewhat vague [19]. Moreover, proteins of the benthic dinoflagellate species P. hoffmannianum prepared using the TRIzol method produced gel images of unsatisfactory quality [16]. These reports have indicated that the amount and types of interfering substances were species-dependent, and some of the substances in particular species could not be effectively removed using the TRIzol method. To improve the quality of 2-DE profiles from such difficult dinoflagellate samples, we proposed four modified TRIzol-based methods, namely the aliquot TRIzol method, re-TRIzol method, TRIzol method with a commercial clean-up kit, and TRIzol method with trichloroacetic acid (TCA)/acetone precipitation. Two benthic dinoflagellate species, P. lima (CCMP1368) and P. hoffmannianum (CCMP2804), were used in this study. The 2-DE of these two species prepared using the modified methods and the original TRIzol method were compared in terms of protein yield, background signal, resolution, and the number of protein spots.

2. Materials and Methods

2.1. Algal Cultures and Cultivation Condition

Two benthic Prorocentrum species, P. lima (CCMP1368) and P. hoffmannianum (CCMP2804), were purchased from the National Center for Marine Algae and Microbiota. They were inoculated in sterilized 100-mL conical flasks containing L1 medium [20] without sodium silicate (L1-Si medium). The salinity of natural seawater for preparation of the medium was adjusted to 30 ppt and autoclaved before use. The cultures were maintained in the growth cultivation chamber at 22 °C under a 12 h light–dark cycle. The light intensity was adjusted to 3000 Lux and was provided by cool white fluorescent light. Stock cultures were maintained in the exponential growth phase by transferring them to a new L1-Si medium in the ratio of 1:10 v/v every 3 weeks.

2.2. Cell Harvesting

Approximately 1 × 10⁶ vegetative cells of P. lima and P. hoffmannianum in the mid-exponential growth phase were harvested using centrifugation at 1620× g for 3 min. The pellet was subsequently transferred to a microcentrifuge tube, twice rinsed with sterile seawater, and centrifuged again for 9400× g for 1 min. The seawater was completely removed, and the pellet was stored at −80 °C before protein extraction.

2.3. Protein Extraction

2.3.1. TRIzol Method

Protein extraction using TRIzol reagent (Cat. No: 15596018, Life Technologies, New York, NY, USA) proceeded according to the manufacturer’s instruction with some modifications. Briefly, 1 mL of the TRIzol reagent was added to the cell pellet and sonicated the cell pellet on ice for at least 3 min with pulses of 20 s. Cell debris was removed by centrifugation, and 200 μL of chloroform (Cat. No: 650498, Sigma-Aldrich, St. Louis, MO, USA) was added to the supernatant and shaken vigorously for 15 s. Then, the sample was incubated at room temperature for 5 min and centrifuged for 12,000× g for 15 min at 4 °C. The upper colorless layer and the precipitate between the two layers were removed, and 300 μL of ethanol (Cat no.: 459828, Sigma-Aldrich, St. Louis, MO, USA) was added to the lower organic layer and mixed. The mixture was centrifuged at 2000× g for 5 min. The supernatant was transferred to a new microcentrifuge tube, and 1.5 mL of isopropanol (Cat no.: I9516, Sigma-Aldrich, St. Louis, MO, USA) was added. The mixture was incubated at room temperature for at least 30 min for protein precipitation. The precipitate was washed twice using ethanol. Finally, 20–30 μL of resolubilisation buffer (7 M urea, 2 M thiourea, 4% 3-((3-cholamidopropyl) dimethylammonio)-1-propanesulfonate (CHAPS), 40 mM Tris pH 8.7) [8] was added to solubilize the protein pellet.

2.3.2. Aliquot TRIzol Method

A total of 400 μL of TRIzol reagent (Cat. No: 15596018, Life Technologies, New York, NY, USA) was added to the pellet, and then, the pellet was sonicated with the same conditions mentioned in Section 2.3.1. In this case, the sonicated product was evenly distributed in four new microcentrifuge tubes (i.e., with 100 μL aliquot in each tube), and the aforementioned TRIzol method proceeded. After washing the protein precipitate with ethanol, we added 5–10 μL of resolubilisation buffer [8] to solubilize the protein pellet. Protein extracts from the four aliquots were pooled into one sample.

2.3.3. Re-TRIzol Method

Samples extracted using the TRIzol method were subjected to a second TRIzol extraction. TRIzol reagent (Cat. No: 15596018, Life Technologies, New York, USA) was added to the dissolved protein in the resolubilisation buffer [8], and the TRIzol method was repeated without sonication.

2.3.4. TRIzol Method with a Commercial Clean-Up Kit

Protein from the samples was first extracted using the TRIzol method according to the aforementioned procedure until the protein precipitate was completely dissolved in resolubilisation buffer. The dissolved protein was washed using a commercial 2-DE clean-up kit (Cat. no.: 80-6484-51, GE Healthcare, Chicago, USA). Most of the procedures were performed according to Procedure B, as described in the manual. Briefly, in the first step of Procedure B, three volumes of precipitant solution were added to the sample and mixed by vortexing. Then, the sample was incubated on ice for 15 min. Subsequently, three volumes of co-precipitant solutionwere added to the sample and mixed by vortexing. The protein was precipitated and was collected by centrifuging the tubes at 12,000× g for 10 min. The supernatant was removed, and three to four volumes of the co-precipitant were added to the pellet. The precipitate was centrifuged again for 5 min, and the supernatant was removed and discarded. Then, 18 mΩ of water, produced by Thermo Scientific Barnstead Easypure II water purification system, was added on top of each pellet to cover it. Wash buffer (1 mL), which was prechilled for at least 1 h at −20 °C, and 5 μL of wash additive were added and vortexed. The following procedure was amended so that the tube was incubated at −20 °C for at least 1 to 1.5 h and mixed by vortexing every 10–15 min. After incubation, we centrifuged the tube at 12,000× g for 10 min and completely removed the supernatant; subsequently, the pellet was allowed to air dry. Finally, 20–30 μL of resolubilisation buffer [8] was added to solubilize the protein pellet.

2.3.5. TRIzol Method with TCA/Acetone Precipitation

Protein from the samples was first extracted using the aforementioned TRIzol method and completely dissolved in the resolubilisation buffer. Then, three volumes of 10% TCA/acetone solution were added and sample was precipitated at −20 °C overnight. The pellet was obtained by removing the supernatant through centrifugation. The pellet was washed three times with cold acetone and air-dried. Finally, 20–30 μL of resolubilisation buffer [8] was added to solubilize the protein pellet.

2.4. Protein Quantification, Two-Dimensional Gel Electrophoresis and Imaging Analysis

First, the amount of protein extracted from the samples was quantified using a modified Bradford protein assay (Cat. no.: 5000006 Bio-Rad, California, USA) [21]. For the first dimension of 2-DE, each immobilized pH gradient (IPG) strip (Cat no.: 1632034, Bio-Rad, California, USA) was rehydrated in 340 μL of rehydration buffer (containing 7 M urea, 2 M thiourea, 4% CHAPS, 0.2% dithiothreitol (DTT) [8], and 3.4 μL of IPG buffer pH 3–10) (Cat. no.: 1631112, Bio-Rad, California, USA) for 16 h. During passive rehydration, 100 μg of protein from each sample was mixed with rehydration buffer. In terms of the cup-loading method, 100 μg of protein was mixed with rehydration buffer and then loaded onto the rehydrated strip (pH 4–7) by using the loading cup. IEF was performed using a Protean IEF cell (Cat. no.: 1654001, Bio-Rad, California, USA). Voltages were applied as follows: 1 h at 100 V, 2 h at 300 V, 2 h at 1000 V, 2 h at 4000 V, and 5 h at 8000 V. After IEF, the gel strip was equilibrated with equilibration buffer (50 mM Tris pH 8.8, 6 M urea, 30% glycerol, 2% sodium dodecyl sulfate, 1% DTT, and trace amounts of bromophenol blue) [8] for 30 min. Later, the gel strip was transferred to the equilibration buffer containing 1% iodoacetamide (Cat no.: 1632109, Bio-Rad, California, USA) (instead of DTT(Cat no.: 1610611, Bio-Rad, California, USA)) and was incubated for 30 min. For the second dimension, the protein in the gel strips was separated using 10% polyacrylamide gel at 15 mA per gel until the bromophenol blue dye reached the end of the gel. Subsequently, the protein spots in the gel were visualized using silver staining. Finally, the stained gels were scanned and saved in TIFF format. Detection and analysis of the spots were performed using Melanie 7 (GeneBio, Genève, Switzerland) according to the user manual.

2.5. Statistical Analysis

All data are presented as means ± standard derivations of three biological replicates in each extraction method. The amount of protein extracted and the number of protein spots from the samples was compared for several modified methods using Tukey’s post hoc analysis with SPSS statistic 22 software (IBM, New York, USA). A P value ≤ 0.05 indicated a significant difference.

3. Results and Discussion

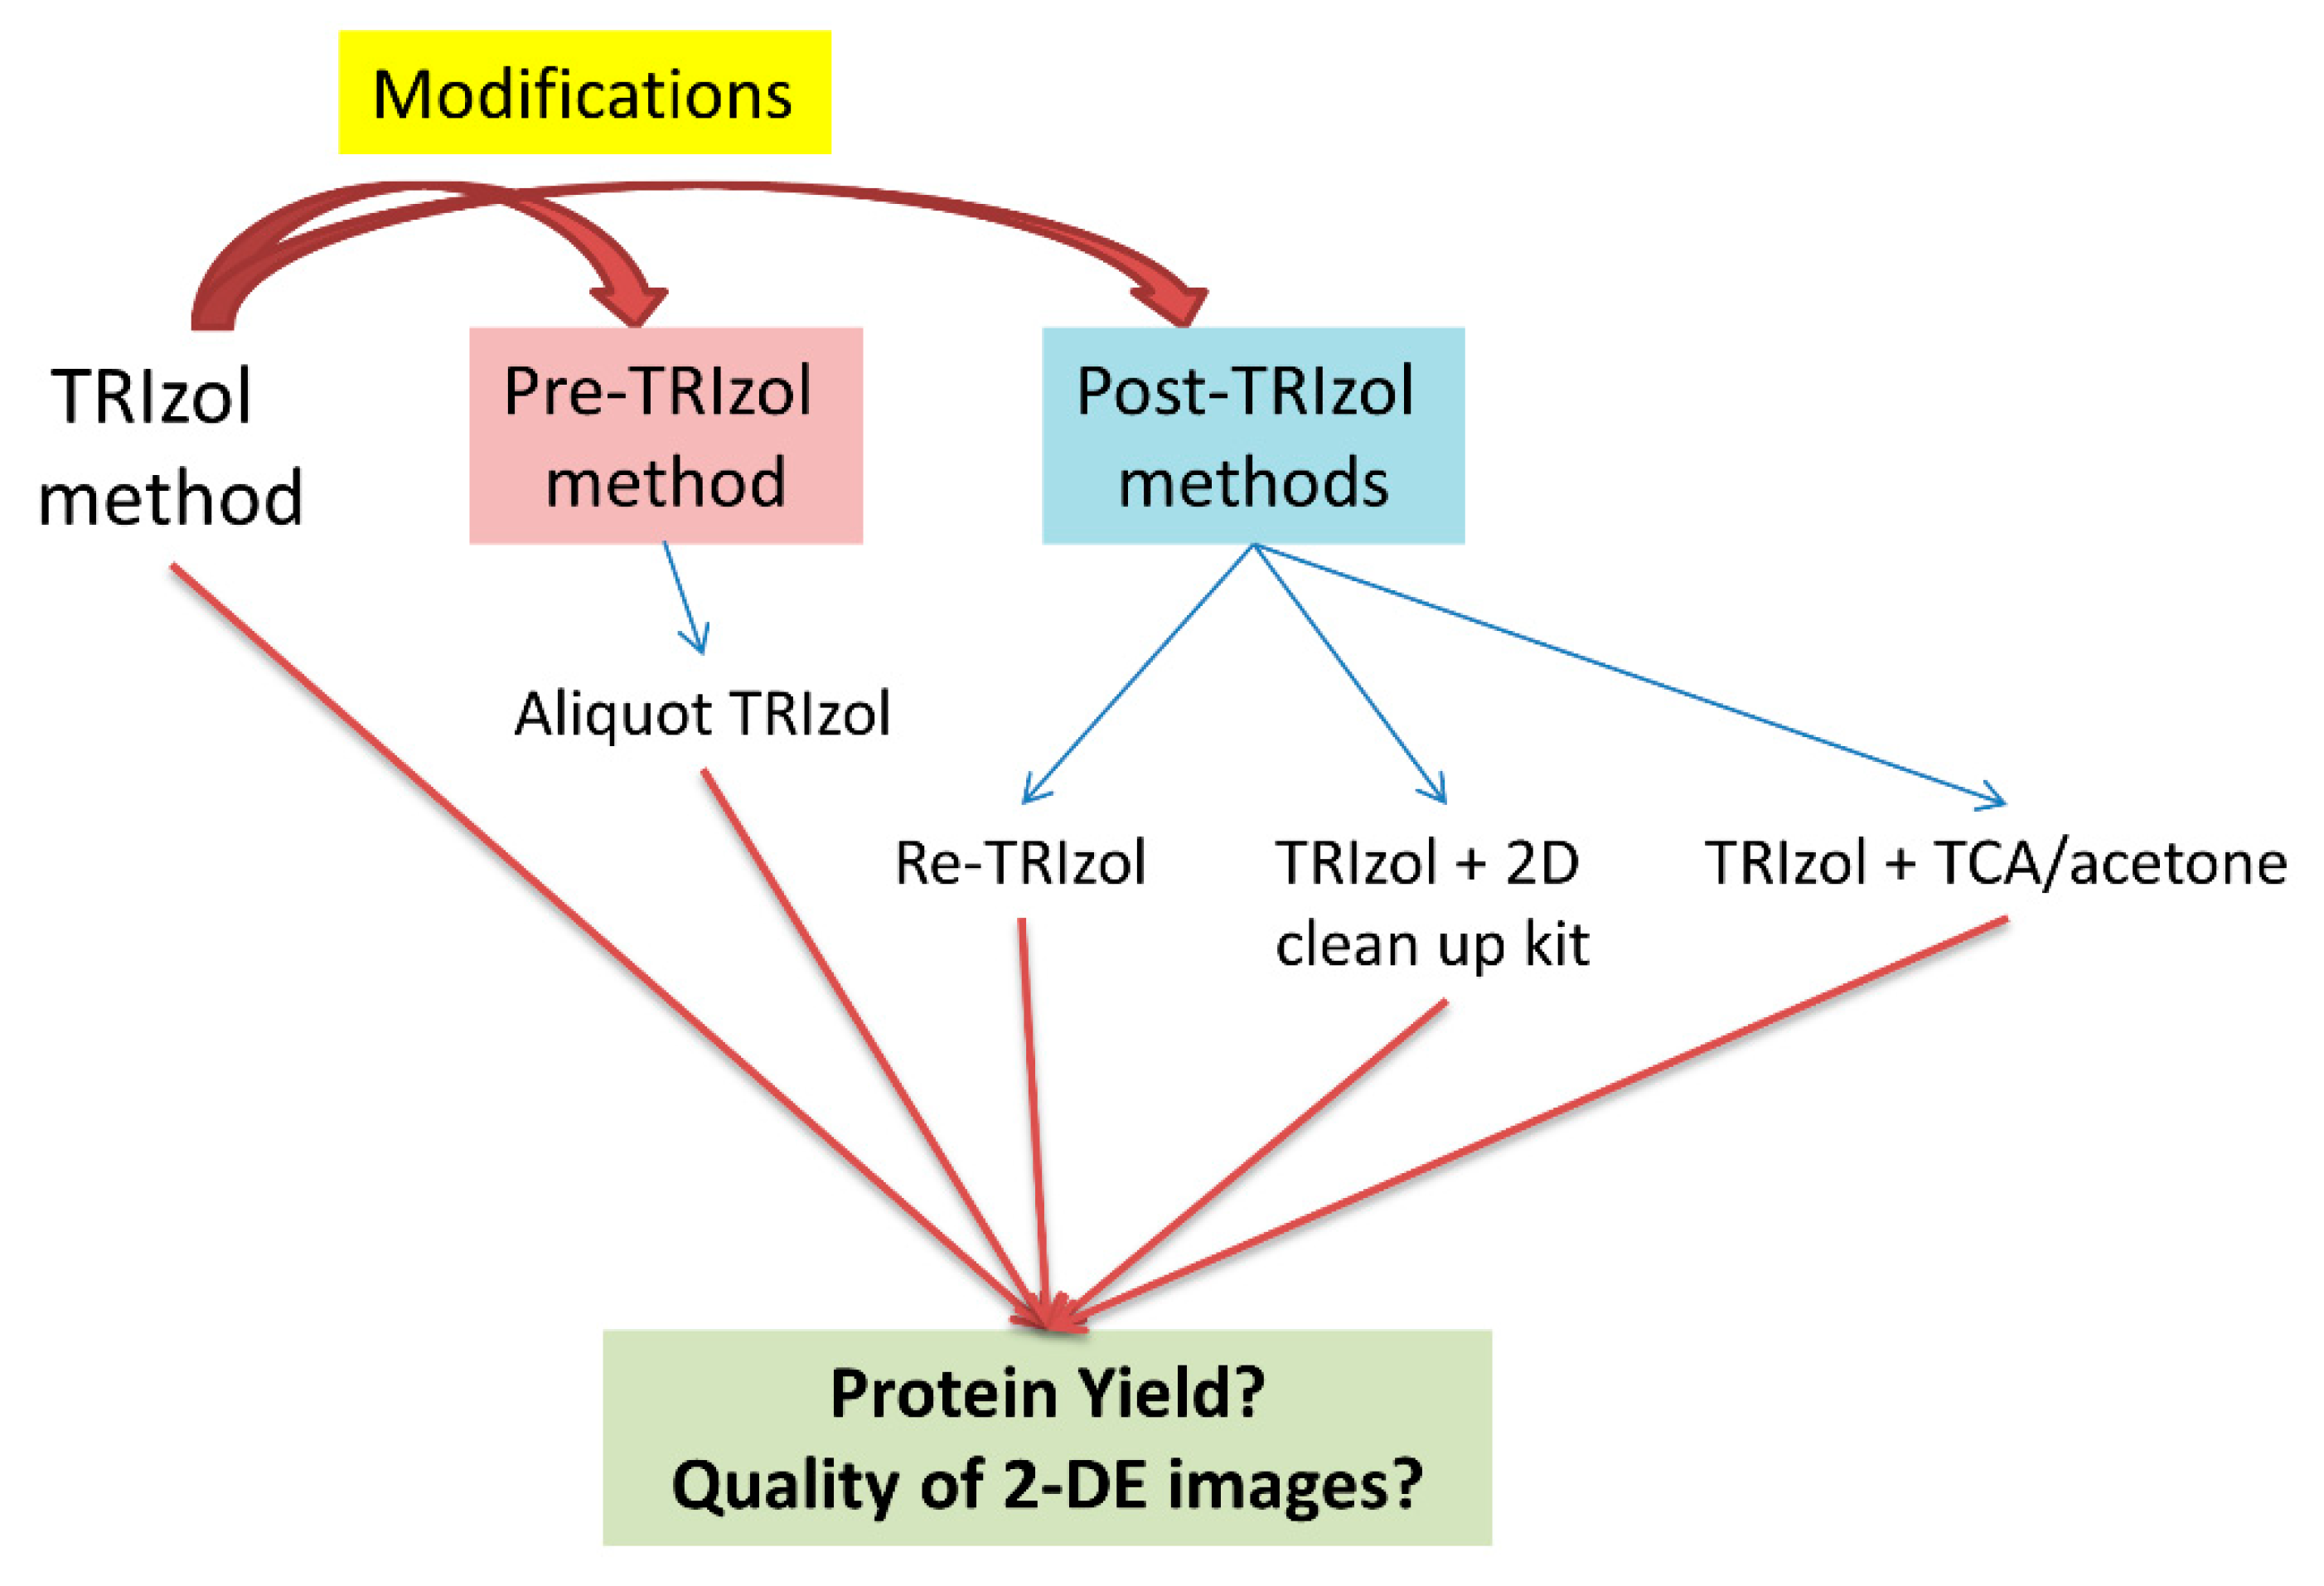
3.1. Characteristics of the Five TRIzol-Based Methods

Because the amount and type of interfering substances are species-dependent, certain interfering substances of particular dinoflagellate species may not be effectively removed when using the TRIzol method. Therefore, modifications of the original TRIzol method are required to improve the quality of proteins extracted from these difficult dinoflagellate samples. In this study, we proposed four modification methods, namely the aliquot TRIzol method, re-TRIzol method, TRIzol method with a commercial clean-up kit, and TRIzol method with TCA/acetone precipitation (Figure 1). The aliquot TRIzol method is a pre-TRIzol treatment, which was applied to samples starting with the cell pellets. The other three TRIzol-based modified methods are post-TRIzol treatments; they include procedures applied to protein samples that were first extracted using the original TRIzol method. The modifications were formulated on the basis of two hypotheses. First, we hypothesized that incomplete removal of the interfering substances might be due to the insufficient capacity of TRIzol reagent for removing interfering substances during extraction. Therefore, both the aliquot TRIzol method and the re-TRIzol method were proposed to enhance the capacity for removing the interfering substances by increasing the amount of TRIzol reagents used in the extraction. Different from the aliquot TRIzol method, the re-TRIzol method was designed for small sample sizes, where opportunities to replicate the extraction are low. In terms of ease of handling, the aliquot TRIzol method requires operators to handle multiple samples simultaneously, which increases the risk of sample loss, and the re-TRIzol method demands more operational time because of repeated extractions (Table 2). Second, we hypothesized that some interfering substances, such as specific secondary metabolites (e.g., phenolics or pigments), may not be efficiently removed by the original TRIzol method, and therefore, the introduction of extra clean-up procedures is required. Thus, a commercial clean-up kit or TCA/acetone precipitation was added after the TRIzol method. Most dinoflagellate species are autotrophs and possess some plant-specific secondary metabolites, such as chlorophyll. TCA/acetone has been widely used to eliminate lipids, pigments, and plant-specific compounds, such as chlorophyll, from plant tissues [22,23,24,25]. Moreover, a commercial clean-up kit was designed to clean up samples for 2-DE. The kit can purify samples with high salt levels and other interfering substances, including urea, cell metabolites, and plant phenolic compounds, organic acid terpenes etc. The post-TRIzol treatments involve additional steps performed after the original TRIzol method; these methods were more time consuming than the aliquot TRIzol method. For instance, if an overnight protocol was adopted for the TCA/acetone precipitation, 20 h was required to complete the protein extraction. Furthermore, additional efforts in preparation of solvents prior to the extraction steps were required. By contrast, solvents and materials included in the commercial clean-up kit are ready-to-use, making it less time consuming and more convenient. However, several steps are involved in the clean-up procedure of the kit (Table 2).

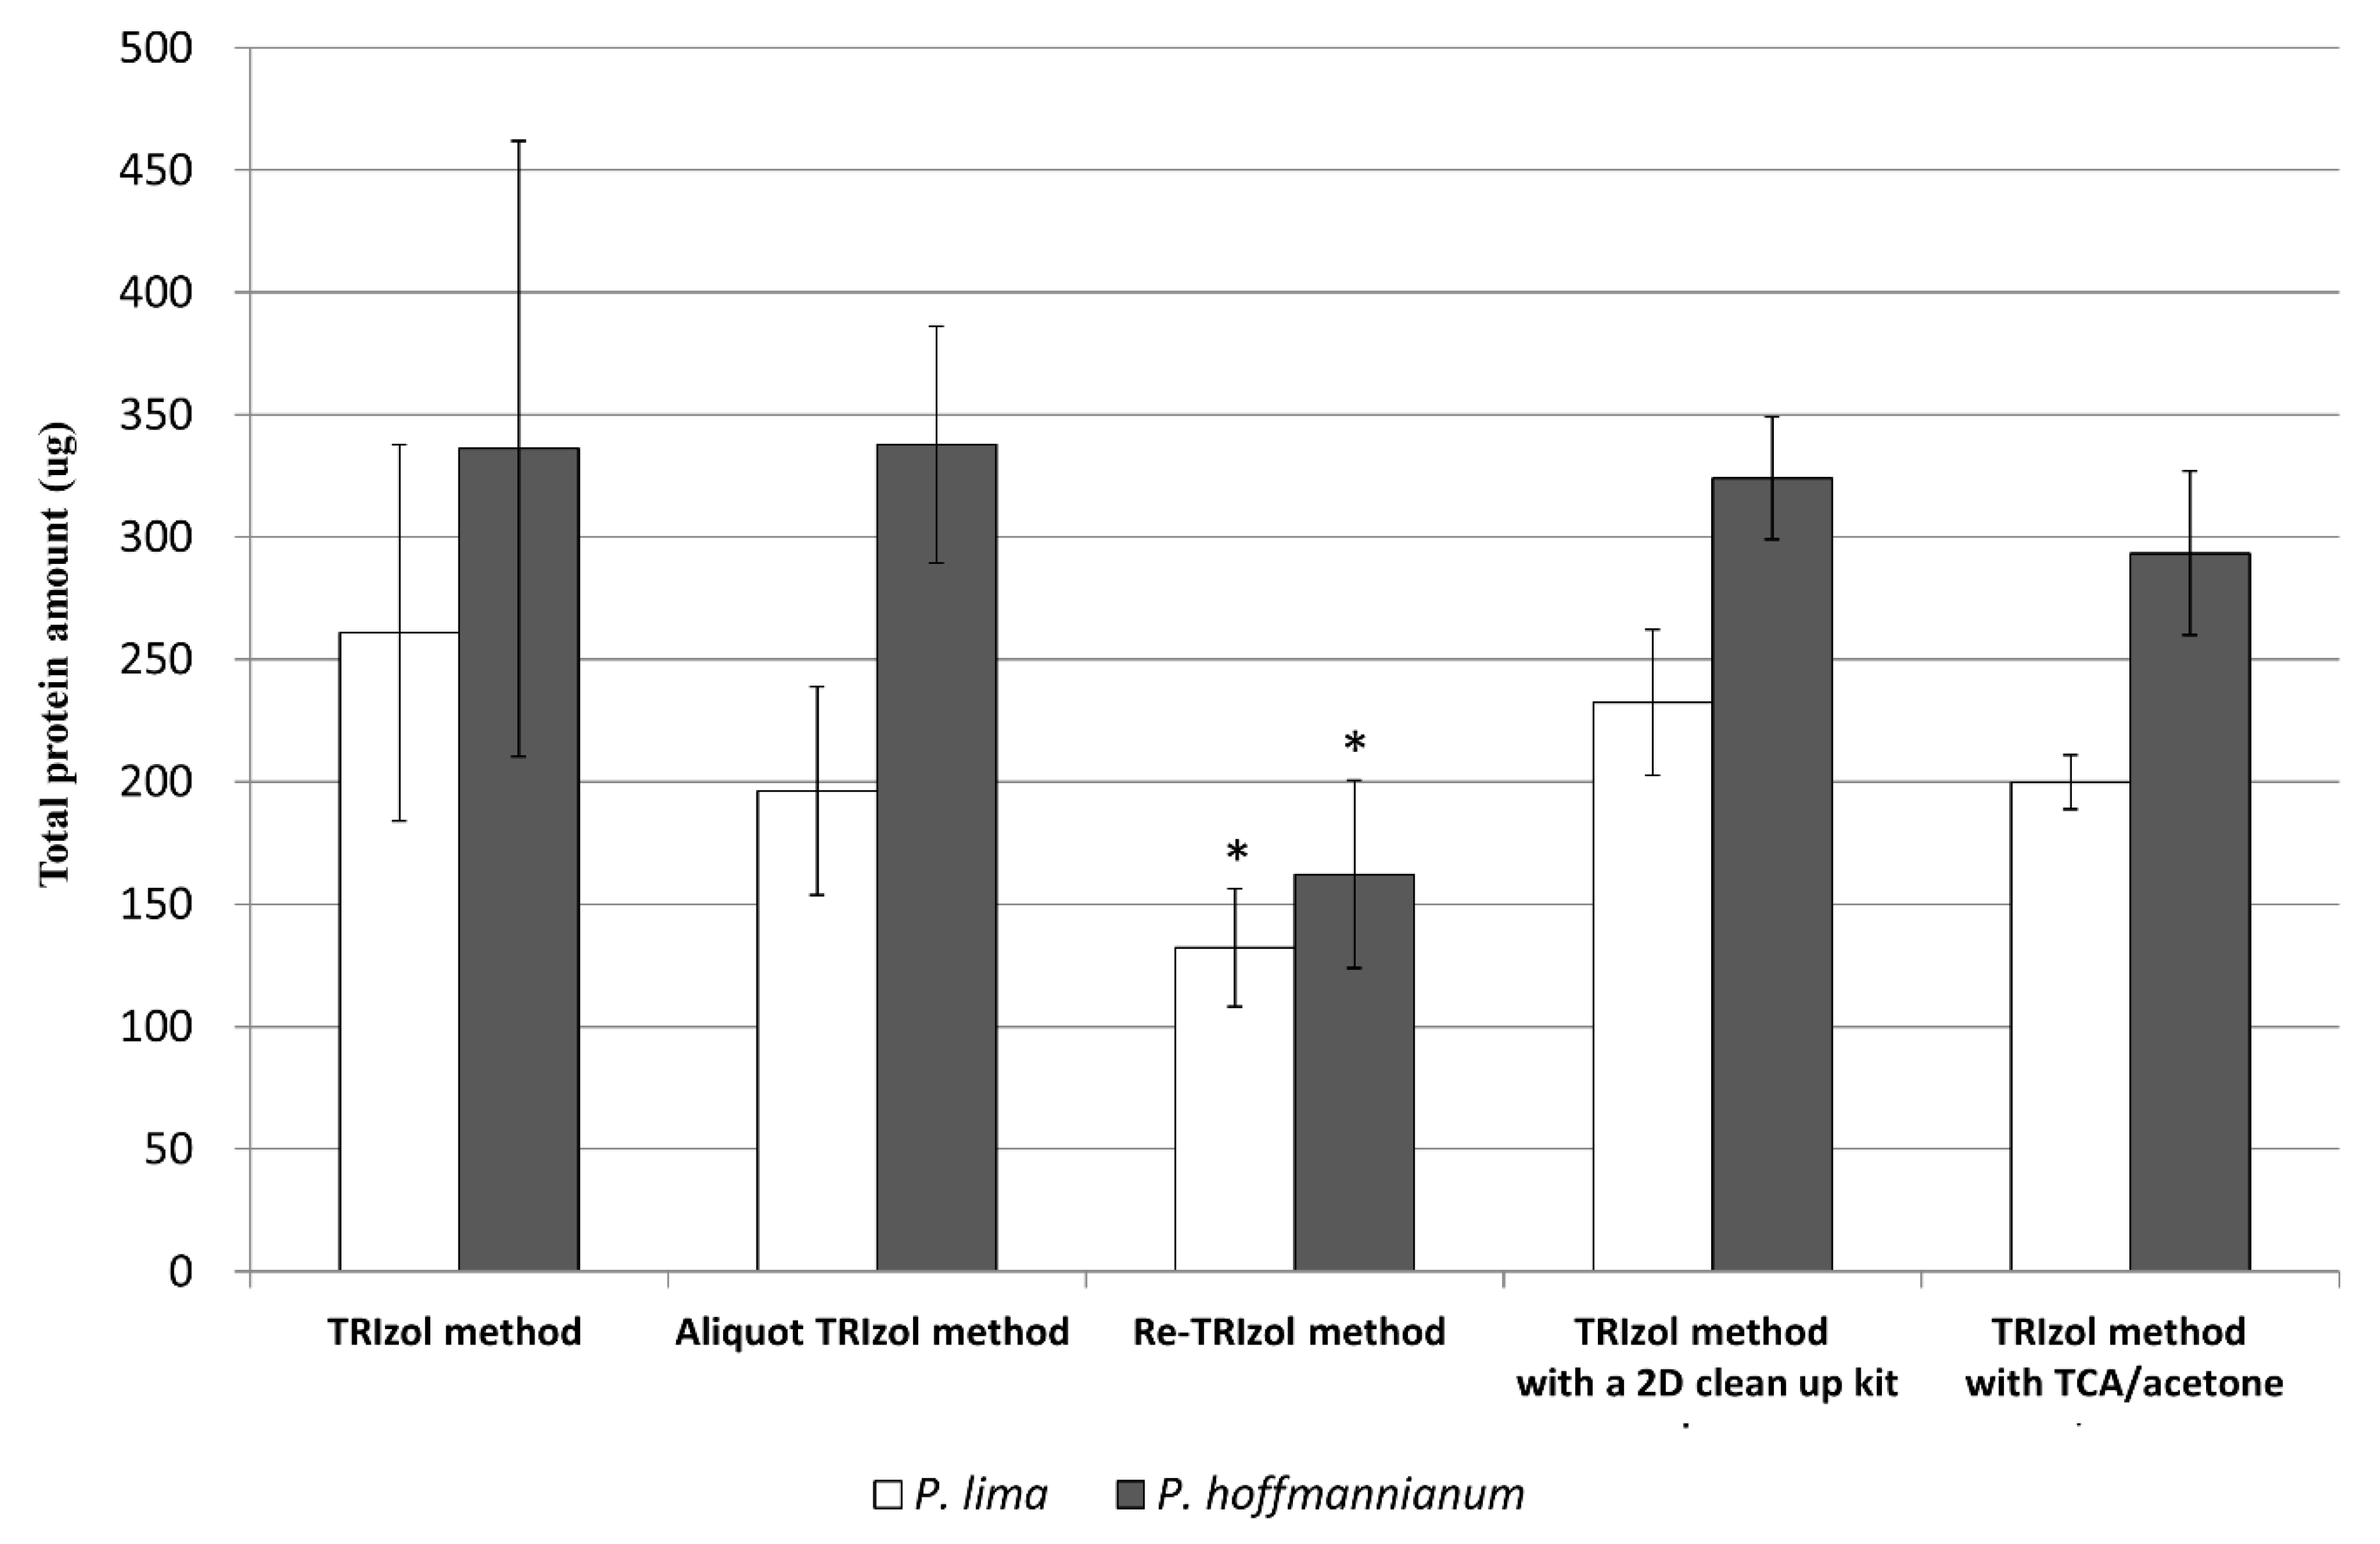
3.2. Yield of Extracted Proteins

Protein yield is a crucial criterion in protein extraction and the specific requirements (several pmoles of a purified protein or 10–20 pmoles of an unmodified and purified peptide) of peptide sequencing [26]. To compare the protein yield of each method, the protein was extracted from approximately 1 × 10⁶ vegetative cells of P. lima or P. hoffmannianum. The overall results of the two Prorocentrum species were relatively similar (Figure 2). Except for the re-TRIzol method, the relative protein yield of the remaining modified TRIzol extraction methods reached at least 90% of that of the TRIzol method in P. hoffmannianum and reached at least 70% or above in P. lima. The protein yield in the re-TRIzol method for both Prorocentrum species dropped dramatically (P ≤ 0.05) to approximately 50% of the TRIzol method’s protein yield. This decline may be attributed to the substantial loss of proteins in repeated phase separation of aqueous and organic layers. In the TRIzol method, nucleic acids were partitioned into the upper aqueous phase, whereas most of the proteins were partitioned into the lower organic phase. However, Likhite and Warawdekar [27] reported that nuclear proteins are difficult to retrieve and are possibly lost with the DNA fraction. In the re-TRIzol method, the majority of nucleic acids were probably removed in the first round of extraction; thus, more proteins with higher water solubility dissolved in the aqueous layer and were discarded together with residual nucleic acids in the second round. Moreover, the loss of protein can be from the removal of contaminating substances that bind to the reagent used in the protein assay, artificially increasing the protein yield. This interfering substances in the protein assay also explain the large variation between the replicates in Figure 2 because their amount may be inconsistent. Of course, the upper aqueous layer and the interphase after phase separation with chloroform was probably discarded together with small amount of lower organic layer because of manual pipetting.

3.3. Quality of 2-DE Images

The protein samples of the two Prorocentrum species extracted using the five methods were loaded using cup loading and passively rehydrated to perform 2-DE. Cup loading of samples reportedly improves the quality of gel images [28]. Nevertheless, sample volume was limited to 100 μL because proteins might precipitate in the cup. By contrast, in samples loaded using passive rehydration, the volume could be greater than 100 μL, and protein precipitation during loading could be avoided. Our result was consistent with that reported by Lee and Lo [7]. The overall pattern and resolution of protein spots in 2-DE profiles of the two Prorocentrum species were comparable between cup loading and passive rehydration (data not shown). Instead, the quality of gel images of P. hoffmannianum (Figure 3) and P. lima (Figure 4) largely depended on the protein preparation methods. P. hoffmannianum is an example of a difficult sample that generated unsatisfactory 2-DE profile results when using the original TRIzol method (Figure 3). The protein sample extracted using the TRIzol method with a commercial clean-up kit provided the highest-quality 2-DE profile for P. hoffmannianum of the five protein preparation methods, and it was the only method that achieved a substantial improvement with respect to the quality of the gel. The problems of background signals, streaking, and low resolution of protein spots were largely improved in comparison with those of the other preparation methods. However, the spot intensity of some very high abundance proteins for the gel image from the TRIzol method with a commercial clean-up kit (Figure 3d) was generally lower than that in other gel images (Figure 3a–c,e), which indicated a possibility that the clean-up kit has selectively removed some portion of the high abundance proteins. Although some portion of high abundant protein of the gel may be selectively removed after purification with the clean-up kit, the number of spots in the 2-DE profiles using the TRIzol method with a commercial clean-up kit was approximately 10% higher than that for the conventional TRIzol method (Table 3). Moreover, high-quality gel images were produced in the protein sample of another P. hoffmannianum strain (CCMP683) extracted using the same method (data not shown), indicating that this methodology is generally applicable to P. hoffmannianum samples.
Unexpectedly, the other modified methods, including the aliquot TRIzol method, re-TRIzol method, and TRIzol method with TCA/acetone precipitation, worsened the quality of 2-DE profiles. Protein spots (see magnified regions in Figure 3) on the 2-DE images of these three methods could not be discriminated against as distinct protein spots but rather had a smeared appearance. Furthermore, the overall quality of 2-DE profiles of these three methods was poor; most of the protein spots could not be well resolved, which seriously impaired the detection of spots (Table 3). Even though more TRIzol reagent was used in both the aliquot TRIzol and the re-TRIzol methods to remove interfering substances, neither method exhibited improved 2-DE profile quality. These results suggested that serious streaking is unlikely to be caused by interfering substances, which could be removed by TRIzol reagent alone. Moreover, the diminished quality of the 2-DE profile in the aliquot TRIzol method indicated that the yield of specific interfering substances, rather than proteins, was probably enhanced. Similarly, the undesirable quality of 2-DE profiles in the TRIzol method with TCA/acetone precipitation supported the notion that these interfering substances were most likely not plant-specific secondary metabolites, which could be removed by TCA/acetone [29,30,31]. Repeated extraction with TRIzol or the additional TCA/acetone precipitation after the TRIzol method might only induce protein loss. As such, the ratio of specific interfering substances to protein content may be enhanced, resulting in even lower quality 2-DE profiles. By contrast, the improved quality of 2-DE profiles when using the TRIzol method with a commercial clean-up kit indicated that specific interfering substances present in P. hoffmannianum were removed effectively.
The 2-DE profiles of P. lima revealed a similar level of background signal and resolution of protein spots. The other modified methods, except the TRIzol method with a commercial clean-up kit, revealed different degrees of loss in protein spots (Figure 4). The intensity of some protein spots (see magnified regions in Figure 4b,c,e) in these methods was obviously reduced. Only the number and intensity of protein spots in the TRIzol method with a commercial clean-up kit were comparable to those in the TRIzol method. In addition, a substantial loss in acidic proteins was observed in the 2-DE profiles of the re-TRIzol method and the TRIzol method with TCA/acetone precipitation. Consequently, we observed significant reductions (P ≤ 0.05) in the number of protein spots in both the re-TRIzol method and the TRIzol method with TCA/acetone precipitation. When the protein was extracted by using the TRIzol method with TCA/acetone precipitation, our result was similar to that of TCA/acetone precipitation in a protein preparation of microalgae Haematococcus pluvialis in Wang’s study [32]. Wang et al. [32] reported that TCA/acetone precipitation did not significantly influence protein yield, but partial protein spots were selectively weakened or even lost because of the incomplete recovery of these proteins from precipitation. Later, Rajalingam et al. [33] found that these incompletely recovered proteins were unfolded protein. In our study, TRIzol-extracted proteins were dissolved in urea containing resolubilisation buffer prior to TCA/acetone precipitation. Thus, most of the extracted proteins became unfolded, which reduced the efficiency of further protein precipitation by TCA/acetone. Fic et al. [34] revealed that non-precipitated proteins remained in the TCA/acetone supernatant, and these proteins would probably be lost when discarding the supernatant. Wu et al. [24] recovered these non-precipitated proteins by using SDS extraction. However, it was inapplicable in this method because the SDS buffer cannot be removed after the extraction. Furthermore, protein degradation or modification in extended exposure to low pH, as suggested by Wang et al. [24], could not be excluded. Regarding the re-TRIzol method, many proteins were probably lost during phase separation in two rounds of extraction, resulting in a substantial loss of protein yield (Figure 2) as well as a reduction in the number of protein spots (Table 3).

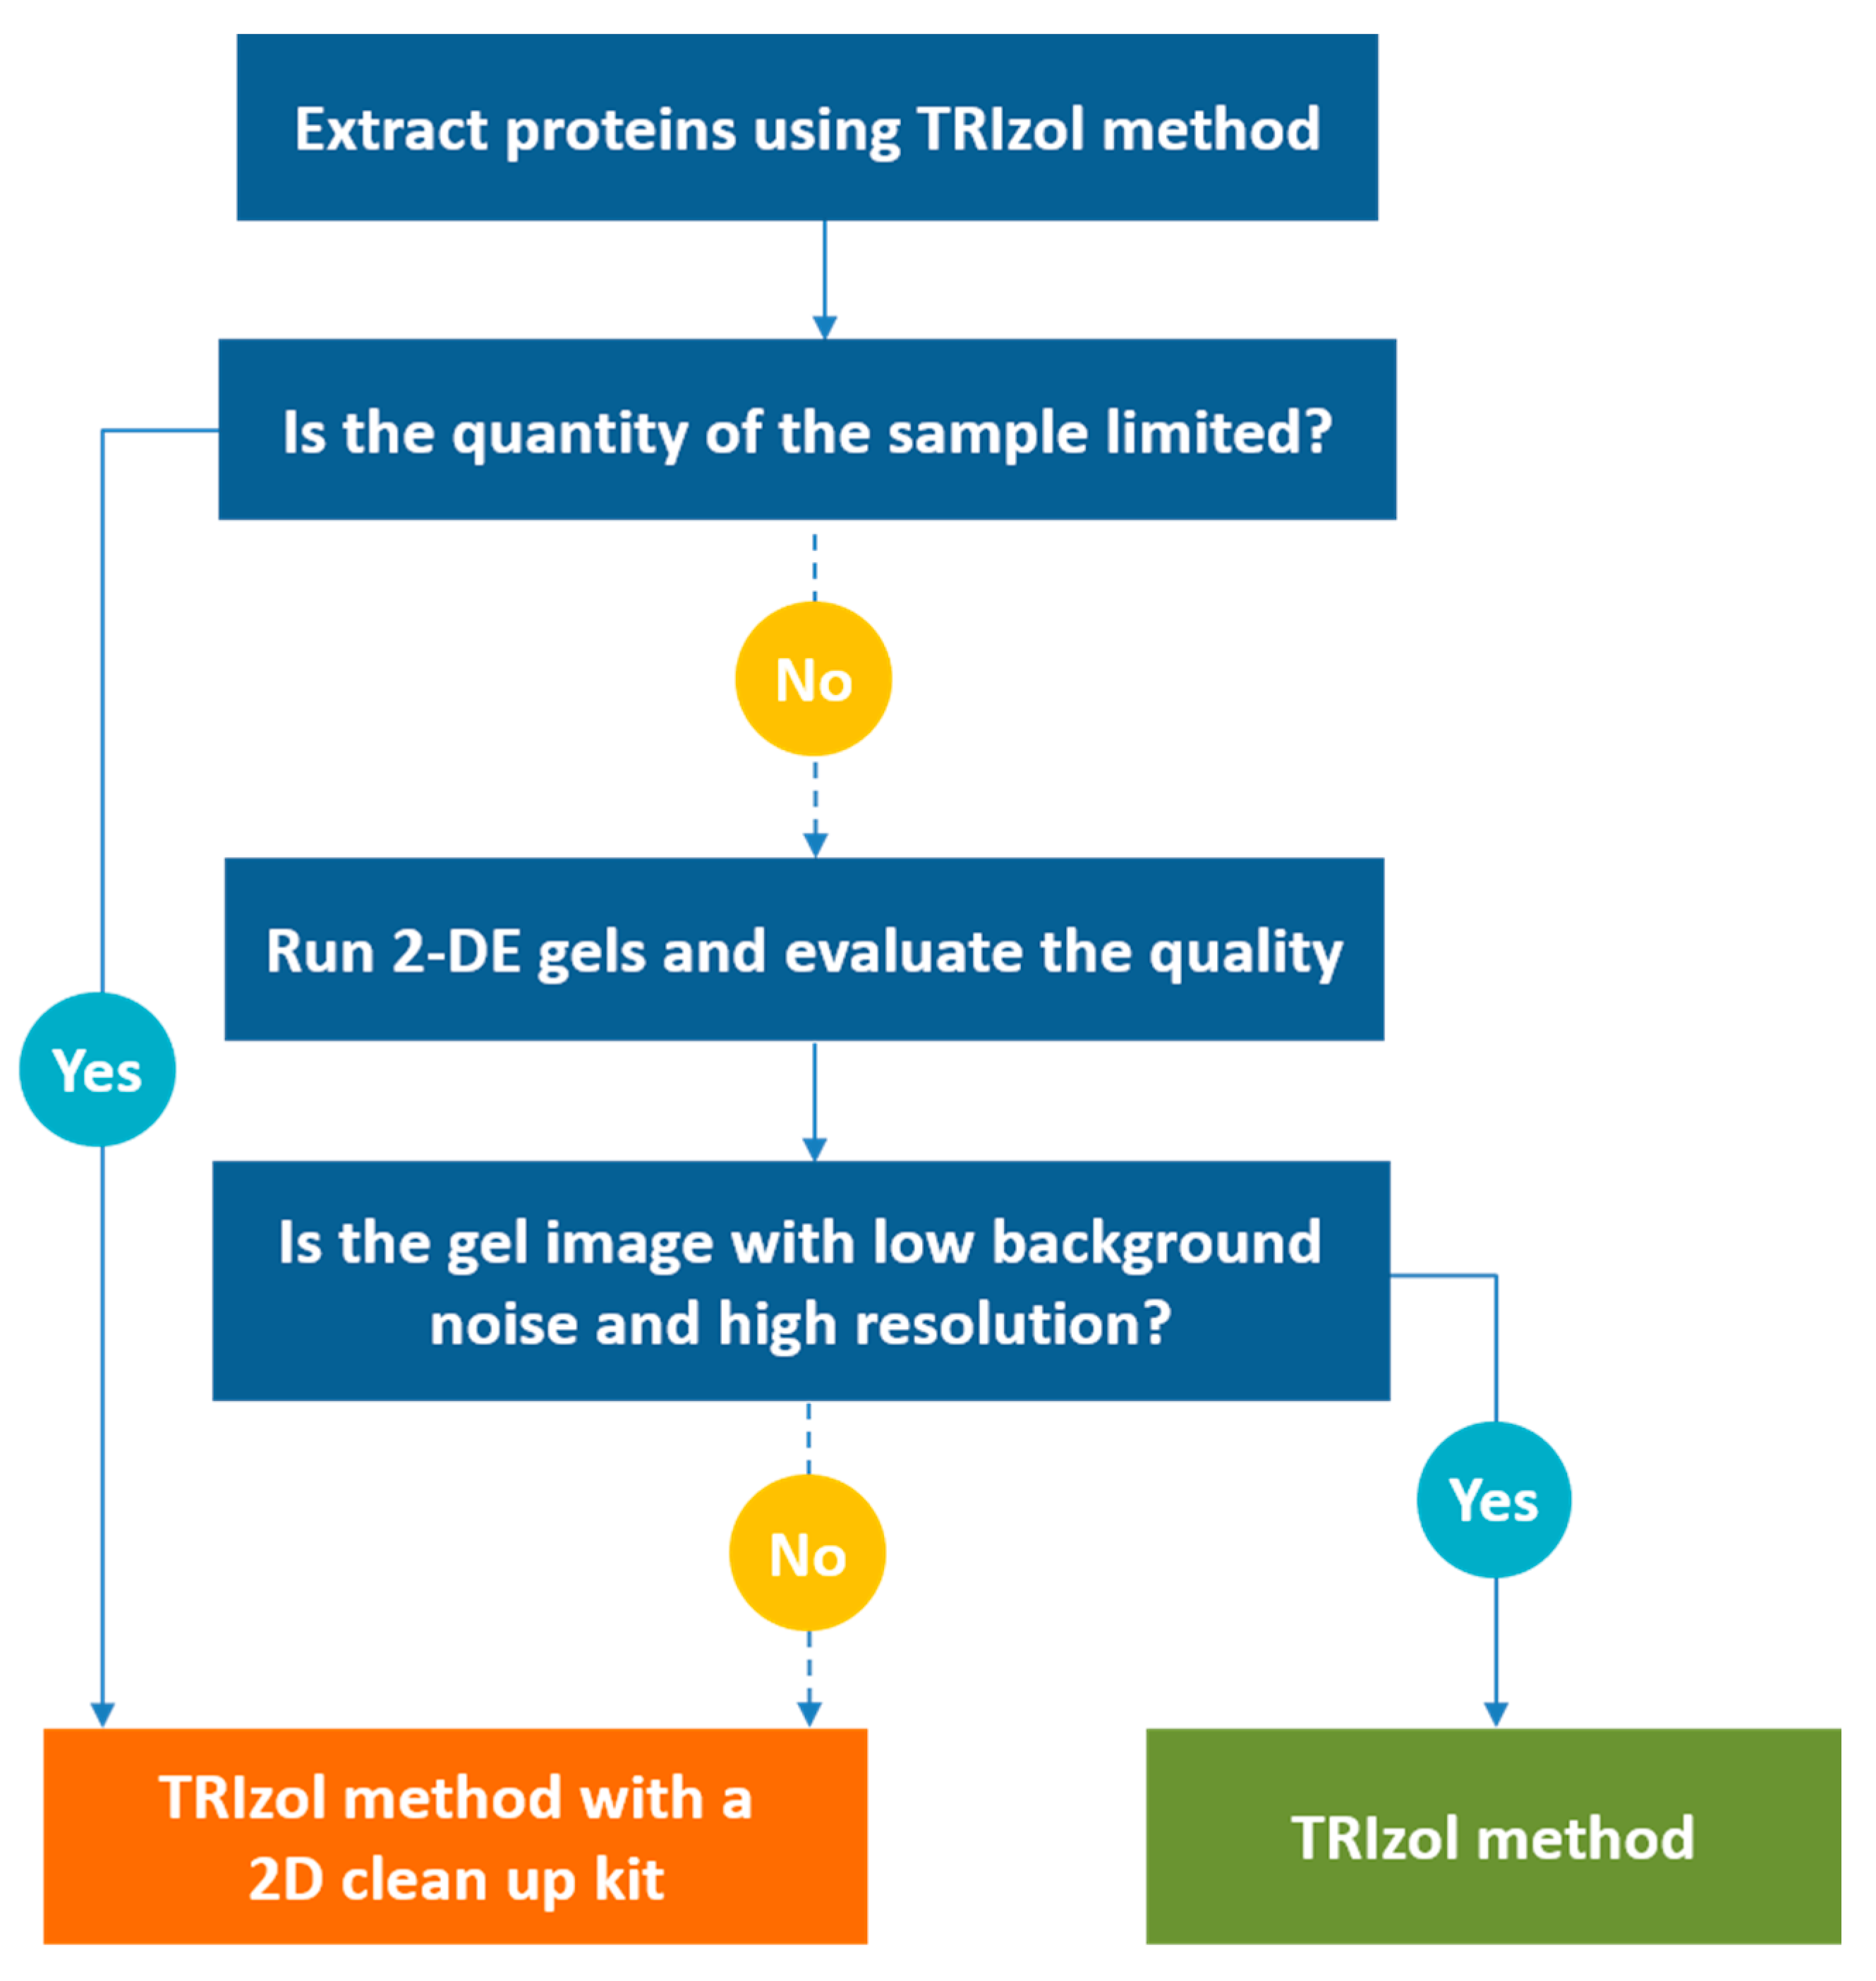
3.4. Evaluation of the Four Modified TRIzol-based Methods

According to our findings, we recommend the use of a commercial clean-up kit after the TRIzol method for samples in which the TRIzol reagent alone fails to extract high-purity proteins. This kit could additionally eliminate some interfering substances that could not be effectively removed by the TRIzol reagent. We also suggest the direct extraction of proteins using the TRIzol method with a commercial clean-up kit when the quantity of samples is limited, and replication of extraction is not possible (Figure 5). This is because the protein yield and intensity and the number of protein spots in P. lima were not significantly affected after the extra treatment using the commercial clean-up kit. Although the aliquot TRIzol method was not feasible to produce high-quality 2-DE images for P. hoffmannianum in this study, this method might be useful for samples containing unexpectedly high amounts of interfering substances. The TRIzol would be able to manage these substances with a little negative effect on protein yield as well as the number and intensity of protein spots. However, TCA/acetone precipitation after the TRIzol method and repeated extraction with TRIzol are not recommended because additional TCA/acetone precipitation and TRIzol reagent adversely influenced the number and intensity of protein spots and the re-TRIzol method significantly reduced the protein yield.

4. Conclusions

TRIzol extraction is a simple, fast, and effective method for preparing protein samples for 2-DE production from dinoflagellate samples. The TRIzol method greatly simplifies conventional sample preparation procedures and offers several advantages, which are some reasons for its popularity. However, the TRIzol method is less effective for certain dinoflagellate species, such as P. hoffmannianum. Modifications of the method are therefore required. Four modified TRIzol methods were investigated and compared with the original TRIzol method. Our results demonstrated that high-quality 2-DE profiles could be obtained using the TRIzol method with a commercial clean-up kit. This modified method was particularly useful for samples failing to produce high-quality 2-DE images with the original TRIzol method.

Author Contributions

Conceptualization, F.W.-F.L.; methodology, S.J.-L.X. and F.W.-F.L.; validation, T.C.-H.L., K.K.-Y.L., C.S.-N.K., and F.W.-F.L.; formal analysis, T.C.-H.L., K.K.-Y.L., C.S.-N.K., and F.W.-F.L.; investigation, T.C.-H.L. and C.S.-N.K.; resources, F.W.-F.L.; writing—original draft preparation, T.C.-H.L., C.S.-N.K., and F.W.-F.L.; writing—review and editing, K.K.-Y.L. and F.W.-F.L.; supervision, F.W.-F.L. and S.J.-L.X.; project administration, F.W.-F.L.; funding acquisition, F.W.-F.L. All authors have read and agreed to the published version of the manuscript.

Funding

The work described in this paper was partially supported by grants from the Research Grants Council of the Hong Kong Special Administrative Region, China (UGC/FDS16/M01/18) and (UGC/IDS(R)16/19).

Conflicts of Interest

The authors declare no conflict of interest.

References

  1. Anderson, D.M.; Glibert, P.M.; Burkholder, J.M. Harmful algal blooms and eutrophication: Nutrient sources, composition, and consequences. Estuaries 2002, 25, 704–726. [Google Scholar] [CrossRef]
  2. Landsberg, J.H. The effects of harmful algal blooms on aquatic organisms. Rev. Fish. Sci. 2002, 10, 113–390. [Google Scholar] [CrossRef]
  3. O’Farrell, P.H. High resolution two-dimensional electrophoresis of proteins. J. Biol. Chem. 1975, 250, 4007–4021. [Google Scholar] [PubMed]
  4. Marshall, T.; Williams, K.M. High resolution two-dimensional electrophoresis of the proteins and macromolecular constituents of beer and wine. Electrophoresis 1987, 8, 493–495. [Google Scholar] [CrossRef]
  5. Lee, F.W.F.; Morse, D.; Lo, S.C.L. Identification of two plastid proteins in the dinoflagellate Alexandrium affine that are substantially down-regulated by nitrogen-depletion. J. Proteome Res. 2009, 8, 5080–5092. [Google Scholar] [CrossRef]
  6. Chan, L.L.; Hodgkiss, I.J.; Wan, J.M.F.; Lum, J.H.K.; Mak, A.S.C.; Sit, W.H.; Lo, S.C.L. Proteomic study of a model causative agent of harmful algal blooms, Prorocentrum triestinum II: The use of differentially expressed protein profiles under different growth phases and growth conditions for bloom prediction. Proteomics 2004, 4, 3214–3226. [Google Scholar] [CrossRef]
  7. Lee, F.W.F.; Lo, S.C.L. The use of Trizol reagent (phenol/guanidine isothiocyanate) for producing high quality two-dimensional gel electrophoretograms (2-DE) of dinoflagellates. J. Microbiol. Methods 2008, 73, 26–32. [Google Scholar] [CrossRef]
  8. Lyon, B.R.; Lee, P.A.; Bennett, J.M.; Ditullio, G.R.; Janech, M.G. Proteomic analysis of a sea-ice diatom: Salinity acclimation provides new insight into the dimethylsulfoniopropionate production pathway. Plant Physiol. 2011, 157, 1926–1941. [Google Scholar] [CrossRef] [Green Version]
  9. Tan, A.A.; Azman, S.N.; Abdul Rani, N.R.; Kua, B.C.; Sasidharan, S.; Kiew, L.V.; Othman, N.; Noordin, R.; Chen, Y. Optimal protein extraction methods from diverse sample types for protein profiling by using two-dimensional electrophoresis (2DE). Trop Biomed 2011, 28, 620–629. [Google Scholar]
  10. Wang, D.Z.; Zhang, Y.J.; Zhang, S.-F.; Lin, L.; Hong, H.S. Quantitative proteomic analysis of cell cycle of the dinoflagellate Prorocentrum donghaiense (Dinophyceae). PLoS ONE 2013, 8, e63659. [Google Scholar] [CrossRef] [Green Version]
  11. Wang, D.Z.; Li, C.; Xie, Z.X.; Dong, H.P.; Lin, L.; Hong, H.S. Homology-driven proteomics of dinoflagellates with unsequenced genomes using MALDI-TOF/TOF and automated de novo sequencing. Evid. Based Complement. Alternat. Med. Alt. 2011, 2011, 1–16. [Google Scholar]
  12. Li, C.; Wang, D.; Dong, H.; Xie, Z.; Hong, H. Proteomics of a toxic dinoflagellate Alexandrium catenella dh01: Detection and identification of cell surface proteins using fluorescent labeling. Chin. Sci. Bull. 2012, 57, 3320–3327. [Google Scholar] [CrossRef] [Green Version]
  13. Wang, D.Z.; Li, C.; Zhang, Y.; Wang, Y.Y.; He, Z.-P.; Lin, L.; Hong, H.-S. Quantitative proteomic analysis of differentially expressed proteins in the toxicity-lost mutant of Alexandrium catenella (Dinophyceae) in the exponential phase. J. Proteom. 2012, 75, 5564–5577. [Google Scholar] [CrossRef] [PubMed]
  14. Li, C.; Zhang, Y.; Xie, Z.X.; He, Z.P.; Lin, L.; Wang, D.Z. Quantitative proteomic analysis reveals evolutionary divergence and species-specific peptides in the Alexandrium tamarense complex (Dinophyceae). J. Proteom. 2013, 86, 85–96. [Google Scholar] [CrossRef]
  15. Liu, B.; Lo, S.C.L.; Matton, D.P.; Lang, B.F.; Morse, D. Daily changes in the phosphoproteome of the dinoflagellate Lingulodinium. Protist 2012, 163, 746–754. [Google Scholar] [CrossRef]
  16. Lee, T.C.H.; Kwok, C.S.N.; Ho, K.C.; Xu, J.L.; Wong, Y.K.; Lee, F.W.F. Effectiveness of previous established TRIzol—methodology for the production of 2-DE of DSP toxin producing Prorocentrum species. In Proceedings of the 1st International Conference on Beneficial Uses of Algal Biomass (ICBUAB 2013), Hong Kong, China, 5–8 November 2013; pp. 79–92. [Google Scholar]
  17. Jiang, X.W.; Wang, J.; Chan, L.L.; Lam, P.K.S.; Gu, J.-D. Comparison of three protein extraction procedures from toxic and non-toxic dinoflagellates for proteomics analysis. Ecotoxicology 2015, 24, 1395–1406. [Google Scholar] [CrossRef]
  18. Karthikaichamy, A.; Deore, P.; Rai, V.; Bulach, D.; Beardall, J.; Noronha, S.; Srivastava, S. Time for multiple extraction methods in proteomics? a comparison of three protein extraction methods in the eustigmatophyte alga Microchloropsis gaditana CCMP526. OMICS 2017, 21, 678–683. [Google Scholar] [CrossRef]
  19. Wang, D.Z.; Lin, L.; Chan, L.L.; Hong, H.-S. Comparative studies of four protein preparation methods for proteomic study of the dinoflagellate Alexandrium sp. using two-dimensional electrophoresis. Harmful Algae 2009, 8, 685–691. [Google Scholar] [CrossRef]
  20. Guillard, R.R.L.; Hargraves, P.E. Stichochrysis immobilis is a diatom, not a chrysophyte. Phycologia 1993, 32, 234–236. [Google Scholar] [CrossRef]
  21. Ramagli, L.S.; Rodriguez, L.V. Quantitation of microgram amounts of protein in two-dimensional polyacrylamide gel electrophoresis sample buffer. Electrophoresis 1985, 6, 559–563. [Google Scholar] [CrossRef]
  22. Wang, W.; Scali, M.; Vignani, R.; Spadafora, A.; Sensi, E.; Mazzuca, S.; Cresti, M. Protein extraction for two-dimensional electrophoresis from olive leaf, a plant tissue containing high levels of interfering compounds. Electrophoresis 2003, 24, 2369–2375. [Google Scholar] [CrossRef] [PubMed]
  23. Wang, W.; Tai, F.; Chen, S. Optimizing protein extraction from plant tissues for enhanced proteomics analysis. J. Sep. Sci. 2008, 31, 2032–2039. [Google Scholar] [CrossRef] [PubMed]
  24. Wu, X.; Xiong, E.; Wang, W.; Scali, M.; Cresti, M. Universal sample preparation method integrating trichloroacetic acid/acetone precipitation with phenol extraction for crop proteomic analysis. Nat. Protoc. 2014, 9, 362–374. [Google Scholar] [CrossRef] [PubMed]
  25. Wang, W.; Vignani, R.; Scali, M.; Cresti, M. A universal and rapid protocol for protein extraction from recalcitrant plant tissues for proteomic analysis. Electrophoresis 2006, 27, 2782–2786. [Google Scholar] [CrossRef]
  26. Reim, D.F.; Speicher, D.W. N-terminal sequence analysis of proteins and peptides. In Current Protocols in Protein Science; Coligan, J.E., Dunn, B.M., Ploegh, H.L., Speicher, D.W., Wingfield, P.T., Eds.; John Wiley & Sons, Inc.: Bundoora, Australia, 2001; Volume 24, pp. 1–31. [Google Scholar]
  27. Likhite, N.; Warawdekar, U.M. A unique method for isolation and solubilization of proteins after extraction of RNA from tumor tissue using Trizol. J. Biomol. Tech. 2011, 22, 37–44. [Google Scholar]
  28. Görg, A.; Obermaier, C.; Boguth, G.; Harder, A.; Scheibe, B.; Wildgruber, R.; Weiss, W. The current state of two-dimensional electrophoresis with immobilized pH gradients. Electrophoresis 2000, 21, 1037–1053. [Google Scholar] [CrossRef]
  29. Damerval, C.; Vienne, D.D.; Zivy, M.; Thiellement, H. Technical improvements in two-dimensional electrophoresis increase the level of genetic variation detected in wheat-seedling proteins. Electrophoresis 1986, 7, 52–54. [Google Scholar] [CrossRef]
  30. Isaacson, T.; Damasceno, C.M.B.; Saravanan, R.S.; He, Y.; Catalá, C.; Saladié, M.; Rose, J.K.C. Sample extraction techniques for enhanced proteomic analysis of plant tissues. Nat. Protoc. 2006, 1, 769–774. [Google Scholar] [CrossRef]
  31. Wu, X.; Gong, F.; Wang, W. Protein extraction from plant tissues for 2DE and its application in proteomic analysis. Proteomics 2014, 14, 645–658. [Google Scholar] [CrossRef]
  32. Wang, S.B.; Hu, Q.; Sommerfeld, M.; Chen, F. An optimized protocol for isolation of soluble proteins from microalgae for two-dimensional gel electrophoresis analysis. J. Appl. Phycol. 2003, 15, 485–496. [Google Scholar] [CrossRef]
  33. Rajalingam, D.; Loftis, C.; Xu, J.J.; Kumar, T.K.S. Trichloroacetic acid-induced protein precipitation involves the reversible association of a stable partially structured intermediate. Protein Sci. 2009, 18, 980–993. [Google Scholar] [CrossRef] [PubMed] [Green Version]
  34. Fic, E.; Kedracka-Krok, S.; Jankowska, U.; Pirog, A.; Dziedzicka-Wasylewska, M. Comparison of protein precipitation methods for various rat brain structures prior to proteomic analysis. Electrophoresis 2010, 31, 3573–3579. [Google Scholar] [CrossRef] [PubMed]
Figure 1. Schematic of experimental design with modifications of the conventional TRIzol method beforehand (pre-TRIzol) and afterward (post-TRIzol). TCA refers to trichloroacetic acid.
Jmse 08 00363 g001
Figure 2. Total amount of protein extracted using five TRIzol-based methods from approximately 1 × 10⁶ vegetative cells of P. lima (CCMP1368) and P. hoffmannianum (CCMP2804). All data are presented as means ± standard derivations of three biological replicates in each extraction method. (* indicates a significant difference (p ≤ 0.05) in comparison with the amount of protein extracted using the TRIzol method.).
Jmse 08 00363 g002
Figure 3. 2-DE profiles (pH 4–7) of the protein samples extracted from approximately 1 × 10⁶ vegetative cells of P. hoffmannianum (CCMP2804) by using the TRIzol method (a), aliquot TRIzol method (b), re-TRIzol method (c), TRIzol method with a 2-DE clean-up kit (d), and TRIzol method with TCA/acetone (e). Magnified images of a selected area in the 2-DE profile of each method is shown in the lower right corner.
Jmse 08 00363 g003
Figure 4. 2-DE profiles (pH 4–7) of the protein samples extracted from approximately 1 × 10⁶ vegetative cells of P. lima (CCMP1368) by using the TRIzol method (a), aliquot TRIzol method (b), re-TRIzol method (c), TRIzol method with a 2-DE clean-up kit (d), and TRIzol method with TCA/acetone (e). Magnified images of two selected areas (i) and (ii) in the 2-DE profile of each method are shown in the lower right corner.
Jmse 08 00363 g004
Figure 5. Flow diagram indicating when to use a 2D clean-up kit after extraction of proteins from a new type of sample using the TRIzol method.
Jmse 08 00363 g005
Table 1. Microalgal species that successfully produced high-quality two-dimensional gel electrophoresis (2-DE) profiles from the TRIzol method.
Type of MicroalgaeSpeciesYear of PublicationReference
DinoflagellateAlexandrium sp.2008[7]
Scrippsiella sp.2008[7]
Alexandrium affine2009[6]
Alexandrium catenella2011[11]
2012[12,13]
2013[14]
Linulodinium polyedrum2012[15]
Alexandrium tamarense2013[16]
2015[17]
Prorocentrum donghaiense2013[10]
Prorocentrum belizeanum2013[16]
Prorocentrum lima2013[16]
Prorocentrum rhathymum2013[16]
Alexandrium minutum2015[17]
Gymnodinium catenatum2015[17]
Gynodinium sp.2015[17]
Cochlodinium geminatum1N/AN/A
Karenia mikimotoi1N/AN/A
DiatomFragilariopsis cylindrus2011[8]
EustigmatophyteMicrochloropsis gaditana2017[18]
RaphidophyteChattonella marina1N/AN/A
Species that our team demonstrated as workable to produce high-quality 2-DE profiles using TRIzol method (data not shown).
Table 2. Comparison of required materials, time consumed, and ease of handling of five TRIzol-based protein extraction methods.
MethodsSolvents and Kits RequiredTotal Time RequiredEase of Handling
TRIzol methodTRIzol reagent~3 hManuals are easy to follow
Chloroform
Ethanol
Isopropanol
Aliquot TRIzol methodTRIzol reagent~4 hHandling multiple samples simultaneously
Chloroform
Ethanol
Isopropanol
Re-TRIzol methodTRIzol reagent~6 hManuals are easy to follow
Chloroform
Ethanol
Isopropanol
TRIzol method with a 2D clean-up kitTRIzol reagent~6 hMany steps in the clean-up procedure
Chloroform
Ethanol
Isopropanol
2D clean up kit
Mili-Q water
TRIzol method with TCA/acetone precipitationTRIzol reagent~20 h 1Need for preparation of additional solvents prior to extraction
Chloroform
Ethanol
Isopropanol
10% TCA/acetone
Cold acetone
DTT
1 The TCA/acetone precipitation used in this study was an overnight protocol. Some protocols could be completed within several hours.
Table 3. Comparison of the number of spots, quality of background, and resolution of 2-DE images of proteins extracted using five TRIzol-based protein extraction methods from P. lima (PL) and P. hoffmannianum (PH).
MethodsNo. of SpotsQuality of BackgroundResolution of Protein Spots
PLPHPLPHPLPH
TRIzol method650 ± 33.95511 ± 98.43++-+++
Aliquot TRIzol method539 ± 83.43N/A++-+-
Re-TRIzol method434 ± 119.81 *N/A++---
TRIzol method with a 2D clean up kit650 ± 46551 ± 46.61++++++++
TRIzol method with TCA/acetone precipitation329 ± 16.74 *N/A+++--
In total, 100 μg of extracted protein was loaded, and silver staining was used. N/A indicates that the number of spots could not be detected by the software because of poor quality gel images. * indicates a significant difference (p ≤ 0.05) compared with the number of spots on 2-DE images obtained using the TRIzol method. ++ denotes good, + denotes acceptable, and - denotes poor. PL, P. lima; PH, P. hoffmannianum.

