Study on the Influence of Mud Properties on the Stability of Excavated Face of Slurry Shield and the Quality of Filter Cake Formation

Abstract
:1. Introduction
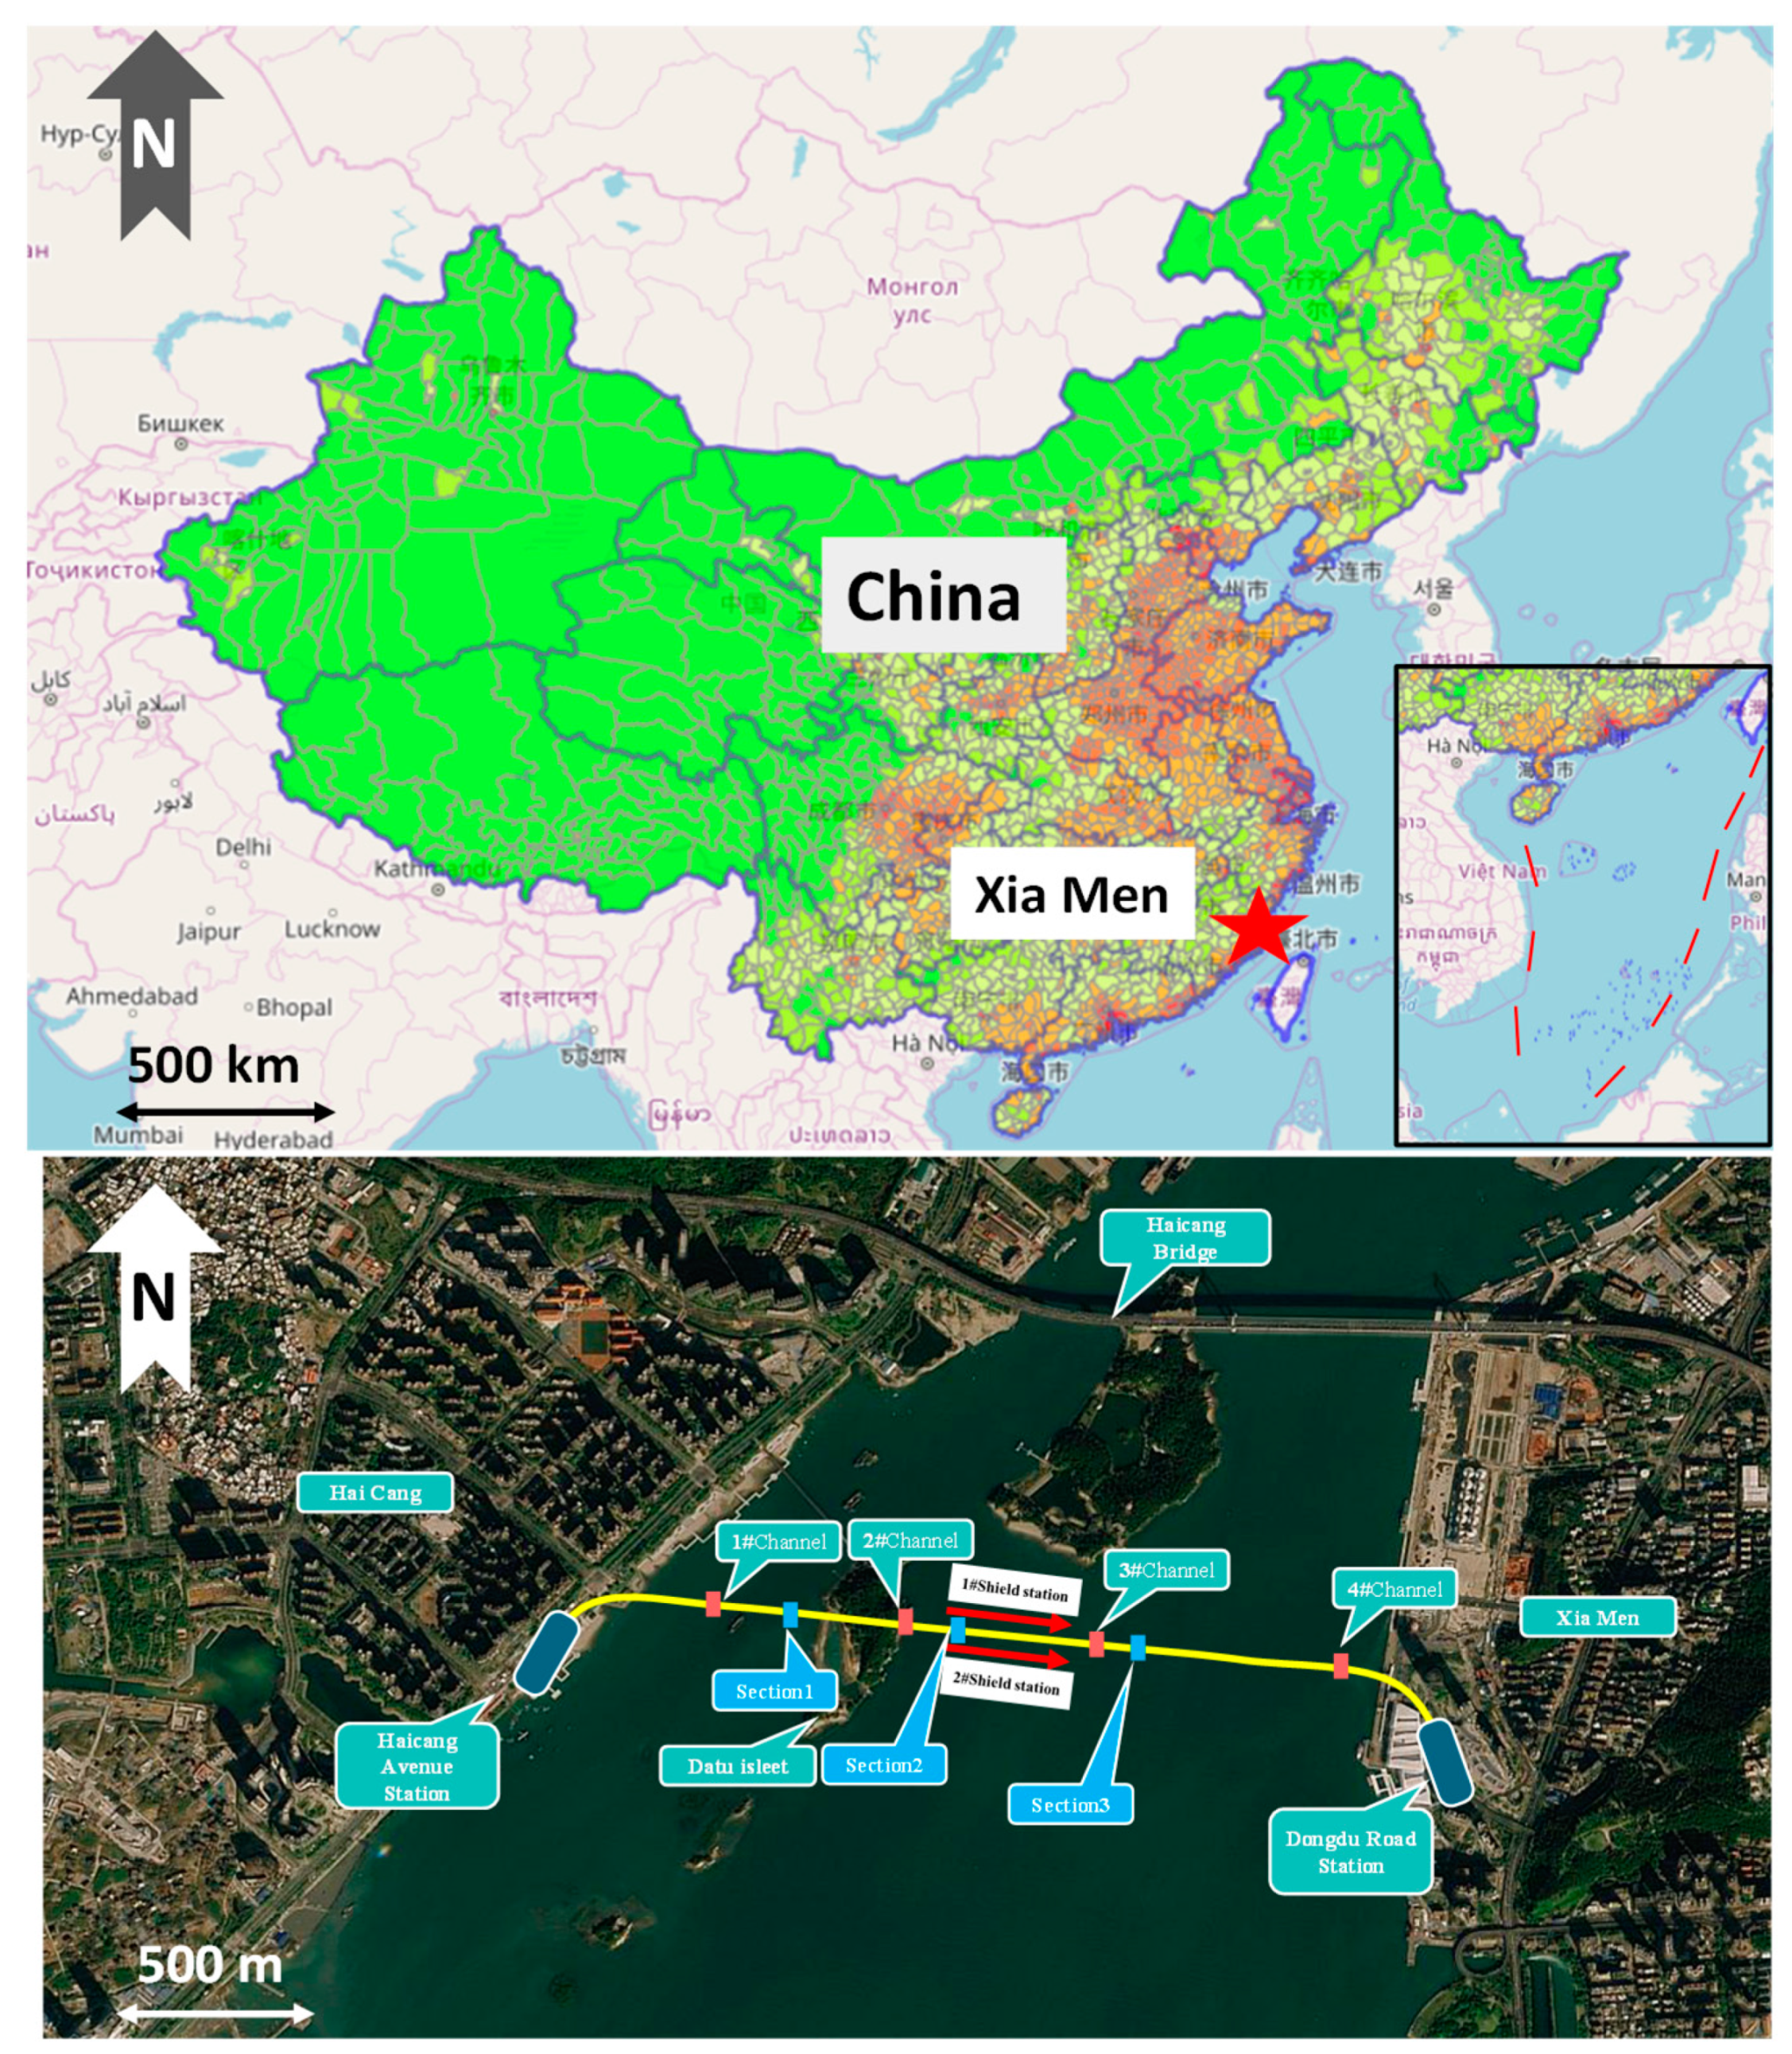
2. Overview of Shield Project
3. Experimental Study on Filter Cake Formation Mechanism
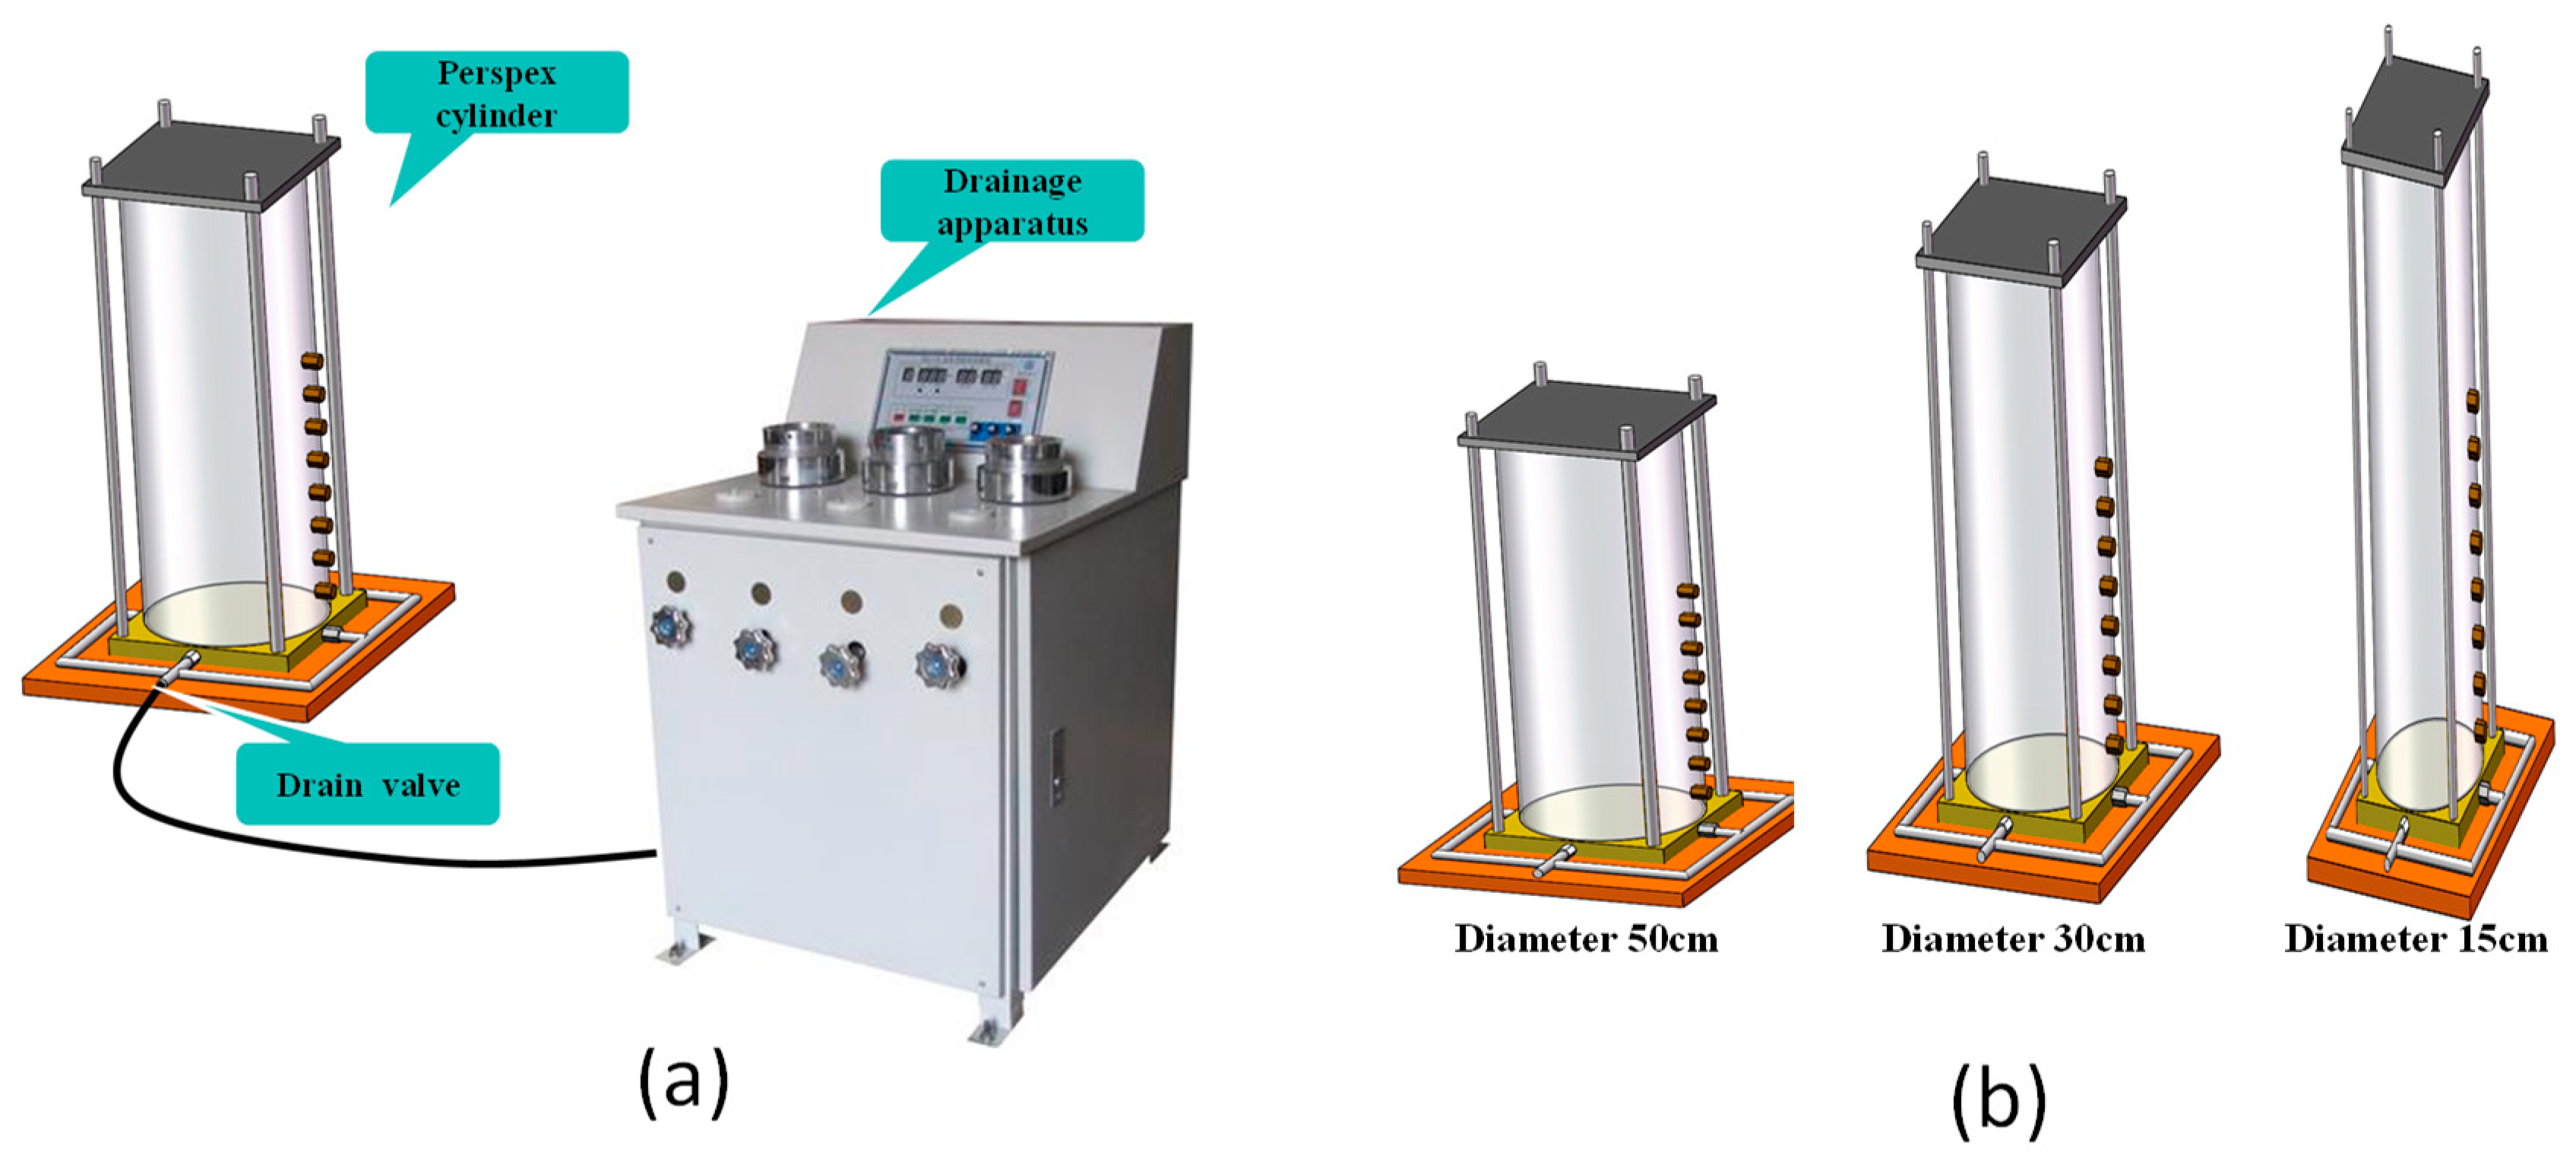
3.1. Test Materials and Procedures
3.2. Filter Cake Formation State
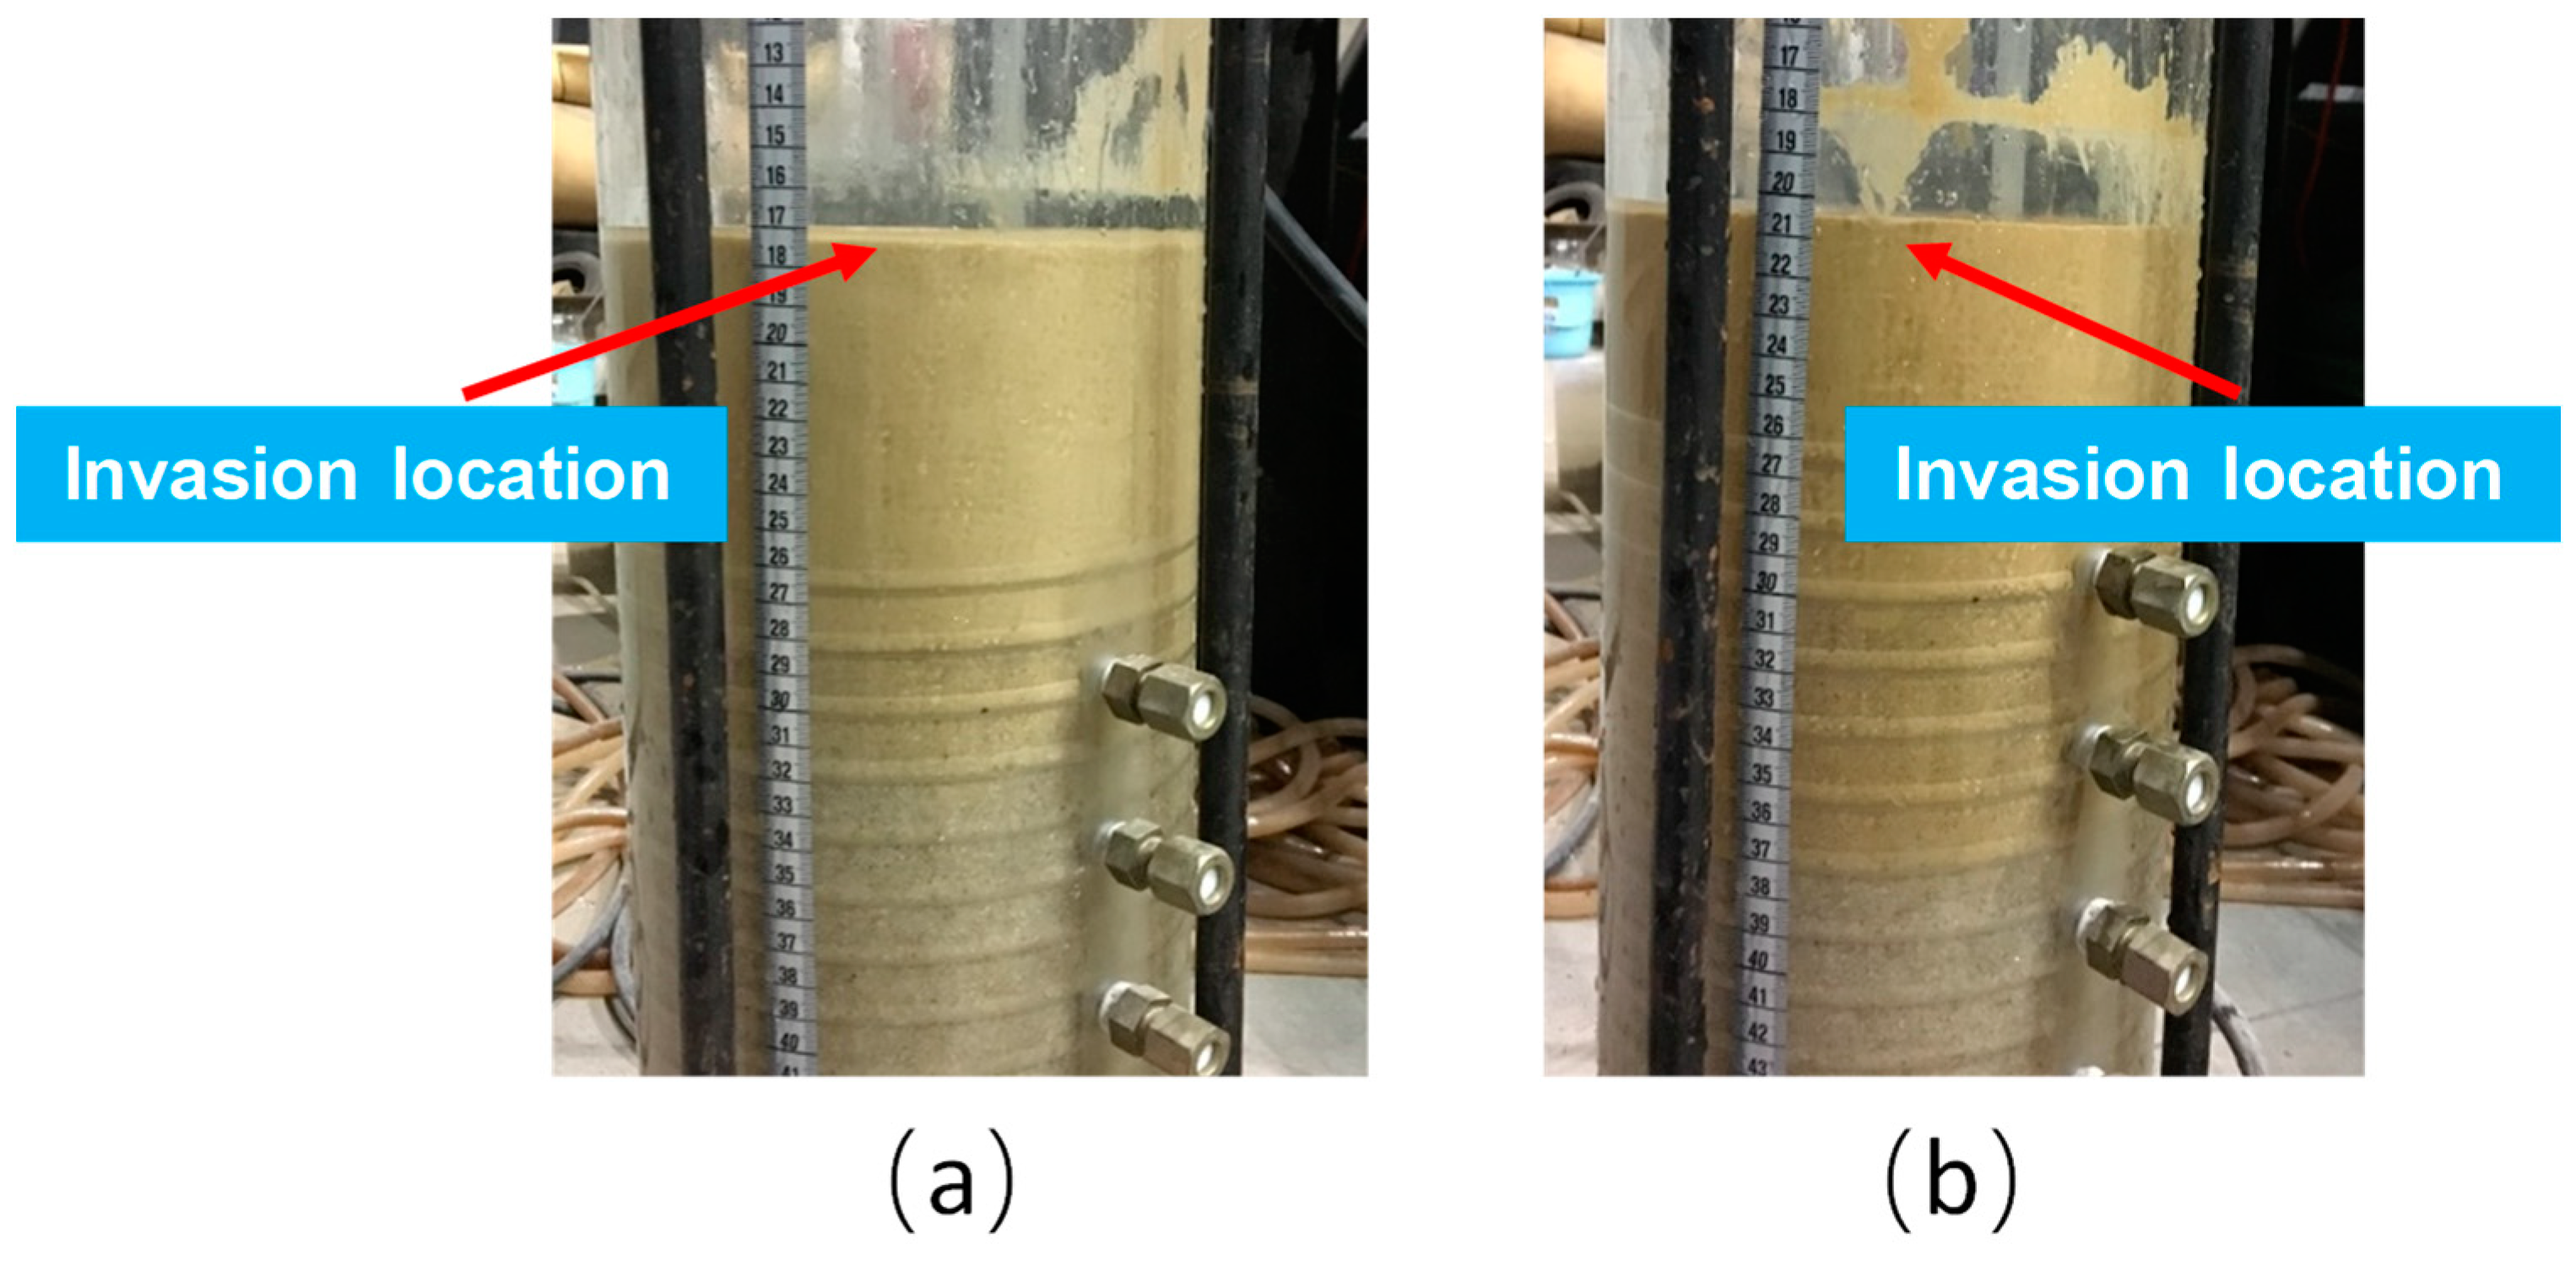
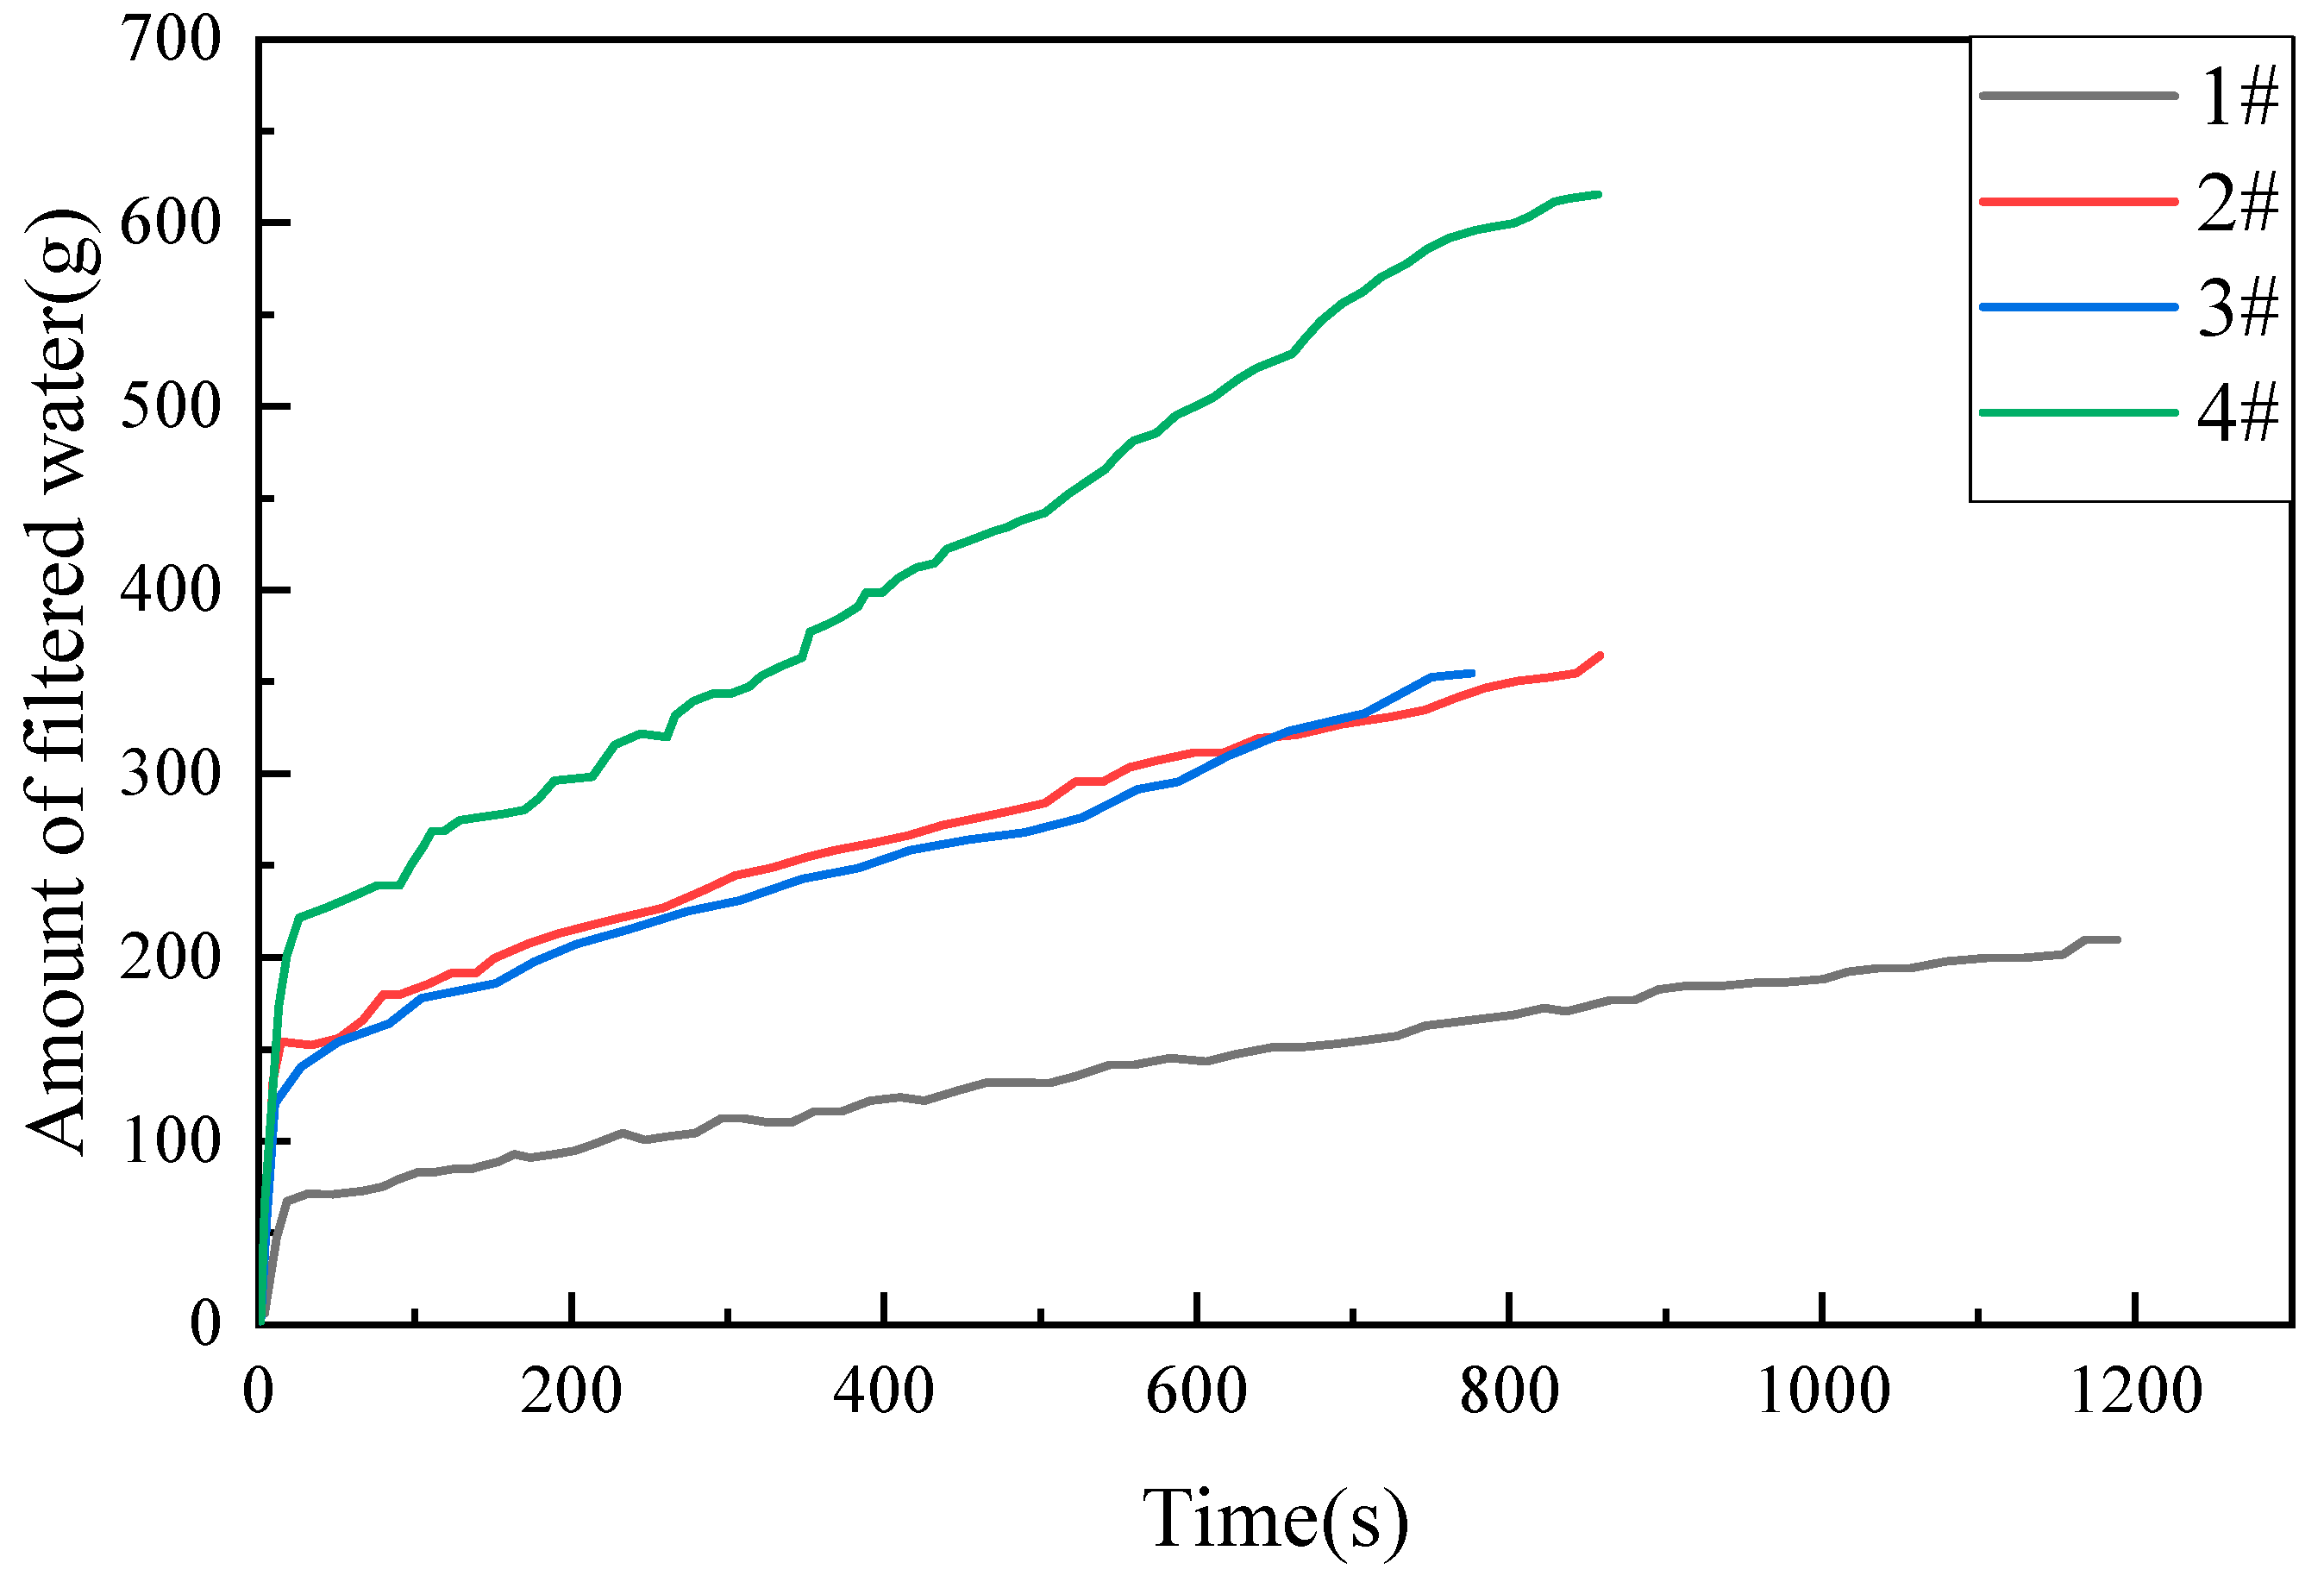
3.2.1. G1 Formation
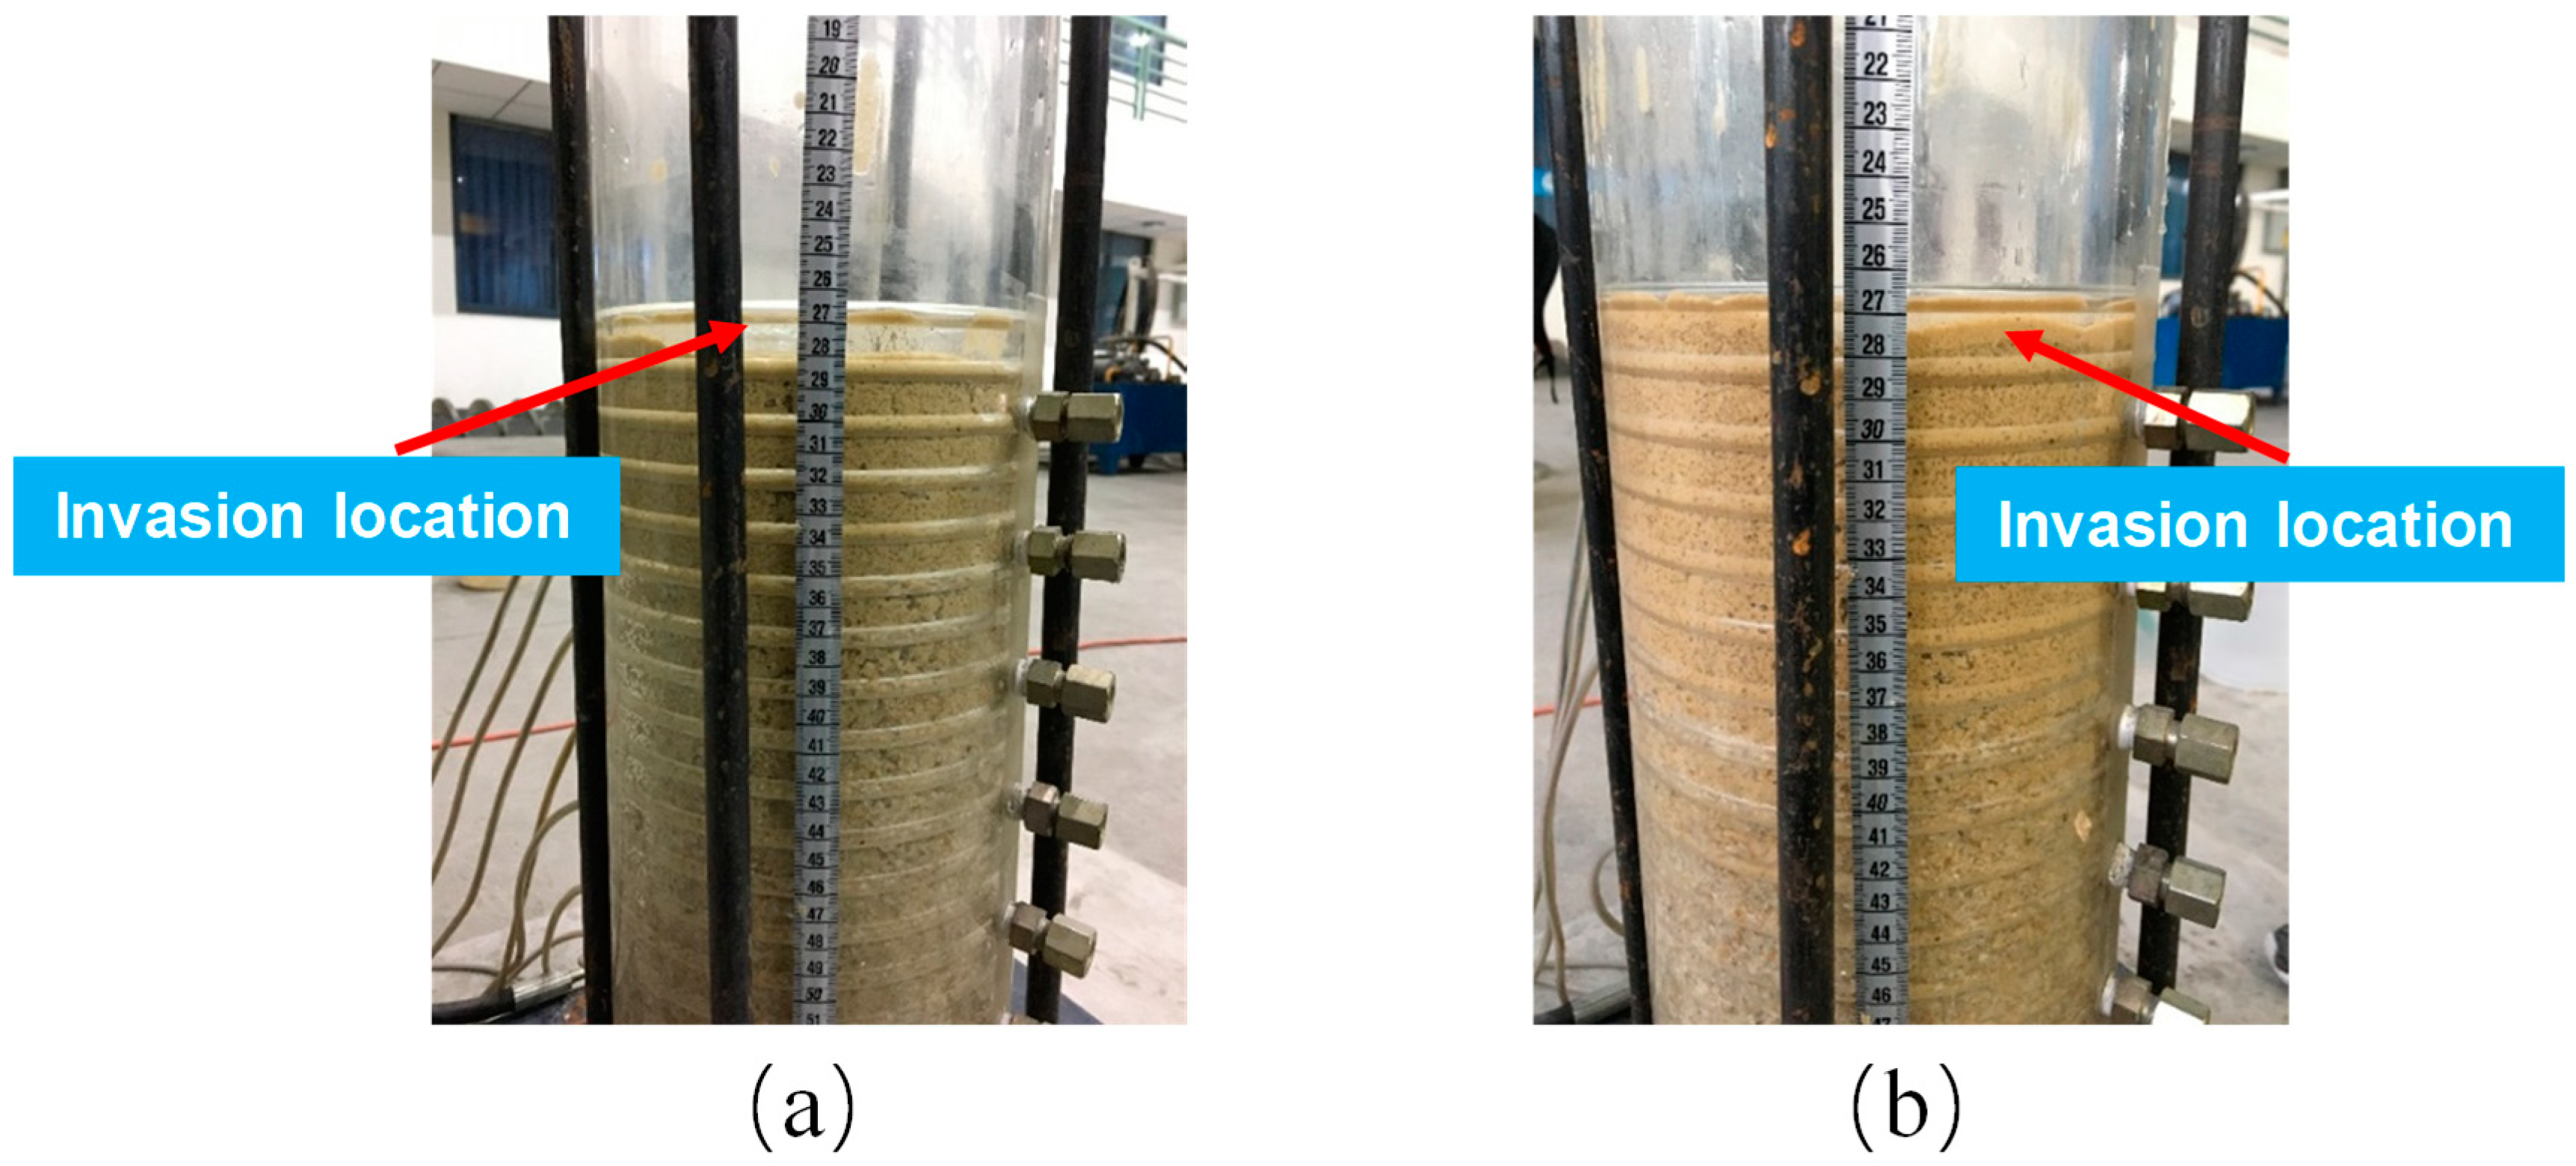
3.2.2. G2 Formation
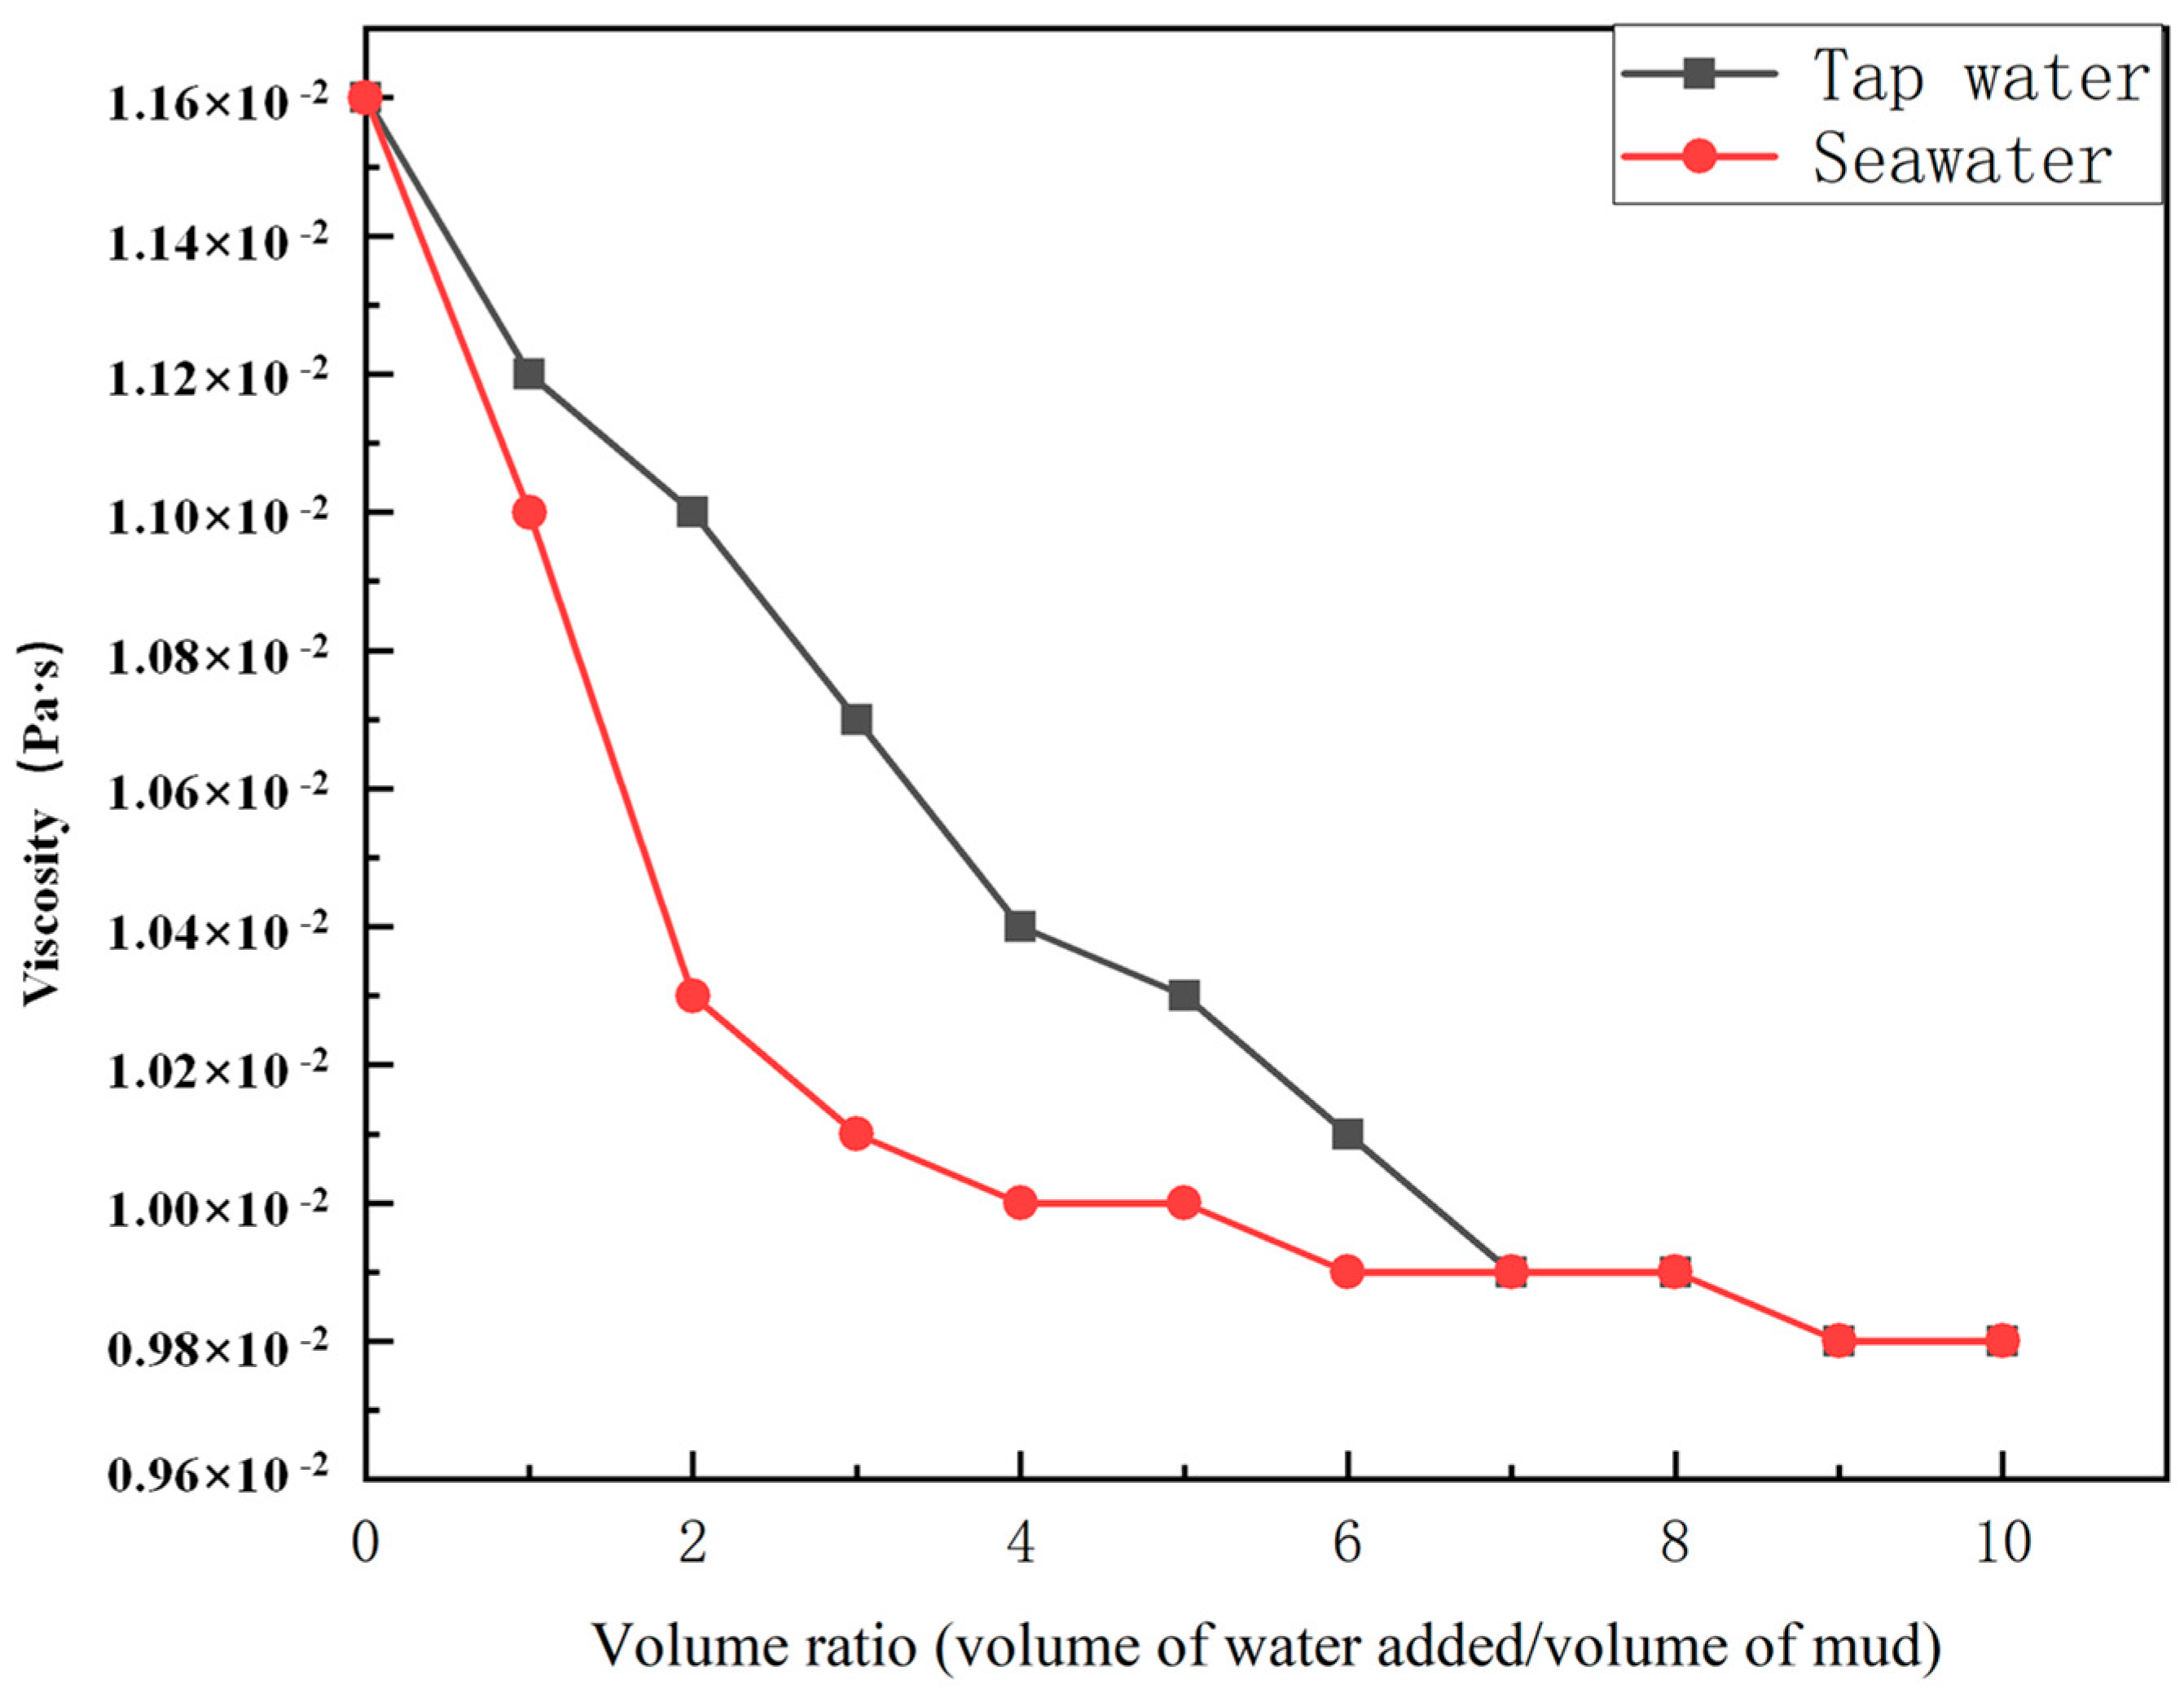
3.3. Experimental Study on the Effects of Seawater Erosion on Mud Properties
4. Numerical Simulation of Excavation Surface Stability
4.1. Calculation Model
4.2. Basic Calculation Assumptions
4.3. Numerical Simulation Calculation Process
4.4. Calculation of Silo Pressure Simulation Adjustment Strategy
4.5. Boundary Conditions
5. Discussion
5.1. Analysis of Filter Cake Formation Mechanism
5.2. Effect of Seawater on Mud Viscosity
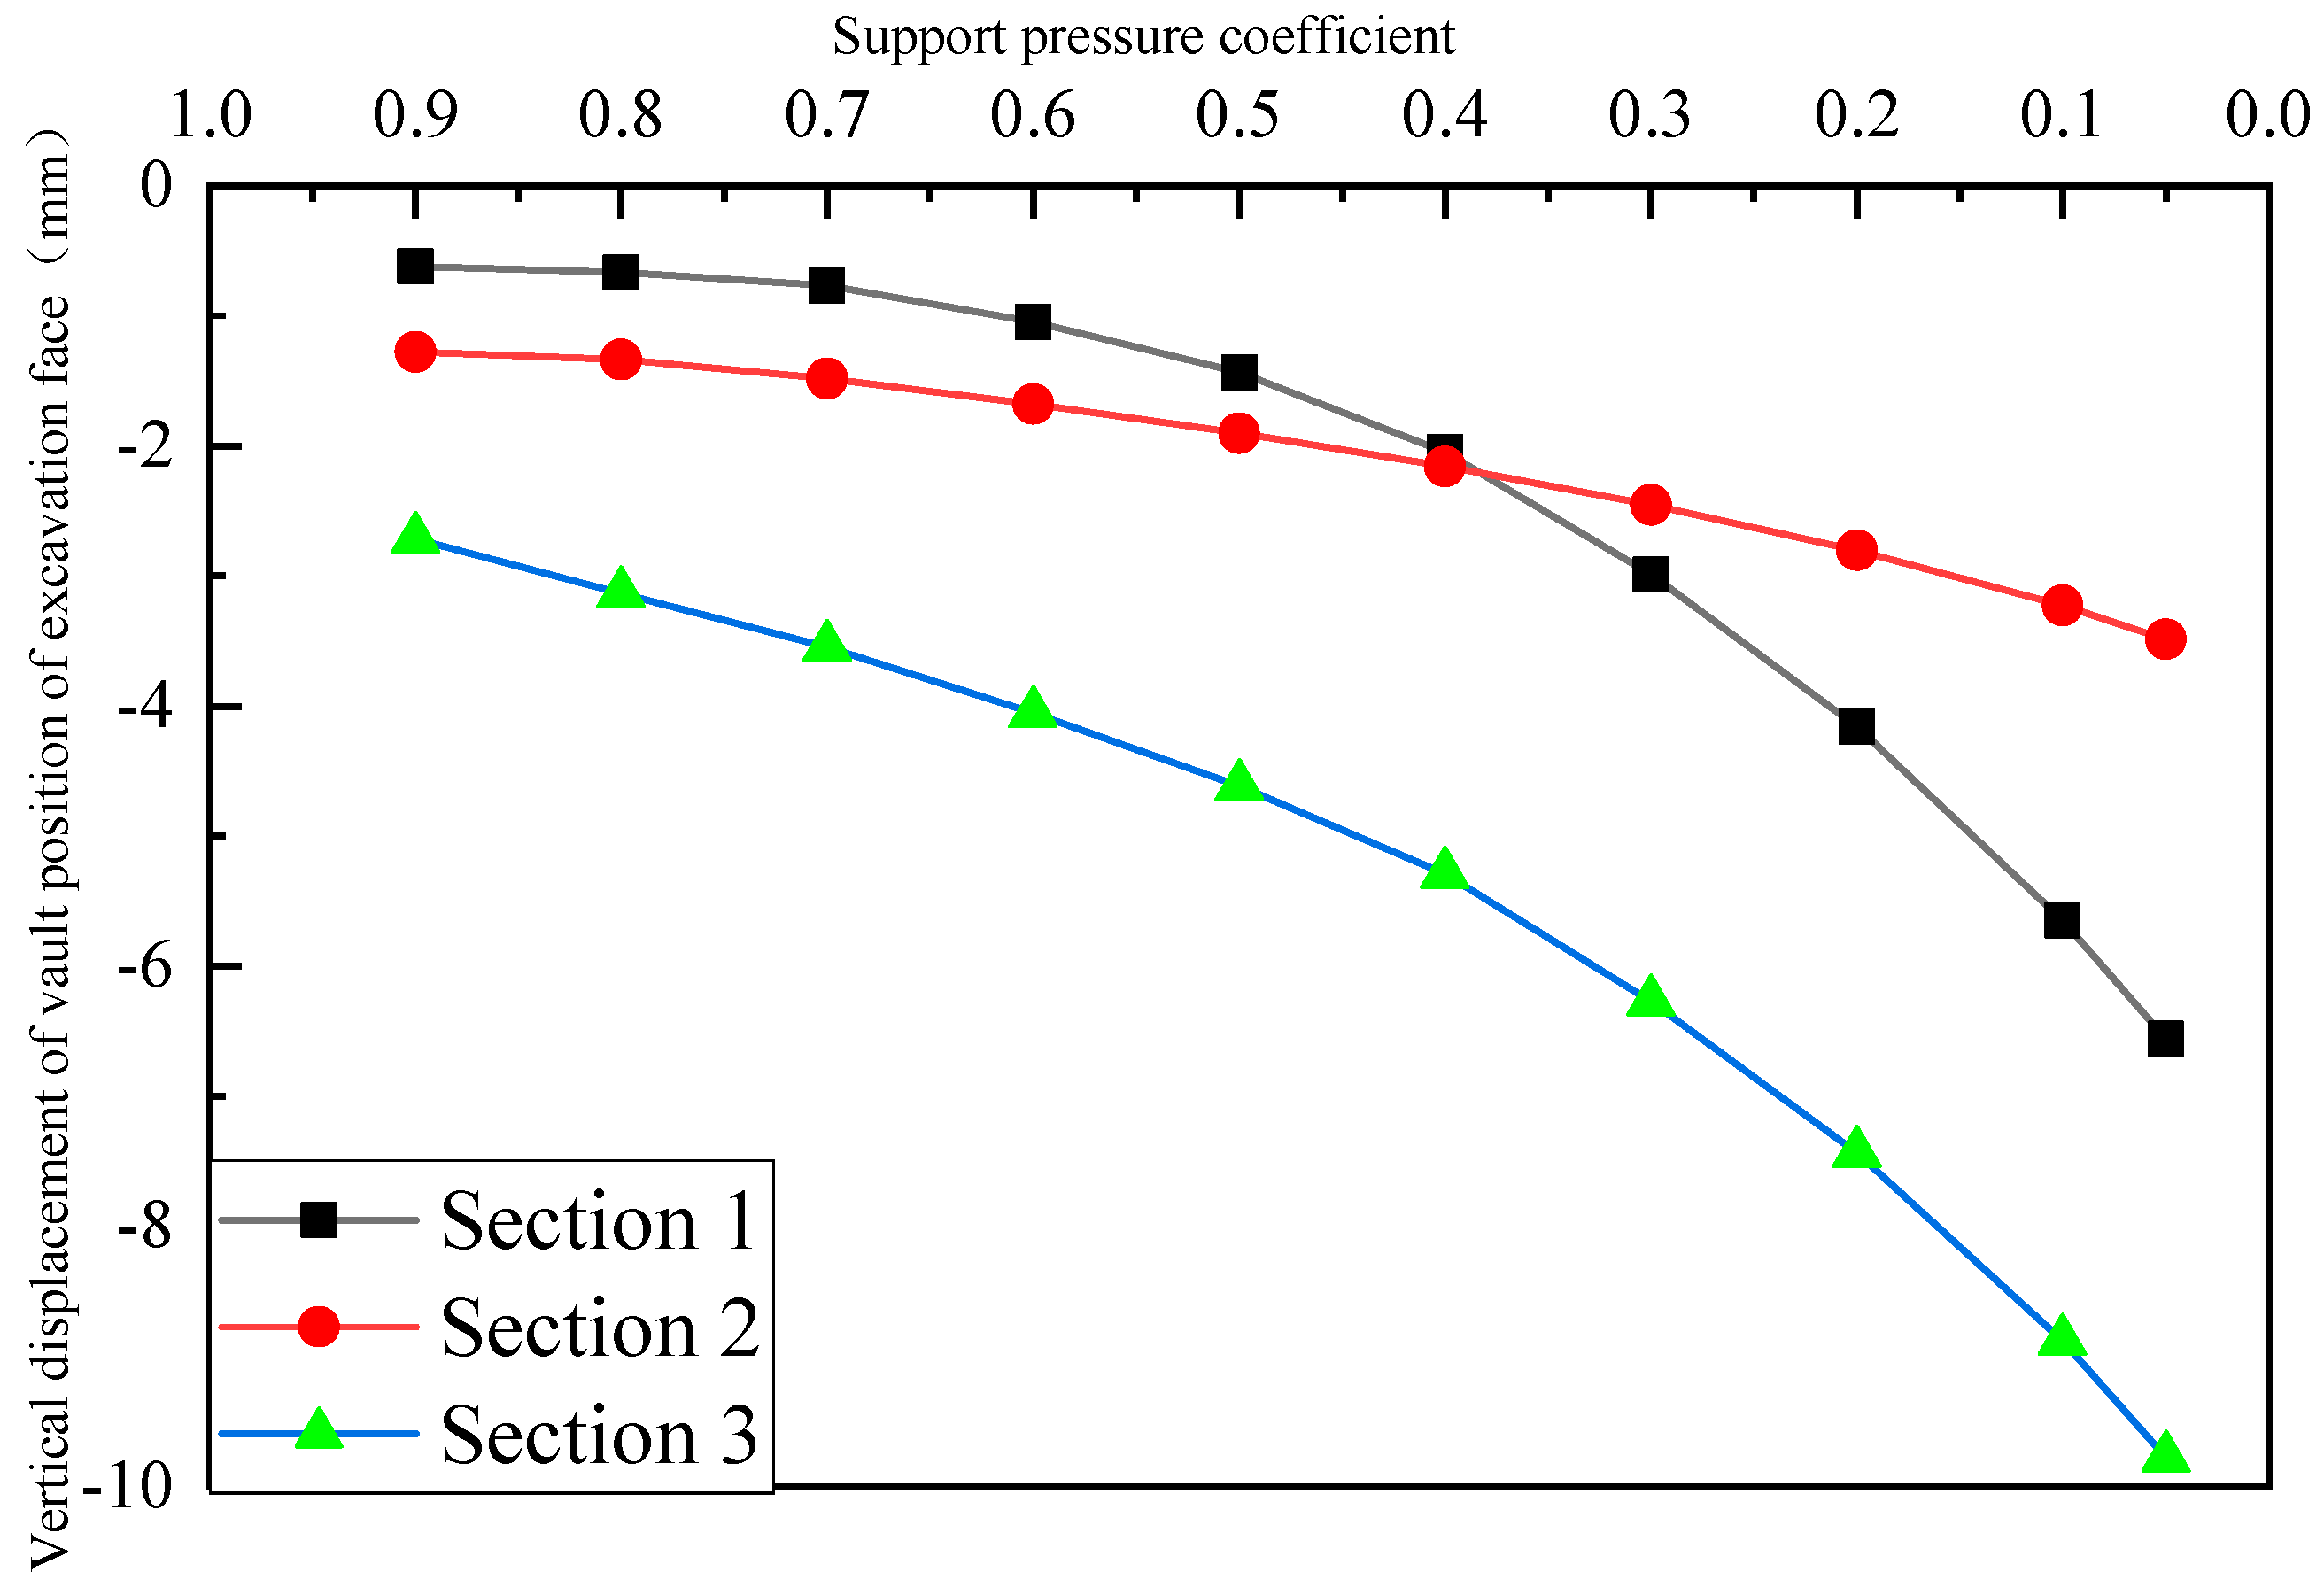
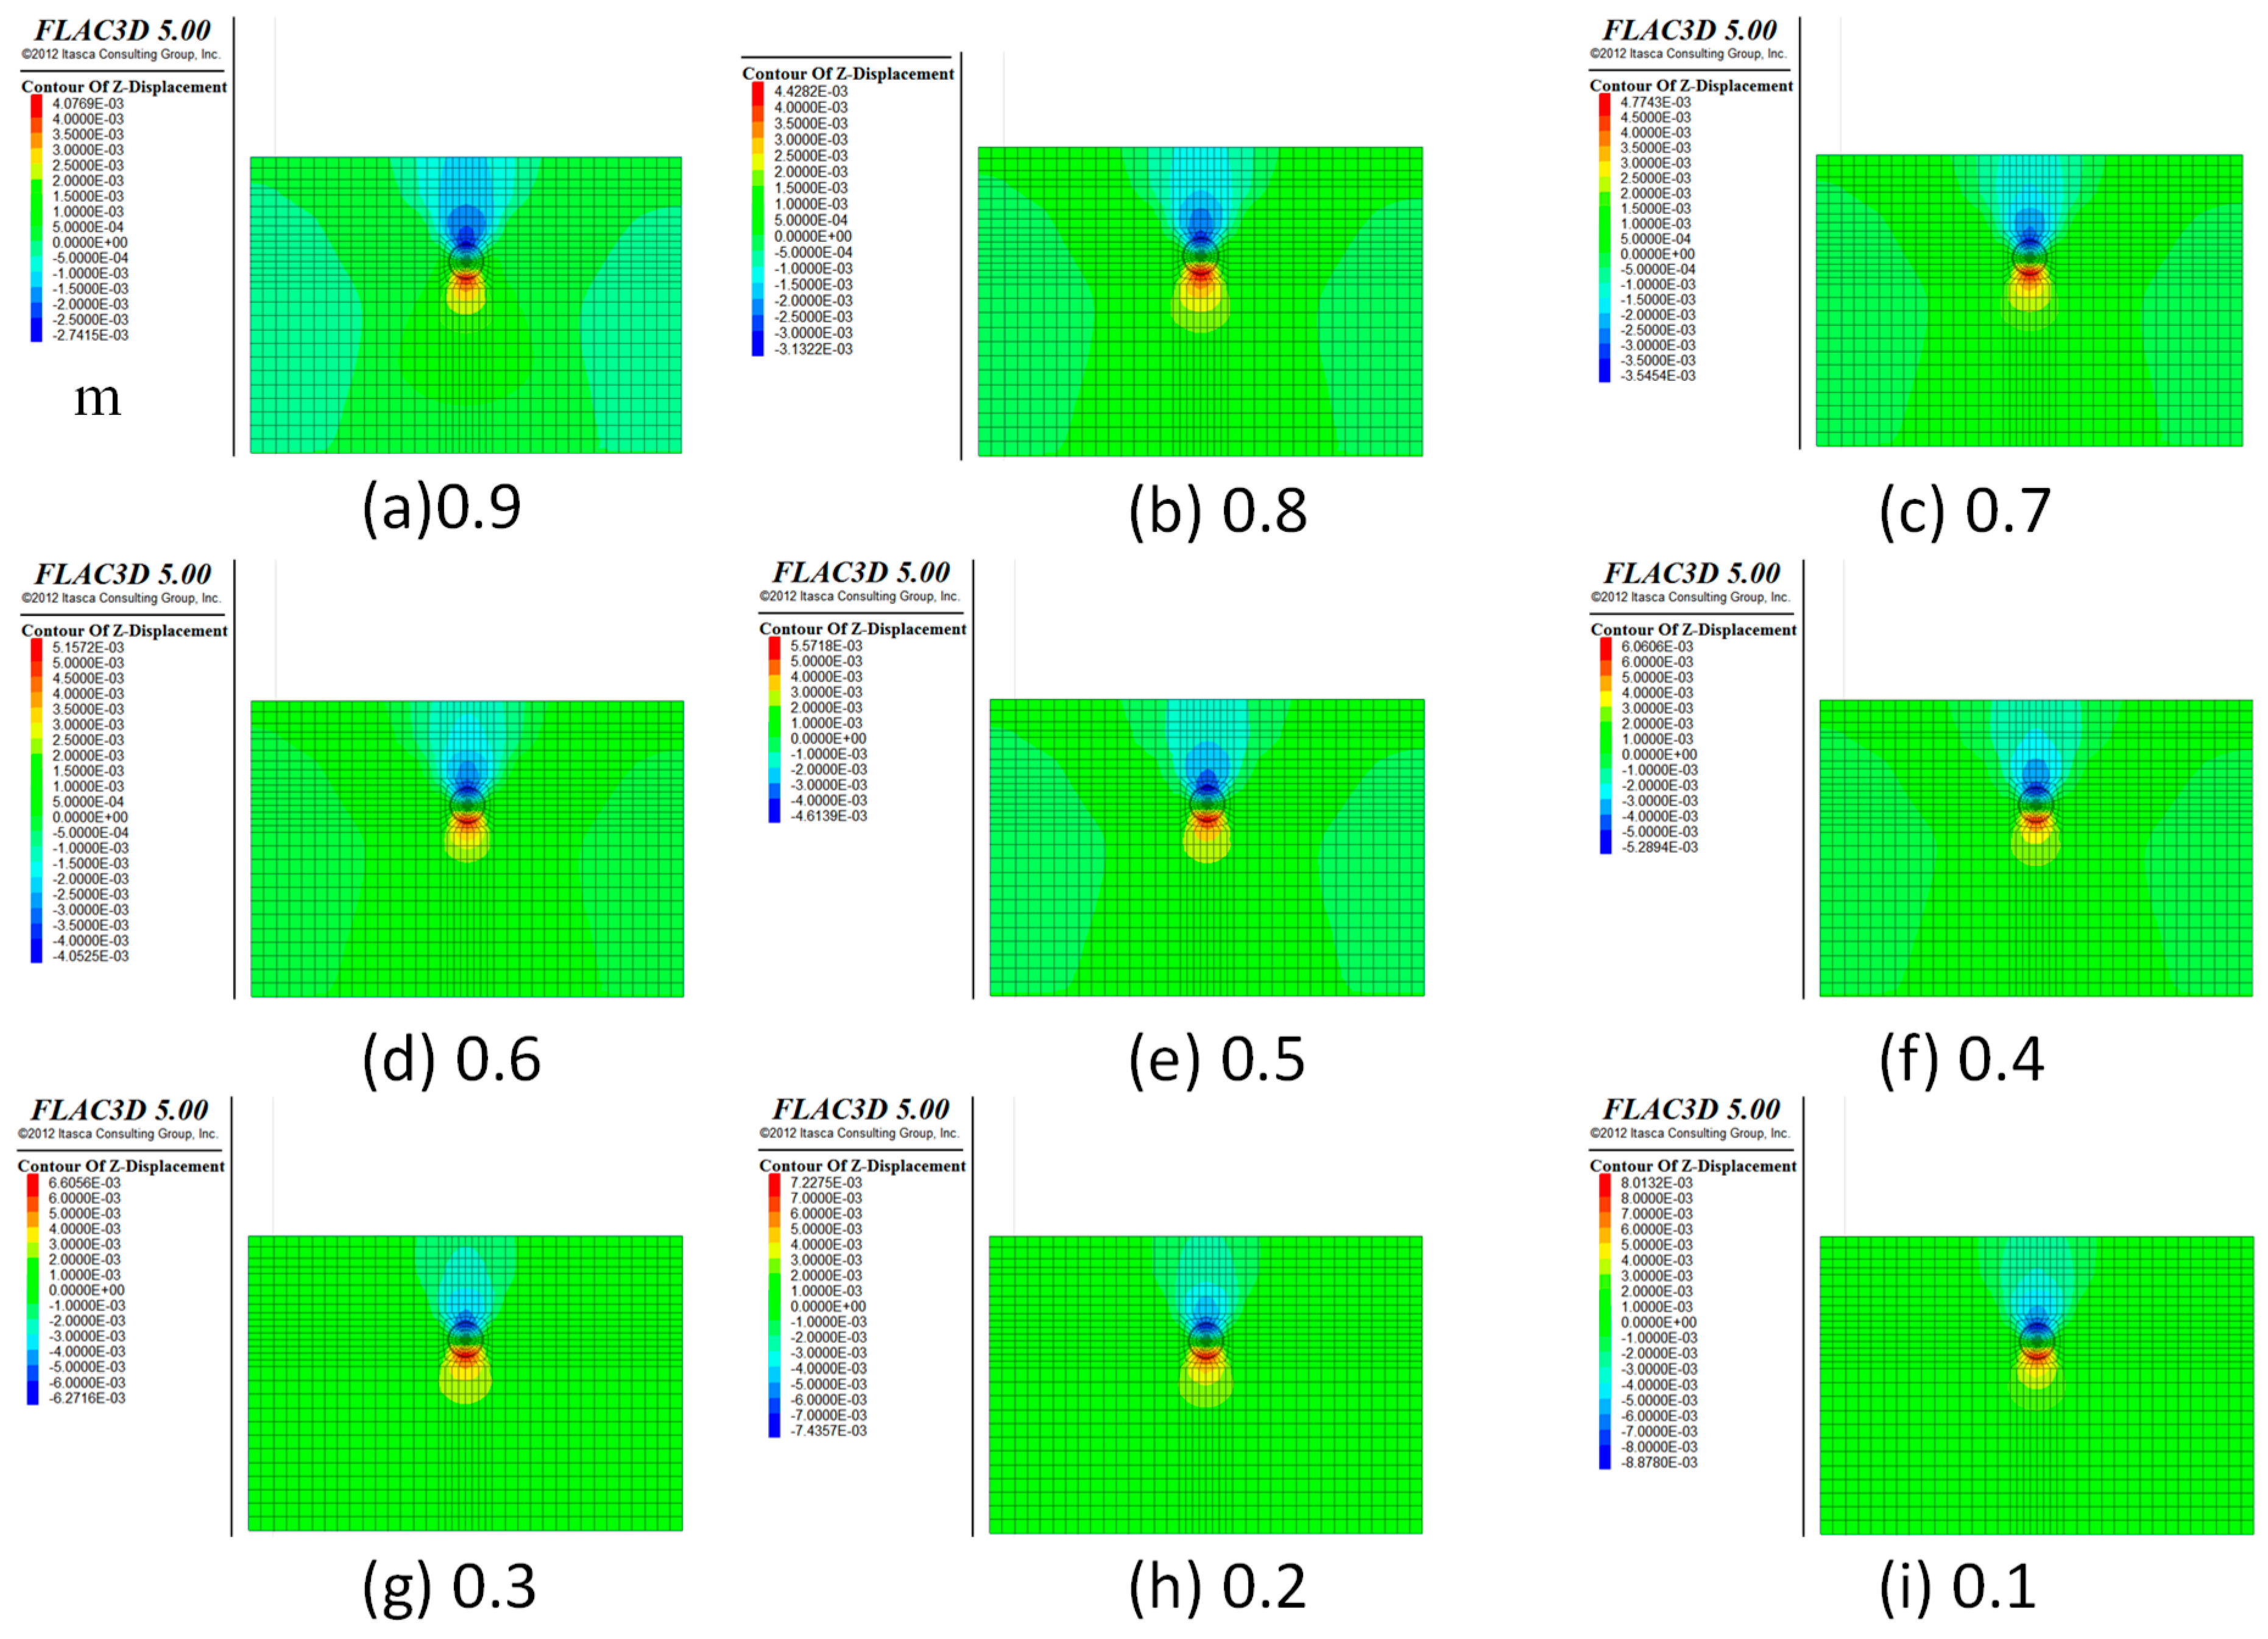
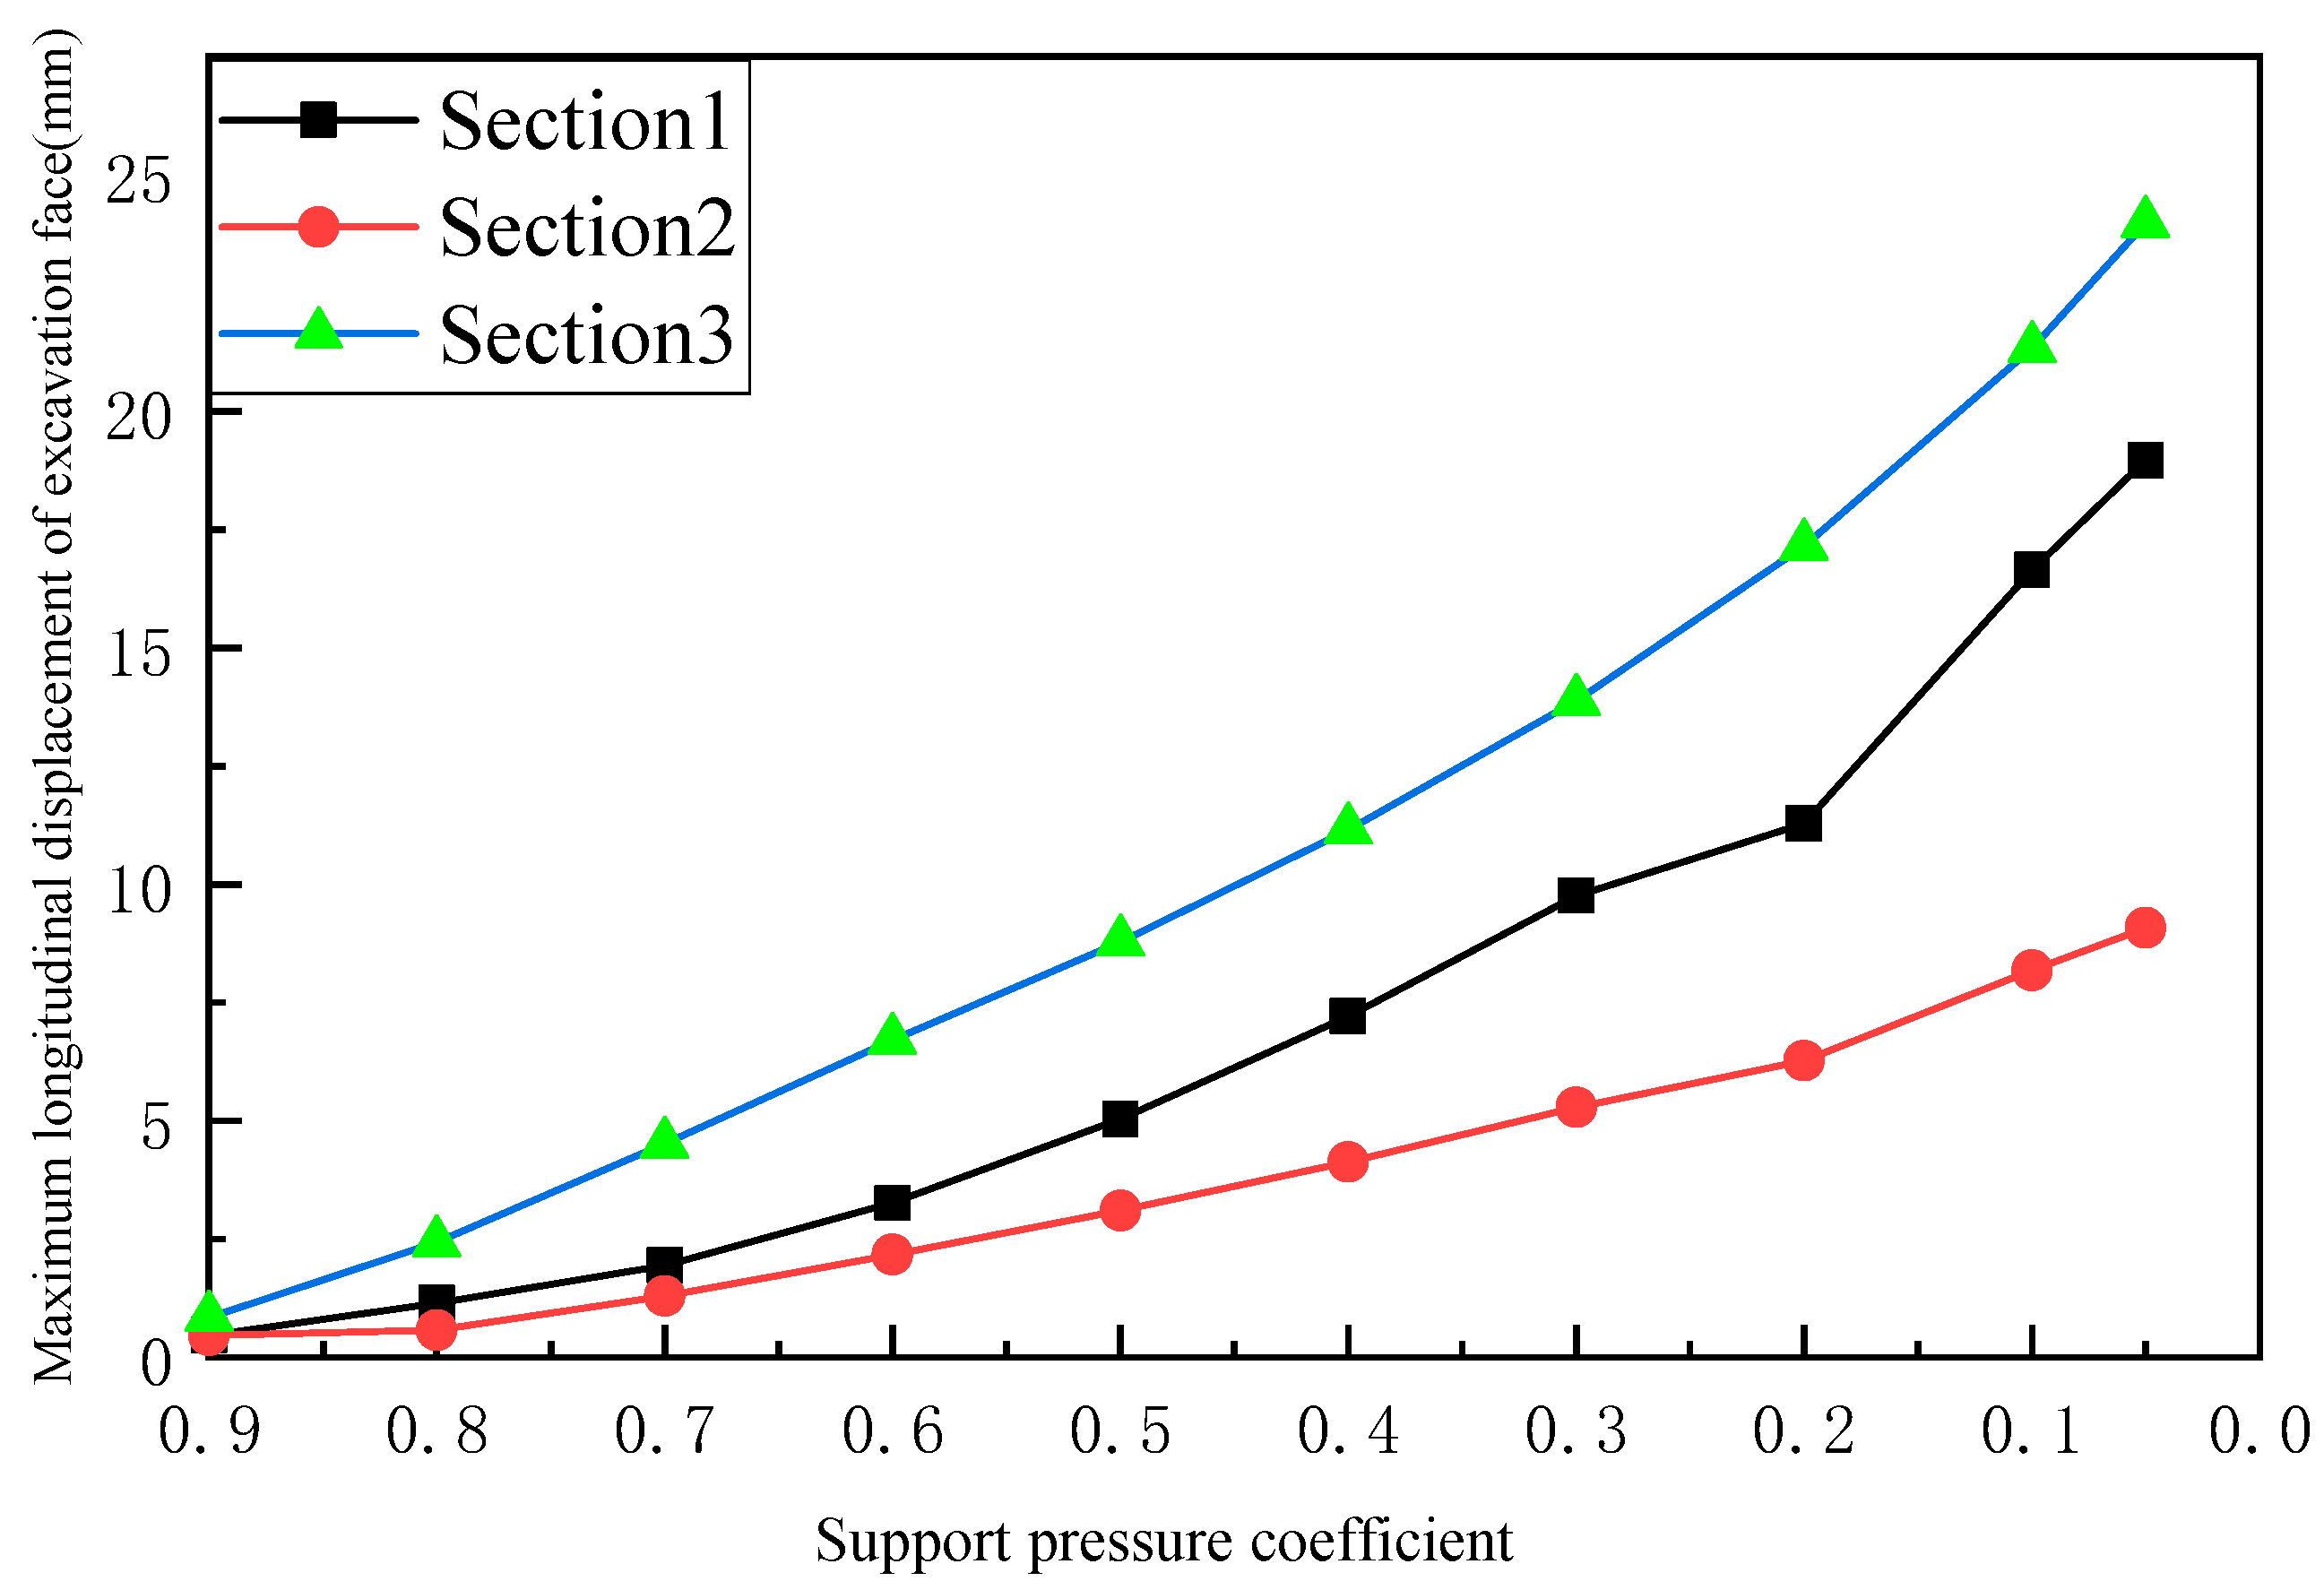
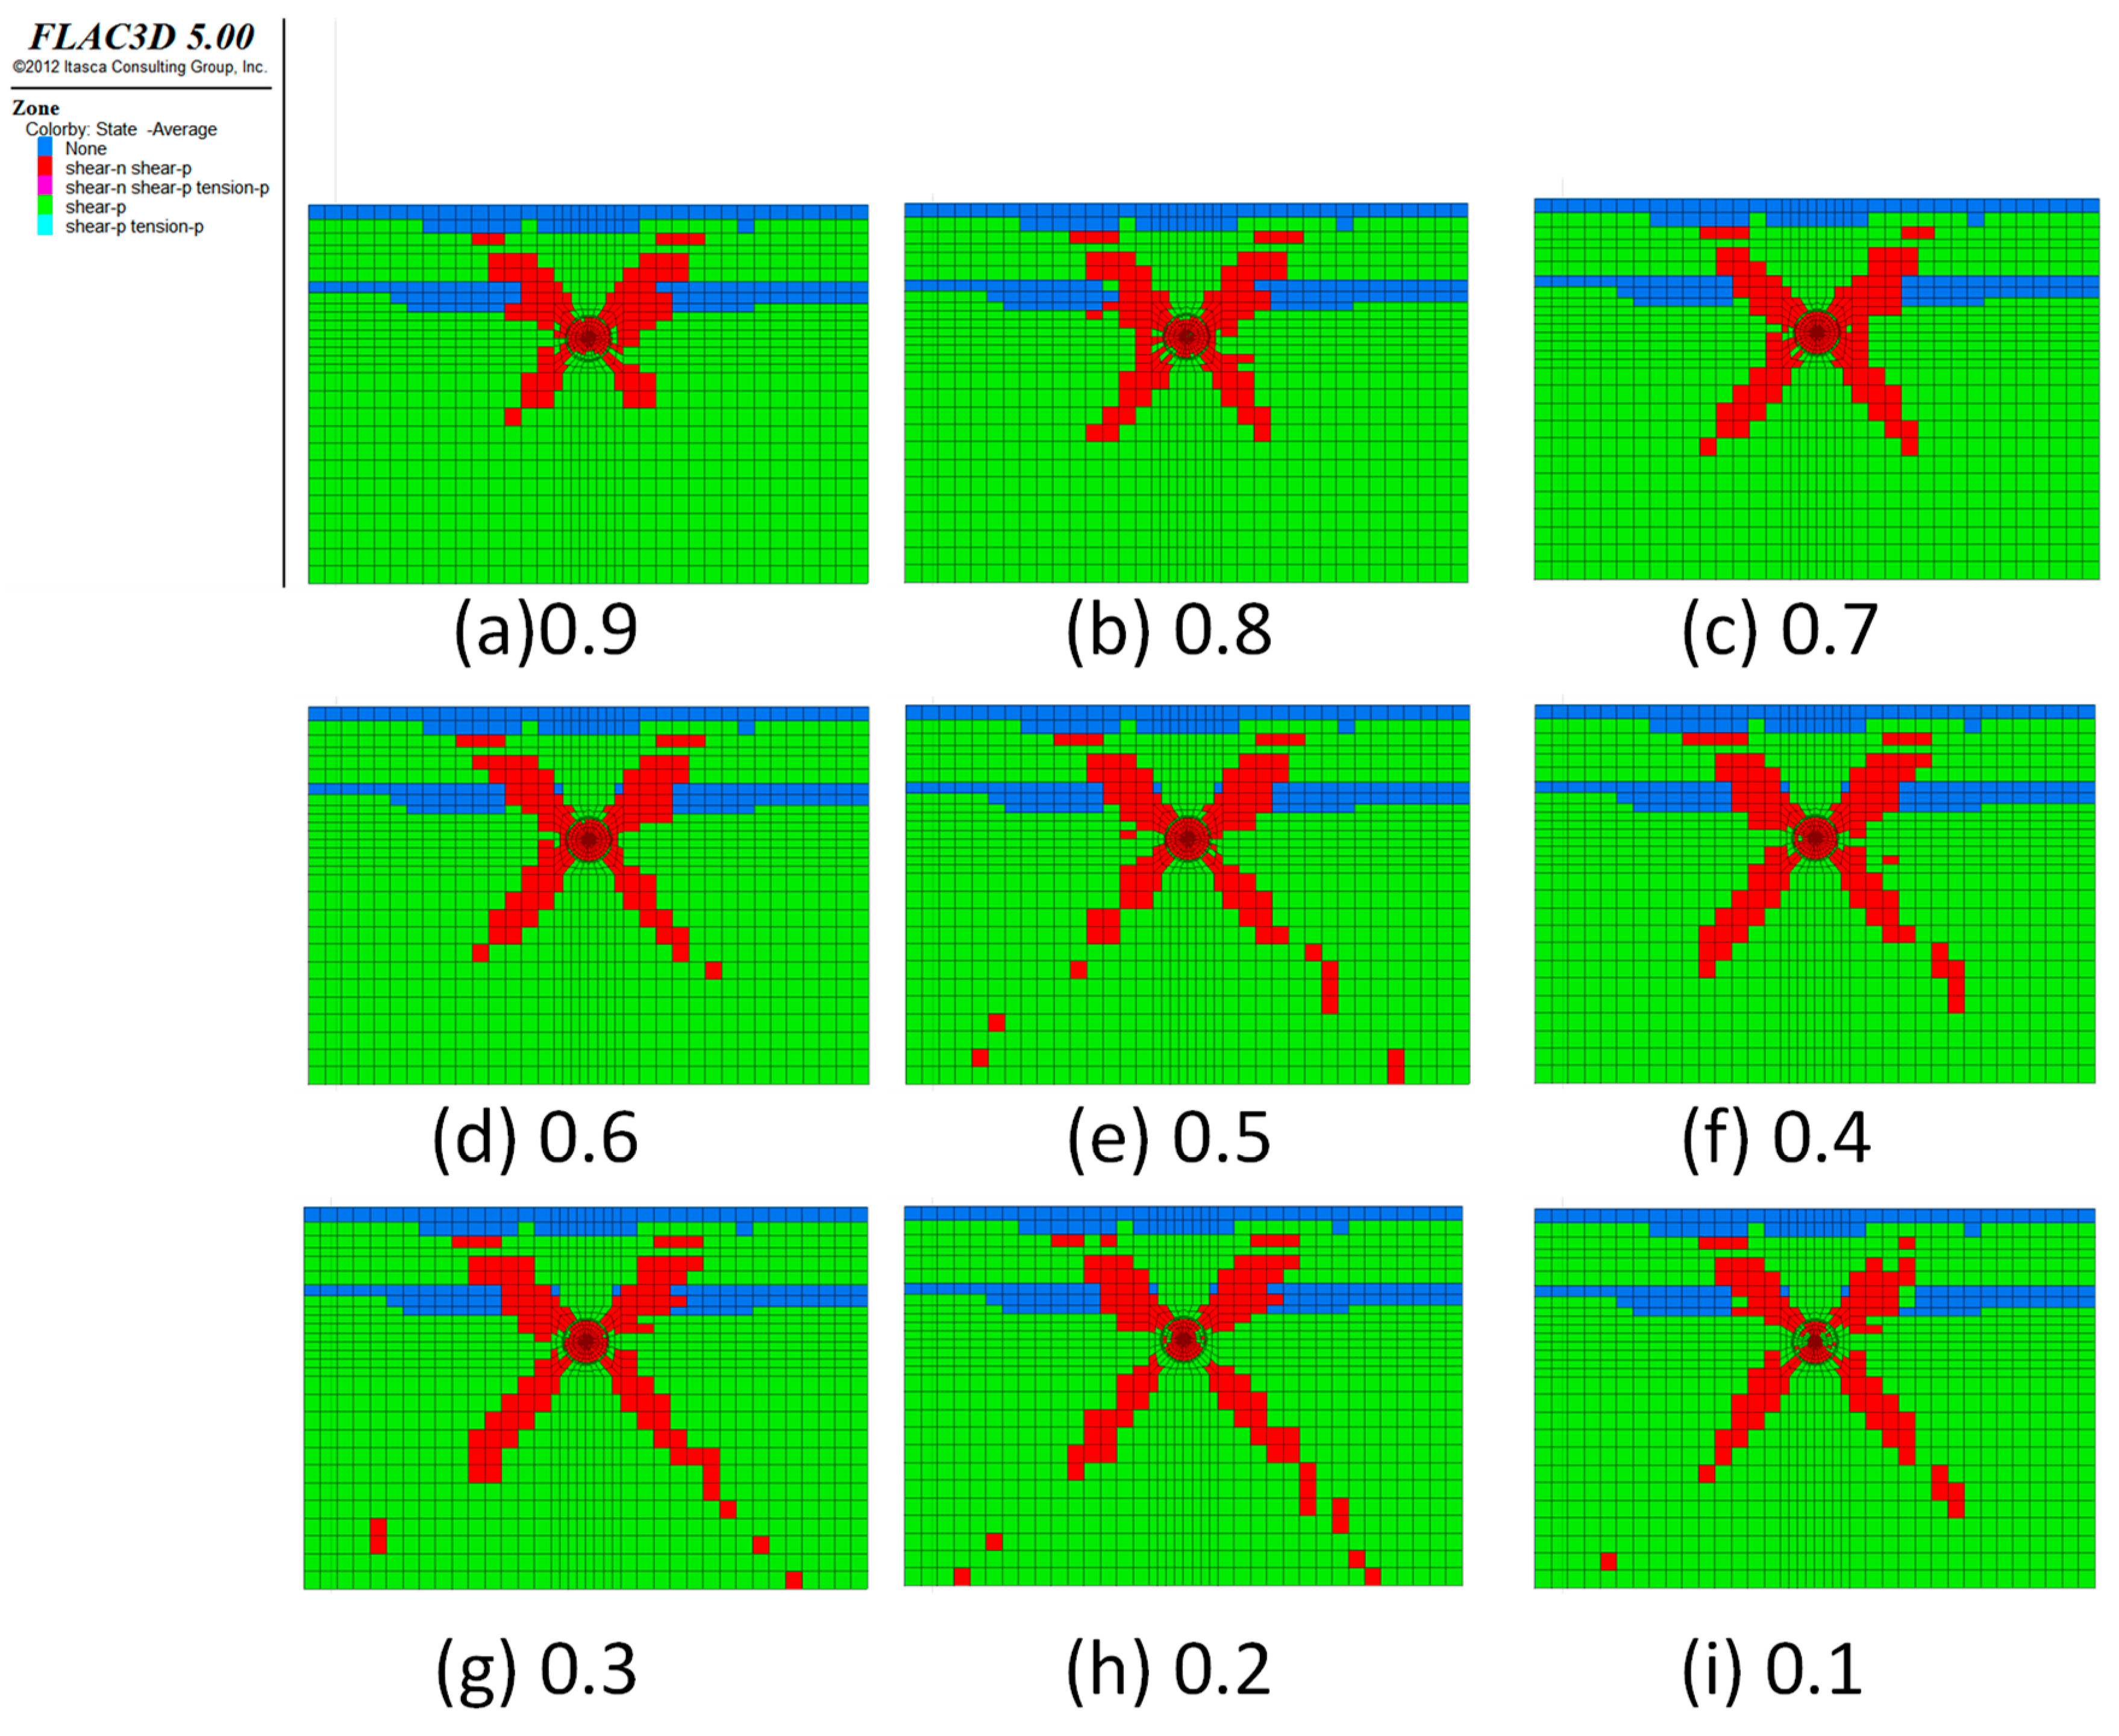
5.3. Analysis of Excavation Surface Stability
6. Conclusions
- (1)
- The filter cake has been formed in the initial loading stage, the formation of a filter cake does not require a large pressure difference. As the loading pressure increases, the quality of the filter cake continuously improves;
- (2)
- For strongly permeable formations, filter cakes mainly in the form of “mud skin + permeable zone” are formed, in which the mud skin is thin and the permeable zone is thick;
- (3)
- By increasing the content of clay in the mud, the particle size and content of sand, and the viscosity of the mud, a better-quality filter cake can be formed, reducing the penetration of mud into the formation, and reducing the amount of mud needed to form a filter cake;
- (4)
- Filter cake can be formed only by bentonite base slurry and a small amount of clay in formations with low permeability, but as the permeability of the formation becomes larger and the pores in the formation increase and the pore size increases, the particles in the mud need to be increased. The content of the substance and the viscosity of the mud usually need to ensure a certain sand content in the mud and increase the viscosity of the mud in the project. However, if the permeability of the formation is too large, the gradation of large particles in the mud needs to be considered in order to form a filter cake.
- (2)
- The stratum traversed by the tunnel has good self-stabilizing ability. The stratum that is prone to instability is mainly medium-sand-bearing stratum. However, considering that this project is a subsea shield tunnel, it is affected by high water pressure, fissure development, and shield tunneling. The excavation disturbs the stratum stress field and seepage field, and there is uncertainty in the stability of the excavation face during the opening of the warehouse, which threatens the safety of the construction. How to use and improve the stability of the stratum has become the focus of the project.
Author Contributions
Funding
Acknowledgments
Conflicts of Interest
References
- Min, F.; Zhu, X.; Lin, C.; Guo, X. Opening the excavation chamber of the large-Diameter size slurry shield: A case study in Nanjing Yangtze River Tunnel in China. Tunn. Undergr. Space Technol. 2015, 46, 18–27. [Google Scholar] [CrossRef]
- Jun, S. On the Technical Advantages and Problems of Constructing Tunnels Across Rivers and Seas. Tunn. Constr. 2013, 33, 337–342. [Google Scholar]
- Shuming, Z. Overall Design and Construction of Qingdao Jiaozhou Bay Subsea Tunnel. Tunn. Constr. 2013, 33, 38–44. [Google Scholar]
- Jingeng, L. Research on Xiamen Urban Rail Transit Development Strategy. Master’s Thesis, Huaqiao University, Quanzhou, China, 2015. [Google Scholar]
- Zhicehng, W. Procedure of Replacing of Cutting Teeth under Atmospheric Pressure and Its Optimization. Tunn. Constr. 2010, 3, 339–343. [Google Scholar]
- Chuangmian, L. Technical gist of entering earth cabin with press in shield construction. Constr. Mech. 2008, 4, 51–53. [Google Scholar] [CrossRef]
- Herrenknecht, E.M.; Bäppler, K. Compressed air work with tunnel boring machines. In Underground Space-the 4th Dimension of Metropoises; Taylor & Francis Group: London, UK, 2007; pp. 1175–1181. [Google Scholar]
- Heijboer, J.; Van Den Hoonaard, J.; van de Linde, W. The Westerschelde tunnel: Approaching limits; CRC Press: Boca Raton, FL, USA, 2003; pp. 1–36. [Google Scholar]
- Zhongshan, W.; Zhong, X.; Yang, Z. Calculation of the minimum excavation face support pressure for opening chamber in slurry shield in Nanjing Weisan Road River Tunnel. China Harb. Eng. 2014, 2, 33–36. [Google Scholar]
- Fanlu, M.; Teng, J.; Daizhou, W.; Yazhou, Z. Experimental Study on Preparation and Filter Membrane Formation of Slurry during Hyperbaric Operation in Tunneling by Slurry Shield. Tunn. Constr. 2014, 34, 857–861. [Google Scholar] [CrossRef]
- Ning, Z.; Zhu, W.; Min, F.; Xu, J. Microscopic pores of filter membranes and permeability during chamber opening under high pressure in slurry shield. Chin. J. Geotech. Eng. 2017, 39, 495–500. [Google Scholar] [CrossRef]
- Mingliang, C.; He, F.; Chuantian, L. Tools repairing and welding techniques with high pressure of slurry shield under deep water-rich sandy gravel stratum. Eng. Sci. 2010, 12, 46–50. [Google Scholar]
- Davis, E.H.; Gunn, M.J.; Mair, R.J.; Seneviratne, H.N. The stability of shallow tunnels and underground openings in cohesive material. Geotechnique 1980, 30, 397–416. [Google Scholar] [CrossRef]
- Leca, E.; Dormieux, L. Upper and lower bound solutions for the face stability of shallow circular tunnels in frictional material. Geotechnique 1990, 40, 581–606. [Google Scholar] [CrossRef] [Green Version]
- Lee, I.; Lee, J.; Nam, S. Effect of seepage force on tunnel face stability reinforced with multi-Step pipe grouting. Tunn. Undergr. Space Technol. 2004, 19, 551–565. [Google Scholar] [CrossRef]
- Takano, D.; Otani, J.; Nagatani, H.; Mukunoki. Application of x-ray CT on boundary value problems in geotechnical engineering: Research on tunnel face failure. In Proceedings of the GeoCongress 2006: Geotechnical Engineering in the Information Technology Age, Atlanta, GA, USA, 26 February–1 March 2006; pp. 1–6. [Google Scholar]
- Kirsch, A. Experimental investigation of the face stability of shallow tunnels in sand. Acta Geotech. 2010, 5, 43–62. [Google Scholar] [CrossRef] [Green Version]
- Mair, R.J. Centrifugal Modelling of Tunnel Construction in Soft Clay. Ph.D. Thesis, University of Cambridge, Cambridge, UK, 1978. [Google Scholar]
- Hehua, Z.; Wenqi, D.; Li, X. Construction simulation for the mechanical behavior of shield tunnel and its application. China Civ. Eng. J. 2000, 3, 98–103. [Google Scholar] [CrossRef]
- Chunlin, D.; Shiyou, Z.; Zhou, S. Influence of in-Situ stress release on the stability of surrounding rock masses and ground surface settlement for shield-driven tunnel. Chin. J. Rock Mech. Eng. 2002, 11, 1633–1638. [Google Scholar]
- Hongjie, Y.; Deming, F.; Ge, X. Experimental study and numerical simulation of earth pressure around shield machine. Chin. J. Rock Mech. Eng. 2006, 8, 1652–1657. [Google Scholar] [CrossRef]
- Zhang, H.; Yin, Z.; Zhu, J. 3d finite element simulation on deformation of soil mass during shield tunneling. Chin. J. Rock Mech. Eng. 2005, 5, 755–760. [Google Scholar]
- Xinliang, J.; Cui, Y.; Li, Y.; Zm, Z. Measurement and simulation of ground settlements of Tianjin subway shield tunnel construction. Rock Soil Mech. 2005, 10, 91–95. [Google Scholar]
- Xiaoqing, L.; Zhu, C. Numerical analysis on the ground settlement induced by shield tunnel construction. J. Highw. Transp. Res. Dev. 2007, 6, 86–91. [Google Scholar] [CrossRef]
- Yintao, Z.; Tao, L.; Bian, J. Analysis of the numerical simulation of ground movement induced by shield tunneling. J. Beijing Univ. Technol. 2006, 4, 332–337. [Google Scholar]
- Lei, H. Research on Technology of Replacing Cutting Tool with Pressure of EPB Shield in Water-Rich and Pebbly Sand Stratum. Ph.D. Thesis, Southwest Jiaotong University, Sichuan, China, 2009. [Google Scholar]
- Anagnostou, G.; Kovári, K. The face stability of slurry-Shield-Driven tunnels. Tunn. Undergr. Space Technol. 1994, 9, 165–174. [Google Scholar] [CrossRef]
- Harding, P.G. High density slurry shield extends Japanese technology. Tunn. Tunn. Int. 1982, 14, 55–56. [Google Scholar]
- Broere, W. Tunnel Face Stability and New CPT Applications; Delft University of Technology Press: Delft, The Netherlands, 2002. [Google Scholar]
- Kim, S.H.; Tonon, F. Face stability and required support pressure for TBM driven tunnels with ideal face membrane–Drained case. Tunn. Undergr. Space Technol. 2010, 25, 526–542. [Google Scholar] [CrossRef]
- Watanabe, T.; Yamazaki, H. Giant size slurry shield is a success in Tokyo. Tunn. Tunn. Int. 1981, 13, 13–17. [Google Scholar]
- Min, F.L.; Zhu, W.; Han, X.R.; Zhong, X.C. The effect of clay content on filter-Cake formation in highly permeable gravel. In Proceedings of the GeoShanghai International Conference 2010, Shanghai, China, 3 June 2010; pp. 201–215. [Google Scholar]
- Xiaorui, H.; Zhu, W.; Liu, Q.; Zhong, X.; Min, F. Influence of slurry property on filter-Cake quality on working face of slurry shield. Rock Soil Mech. 2008, 29, 288–292. [Google Scholar] [CrossRef]
- Xu, T.; Bezuijen, A. Bentonite slurry infiltration into sand, filter cake formation under various conditions. Géotechnique 2019, 69, 1–36. [Google Scholar] [CrossRef]
- Jiarui, D.; Min, F.; Yao, Z. Experimental study of property change of slurry and filter cake of slurry shield under seawater intrusion. Tunn. Constr. 2018, 38, 1182–1188. [Google Scholar]
- Kelessidis, V.C.; Tsamantaki, C.; Dalamarinis, P. Effect of pH and electrolyte on the rheology of aqueous Wyoming bentonite dispersions. Appl. Clay Sci. 2007, 38, 86–96. [Google Scholar] [CrossRef]
- Su, G. Study on Stability Analysis and Intelligent Optimization for Large Underground Caverns under High Geostress Condition. Ph.D. Thesis, Chinese Academy of Sciences, Beijing, China, 2006. [Google Scholar]
- Jun, S.; Zhu, H. Mechanical simulation and analysis of behaviour of soft and weak rocks in the construction of a tunnel opening. Rock Soil Mech. 1994, 4, 20–33. [Google Scholar]
- Xiao, M. Three-Dimensional numerical model of construction process for underground opening. Chin. J. Geotech. Eng. 2000, 4, 421–425. [Google Scholar]
- Xiao, H. Study on Stability of Surrounding Rock and Optimization of Bolt Parameters for TBM Assembly Cavern in High Stress. Ph.D. Thesis, Southwest Jiaotong University, Chengdu, China, 2010. [Google Scholar]
- Li, Y.; Emeriault, F.; Kastner, R.; Zhang, Z.X. Stability analysis of large slurry shield-Driven tunnel in soft clay. Tunn. Undergr. Space Technol. 2009, 24, 472–481. [Google Scholar] [CrossRef]


| Stratum | G1 (%) | G2 (%) | G3 (%) | |
|---|---|---|---|---|
| Mass percentage in different particle size ranges | 1.6 mm~2.36 mm | - | - | 35–45 |
| 1.43 mm~1.6 mm | - | - | 15–20 | |
| 1.18 mm~1.43 mm | - | - | 15–25 | |
| 1 mm~1.18 mm | - | - | 10–15 | |
| 0.8 mm~1 mm | - | 15–25 | - | |
| 0.6 mm~0.8 mm | - | 40–50 | - | |
| 0.5 mm~0.6 mm | - | 30–35 | - | |
| 0.4 mm~0.5 mm | 30–35 | - | - | |
| 0.3 mm~0.4 mm | 25–30 | - | - | |
| 0.25 mm~0.3 mm | 25–30 | - | - | |
| <0.25 | 2.5–5 | 2.5–7.5 | 2.5–5 | |
| Permeability coefficient (m/s) | 3.2 × 10⁻⁴ | 3.3 × 10⁻³ | 1.93 × 10⁻² | |
| Stratum | Mud Number | Bentonite Slurry | Clay | Sand | CMC (mL/1000 g) | Density (g/cm3) | Viscosity (Pa·s) | ||
|---|---|---|---|---|---|---|---|---|---|
| Content (%) | Particle Size (mm) | Content (%) | Particle Size (mm) | Content (%) | |||||
| G1 | 1 | 95 | <0.25 | 5 | - | - | 10 | 1.07 | 1.15 × 10⁻² |
| 2 | 97.5 | <0.25 | 2.5 | - | - | - | 1.06 | 1.06 × 10⁻² | |
| 3 | 95 | <0.25 | 5 | - | - | - | 1.07 | 1.12 × 10⁻² | |
| 4 | 97.5 | <0.25 | 2.5 | - | - | 10 | 1.06 | 1.15 × 10⁻² | |
| G2 | 1 | 94.5 | <0.25 | 2.5 | 0.3~0.25 | 3 | 7 | 1.07 | 1.26 × 10⁻² |
| 2 | 91.5 | <0.25 | 2.5 | 0.3~0.25 | 6 | 7 | 1.08 | 1.36 × 10⁻² | |
| 3 | 88.5 | <0.25 | 2.5 | 0.3~0.25 | 9 | 7 | 1.11 | 1.43 × 10⁻² | |
| 4 | 89 | <0.25 | 5 | 0.3~0.25 | 6 | 7 | 1.1 | 1.38 × 10⁻² | |
| 5 | 92.5 | <0.25 | 7.5 | - | - | 7 | 1.09 | 1.23 × 10⁻² | |
| G3 | 1 | 91.5 | <0.25 | 2.5 | 0.4~0.3 | 6 | 30 | 1.1 | 1.57 × 10⁻² |
| 2 | 91.5 | <0.25 | 2.5 | 0.6~0.5 | 6 | 30 | 1.1 | 1.53 × 10⁻² | |
| 3 | 85 | <0.25 | 5 | 0.8~0.6 | 10 | 20 | 1.12 | 1.75 × 10⁻² | |
| Mud Number | 1 | 2 | 3 | 4 | 5 |
|---|---|---|---|---|---|
| Mud invasion distance (length of permeable zone) (cm) | 5.5 | 3.7 | 2.8 | 3.3 | -- |
| Section | Strata Situation | Density (kg/m3) | Elastic Modulus (MPa) | Poisson’s Ratio | Cohesion (MPa) | Internal Friction (°) | K0 (coefficient of Horizontal Earth Pressure) |
|---|---|---|---|---|---|---|---|
| 1 | plain fill | 1870 | 7.68 | 0.46 | 20 | 15 | 0.45 |
| silt | 1620 | 7.68 | 0.35 | 10 | 15 | 0.56 | |
| silty clay | 1960 | 30 | 0.25 | 10 | 4 | 0.54 | |
| residual sandy clay | 1840 | 50 | 0.33 | 22 | 20 | 0.52 | |
| fully weathered granite | 1870 | 80 | 0.3 | 25 | 25 | 0.45 | |
| scattered strongly weathered granite | 1920 | 150 | 0.25 | 30 | 27 | 0.40 | |
| Fragmented strong weathered granite | 2210 | 1300 | 0.2 | 40 | 28 | 0.35 | |
| 2 | silt | 1620 | 7.68 | 0.35 | 10 | 15 | 0.62 |
| fully weathered granite | 1870 | 80 | 0.3 | 25 | 25 | 0.45 | |
| scattered strongly weathered granite | 1920 | 150 | 0.25 | 30 | 27 | 0.42 | |
| moderately weathered granite | 2640 | 2000 | 0.2 | 50 | 30 | 0.35 | |
| 3 | silty sandstone | 1780 | 7.68 | 0.38 | 8 | 12 | 0.45 |
| silt | 1620 | 7.68 | 0.35 | 10 | 15 | 0.60 | |
| silty clay | 1960 | 30 | 0.25 | 30 | 20 | 0.54 | |
| silty clay | 1750 | 7.68 | 0.35 | 12 | 5 | 0.62 | |
| strongly sandstone | 1960 | 140 | 0.25 | 28 | 25 | 0.42 |
| Related Parameters | Length (m) | Thickness (m) | Elastic Modulus (MPa) | Poisson’s Ratio | Density (kg/m3) |
|---|---|---|---|---|---|
| Shield segment | 1.2 | 0.35 | 34.5 × 10³ | 0.17 | 2460 |
© 2020 by the authors. Licensee MDPI, Basel, Switzerland. This article is an open access article distributed under the terms and conditions of the Creative Commons Attribution (CC BY) license (http://creativecommons.org/licenses/by/4.0/).
Share and Cite
Wang, H.; Chen, J.; Liu, H.; Guo, L.; Lu, Y.; Su, X.; Zhu, Y.; Liu, T. Study on the Influence of Mud Properties on the Stability of Excavated Face of Slurry Shield and the Quality of Filter Cake Formation. J. Mar. Sci. Eng. 2020, 8, 291. https://doi.org/10.3390/jmse8040291
Wang H, Chen J, Liu H, Guo L, Lu Y, Su X, Zhu Y, Liu T. Study on the Influence of Mud Properties on the Stability of Excavated Face of Slurry Shield and the Quality of Filter Cake Formation. Journal of Marine Science and Engineering. 2020; 8(4):291. https://doi.org/10.3390/jmse8040291
Chicago/Turabian StyleWang, Hu, Jian Chen, Hongjun Liu, Lei Guo, Yao Lu, Xiuting Su, Yongmao Zhu, and Tao Liu. 2020. "Study on the Influence of Mud Properties on the Stability of Excavated Face of Slurry Shield and the Quality of Filter Cake Formation" Journal of Marine Science and Engineering 8, no. 4: 291. https://doi.org/10.3390/jmse8040291