Experimental and Estimation Studies of Resilient Modulus of Marine Coral Sand under Cyclic Loading


1
Research Center of Coastal and Urban Geotechnical Engineering, Zhejiang University, Hangzhou 310058, China
2
Power China Huadong Engineering Corporation, Hangzhou 310014, China
3
Department of Civil Engineering, Zhejiang University City College, Hangzhou 310015, China
*
Authors to whom correspondence should be addressed.
J. Mar. Sci. Eng. 2020, 8(4), 287; https://doi.org/10.3390/jmse8040287
Submission received: 17 March 2020
/
Revised: 7 April 2020
/
Accepted: 14 April 2020
/
Published: 16 April 2020
Abstract
:Coral sand is an important filler resource that can solve the shortage of terrestrial fillers in coastal areas. Recently, the foundations of many infrastructures in the South China Sea have been built with coral sand as fillers, which have been subjected to wave and traffic cyclic loads. Resilient modulus (Mr) is an important design parameter in marine engineering, but there are few studies on the resilient modulus response of coral sand under cyclic loading. A series of drained cyclic triaxial tests were carried out to investigate the effects of the initial mean effective stress (p0) and cyclic stress ratio (ζ) on the resilient modulus response of the coral sand from the South China Sea. The change of fractal dimension (αc) can reflect the rule of particle breakage evolution. The αc of coral sand shows a tendency of almost maintaining stable and then increasing rapidly with the increase of mean effective stress p0 under each cyclic stress ratio ζ. There is a threshold of p0, when the p0 exceeds this threshold, αc will increase significantly with the increase of p0. The increase of p0 has a beneficial effect on the improvement of the Mr, while the increase of ζ has both beneficial and detrimental effects on the improvement of the Mr. A new prediction model of the Mr considering particle breakage was established, which can better predict the Mr of coral sand in the whole stress interval. The research results can provide guidance for the design of marine transportation infrastructures, which can promote the development of marine transportation industry and energy utilization.
1. Introduction
Coral sand is widely distributed in the equatorial and tropical marine areas, which is the foundation soil type encountered in many marine engineering construction [1,2,3]. Coral sand is formed by the deposition of marine biological debris, and its main component is calcium carbonate. The mechanical properties of coral sand are totally different from that of terrigenous quartz sand [4,5,6,7]. For example, its particles are irregular in shape and easy to break under external load. Recently, many reef island infrastructures for land reclamation in the South China Sea have used coral sand as foundation filling materials. Coral sand has now been used as foundation filling materials in the construction of airport runways, flexible road pavements, building foundations, and other infrastructures. In the complex marine engineering environment, the hydraulic filling coral sand foundation will be subject to tens of thousands of low frequency traffic and wave cyclic loads for a long time. Resilient modulus is an important parameter for the evaluation and design of bearing capacity, settlement deformation, and service performance of foundation soil under cyclic loading [8,9,10]. Therefore, it is of great significance to study the response and prediction model of resilient modulus of coral sand under cyclic loading.
Numerous experimental studies (mainly based on cyclic triaxial tests) have been carried out on resilient behavior of unbound granular materials, which is usually represented by the resilient modulus Mr [10,11,12]. The studies, based on the resilient characteristics of unbound granular materials, focused on the terrigenous materials, such as ballast and quartz sand. Hicks [13] stated that frequency has a negligible effect on the elastic behavior of granular materials. Lackenby et al. [14] emphasized that for railway ballast, Mr increases with the increase of load cycles N, mean effective stress p’, and cyclic deviatoric stress qampl. Indraratna et al. [15] examined the effect of p’ and f on Mr. It was found that Mr increases with the increase of p’ and f, which was due to the increase of packing density. Donohue et al. [16] reported that some coarse-grained soil used as subgrade fillers will undergo particle degradation under cyclic loading. Particle degradation includes particle breakage and fine-grain intrusion mainly caused by particle breakage [17,18]. Particle breakage can lead to adverse effects, such as the reduction in shear strength, interlocking, and stiffness of soil aggregates [19,20]. Different empirical models have been reported for the estimation of resilient modulus Mr of unbound granular materials under cyclic loading [21,22]. However, Chen et al. [21] found that for some coarse-grained soils degraded under cyclic loading, a good fitting curve based on the full stress interval will obviously underestimate the resilient modulus of the low stress interval. This is a challenging problem, which deserves more research to investigate the Mr’s prediction model of coral sand under the whole stress interval. Due to its unique mineral composition and mechanical properties, coral sand will undergo more serious particle degradation (i.e. particle breakage) under cyclic loading than terrigenous materials. Current experimental studies on coral sands focused on the static shear behavior [1,3,6], influencing factors for particle breakage [2], and small strain dynamic characteristics [4,23]. At present, the research on resilient behavior of coral sand under cyclic loading is relatively lacking. There is still no clear understanding of the resilient modulus of coral sand in engineering.
In this paper, a series of drained cyclic triaxial tests were carried out on the coral sand of the South China Sea to investigate the resilient modulus Mr response. The evolution of particle breakage of coral sand was studied by analyzing the variation of fractal dimension αc during cyclic loading. The effects of the initial mean effective stress p0 and cyclic stress ratio ζ on the Mr were examined. The influence of particle breakage on the prediction model of Mr was deeply analyzed. Finally, a new resilient modulus prediction model for coral sand considering particle breakage was established. This study can help deepen the understanding of the resilient behavior of coral sand, which is beneficial to the design and safety assessment of marine transportation infrastructures.
2. Materials and Methods
2.1. Test Materials and Sample Preparation
The coral sand samples were taken from an offshore reef in the South China Sea, which were all unbound particles (as shown in Figure 1a). Figure 1b shows the microparticle shape of coral sand obtained by scanning electron microscopy (SEM). It can be seen from Figure 1b that the grain shape of the coral sand sample is irregular and retains a large amount of the internal pores of the original marine biological debris. Figure 2 shows the particle size distribution curve of the coral sand sample. Table 1 presents the basic physical and mechanical parameters of test sand samples.
The cyclic triaxial sample in this study was a standard cylinder sample with a height of 100 mm and a diameter of 50 mm. Since the prediction model of resilient modulus is mainly used in the design of compact foundations such as road bases, previous studies on the resilient behavior of soils have used dense samples [11]. Due to the strict requirements of relative density Dr of the road bases, wharfs and other marine engineering infrastructures, the foundation of hydraulic filling coral sand is very dense. Therefore, in order to meet the actual engineering characteristics, the relative density Dr of the coral sand samples in this study were selected as 80%. The air pluviation method [23] was applied to prepare cylindrical samples of the coral sand. The method of light hammering was used to obtain the designed relative density of sand samples. The samples were remolded for Dr < 80%, depending on the initial consolidation stress, to acquire the target Dr (i.e., 80%) after consolidation. After the preparation of the sample, carbon dioxide (CO2) was used to pass through the sample, and then the sample was saturated with 200 kPa back pressure under the effective confining pressure of 20 kPa. After checking that the B-value of the sample exceeded 0.95, the saturation process of the sample ended. Through K0 (static earth pressure coefficient) consolidation module of triaxial apparatus [24,25], the K0-value of coral sand sample was set at 0.4. After the sample was saturated, the sample was consolidated under anisotropic condition. During consolidation, the σ3/σ1-value (σ1 and σ3 are the major and minor principal stress, respectively) was fixed to the K0-value to simulate K0 consolidation.
2.2. Test Methods
The cyclic triaxial apparatus [26] developed by GDS company (GDS Instruments Ltd., UK) was used in this study, which includes a loading system, a back pressure volume controller, a confining pressure volume controller, a pore pressure sensor, displacement and force sensors (as shown in Figure 3). The pressure chamber base is connected with various sensors and pressure volume controllers, including back pressure, confining pressure, pore pressure, etc. The axial force is measured at a load cell being located directly below the bottom end plate of the sample, i.e., inside the cell chamber. The axial deformation is obtained from a displacement transducer attached to the load piston (not shown in Figure 3).
Chen et al. suggested using 1 Hz as the frequency of the resilient response tests for granular soils [21]. With reference to previous studies, the effect of frequency f on the resilient behavior of coarse-grained soil can be ignored [14]. In order to ensure the stability of data collection, the frequency f of cyclic loading was selected as 0.5 Hz in this study. In order to study the long-term resilient response of coral sand, the number of cycles N was selected to be 20,000. Referring to the experimental studies of coarse-grained soil under traffic cyclic loading by other scholars, the cyclic loading type of this study used half-sine loading [27,28,29]. Drained cyclic triaxial tests were performed on coral sand samples at p0 = 40, 70, 100, 200, 300, 400 kPa. The selection range of the cyclic stress ratio ζ referred to the range of actual loads reported in previous studies [30], and followed the rule that the cyclic stress ratio decreases as the foundation depth deepens. Table 2 summarizes the drained cyclic triaxial test scheme of this study.
The strain of sample under cyclic loading includes resilient strain (ε1ampl) and accumulated axial strain (ε1acc). The typical hysteresis loop of the sample under cyclic loading is shown in Figure 4. The area of each hysteresis loop represents the energy dissipation per cycle, which characterizes the plastic work in a cycle, reflecting the resistance to deformation in profile. Resilient modulus (Mr) is an important parameter for the infrastructure of offshore islands and reefs, which is computed (Figure 4) by:
where qampl is the amplitude of cyclic deviatoric stress. The definition of cyclic stress ratio ζ is the ratio of cyclic deviatoric stress to initial mean effective stress. The definition of initial static stress ratio ηc is the ratio of initial static deviatoric stress to initial mean effective stress.
3. Results
3.1. Particle Breakage under Cyclic Loading
According to the fractal theory and Hardin’s definition of relative particle breakage [31], Einav [32] proposed the relative particle breakage index to characterize the degree of particle breakage of coarse-grained soil. In the process of shearing, the gradation of coral sand changes to ultimate fractal gradation under high pressure. The ultimate gradation (as the basic property of the material) is independent of relative density and confining pressure, indicating that the particles will hardly break in the ultimate state. From this point of view, the index proposed by Einav [32] was used as a measure of particle breakage for coral sand:
where Br is relative breakage index; Bp is total breakage potential; Bt is current total breakage potential. The ultimate gradation was obtained from the triaxial compression test under the maximum mean effective stress of 3 MPa (as shown in Figure 5). The total breakage potential Bp (as shown in Figure 5) can be acquired by integrating the area over the logarithmic scale:
where dm is minimum diameter and dM is maximum diameter. The total breakage Bt (as shown in Figure 5) can be calculated as:
The formulations F0(d), Fc(d), and Fu(d) (representing the initial gradation (IG), the current gradation (CG) and the ultimate gradation (UG) for coral sand, respectively, as shown in Figure 5) can be calculated as:
where α0, αc, and αu are fractal dimensions of IG, CG, and UG, respectively; d is diameter.
Substitution of Equations (3)–(7) into Equation (2) gives:
The initial fractal dimension and ultimate fractal dimension are supposed to 1.44 and 2.46, respectively, which were obtained by fitting the IG and UG (as shown in Figure 5).
The fractal dimension αc can be obtained by fitting current gradation using Equation (6). Figure 6 shows the fractal dimension αc of coral sand at various initial mean effective stresses p0. The larger the fractal dimension is, the more serious the particle breakage of coral sand is, and the more the particle gradation tends to the final fractal gradation. Under each p0, in the range of lower cyclic stress ratio ζ, the αc increases significantly with the increase of ζ; in the range of higher ζ, the rate of αc increasing with ζ slows down. Under each ζ, the αc of coral sand presents a consistent trend with the increase of the initial mean effective stress p0. The αc of coral sand shows a tendency of almost maintaining stable and then increasing rapidly with the increase of mean effective stress p0. There is a threshold of p0 (about 100 kPa), when the p0 exceeds this threshold, αc will increase significantly with the increase of p0. This indicates that p0 has a restrictive effect on the particle breakage of coral sand. When p0 is small, the αc (i.e., particle breakage) cannot grow fast. In actual engineering, it should be noted that when p0 is greater than the threshold value, the significant and rapid increase of particle breakage will bring adverse effects on the service safety of the project. As can be seen in Figure 6, under each ζ, the αc can be expressed as a function with p0 as a variable:
where αp0, kα, and βα are material parameters. The physical meaning of αp0 represents the fractal dimension of the starting particle breakage that can occur when the p0 is relatively small at each ζ. The optimal regression value of kα and βα are 0.00575 and 147.955, respectively. The optimal regression values of αp0 at ζ = 0.2, 0.4, 0.6, 1.0, 1.4, 1.8, and 2.2 are 1.452, 1.522, 1.577, 1.619, 1.634, 1.648, and 1.661, respectively.
Figure 7 shows the relationship between parameter αp0 and cyclic stress ratio ζ. The relationship between αp0 and ζ can be expressed as:
where χα and μα are material parameters. The optimal regression value of χα and ζμα are 1.603 and 0.0550, respectively. Substitution of Equation (10) into Equation (9) gives:
Substitution of Equation (11) into Equation (8) gives:
At the end of the drained cyclic triaxial test, the calcareous sand sample was recovered carefully and the particle size distribution curve of the sample after cyclic loading was measured by the sieving test. Based on the observed particle size distribution curve after loading, the observed Br of calcareous sand was then calculated by Equation (2). Figure 8 represents the relationship between Br predicted by Equation (12) and observed Br. It can be seen from Figure 8 that the points of predicted Br and observed Br are basically in a straight line with the slope of 1, indicating that Equation (12) can well predict the Br of coral sand under cyclic loading. Substitution of Equation (10) into Equation (8) gives:
where Brp0 is the starting relative particle breakage index that can occur when p0 is relatively small at each ζ, which represents the ability of coral sand to resist particle breakage under different ζ.
3.2. Resilient Behavior under Cyclic Loading
Sun et al. [11] and Indraratna et al. [15] emphasized that understanding the resilient behavior of soil can be helpful to judge and avoid some factors that cause engineering accidents. Resilient modulus is an important design parameter for the safety evaluation of the infrastructures of ocean engineering. Therefore, a comprehensive understanding of the resilient modulus of coral sand is of great practical significance to the construction of reef island traffic infrastructures and the utilization of energy.
Figure 9 reflects the general evolution trend of the hysteresis loop of coral sand during cyclic loading. The cyclic stress ratio has a significant effect on the dynamic stress-strain relationship of calcareous sand. According to the changing trend of the shape and area of the hysteresis loop with the number of cycles N, the development law of the hysteresis loop under different cyclic stress ratios can be divided into two types. When the cyclic stress ratio ζ is small (ζ = 0.2), the hysteresis loop is closed at the beginning, and the area of hysteresis loop increases slightly with the increase of the number of cycles N. At the initial stage of cyclic loading, when the ζ is large (ζ = 0.4, 0.6 and 1.0), the opening of hysteresis loop is large and its shape is relatively irregular. With the development of cyclic loading, the opening of hysteretic loop tends to close, which is a long ellipse with two pointed ends. As the number of cycles increases, the dynamic strain accumulates, and the hysteresis loop becomes narrow. The area of the hysteresis loop decreases first and then increases slightly with the increase of N. Under the process of cyclic loading, the shape of coral sand’s hysteresis loop changes rapidly at first, and then tends to be stable gradually. Roughly, in the early stage of cyclic loading, the hysteresis loop of coral sand first rotates anticlockwise, then slightly rotates clockwise in the later stage and finally tends to be stable. This illustrates that the resilient modulus Mr of coral sand under cyclic loading first increases with the number of cycles N, and then due to the continuous accumulation of particle breakage, the Mr will decrease to some extent in the later stage as N increases. Under the long-term cyclic loading, the Mr will finally tends to a stable value, which is consistent with the results of Sun et al. [11].
Figure 10a shows the variation of stable resilient modulus Mrs with p0. With the increase of p0, Mrs basically increases uniformly. This indicates that the increase of p0 is beneficial for the improvement of Mrs. This conclusion is consistent with the findings of Sun et al. [11] and Lackenby et al. [14]. Figure 10b shows the variation of stable resilient modulus with ζ. Contrary to the conclusion that Mr increases uniformly with the increase of ζ obtained by the experimental results on terrigenous granular materials [14], the Mrs of coral sand only shows a slight growth trend as a whole. That is to say, as the ζ increases, the Mrs does not increase uniformly but fluctuates. This indicates that the increase of ζ has both beneficial and detrimental effects on the improvement of the Mrs. This phenomenon may be caused by the complexity and variability due to the particle breakage of coral sand material. It can be seen from Figure 6 that the particle breakage degree of coral sand increases with the increase of ζ and the particle breakage has an adverse effect on the stiffness; therefore, the cyclic stress ratio has a complex effect on the resilient modulus response of coral sand. This should be paid attention to in practical engineering.
4. Discussion
The reasonable prediction of Mrs is of great significance to the actual engineering design and safety evaluation [10,33,34]. Therefore, Witczak and Uzan [35] established the empirical models for predicting the stable resilient modulus of terrigenous granular soil under cyclic loading. A famous two-parameter model proposed by Witczak and Uzan [33] only considered the cyclic deviatoric stress, not the initial mean effective stress p0. Therefore, by introducing the initial mean effective stress into the model, the predicted resilient modulus Mrps can be calculated as:
where pa = 100 kPa (i.e., standard atmospheric pressure); k1 and k2 are material parameters. The optimal regression value of k1, k2, k3, and k4 are 40.766, −0.297, −1553.306, and 0.282, respectively.
Figure 11 shows a comparison of the predicted surface of Mrps calculated from Equation (14) with the observed Mrs. As can be seen from Figure 11, the predicted Mrps deviates greatly from the observed Mrs. In the low stress range, the predicted Mrps is always greater than the observed Mrs, which has also been reported by many scholars when they study the granular soil with easily broken particles [21,36]. It can also be seen from Figure 11 that in the high stress range, the predicted Mrps is always less than the observed Mrs. The previous model for conventional terrestrial granular material cannot predict the Mrs of coral sand with easily broken particles in whole stress interval. Figure 12 shows the relationship between the ratio of predicted resilient modulus Mrps by Equation (14) and observed Mrs with the particle breakage level Brp0/pa. It can be obtained from Figure 12 that the particle breakage has a significant effect on the resilient modulus prediction model of coral sand. The Mrps/Mrs decreases with the increase of the Brp0/pa, which indicates that the deviation between the predicted resilient modulus and the observed resilient modulus is partly caused by the difference of particle breakage level in various stress range. Coral sand has smaller particle breakage in the low stress range and larger particle breakage in the high stress range. The difference between particle breakage in the high and low stress ranges causes the predicted resilient modulus to regularly deviate from the observed resilient modulus. The starting relative particle breakage index Brp0 was introduced into the formula, and the prediction model of Mrps considering the effect of particle breakage can be expressed as:
where pa = 100 kPa (i.e., standard atmospheric pressure); Brp0 can be calculated by Equation (13); k1, k2, k3, and k4 are material parameters. The optimal regression value of k1, k2, k3, and k4 are 40.766, −0.297, −1553.306, and 0.282, respectively.
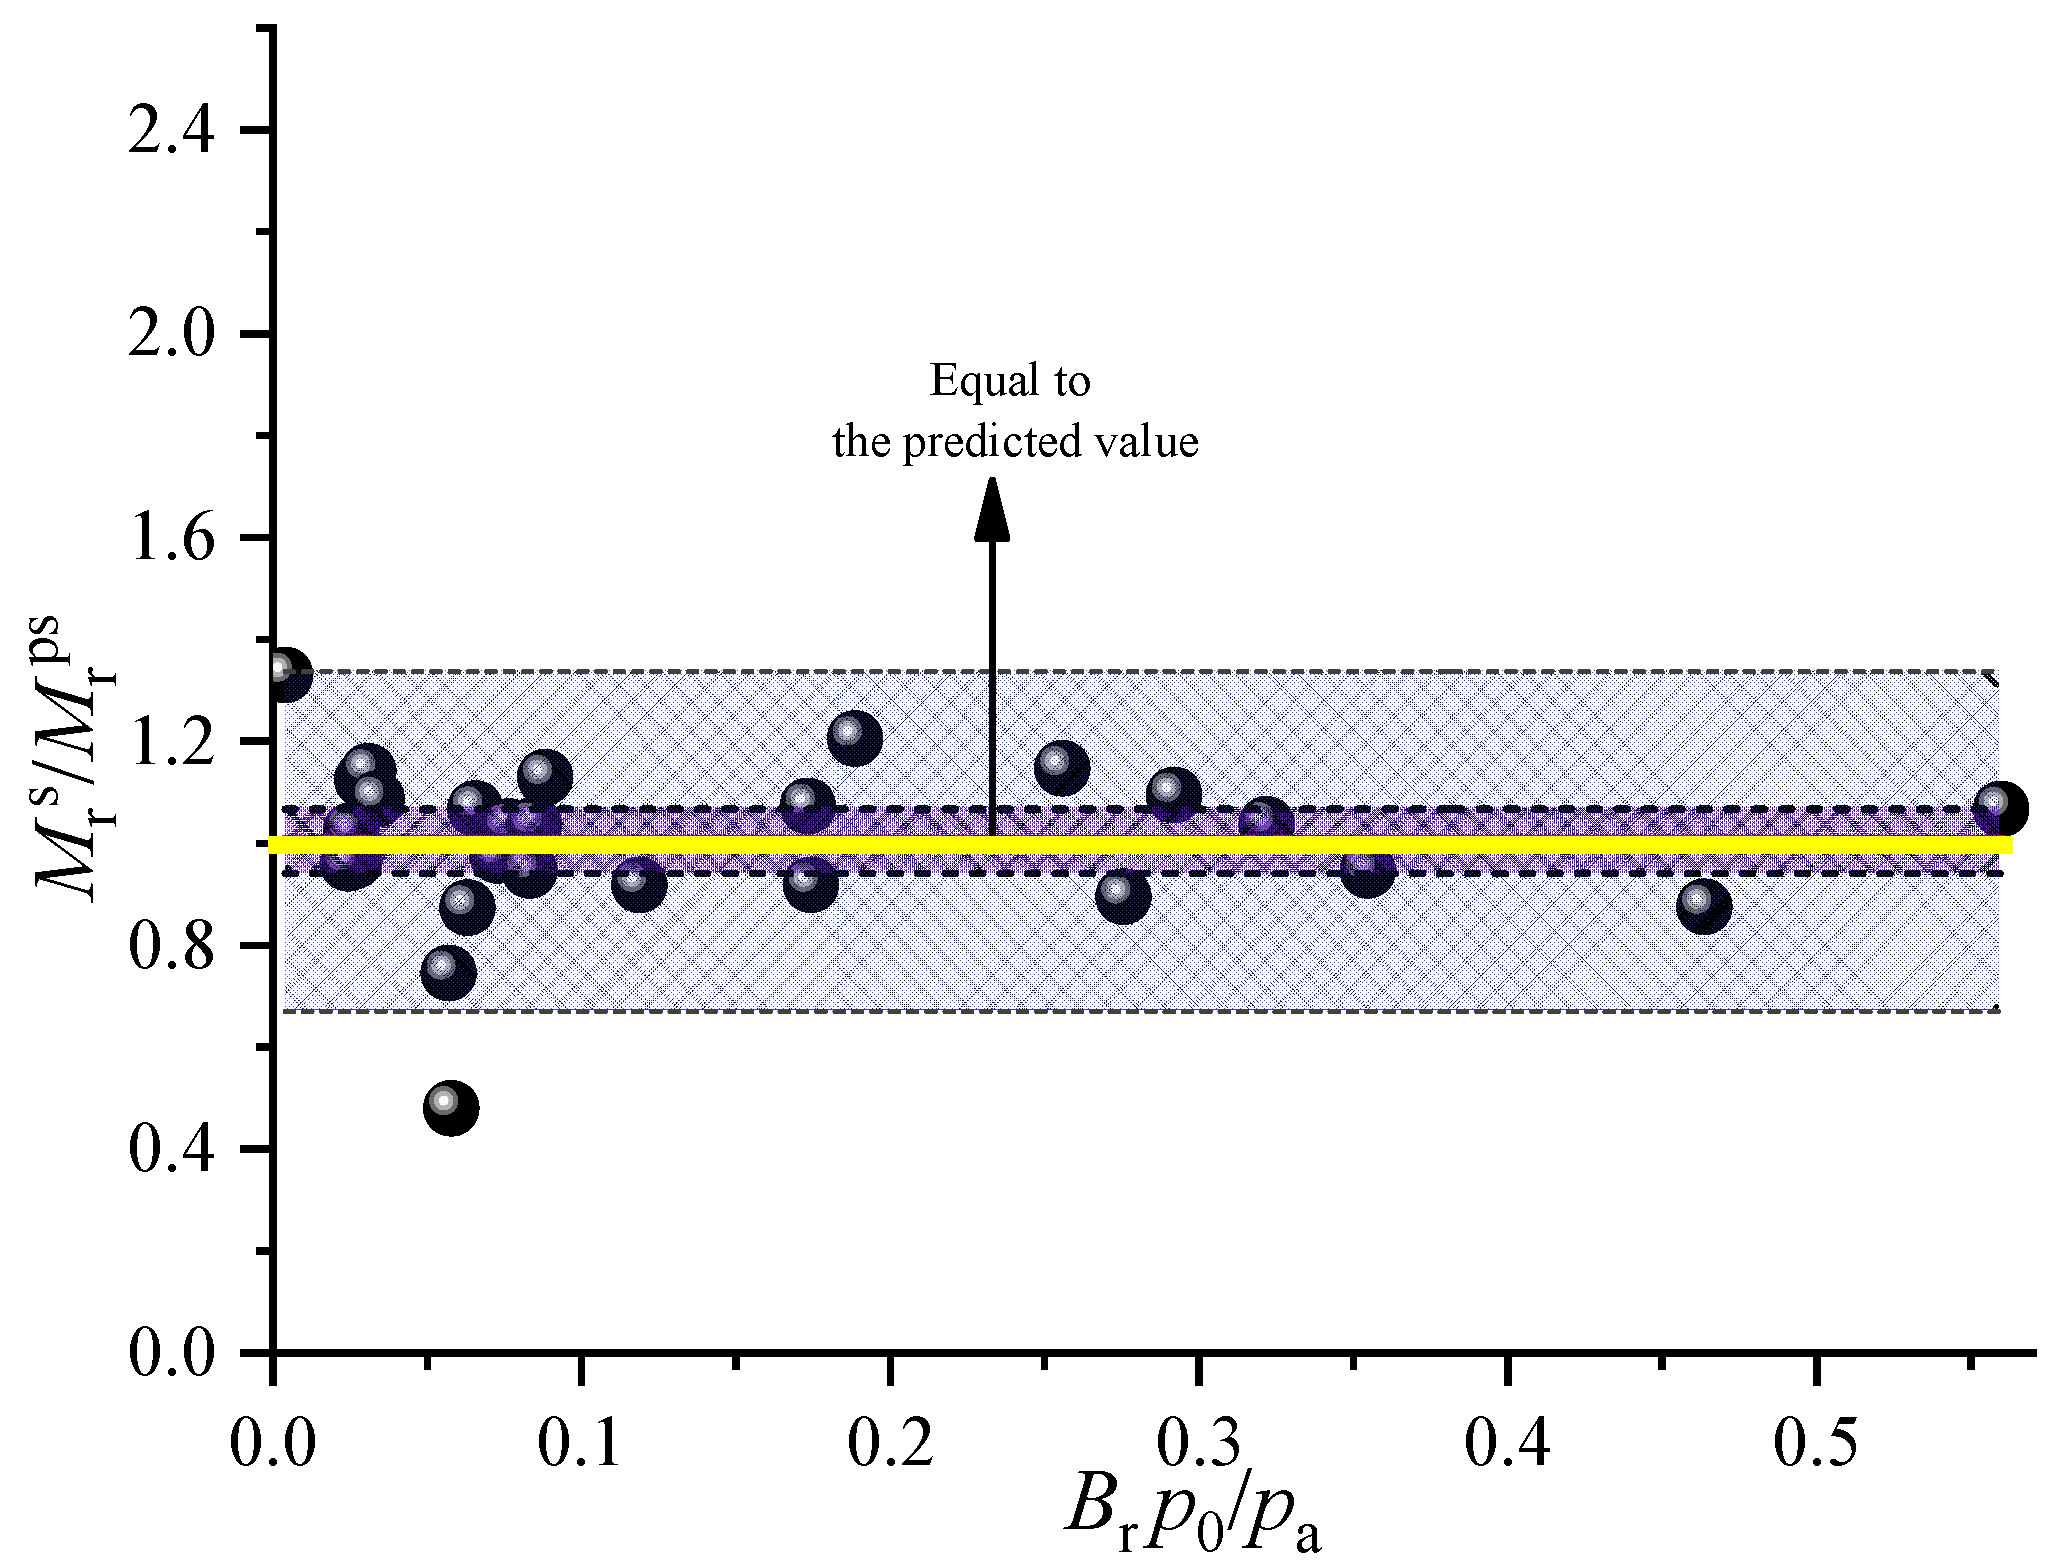
Figure 13 shows a comparison of the predicted surface of Mrps calculated from Equation (15) with the observed Mrs. It can be seen from Figure 13 that the prediction model of the Mrs considering particle breakage can make the predicted Mrps closer to the observed Mrs. Figure 14 shows the relationship between the ratio of predicted resilient modulus Mrps by Equation (15) and observed Mrs with the particle breakage level Brp0/pa. It can be seen from Figure 14 that the Mrps/ Mrs is basically 1 and has no obvious relationship with the particle breakage level Brp0/pa, which indicates that the prediction model of Mrs considering particle breakage can better predict the resilient modulus response of coral sand. Therefore, unlike terrestrial granular materials, it is necessary to consider the impact of particle breakage when establishing a resilient modulus prediction model for coral sand. Considering particle breakage can help more accurately predict the resilient modulus of coral sand. In order to evaluate the resilient response of actual engineering more comprehensively and accurately, the effect of different particle sizes and relative densities on the prediction model of resilient modulus will be focused on in the future research. Moreover, the proposed formula will be verified in other types of soils.
5. Conclusions
A series of drained cyclic triaxial tests were carried out on the coral sand of the South China Sea to investigate the resilient modulus Mr response and a new prediction model of Mr was proposed. The effects of the initial mean effective stress p0 and cyclic stress ratio ζ on the Mr were examined. The main conclusions are the following:
- (1)
- The change of fractal dimension αc can reflect the rule of particle breakage evolution. The αc of coral sand shows a tendency of almost maintaining stable and then increasing rapidly with the increase of mean effective stress p0 under each cyclic stress ratio ζ. There is a threshold of p0, when the p0 exceed s this threshold, αc will increase significantly with the increase of p0. The actual project needs to pay attention to the adverse effect of the rapid increase of particle breakage on the engineering safety when p0 is greater than the threshold.
- (2)
- The resilient modulus Mr of coral sand under cyclic loading first increases with the number of cycles N, and then due to the continuous accumulation of particle breakage, the Mr will decrease to some extent in the later stage as N increases. Under the long-term cyclic loading, the Mr will finally tend to a stable value. The increase of p0 has a beneficial effect on the improvement of the Mr, and the increase of p0 will lead to the increase of Mr uniformly. The increase of ζ has both beneficial and detrimental effects on the improvement of the Mr, and the increase of ζ will cause the increase or decrease of Mr. The effect of ζ on the resilient modulus of coral sand is different from that of terrestrial granular materials, which is caused by the special material properties of coral sand.
- (3)
- A new empirical prediction model of the Mr considering particle breakage was established, which can better predict the Mr of coral sand in the whole stress interval. Particle breakage has a significant effect on the prediction model of the Mr. It was found that if the particle breakage was not considered as an influencing factor in the empirical model, the predicted value of the Mr would deviate greatly from the measured value. Therefore, it is necessary to consider the effect of particle breakage when establishing a resilient modulus prediction model for the coral sand.
Author Contributions
Conceptualization, S.-H.H.; methodology, Z.D.; software, X.-L.G.; validation, T.-D.X. and Q.-F.Z.; formal analysis, S.-H.H.; investigation, Q.-F.Z.; resources, Z.D.; data curation, T.-D.X.; writing—original draft preparation, S.-H.H.; writing—review and editing, Z.D.; visualization, Q.-F.Z.; supervision, T.-D.X.; project administration, X.-L.G.; funding acquisition, Z.D. All authors have read and agreed to the published version of the manuscript.
Funding
This work was supported by the Chinese National Natural Science Foundation (Grant No. 51508506), Joint Fund of Zhejiang Provincial Natural Science Foundation (Grant No. LHZ20E080001) and Hangzhou Science Technology Plan Project (Grant No. 20172016A06, 20180533B06, 20180533B12, 20191203B44); Advanced Postdoctoral Fund of Zhejiang Province (Grant No. 2019).
Acknowledgments
The authors are grateful for the comments of Bing-Qi Yu who have helped to significantly improve the article. Further, the authors appreciate the detailed checks and questions from the reviewers, which provide great help for the improvement of this article.
Conflicts of Interest
The authors declare no conflicts of interest.
References
- Wang, X.; Jiao, Y.; Wang, R.; Hu, M.; Meng, Q.; Tian, F. Engineering characteristics of the calcareous sand in Nansha Islands, South China Sea. Eng. Geol. 2011, 120, 40–47. [Google Scholar] [CrossRef]
- Shahnazari, H.; Rezvani, R. Effective parameters for the particle breakage of calcareous sands: An experimental study. Eng. Geol. 2013, 159, 98–105. [Google Scholar] [CrossRef]
- Wang, X.Z.; Wang, X.; Jin, Z.; Zhu, C.; Wang, R.; Meng, Q. Investigation of engineering characteristics of calcareous soils from fringing reef. Ocean Eng. 2017, 134, 77–86. [Google Scholar] [CrossRef]
- Jafarian, Y.; Javdanian, H.; Haddad, A. Strain-dependent dynamic properties of Bushehr siliceous-carbonate sand: Experimental and comparative study. Soil Dyn. Earthq. Eng. 2018, 107, 339–349. [Google Scholar] [CrossRef]
- Yang, S.; Liu, W. Research on Unconstrained Compressive Strength and Microstructure of Calcareous Sand with Curing Agent. J. Mar. Sci. Eng. 2019, 7, 294. [Google Scholar] [CrossRef] [Green Version]
- Wu, Q.; Ding, X.; Zhang, Y.; Chen, Z. Comparative Study on Seismic Response of Pile Group Foundation in Coral Sand and Fujian Sand. J. Mar. Sci. Eng. 2020, 8, 189. [Google Scholar] [CrossRef] [Green Version]
- Shahnazari, H.; Rezvani, R.; Tutunchian, M.A. Post-cyclic volumetric strain of calcareous sand using hollow cylindrical torsional shear tests. Soil Dyn. Earthq. Eng. 2019, 124, 162–171. [Google Scholar] [CrossRef]
- Patel, D.V.; Kumar, R.; Chauhan, K.A.; Patel, S. Experimental and Modeling Studies of Resilient Modulus and Permanent Strain of Stabilized Fly Ash. J. Mater. Civil Eng. 2019, 31, 06019005. [Google Scholar] [CrossRef]
- Chen, W.; Jeng, D.; Chen, W.; Chen, G.; Zhao, H. Seismic-induced dynamic responses in a poro-elastic seabed: Solutions of different formulations. Soil Dyn. Earthq. Eng. 2020, 131, 106021. [Google Scholar] [CrossRef]
- Han, Z.; Vanapalli, S.K. Relationship between resilient modulus and suction for compacted subgrade soils. Eng. Geol. 2016, 211, 85–97. [Google Scholar] [CrossRef]
- Sun, Q.; Indraratna, B.; Nimbalkar, S. Deformation and degradation mechanisms of railway ballast under high frequency cyclic loading. J. Geotech. Geoenviron. 2016, 142, 04015056. [Google Scholar] [CrossRef]
- Miao, Y.; Huang, Y.; Zhang, Q.; Wang, L. Effect of temperature on resilient modulus and shear strength of unbound granular materials containing fine RAP. Constr. Build. Mater. 2016, 124, 1132–1141. [Google Scholar] [CrossRef]
- Hicks, R.G. Factors Influencing the Resilient Properties of Granular Materials. Ph.D. Thesis, Univ.of California, Berkeley, Berkeley, CA, USA, 1970. [Google Scholar]
- Lackenby, J.; Indraratna, B.; McDowell, G.; Christie, D. Effect of confining pressure on ballast degradation and deformation under cyclic triaxial loading. Geotechnique 2007, 57, 527–536. [Google Scholar] [CrossRef] [Green Version]
- Indraratna, B.; Biabani, M.M.; Nimbalkar, S. Behavior of geocell-reinforced subballast subjected to cyclic loading in plane-strain condition. J. Geotech. Geoenviron. 2015, 141, 04014081. [Google Scholar] [CrossRef]
- Donohue, S.; Osullivan, C.; Long, M. Particle breakage during cyclic triaxial loading of a carbonate sand. Geotechnique 2009, 59, 477–482. [Google Scholar] [CrossRef]
- Indraratna, B.; Lackenby, J.; Christie, D. Effect of confining pressure on the degradation of ballast under cyclic loading. Geotechnique 2005, 55, 325–328. [Google Scholar] [CrossRef]
- Indraratna, B.; Tennakoon, N.; Nimbalkar, S.; Rujikiatkamjorn, C. Behavior of clay fouled ballast under drained triaxial testing. Geotechnique 2013, 63, 410–419. [Google Scholar] [CrossRef] [Green Version]
- Cao, Z.; Chen, J.; Cai, Y.; Gu, C.; Wang, J. Effects of moisture content on the cyclic behavior of crushed tuff aggregates by large-scale tri-axial test. Soil Dyn. Earthq. Eng. 2017, 95, 1–8. [Google Scholar] [CrossRef]
- Cao, Z.; Chen, J.; Cai, Y.; Zhao, L.; Gu, C.; Wang, J. Long-term behavior of clay-fouled unbound granular materials subjected to cyclic loadings with different frequencies. Eng. Geol. 2018, 243, 118–127. [Google Scholar] [CrossRef]
- Chen, W.; Yin, J.; Feng, W.; Borana, L.; Chen, R. Accumulated permanent axial strain of a subgrade fill under cyclic high-speed railway loading. Int. J. Geomech. 2018, 18, 04018018. [Google Scholar] [CrossRef]
- Uzan, J. Characterization of granular material. Transp. Res. Rec. 1985, 1022, 52–59. [Google Scholar]
- Jafarian, Y.; Javdanian, H. Small-strain dynamic properties of siliceous-carbonate sand under stress anisotropy. Soil Dyn. Earthq. Eng. 2020, 131, 106045. [Google Scholar] [CrossRef]
- Zheng, Q.; Xia, T.; Ding, Z.; He, S. The effect of periodic intermittency on the cyclic behavior of marine sedimentary clay. Mar. Georesour. Geotechnol. 2018, 15, 1–16. [Google Scholar] [CrossRef]
- Cai, Y.; Hao, B.; Gu, C.; Wang, J.; Pan, L. Effect of anisotropic consolidation stress paths on the undrained shear behavior of reconstituted Wenzhou clay. Eng. Geol. 2018, 242, 23–33. [Google Scholar] [CrossRef]
- Zhi, D.; Kong, B.; Wei, X.; Zhang, M.; Xu, B.; Zhao, F. Laboratory testing to research the micro-structure and dynamic characteristics of frozen-thawed marine soft soil. J. Mater. Civil Eng. 2019, 7, 85. [Google Scholar] [CrossRef] [Green Version]
- Lin, B.; Zhang, F.; Feng, D.; Tang, K.; Feng, X. Accumulative plastic strain of thawed saturated clay under long-term cyclic loading. Eng. Geol. 2017, 231, 230–237. [Google Scholar] [CrossRef]
- Wang, J.; Guo, L.; Cai, Y.; Xu, C.; Gu, C. Strain and pore pressure development on soft marine clay in triaxial tests with a large number of cycles. Ocean Eng. 2013, 74, 125–132. [Google Scholar] [CrossRef]
- Ren, X.; Xu, Q.; Xu, C.; Teng, J.; Lv, S. Undrained pore pressure behavior of soft marine clay under long-term low cyclic loads. Ocean Eng. 2018, 150, 60–68. [Google Scholar] [CrossRef]
- Guo, L.; Cai, Y.; Jardine, R.J.; Yang, Z.X.; Wang, J. Undrained behaviour of intact soft clay under cyclic paths that match vehicle loading conditions. Can. Geotech. J. 2018, 55, 90–106. [Google Scholar] [CrossRef] [Green Version]
- Hardin, B.O. Crushing of Soil Particles. J. Geotech. Geoenviron. 1985, 111, 1177–1192. [Google Scholar] [CrossRef]
- Einav, I. Breakage mechanics—Part I: Theory. J. Mech. Phys. Solids. 2007, 55, 1274–1297. [Google Scholar] [CrossRef]
- Malla, R.B.; Joshi, S. Subgrade resilient modulus prediction models for coarse and fine-grained soils based on long-term pavement performance data. Int. J. Pavement Eng. 2008, 9, 431–444. [Google Scholar] [CrossRef]
- Nazzal, M.D.; Mohammad, L.N. Estimation of Resilient Modulus of Subgrade Soils for Design of Pavement Structures. J. Mater. Civil Eng. 2010, 22, 726–734. [Google Scholar] [CrossRef]
- Witczak, M.W.; Uzan, J. The Universal Airport Pavement Design System: Report of IV: Granular Material Characterization; College of Engineering, University of Maryland: College Park, MD, USA, 1988. [Google Scholar]
- Yau, A.; Von Quintus, H. Study of Laboratory Resilient Modulus Test Data and Response Characteristics. Final Rep. FHWA-RD-02-051; Federal Highway Administration, U.S. Dept. of Transportation: Washington, DC, USA, 2002.
Figure 1.
Typical sample of the coral sand: (a) coral sand sample; (b) microparticle shape of coral sand.
Figure 1.
Typical sample of the coral sand: (a) coral sand sample; (b) microparticle shape of coral sand.

Figure 2.
Particle size distribution curve of coral sand samples.
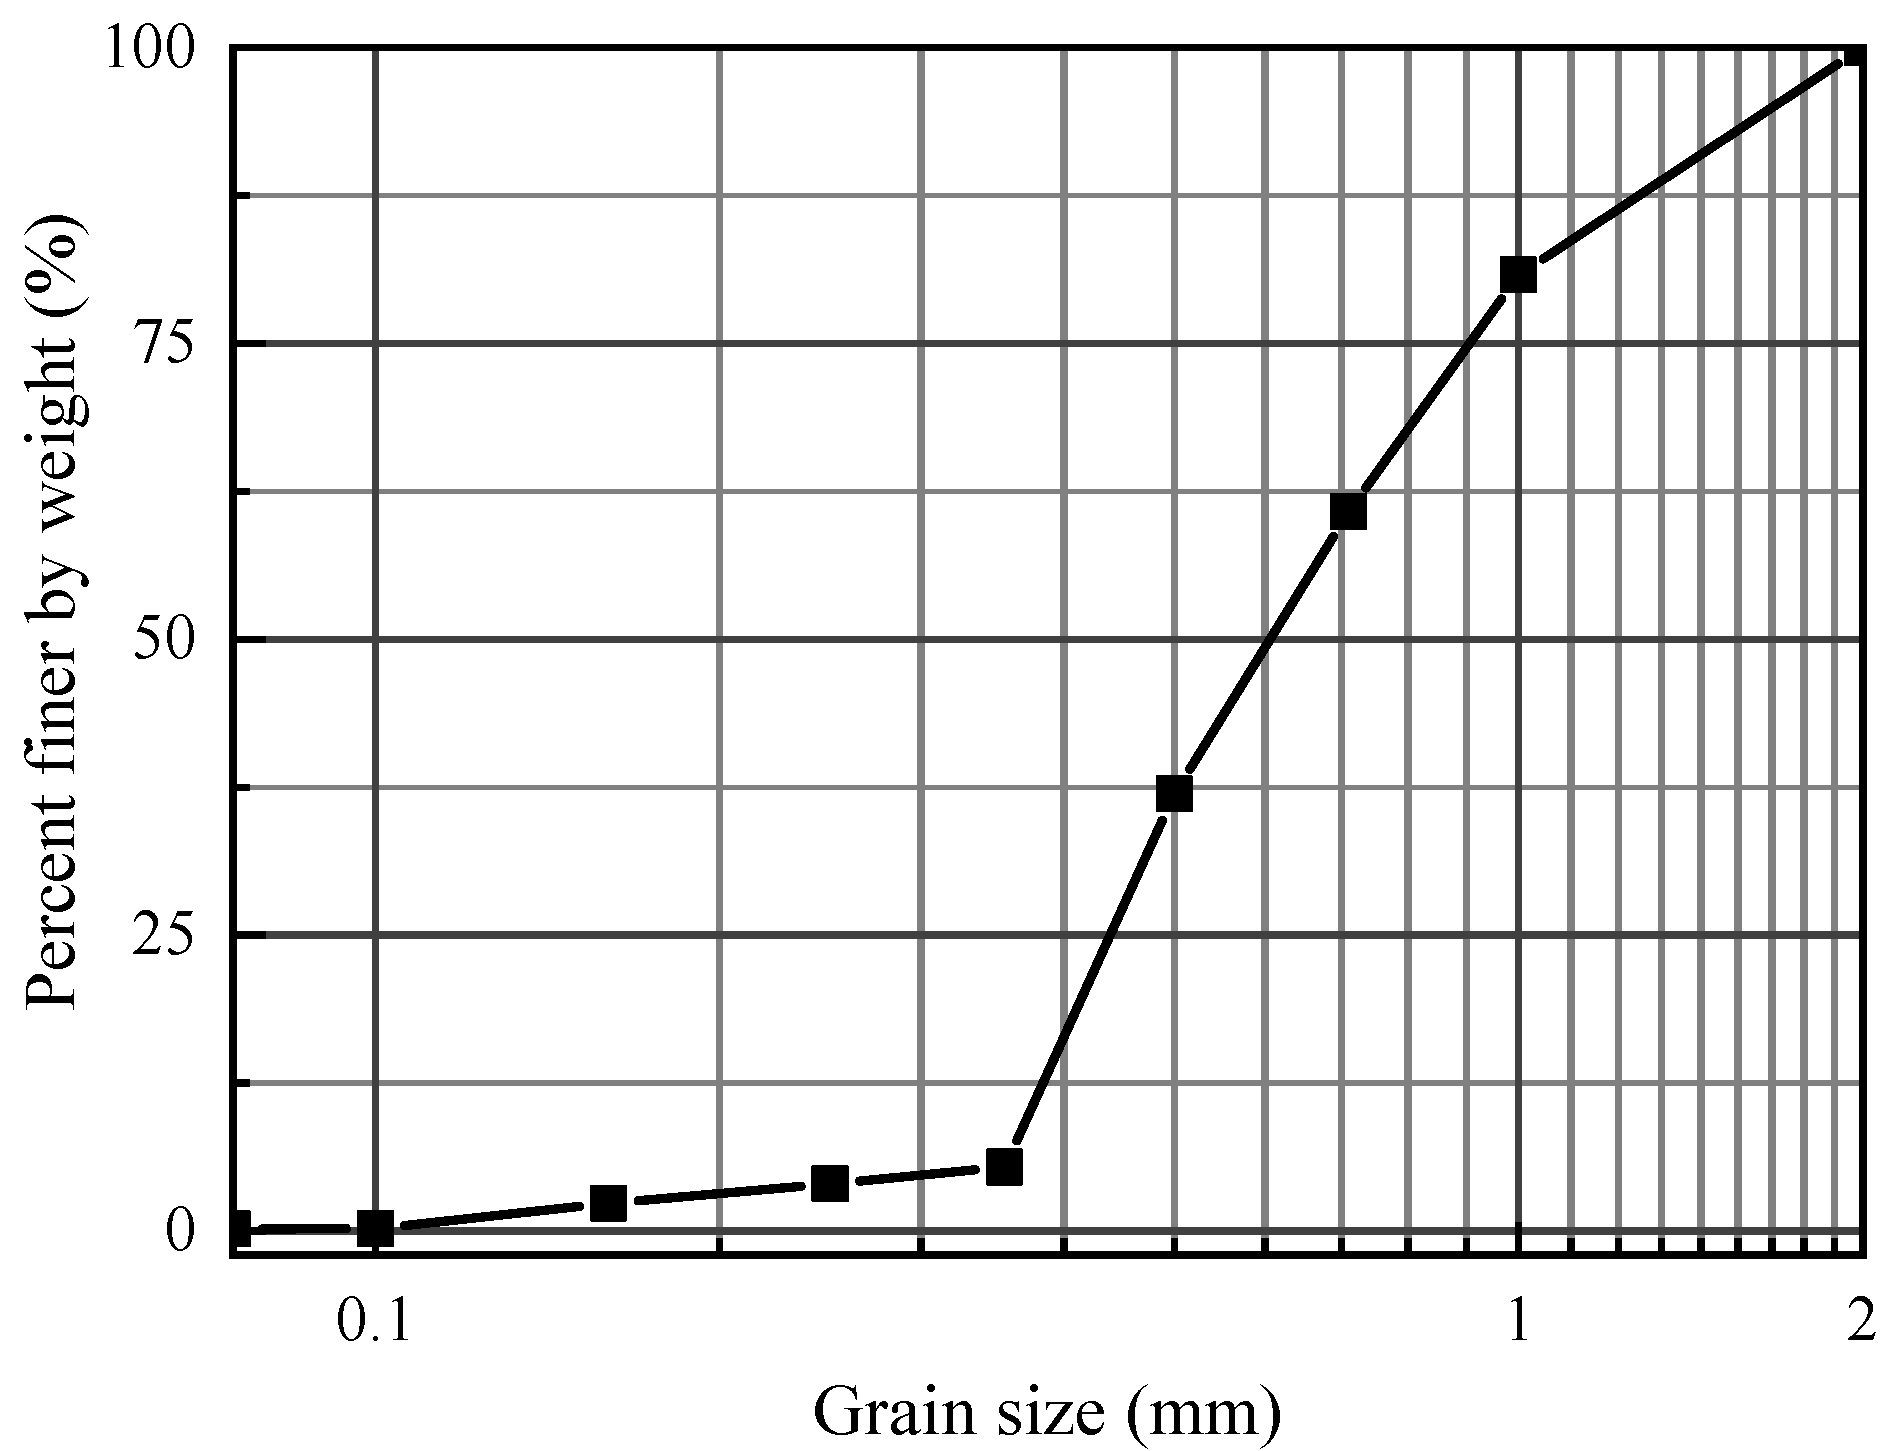
Figure 3.
Cyclic triaxial apparatus used in this study: (a) schematic diagram of cyclic triaxial apparatus system; (b) cyclic triaxial apparatus.
Figure 3.
Cyclic triaxial apparatus used in this study: (a) schematic diagram of cyclic triaxial apparatus system; (b) cyclic triaxial apparatus.
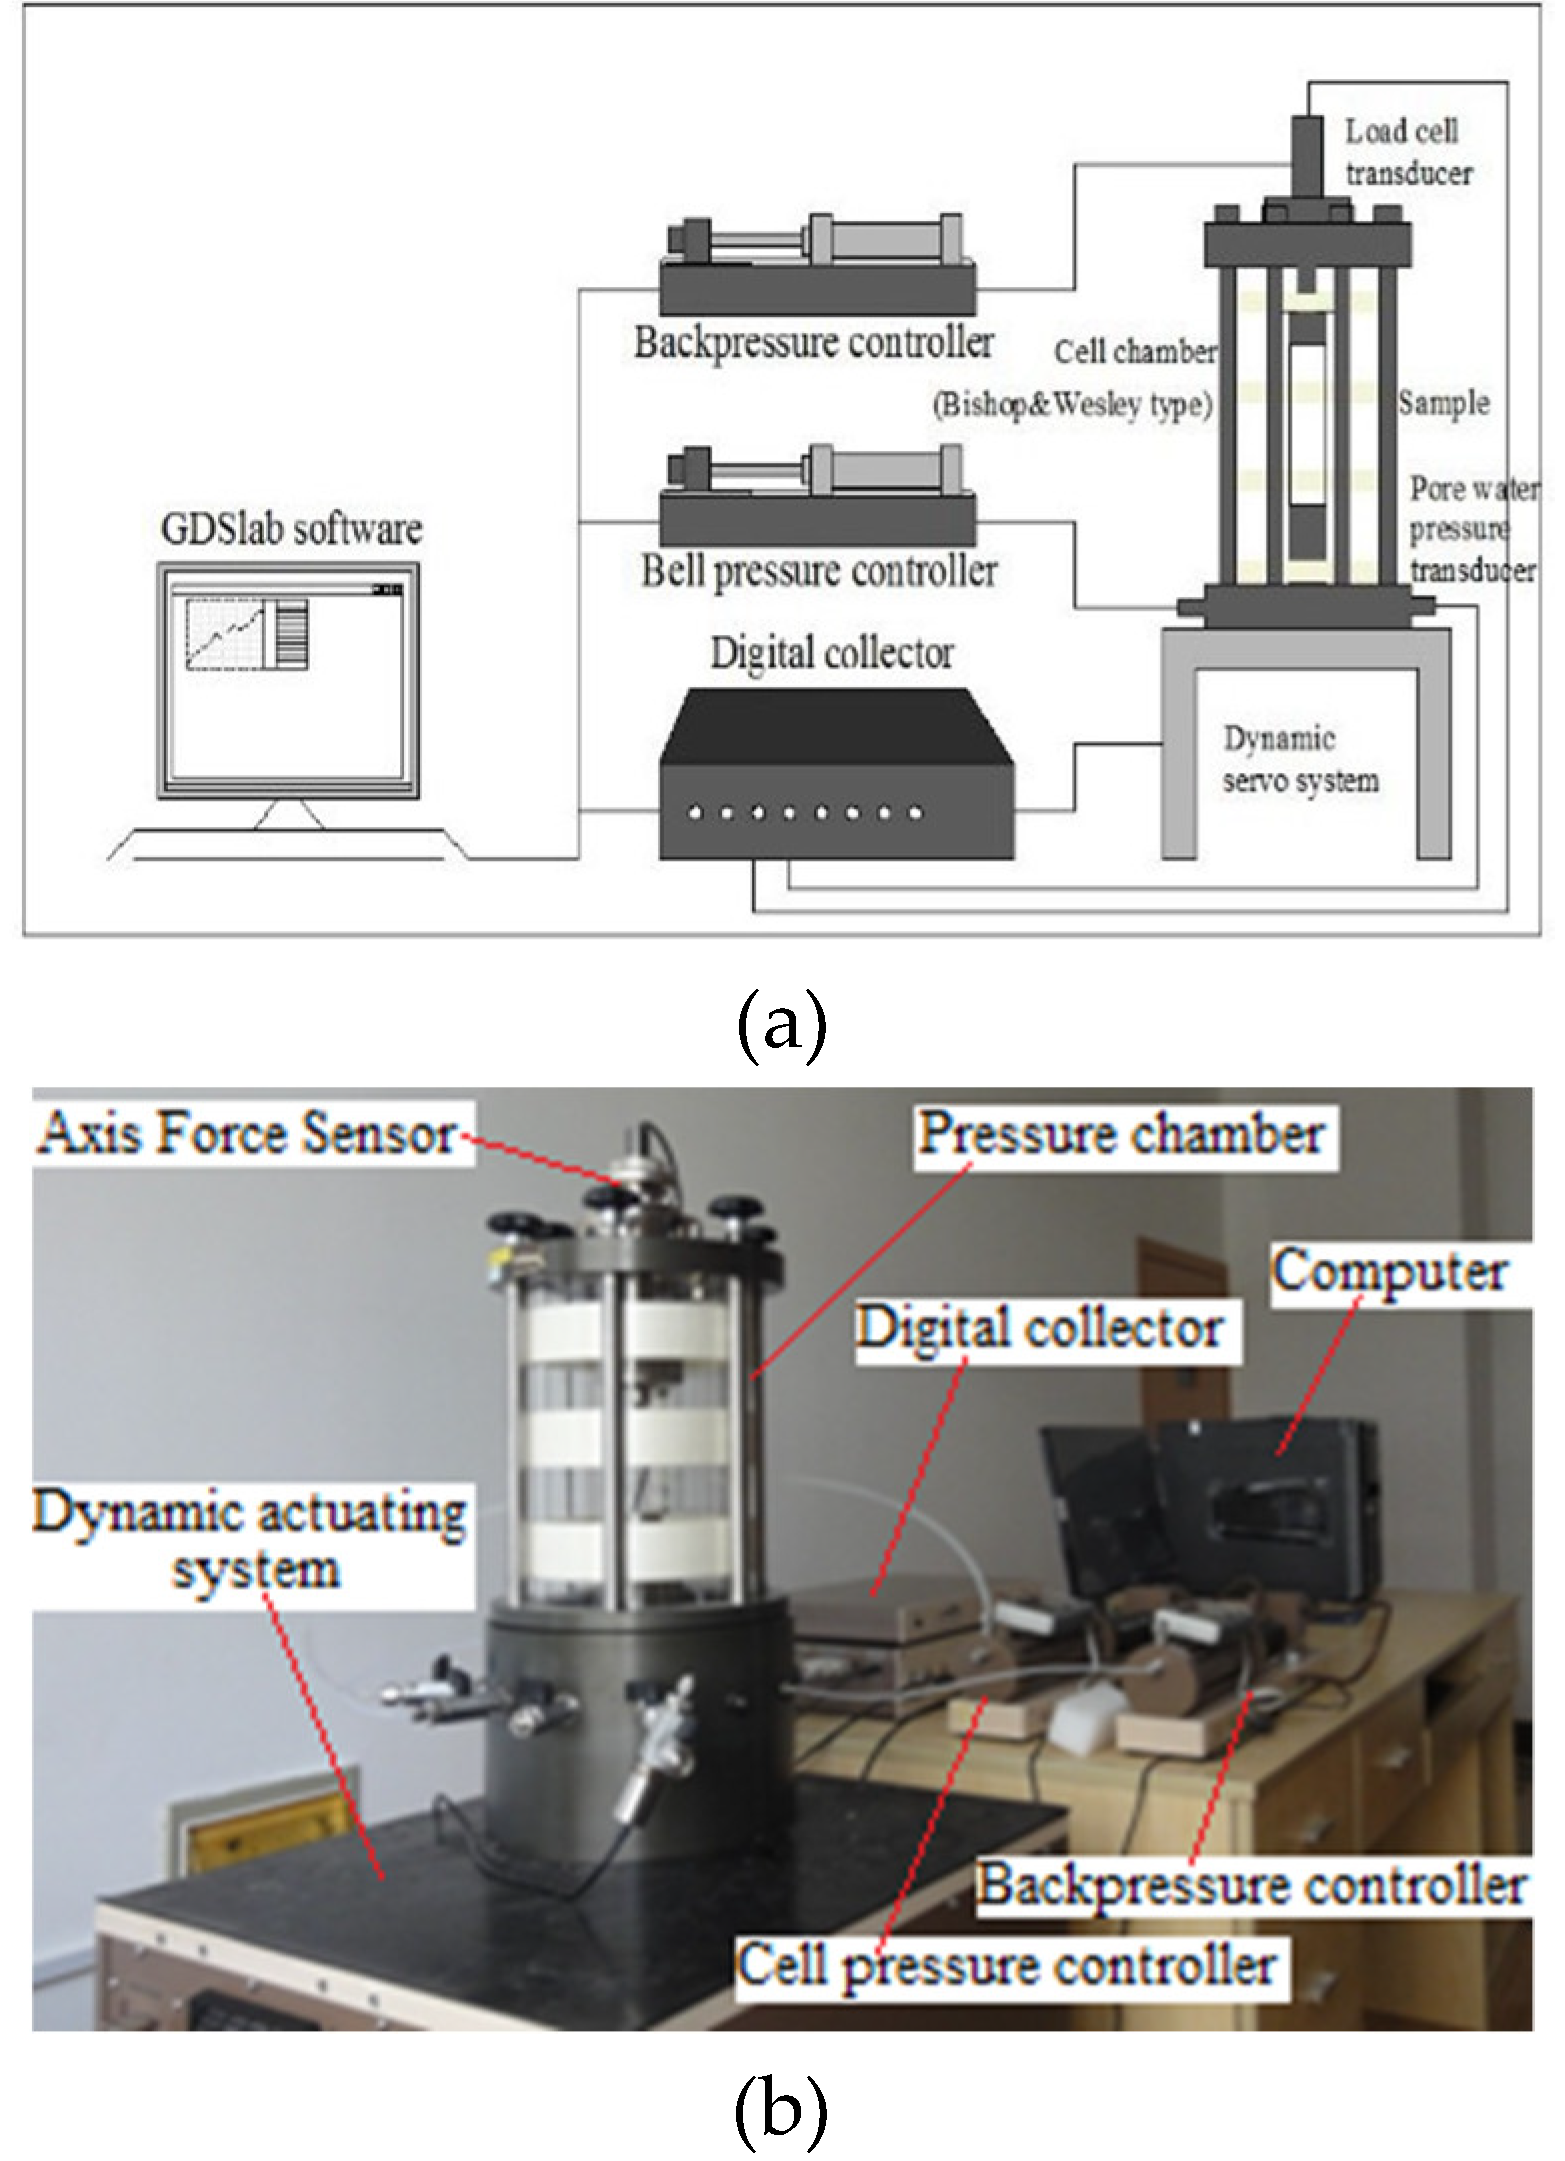
Figure 4.
Typical hysteresis loop of the sample.

Figure 5.
Definition of relative particle breakage index.
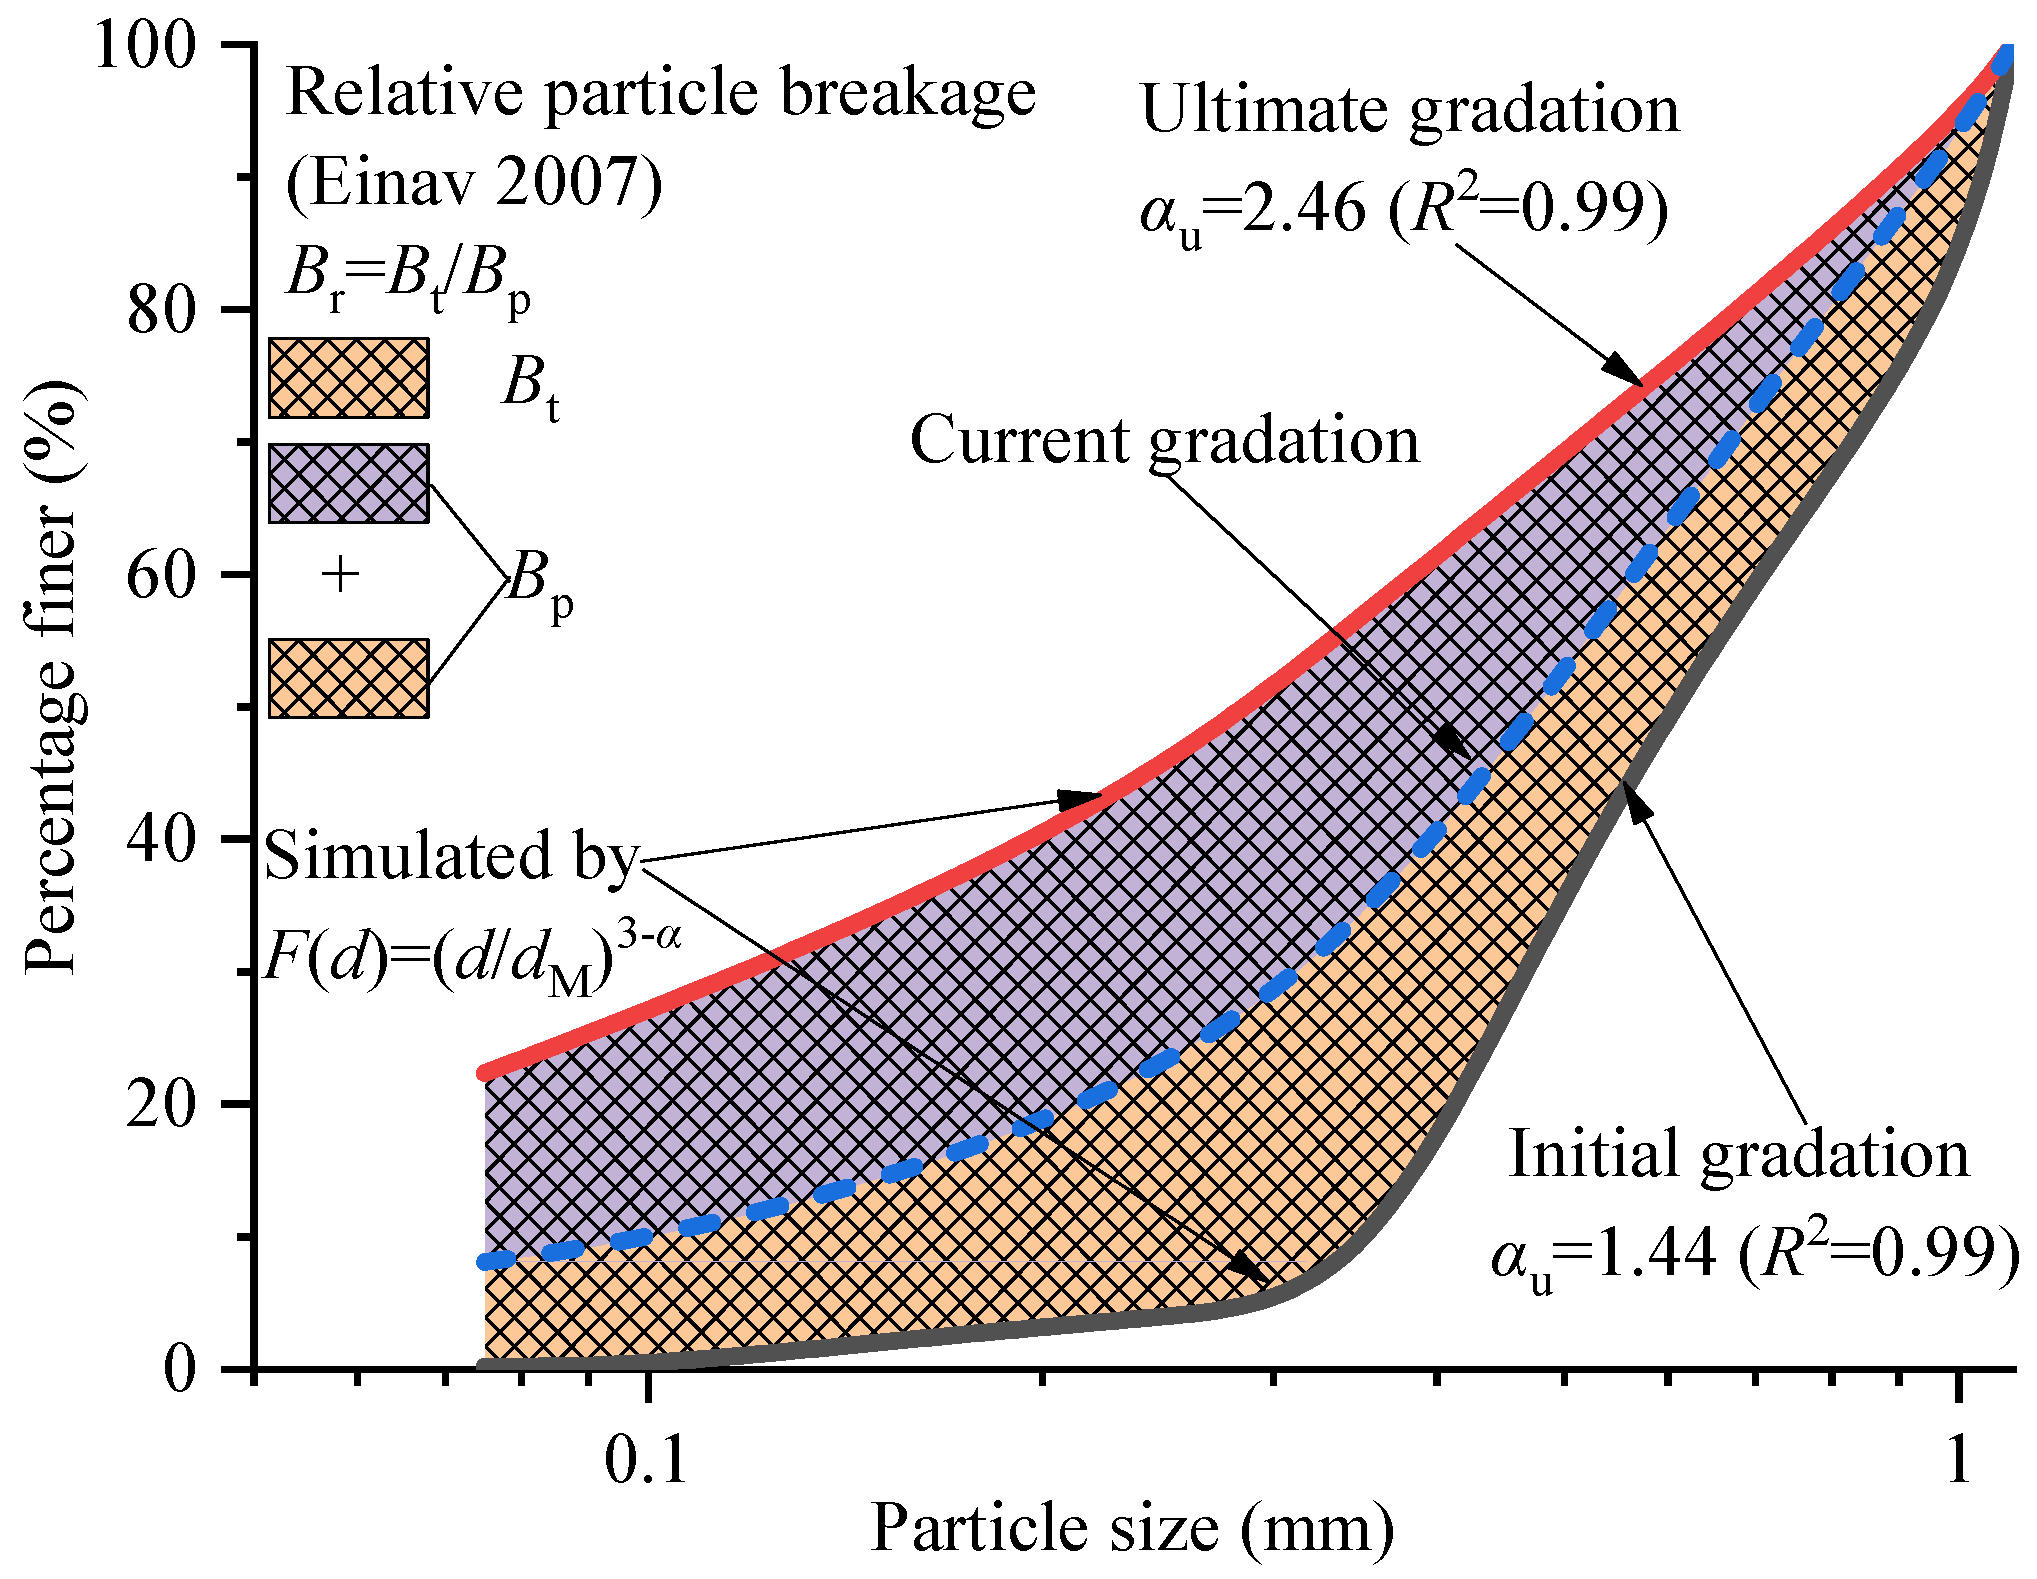
Figure 6.
Fractal dimension of coral sand at various initial mean effective stresses.

Figure 7.
Relationship between parameter αp0 and cyclic stress ratio ζ.
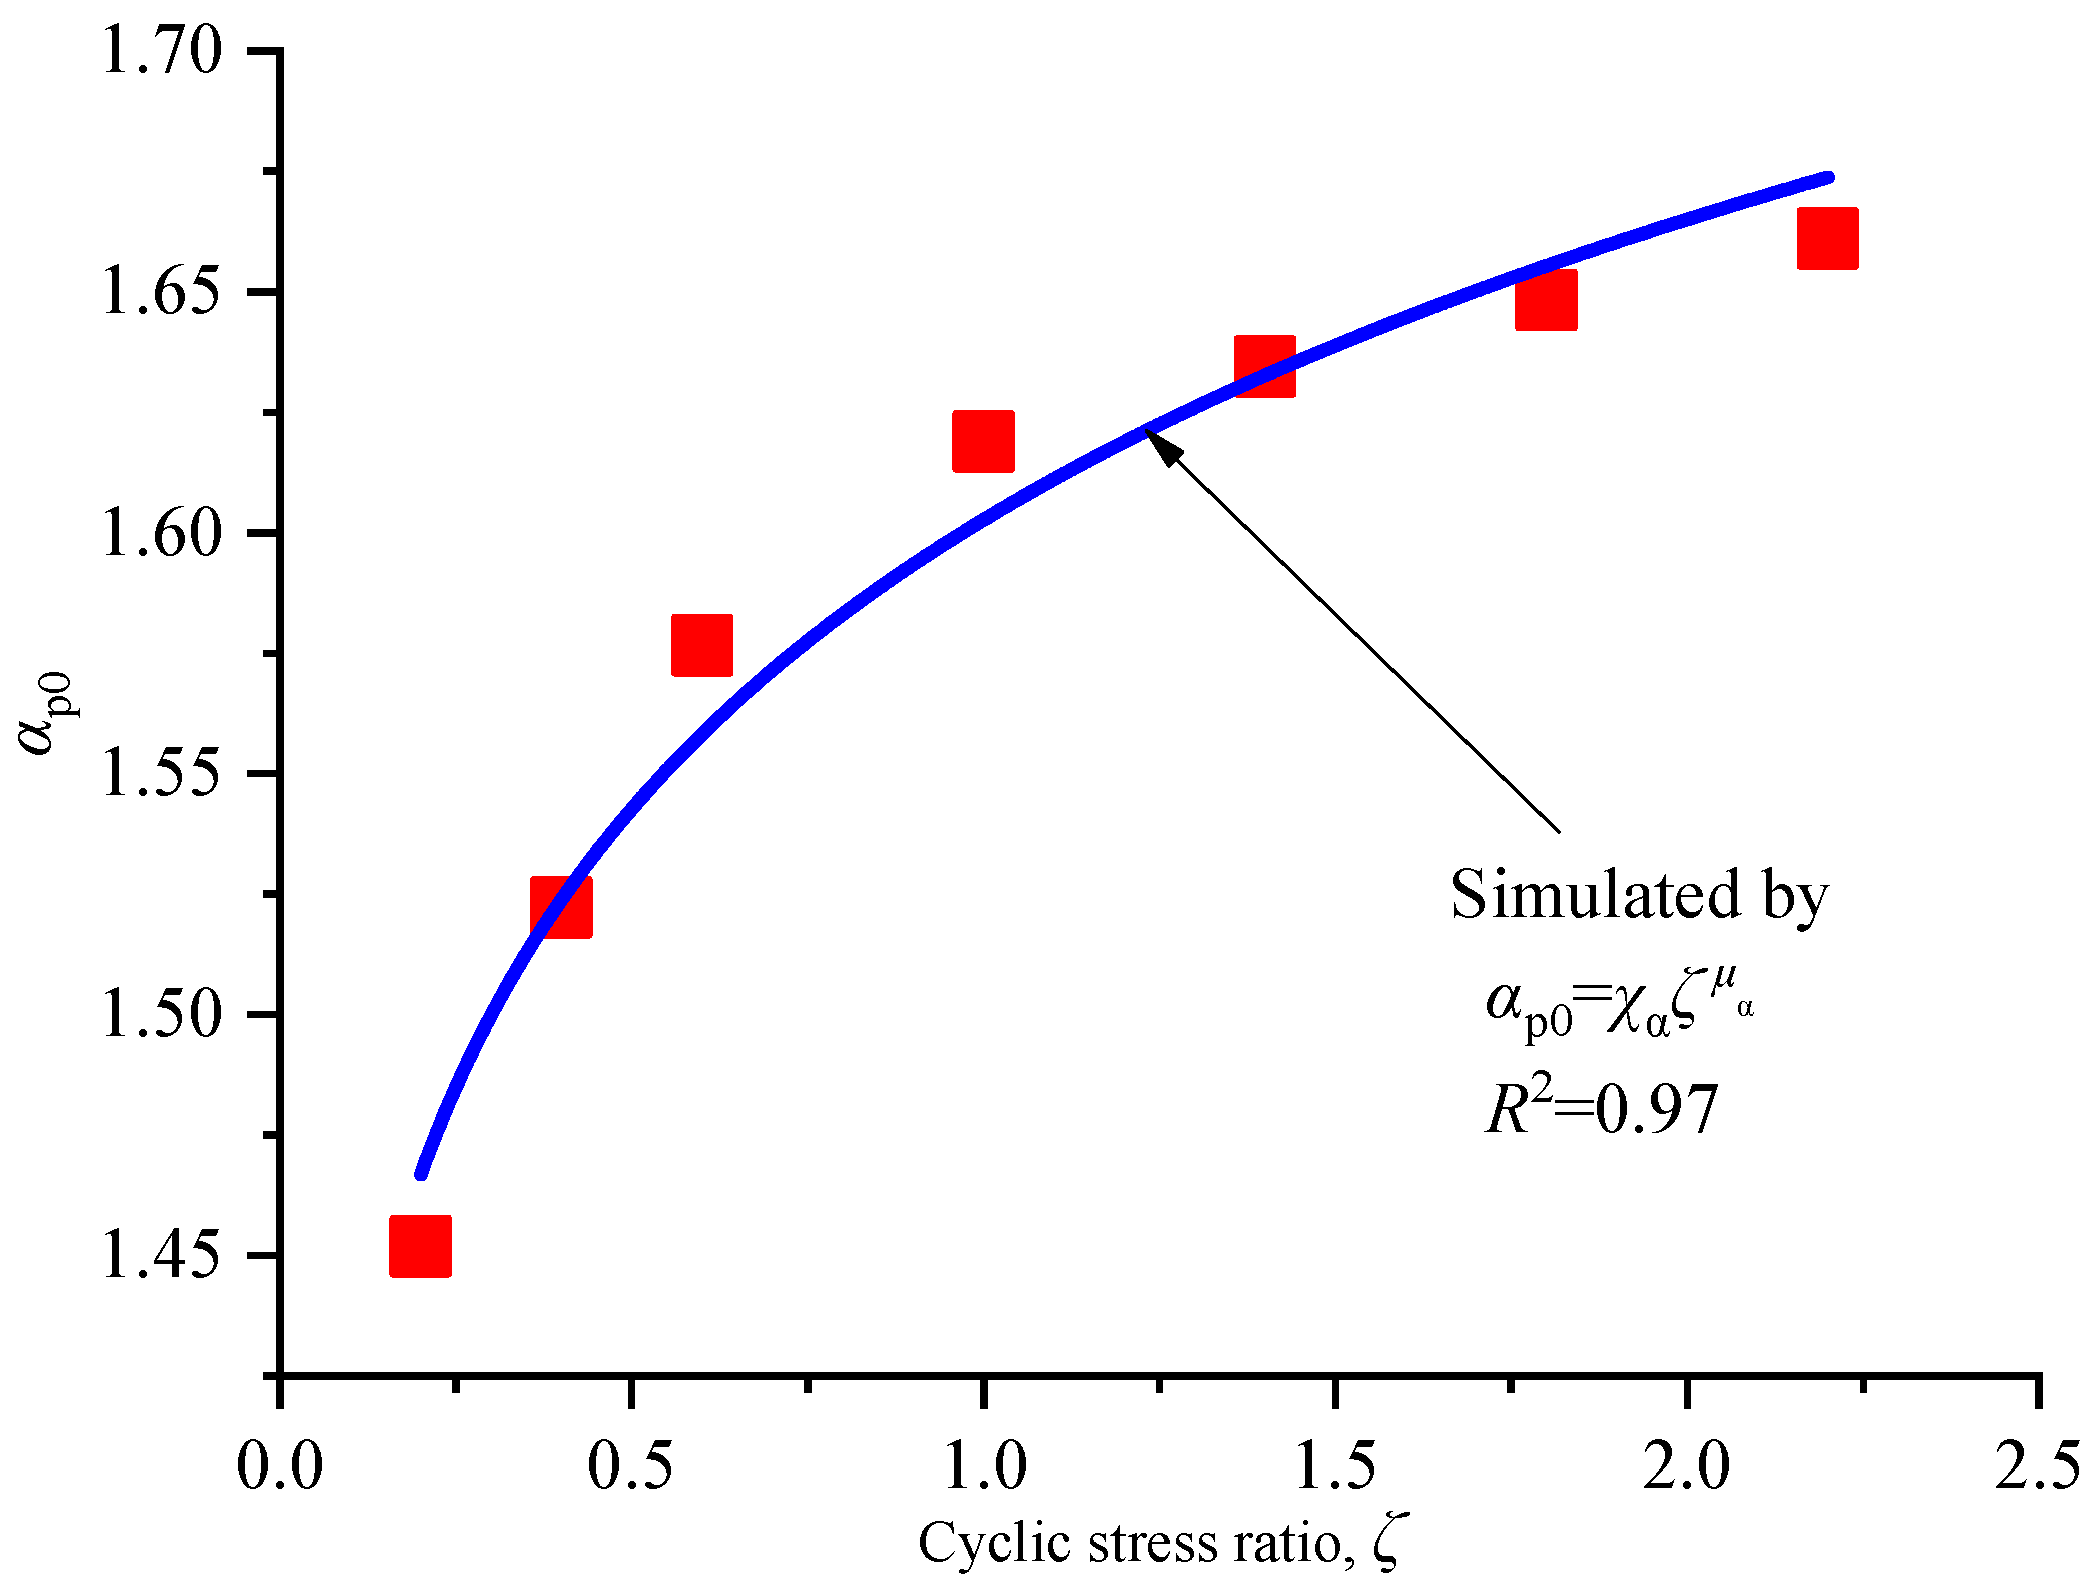
Figure 8.
Comparison between observes Br and predicted Br.
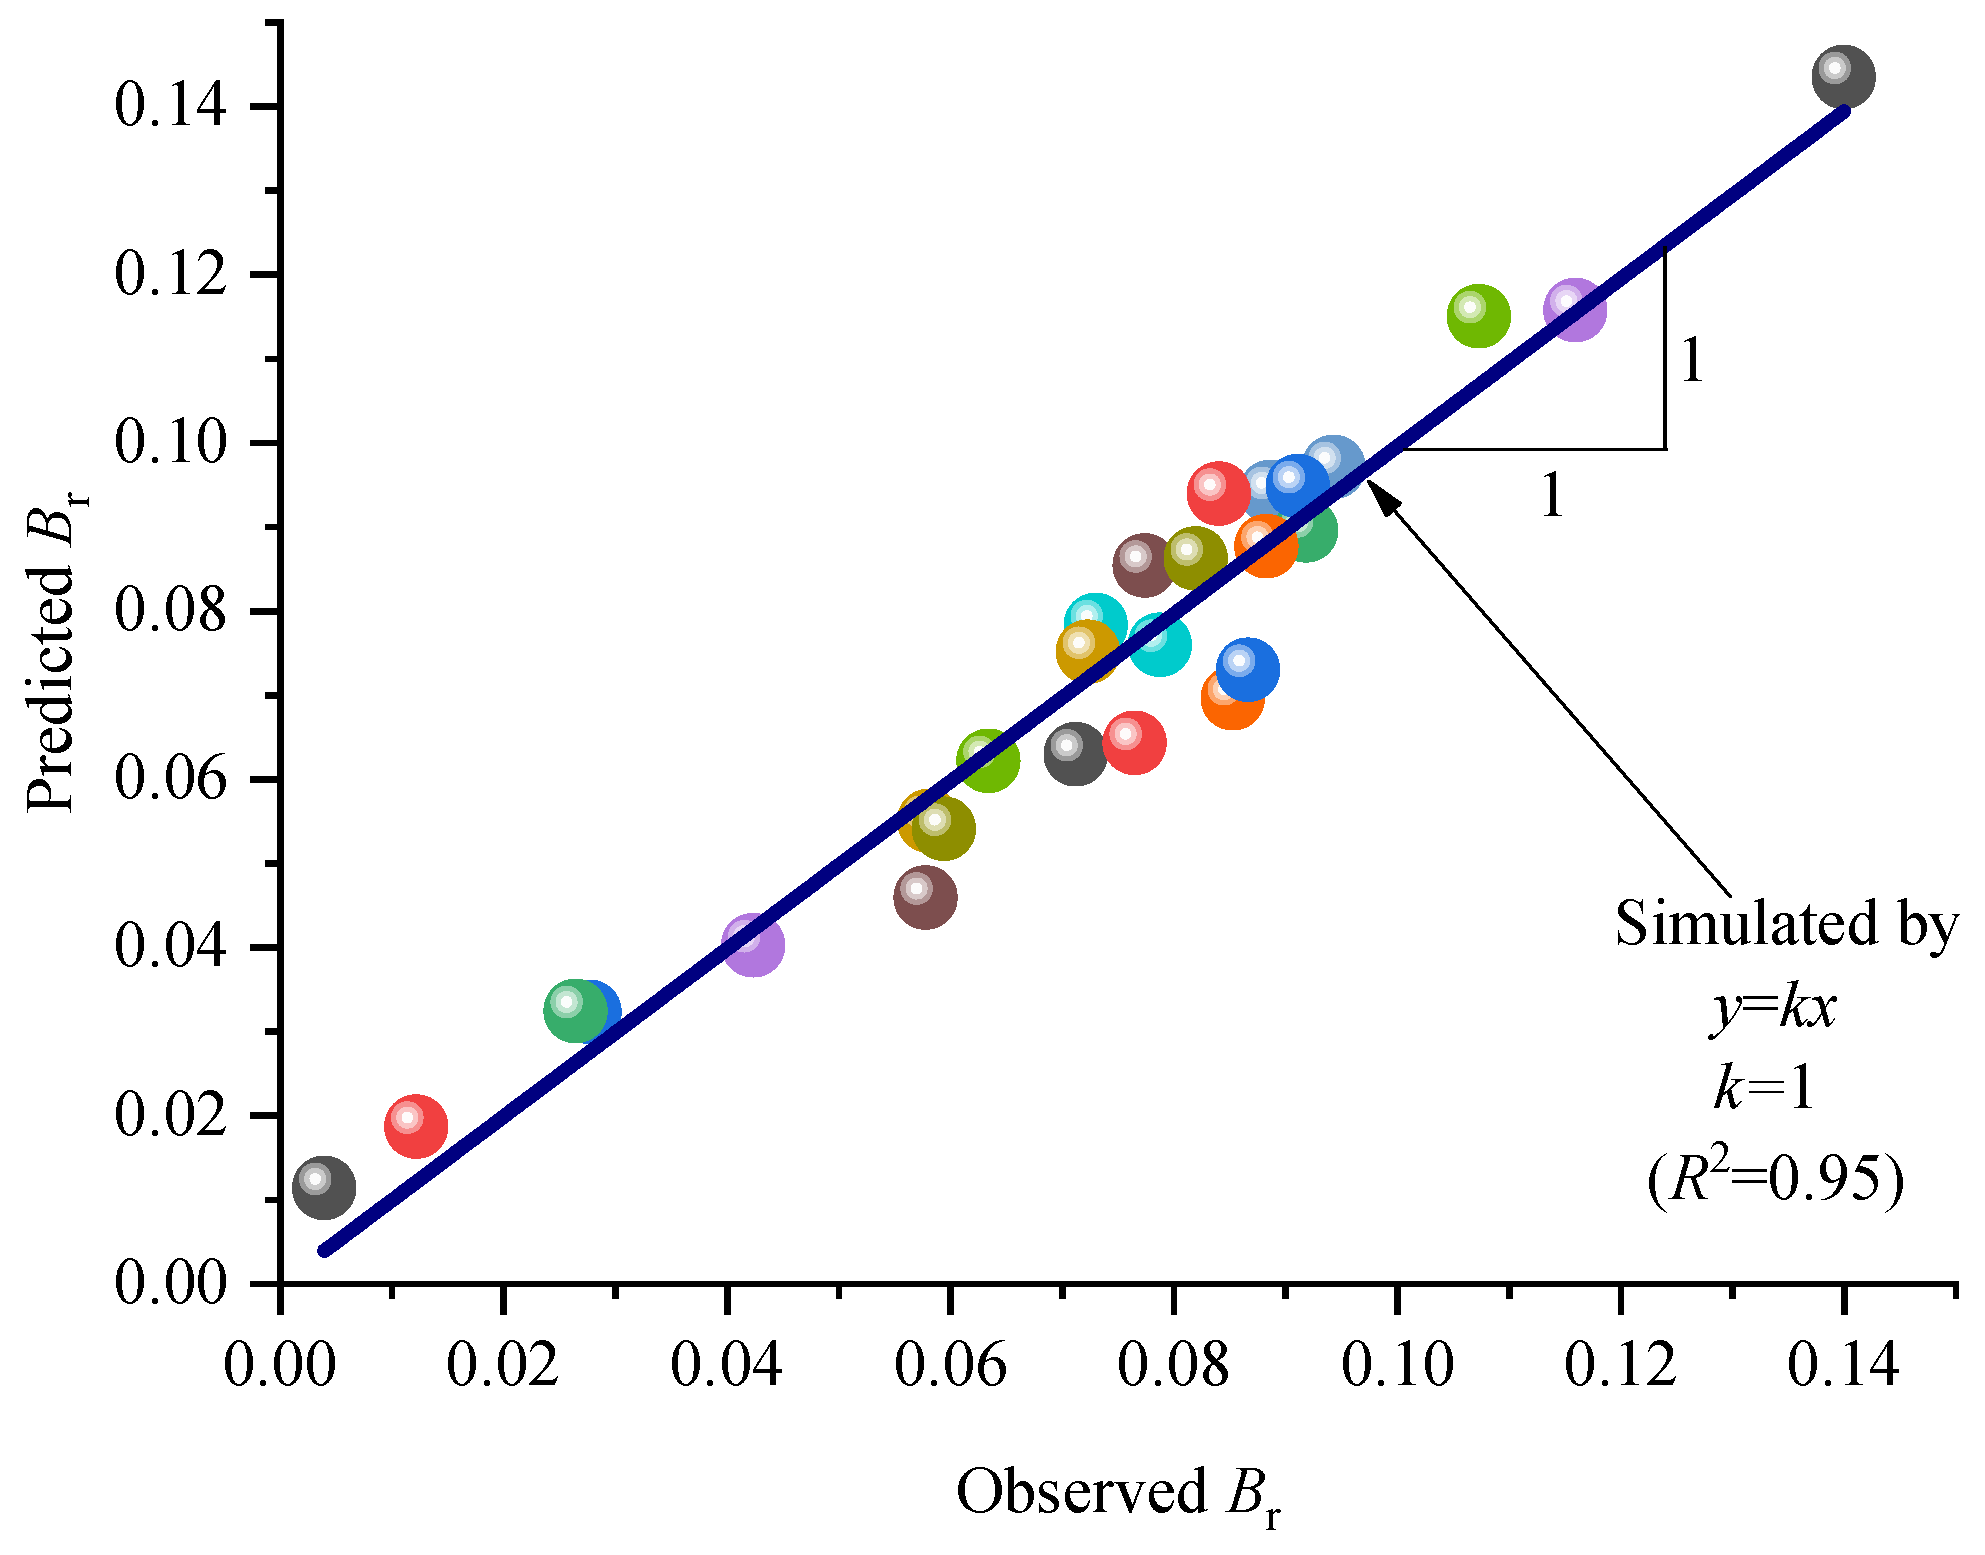
Figure 9.
Hysteresis loop of coral sand under cyclic loading (take the samples of p0 = 200k Pa as an example): (a) p0 = 200 kPa, ζ = 0.2; (b) p0 = 200 kPa, ζ = 0.4; (c) p0 = 200 kPa, ζ = 0.6; (d) p0 = 200 kPa, ζ = 1.0.
Figure 9.
Hysteresis loop of coral sand under cyclic loading (take the samples of p0 = 200k Pa as an example): (a) p0 = 200 kPa, ζ = 0.2; (b) p0 = 200 kPa, ζ = 0.4; (c) p0 = 200 kPa, ζ = 0.6; (d) p0 = 200 kPa, ζ = 1.0.

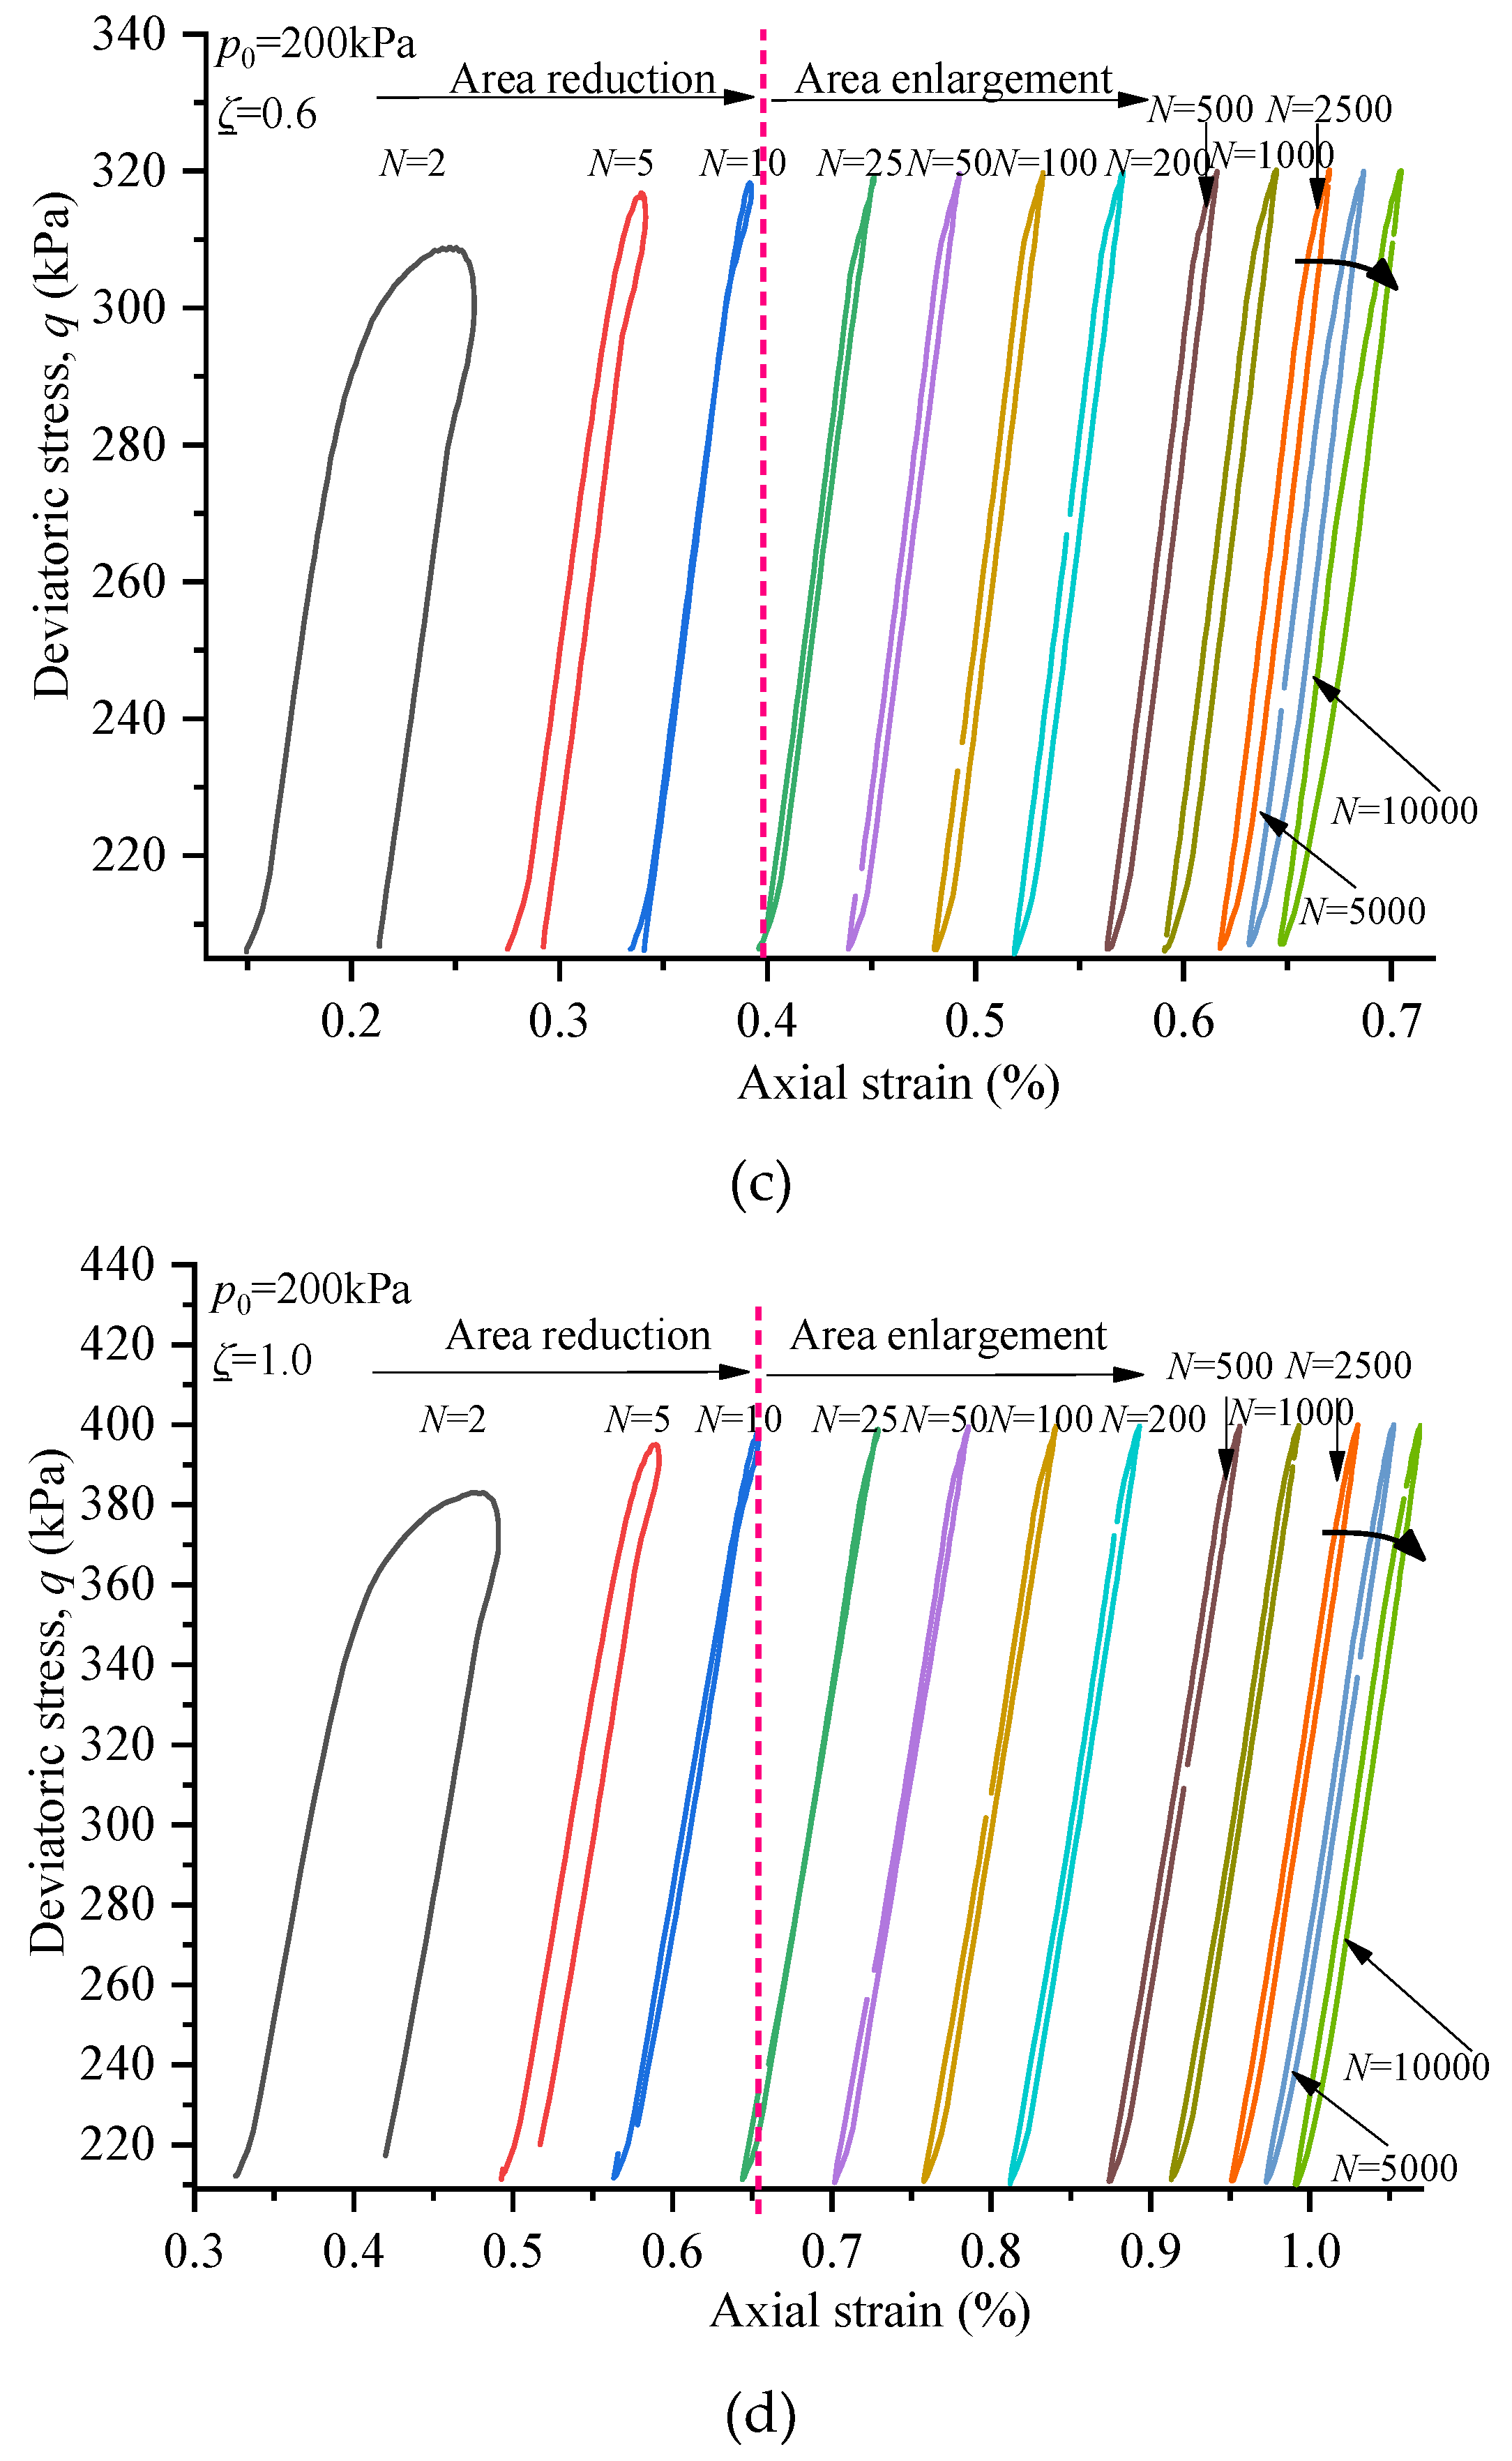
Figure 10.
Stable resilient modulus of coral sand at various initial mean effective stress and cyclic stress ratios: (a) stable resilient modulus of coral sand at various initial mean effective stresses; (b) stable resilient modulus of coral sand at various cyclic stress ratios.
Figure 10.
Stable resilient modulus of coral sand at various initial mean effective stress and cyclic stress ratios: (a) stable resilient modulus of coral sand at various initial mean effective stresses; (b) stable resilient modulus of coral sand at various cyclic stress ratios.
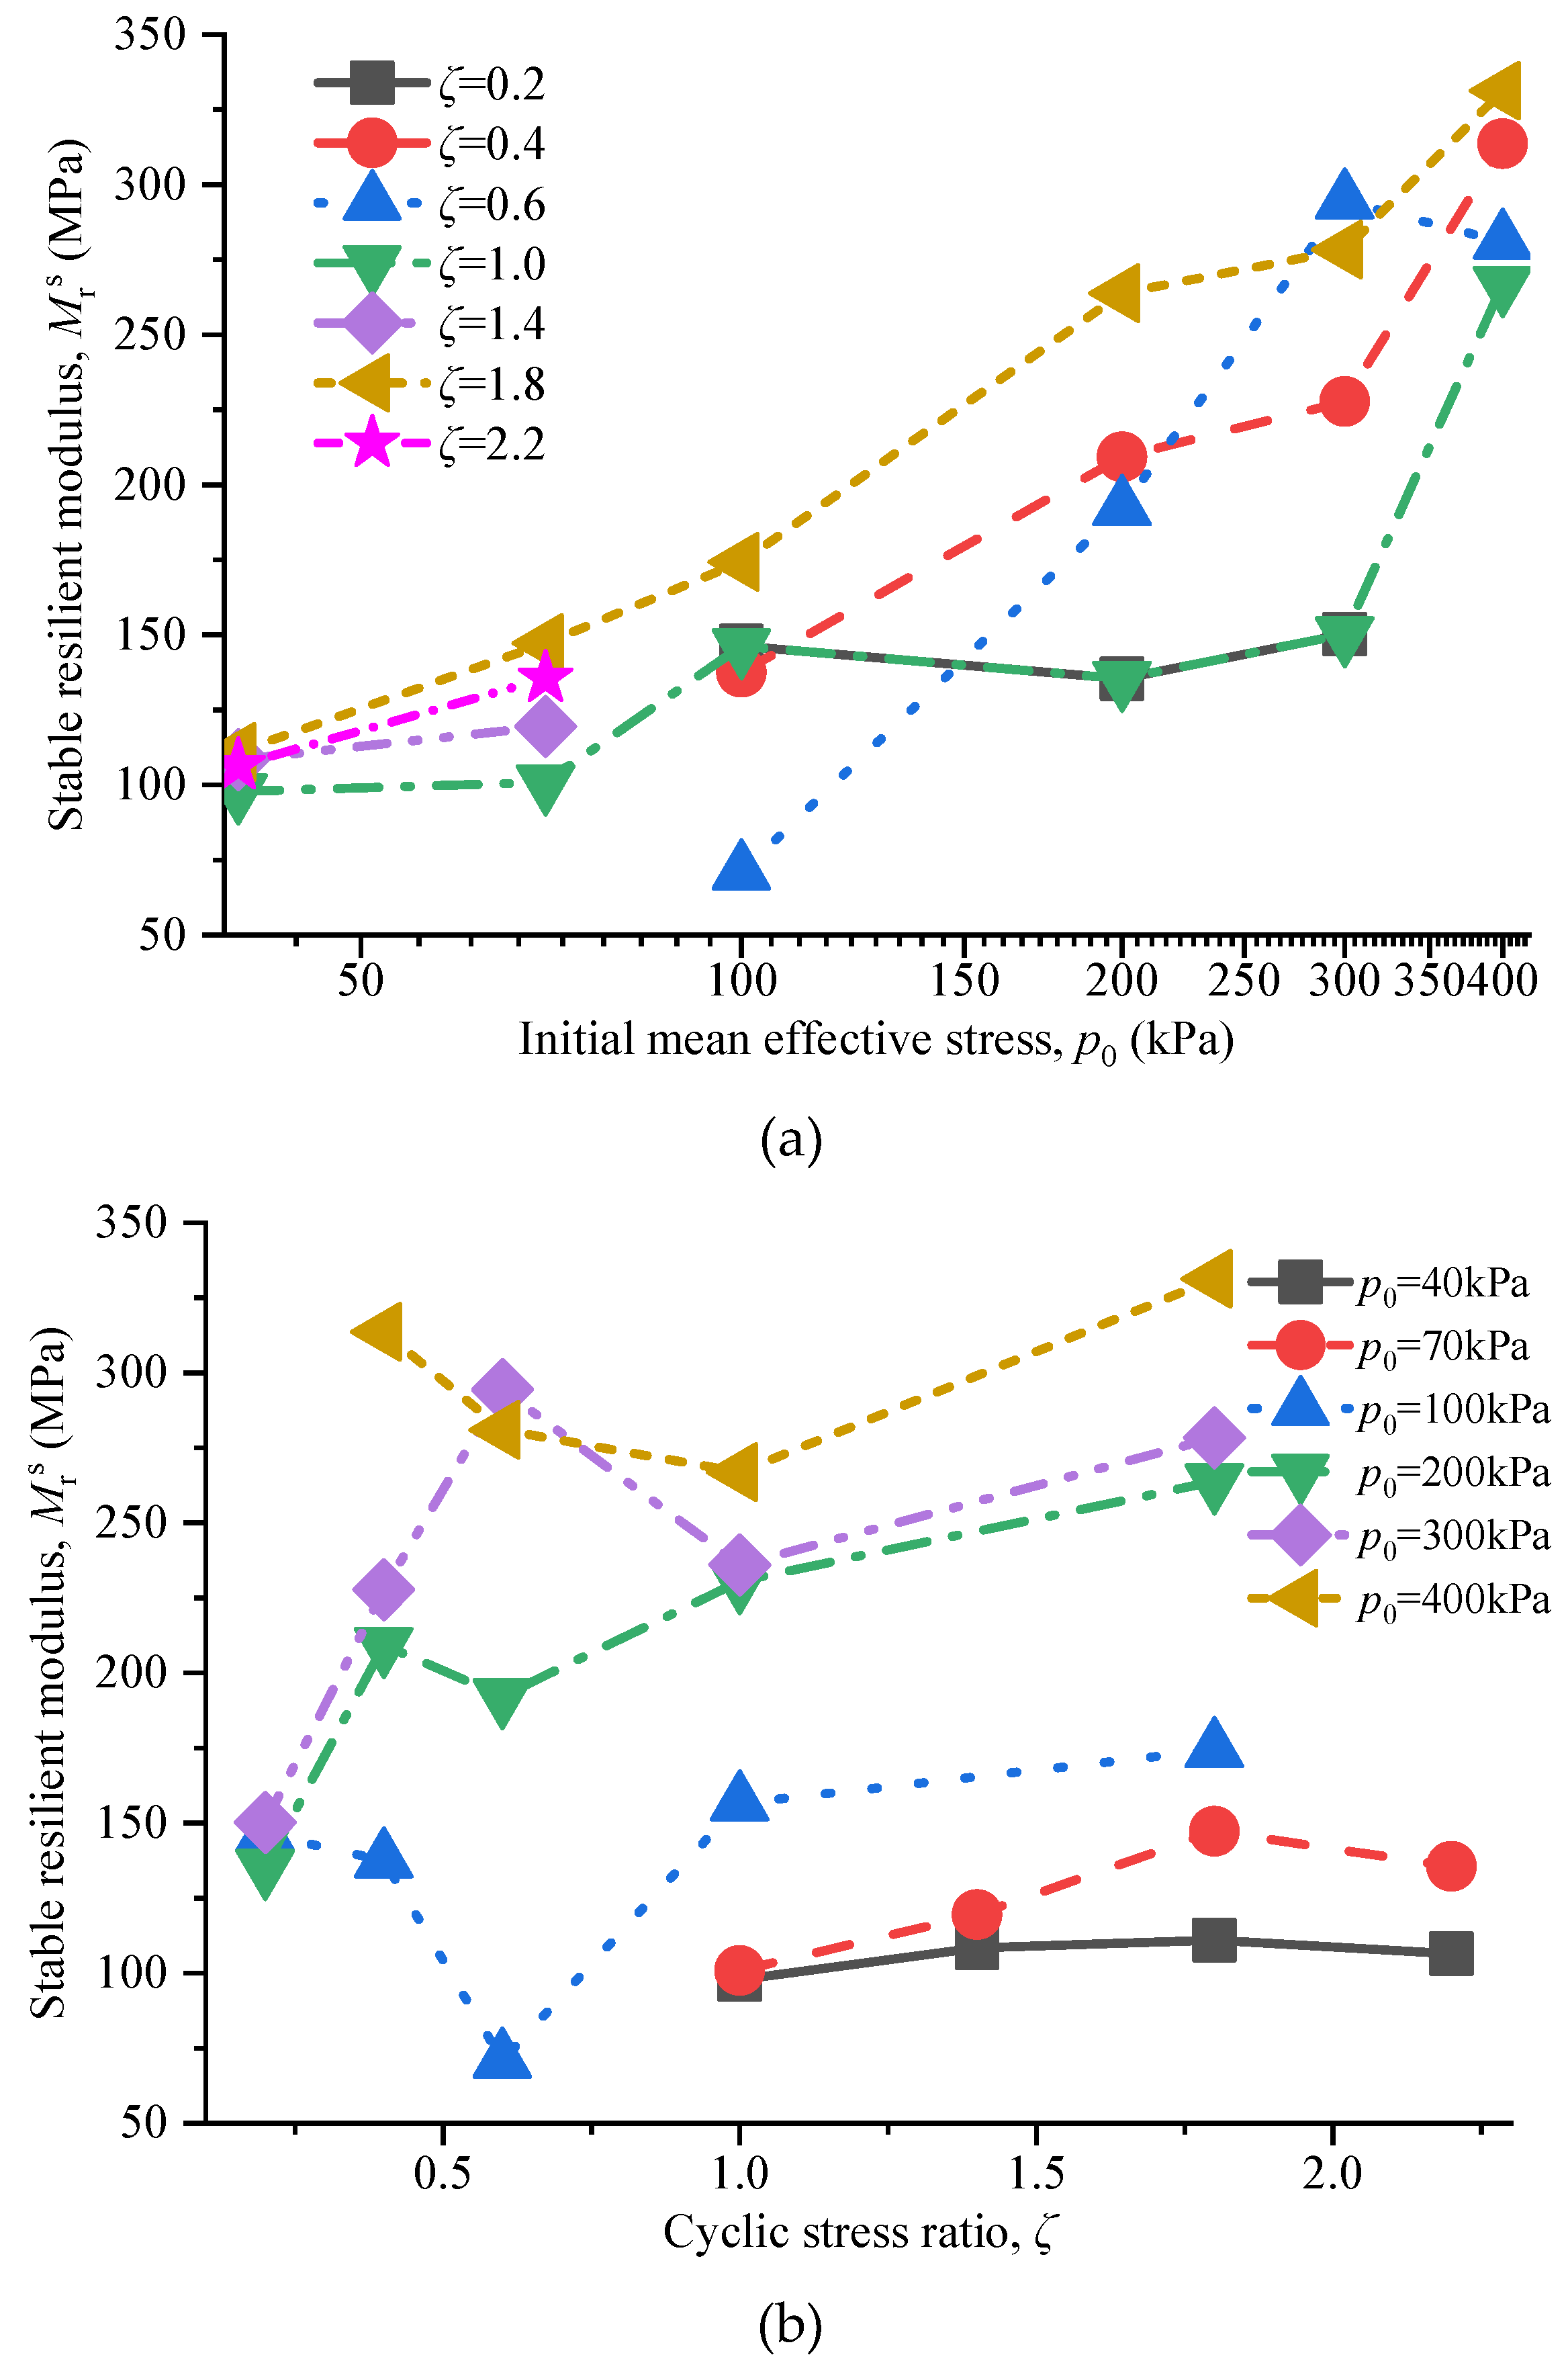
Figure 11.
Predicted surface of stable resilient modulus calculated from Equation (14).

Figure 12.
Relationship between Brp0/pa and Mrps/Mrs calculated from Equation (14).

Figure 13.
Predicted surface of stable resilient modulus calculated from Equation (15).
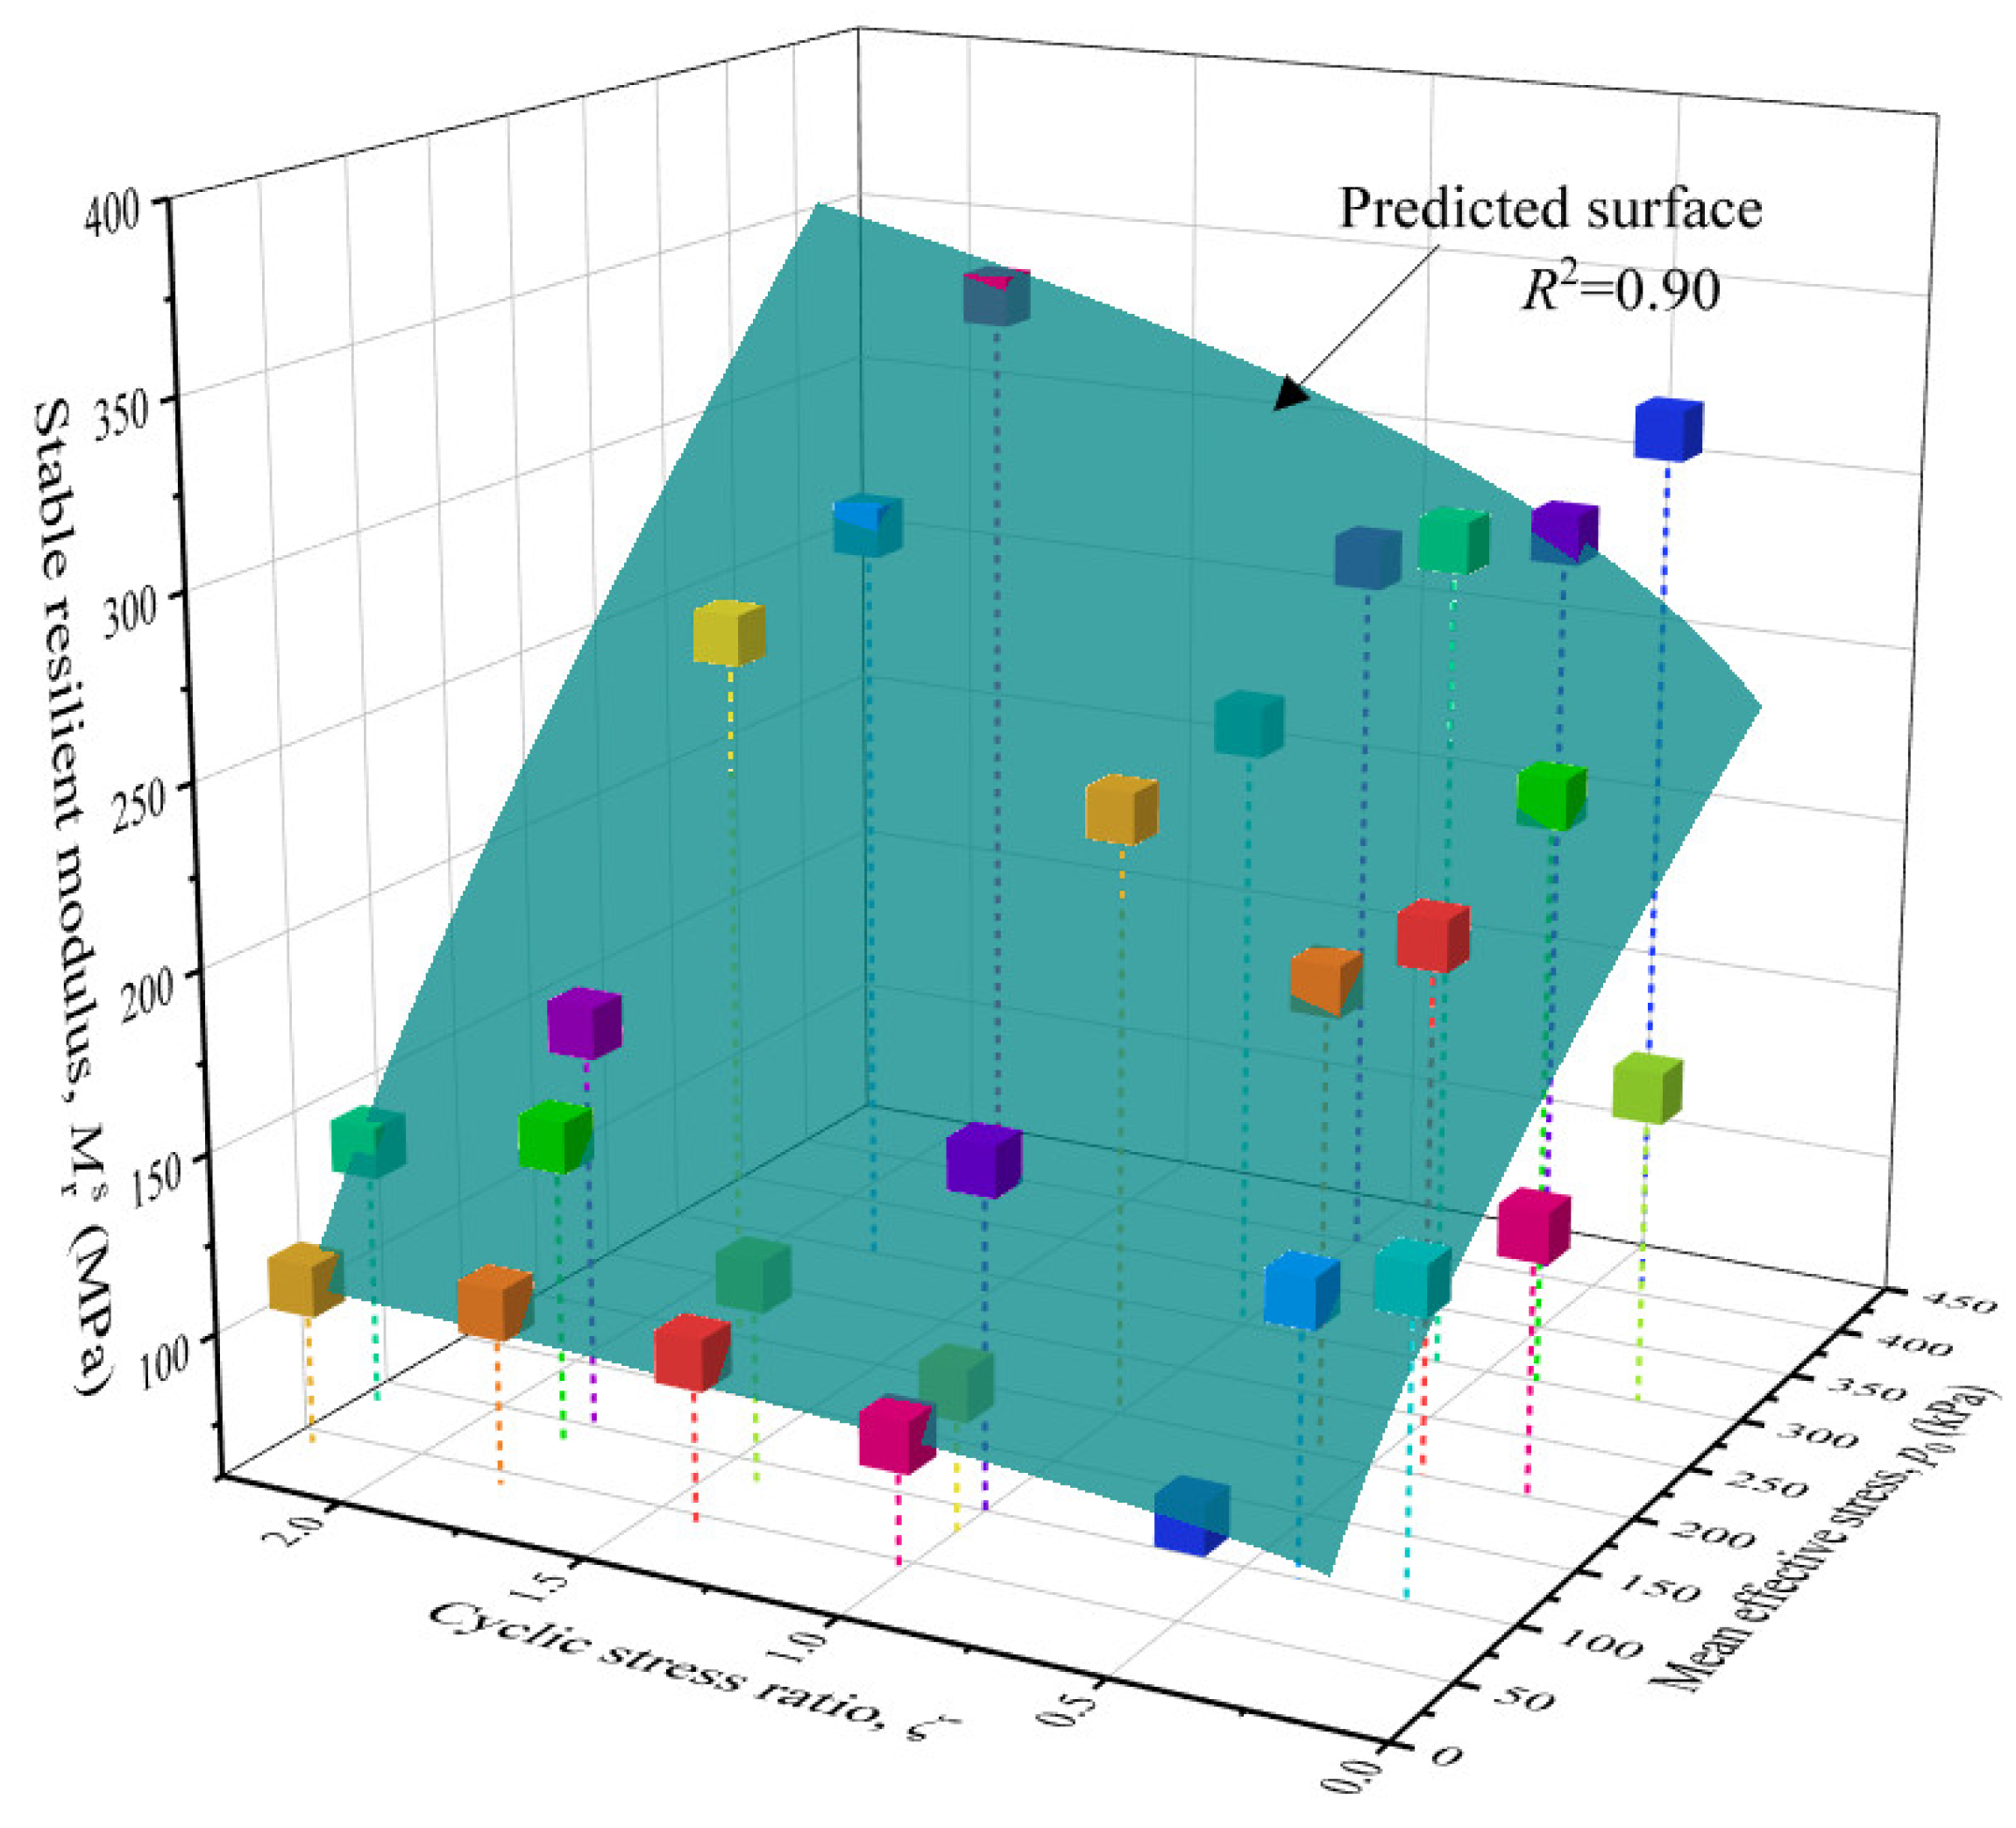
Figure 14.
Relationship between Brp0/pa and Mrps/Mrs calculated from Equation (15).

Table 1.
Basic physical and mechanical parameters of test sand samples.
| Property | Coral Sand |
|---|---|
| Specific gravity (Gs) | 2.75 |
| Maximum void ratio (emax) | 1.107 |
| Minimum void ratio (emin) | 0.971 |
| Coefficient of uniformity (Cu) | 1.793 |
| Coefficient of curvature (Cc) | 0.781 |
| Relative density of samples (Dr) | 80% |
Table 2.
Summary of the dynamic test programs.
| Initial Mean Effective Stress, p0(kPa) | Confining Pressure, σ3(kPa) | Initial Static Stress Ratio, ηc | Cyclic Stress Ratio, ζ |
|---|---|---|---|
| 40 | 26.7 | 1.0 | 1.0, 1.4, 1.8, 2.2 |
| 70 | 46.7 | 1.0 | 1.0, 1.4, 1.8, 2.2 |
| 100 | 66.8 | 1.0 | 0.2, 0.4, 0.6, 1.0, 1.8 |
| 200 | 133.3 | 1.0 | 0.2, 0.4, 0.6, 1.0, 1.8 |
| 300 | 150.0 | 1.0 | 0.2, 0.4, 0.6, 1.0, 1.8 |
| 400 | 266.7 | 1.0 | 0.4, 0.6, 1.0, 1.8 |
© 2020 by the authors. Licensee MDPI, Basel, Switzerland. This article is an open access article distributed under the terms and conditions of the Creative Commons Attribution (CC BY) license (http://creativecommons.org/licenses/by/4.0/).
Share and Cite
MDPI and ACS Style
He, S.-H.; Zhang, Q.-F.; Ding, Z.; Xia, T.-D.; Gan, X.-L. Experimental and Estimation Studies of Resilient Modulus of Marine Coral Sand under Cyclic Loading. J. Mar. Sci. Eng. 2020, 8, 287. https://doi.org/10.3390/jmse8040287
AMA Style
He S-H, Zhang Q-F, Ding Z, Xia T-D, Gan X-L. Experimental and Estimation Studies of Resilient Modulus of Marine Coral Sand under Cyclic Loading. Journal of Marine Science and Engineering. 2020; 8(4):287. https://doi.org/10.3390/jmse8040287
Chicago/Turabian StyleHe, Shao-Heng, Qiong-Fang Zhang, Zhi Ding, Tang-Dai Xia, and Xiao-Lu Gan. 2020. "Experimental and Estimation Studies of Resilient Modulus of Marine Coral Sand under Cyclic Loading" Journal of Marine Science and Engineering 8, no. 4: 287. https://doi.org/10.3390/jmse8040287
Note that from the first issue of 2016, this journal uses article numbers instead of page numbers. See further details here.