Article

Demonstration Experiment and Numerical Simulation Analysis of Full-Scale Barge-Type Floating Offshore Wind Turbine

by
Ko Matias Adrian Kosasih
1,*,
Hideyuki Suzuki
2,
Hideyuki Niizato
1 and
Shigeki Okubo
1
1
Hitachi Zosen Corporation, Osaka 551-0022, Japan
2
Department of Systems Innovation, Graduate School of Engineering, The University of Tokyo, Tokyo 113-8656, Japan
*
Author to whom correspondence should be addressed.
J. Mar. Sci. Eng. 2020, 8(11), 880; https://doi.org/10.3390/jmse8110880
Submission received: 29 September 2020 / Revised: 2 November 2020 / Accepted: 3 November 2020 / Published: 5 November 2020

Abstract

:
The development of Floating Offshore Wind Turbines (FOWT) has been progressing steadily. To utilize the moderate water depth of 50–100 m ocean space around Japan, a barge-type FOWT was installed in Kitakyushu as part of a demonstration project conducted by the New Energy and Industrial Technology Development Organization (NEDO) of Japan. The FOWT mounts a 3 MW two-bladed wind turbine with blade diameter of 100 m and hub height of 72 m. The barge-type floating support structure is equipped with a moonpool in the center and a skirt at its bottom and is moored with 9 lines of catenary chains. To investigate the dynamic behavior of the barge-type FOWT in extreme condition and the validity of the numerical simulation in modeling the effect of the complex flow around the floating structure to the FOWT’s motion response, the FOWT’s motion data during typhoon Tapah on 23 September 2019 were measured and compared with the simulation results. As the results, the simulation results showed a good agreement in general to the measurement data. However, some shifts in the peak frequency of the simulation’s motion spectrum and a disagreement in waves with shorter wave periods were also observed. The possible causes of these differences are discussed thoroughly in this paper.

1. Introduction

To realize a low-carbon society and promote the utilization of ocean space, the development of offshore wind turbine in the world has been progressing steadily. In Japan itself, the development of both bottom-fixed foundation wind turbine and floating offshore wind turbine (FOWT) have been increasing in recent years. In 2013, the first operational scale FOWT in Japan, a 2 MW spar-type FOWT, was installed in Nagasaki [1]. Then, as part of the Fukushima FORWARD project [2], in 2013, a 2 MW semi-submersible FOWT [3], in 2015, a 7 MW V-shaped semi-submersible [4], and in 2016, a 5 MW advanced spar-type [5] FOWTs were installed in Fukushima. Since then, with aim to verify the feasibility of a low-cost FOWT suitable for moderate water depth of 50–100 m, a demonstration 3 MW barge-type FOWT was installed in Kitakyushu in 2018 by the New Energy and Industrial Technology Development Organization (NEDO) of Japan. The demonstration wind turbine has been in operation and collecting data since 2019.
In this case of moderate water depth of 50 m to 100 m, the barge-type floating foundation is considered advantageous over other types of offshore wind turbine foundations. For water depth of more than 50 m, floating foundations are considered more cost-effective than bottom-fixed foundations, however, for water depth less than 100 m, the selection of the floating foundation types is limited to floating foundations with shallow draught. Floating foundations with deeper draught, such as a spar-type floating foundation, is difficult or impossible to be installed due to the water depth restriction. Then, compared to floating foundations with similar draught, such as semi-submersible foundations, the barge-type floating support structure is easier to design and manufacture resulting in its lower installation cost.
However, modeling a barge-type FOWT is not an easy feat. In 2007, Jonkman and Buhl [6] presented a fully coupled load analysis of a barge-type FOWT and showed the presence of excessive pitching in extreme wave conditions, which prompts the need to decrease the motion response of the barge-type FOWT. To do so, usually moonpool or skirts can be installed on the barge floating support structure. This introduces the need to confirm the effectiveness of the moonpool and the skirts, as well as to accurately model the effect of those additional parts to the FOWT’s motion responses. Thus, in 2015, Beyer et al. [7] presented a numerical analysis using coupled Multibody System–Computational Fluid Dynamics (MBS-CFD) method to compute the motion response of a barge-type floating support structure equipped with a moonpool and bottom skirt. The numerical analysis was able to model the motion response of the experiment quite accurately and indicated the presence of vortex shedding of the hull and moving water in the moonpool which caused the heave damping on the floating support structure. However, there is still a need for a numerical simulation method capable of modeling the motion response of such barge-type FOWT coupled with the dynamics of the wind turbine, not only accurately, but also quickly, as usually thousands of environmental conditions are needed to be evaluated in the design of a single FOWT.
In 2016, Vijay et al. [8] investigated the motion responses of several moonpool configurations of barge-type FOWT using Boundary Element Method (BEM) potential flow theory to model the hydrodynamics of the floating structure and FAST codes to model the aerodynamics of the wind turbine. The study which modeled the moonpool as Oscillating Water Column (OWC) wave energy converter analyzed the motion response of the barge-type FOWT in relation to its moonpool configuration. In 2019, Kosasih et al. [9] compared the motion characteristics of the 1/50 model of two types of barge-type FOWTs in a wave tank experiment and the corresponding experiment results as a preliminary study to the NEDO 3 MW barge-type FOWT demonstration project. The numerical simulation was done using the BEM hydrodynamic analysis added with additional viscous damping coefficients to model the moonpool and the bottom skirt. The study showed a good agreement between the experiment and the simulation results, which indicated that the numerical simulation based on BEM potential theory is good enough to model the dynamic behavior of the barge-type FOWT including a moonpool and bottom skirt. As BEM-based numerical simulation can be calculated considerably quicker compared to a full CFD analysis, using BEM potential flow theory to evaluate the sheer number of cases in the design of a FOWT may be more favorable to CFD. However, validation of such numerical simulation method is still needed, especially compared to the motion response of an actual FOWT.
Thus, for this paper, the motion response of the actual NEDO 3 MW barge-type FOWT during typhoon Tapah on 23 September 2019 was investigated and compared with the time domain numerical simulation results based on the BEM potential flow theory coupled with the aerodynamics of the wind turbine. The power spectral density of the 6 degrees of freedom (DOF) motion response of the FOWT during the typhoon was investigated and compared with the simulation. Then, the FOWT motion’s statistics from before, during, and after the typhoon were compared with numerical simulation results. Finally, the validity of the numerical simulation and the possible causes of the differences between the measurement and the simulation results shall be discussed in this paper.

2. Demonstration Experiment

2.1. General Specifications of the FOWT

The demonstration project’s FOWT was installed in Kitakyushu about 15 km from the shoreline at water depth of 53 m, as shown in Figure 1. The main dimensions and parts of the barge-type FOWT are shown in Figure 2, while the general specifications of the FOWT are summarized in Table 1.

2.2. Floating Support Structure
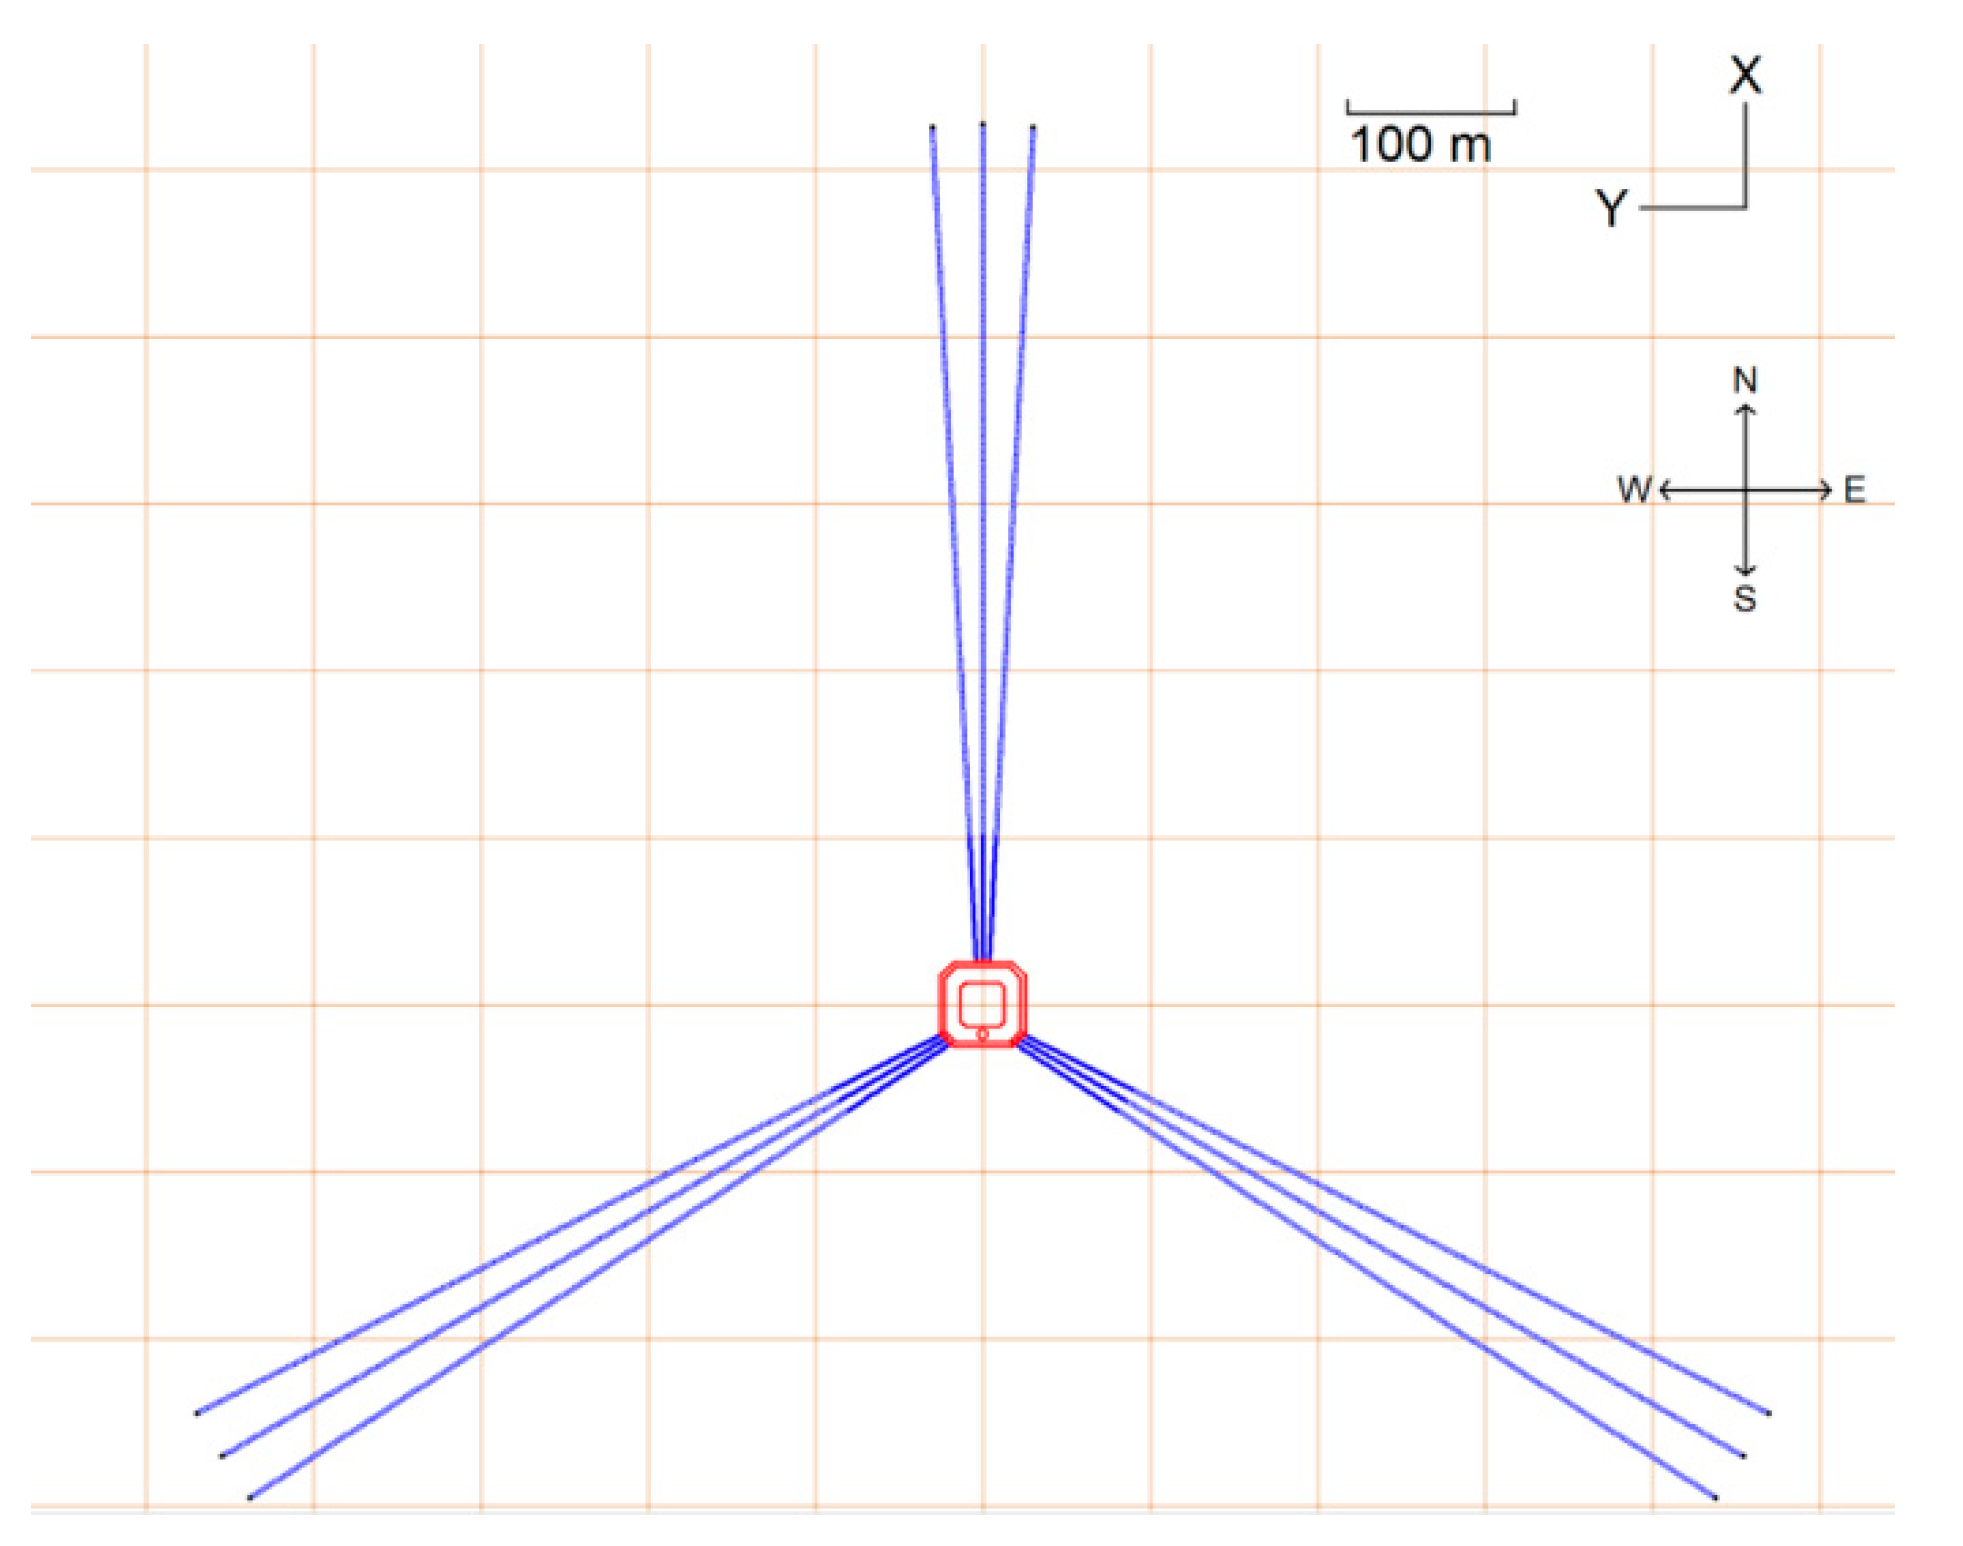
The floating support structure of the barge-type FOWT has an octagonal shape of 45 m × 45 m × 10 m size and is equipped with a 3-m wide skirt on the bottom and a moonpool of 26.2 m × 26.2 m in the center of the floating support structure, as shown in Figure 2. Furthermore, several brackets were installed on the skirt to ensure its structural integrity, as shown in Figure 3. The barge-type FOWT’s center of gravity during operation is located on the center of the moonpool at the height of 0.225 m below still-water level (SWL).

2.3. Mooring System

The mooring system of the barge-type FOWT is composed of three groups of three catenary chain mooring lines with 522 m length each, as shown in Figure 4. The mooring lines are made with studless chains with nominal diameter of 132 mm. Properties of the mooring lines are summarized in Table 2.

2.4. Wind Turbine

The wind turbine and its tower are installed on the aft side of the floating support structure. The wind turbine is an upwind two-blades 3 MW wind turbine with a rotor diameter of 100 m and hub height of 72 m. The rotor-nacelle assembly (RNA) is supported by a single tower structure composed of a transition piece and a steel tubular tower as shown in Figure 2. The specifications of the wind turbine are shown in Table 3.

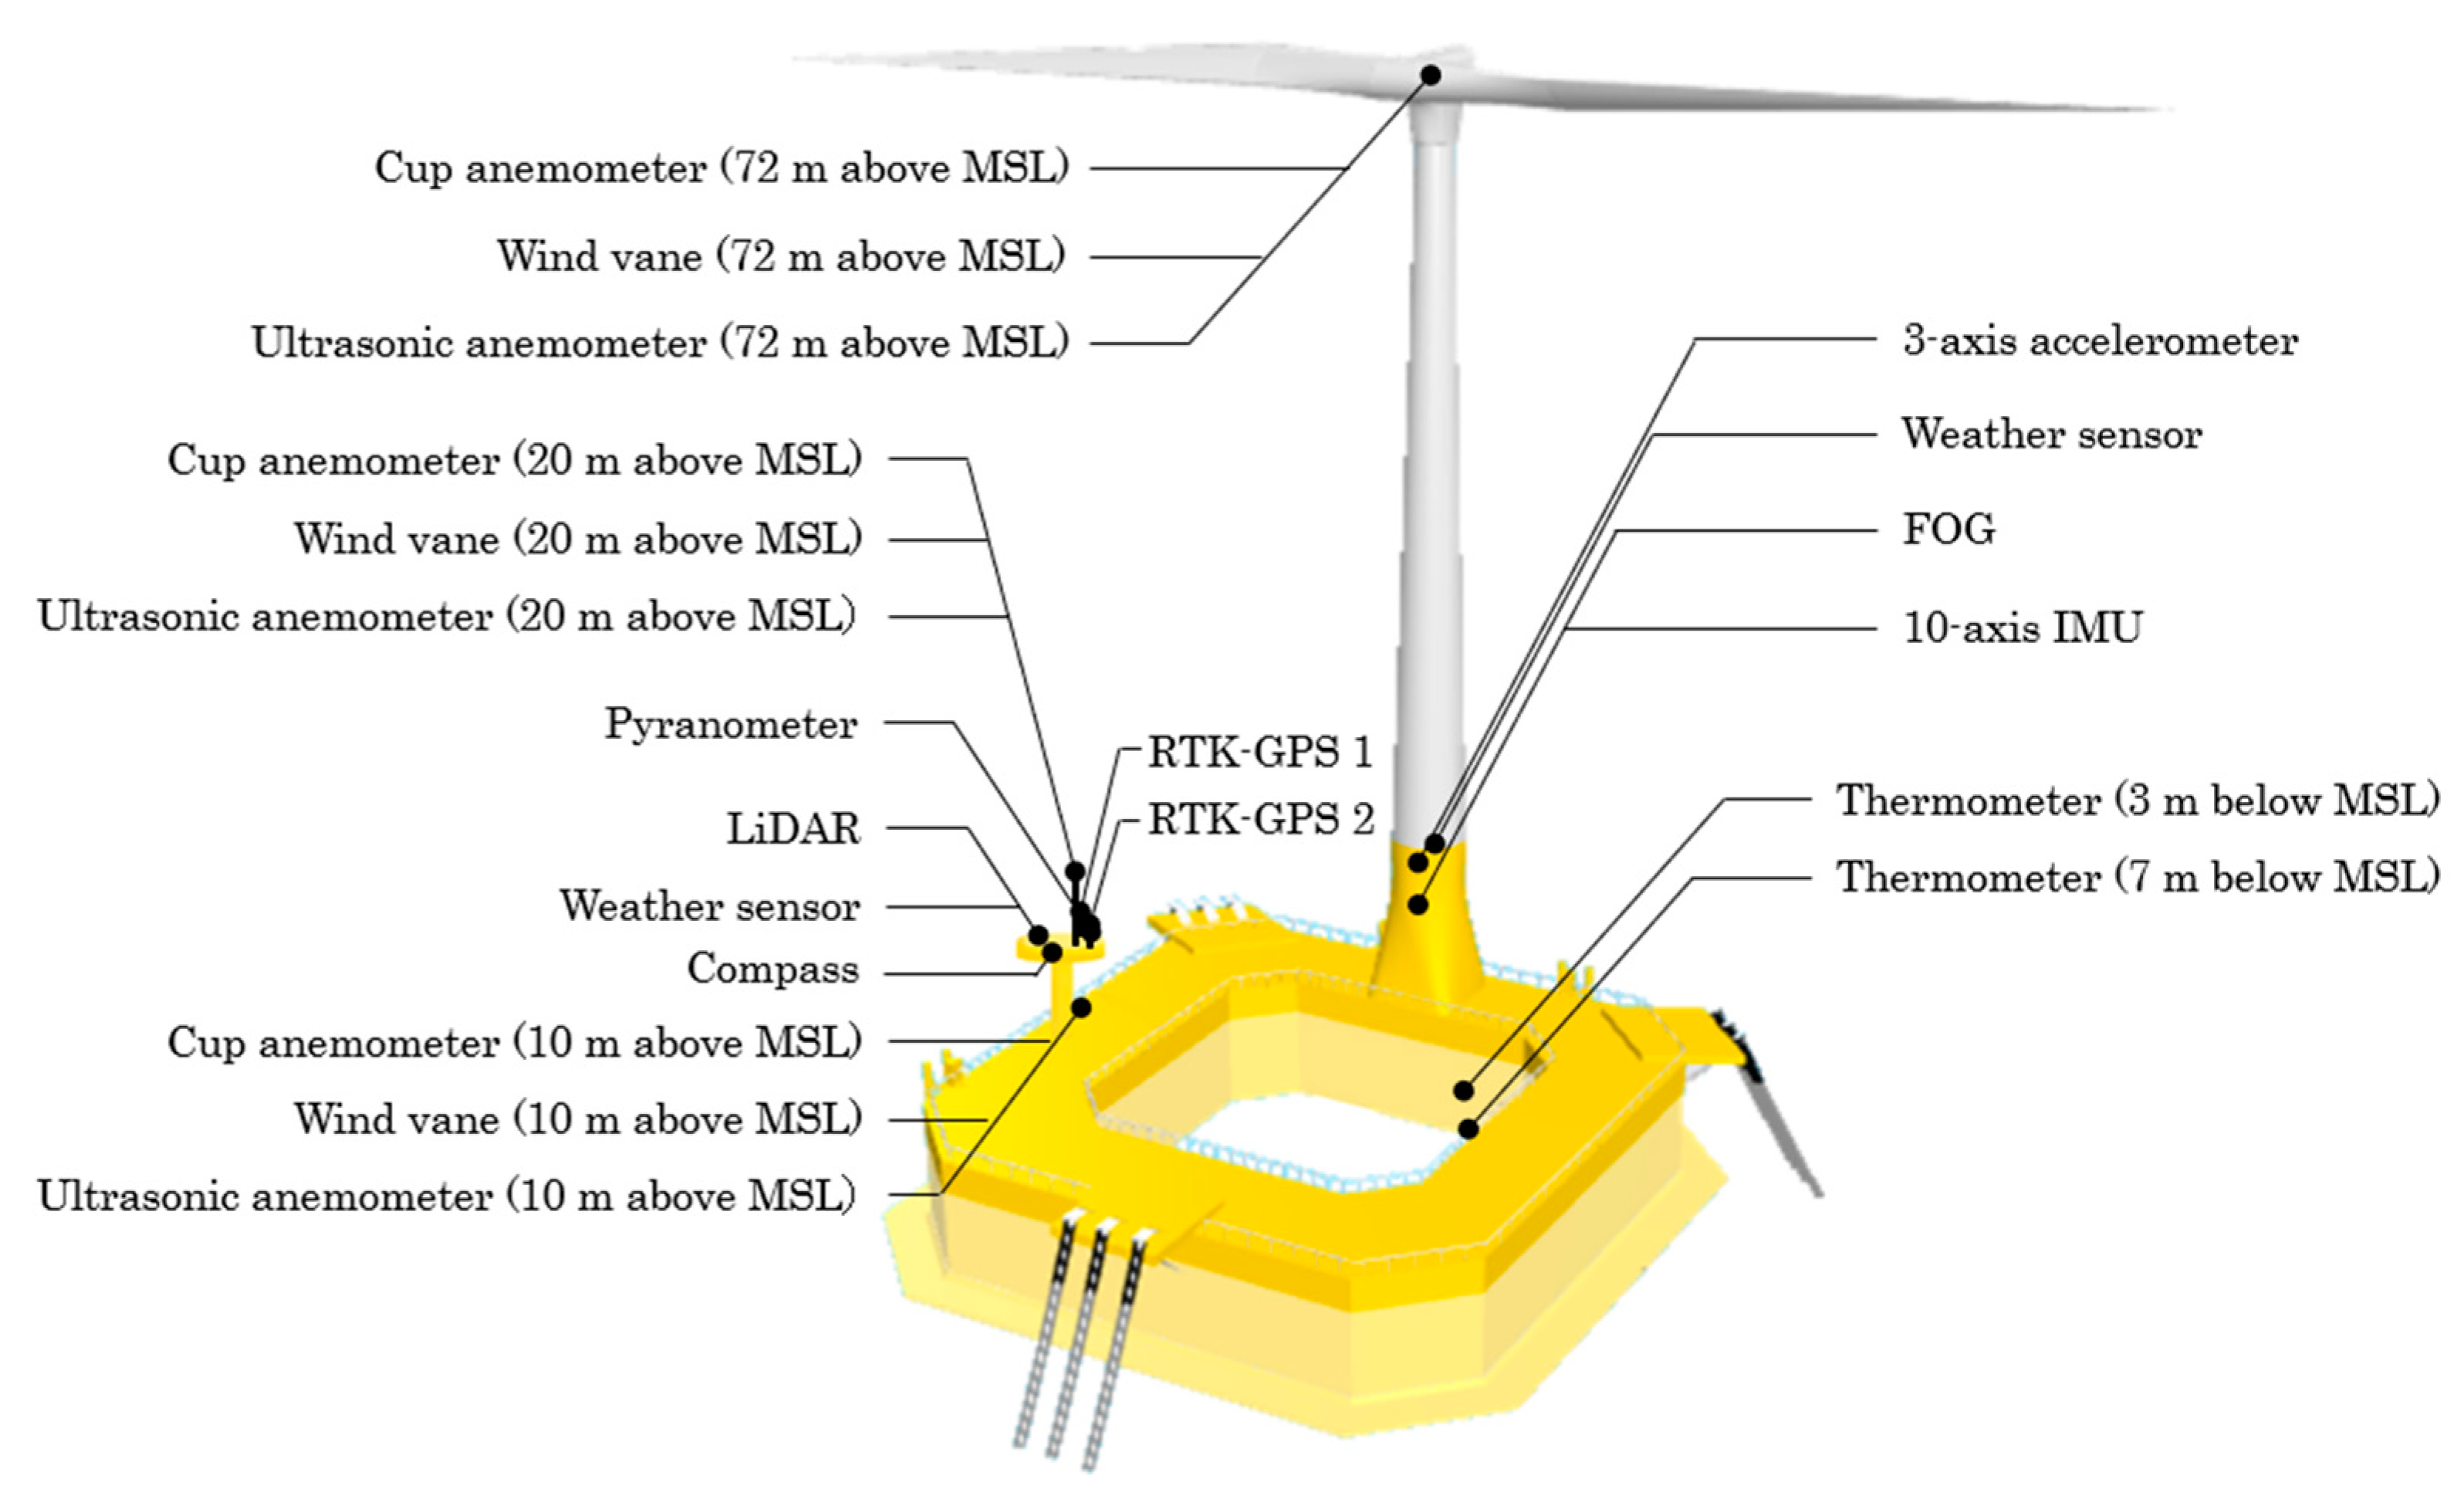
2.5. Measuring Instruments

Several measuring instruments are installed on the barge-type FOWT to monitor its structural and motion response during all environment conditions. Some of the sensors used to measure the environment conditions and motion response of the floating support structure are shown in Figure 5. The measuring instruments mainly used in this study are shown in Table 4.
The environment conditions and the motion data from the sensors were taken at 1 Hz sampling frequency, except for the wave data which were taken at 0.5 Hz sampling frequency. The hourly statistical parameter, such as mean, maximum, minimum, and standard deviation of the environment conditions, were calculated from these measured time series data and then used as inputs to the numerical simulation analysis. Furthermore, to minimize the coupling effect of the translational motion with the rotational motion due to the difference in the sensor locations, the measured motion data from the real-time kinematic Global Positioning System (RTK-GPS) and the gyroscope were transformed to the FOWT’s center of gravity before doing further analysis.

3. Numerical Simulation

A coupled numerical simulation analysis of the floating support structure’s hydrodynamics, tower’s structural response, and wind turbine’s aerodynamics was conducted using the information of the demonstration project’s FOWT described in the previous chapter. The simulation can be divided into hydrodynamic analysis and time domain analysis.

3.1. Hydrodynamic Analysis

The hydrodynamic database and hydrostatic stiffness of the floating support structure were calculated using Aqwa, a BEM potential flow solver developed by Ansys. The software solves the first-order wave loads, the diffraction wave load, the added mass coefficients, and the radiation damping coefficients of the floating support structure at various wave directions and periods. Then, to consider the second-order wave loads on the FOWT, the wave drift Quadratic Transfer Function (QTF) was also calculated using near-field method. These loads at various wave conditions along with the floating support structure’s hydrostatic coefficients were then added to a hydrodynamic database, which will be used to calculate the hydrodynamic loads acting on the FOWT at each time step during the time domain analysis.
The calculation of the hydrodynamic loads acting on the floating support structure is mainly done by firstly assuming the fluid is inviscid and incompressible, the wave amplitude is small, and the motion of the floating support structure is of small amplitude, so that linear hydrodynamic theory can be used. Then, the velocity potential of the fluid flow field surrounding the floating support structure is calculated by using pulsating Green’s function, which utilizes the boundary conditions defined by the wetted floating support structure’s surface, the free surface, and the seabed condition. The calculated velocity potential around each panel of the floating support structure’s mesh are then used to calculate the hydrodynamic pressure acting on it. Finally, the pressure around the whole floating support structure’s mesh is integrated to get the hydrodynamic loads acting on the FOWT’s center of gravity.
Regarding the analysis’ parameters, the wave conditions were set with an interval of 22.5° and the wave periods were set from 2.5 s to 70 s. Then, to avoid standing waves on the moonpool, an external lid with 5% damping factor and 26.2 m gap was placed on the moonpool at the SWL. In the hydrodynamic analysis, the skirt is modeled without brackets. The reason for this is because BEM analysis could not capture the mainly viscous effect caused by the brackets. The viscous damping effect of the skirt and brackets is to be considered with additional damping coefficients in the time domain analysis. The mesh used in the hydrodynamic analysis is shown in Figure 6. The lid elements on the moonpool is indicated by the red arrow inside the figure.

3.2. Time Domain Analysis

In the time domain analysis, the hydrodynamic and hydrostatic loads on the floating support structure, the aerodynamic loads on the wind turbine’s blades, and the structural response of the tower, the blades and the mooring lines were calculated at every time step to solve the motion response of the FOWT by using Orcaflex software developed by Orcina Ltd., Ulverston, UK coupled with FAST software developed by the National Renewable Energy Laboratory (NREL), Golden, CO, US.
To calculate the hydrodynamic loads acting on the FOWT in the time domain analysis, the hydrodynamic load database, the hydrostatic stiffness, and the wave drift QTF, which were calculated by the BEM hydrodynamic analysis, were imported and were used to calculate the hydrodynamic loads at every time step. Then, to consider the effect of the viscous loads on the skirt and its brackets, additional linear and quadratic damping coefficients and several heave plates modeled with Morison drag elements were used. The value of those additional damping coefficients and the heave plates’ drag coefficients were obtained from the wave tank experiments conducted in the preliminary design phase of the project [9] and were further adjusted using the actual measurement data during the typhoon Tapah.
The wind load acting on the blades is calculated at each time step by using Blade-Element/Momentum theory. The wind load calculation is coupled with the structural response of the tower and the motion of the FOWT. The instantaneous blade-element’s position and velocity and its surrounding wind speed at each time step is considered during the calculation of the wind load. The calculated wind load on each element of the blade is transferred along the blades to the hub, the nacelle, the tower, and ultimately to the floating support structure. Then, considering the hydrodynamic loads on the floating support structure, wind loads on the wind turbine, and the forces from the mooring lines, the FOWT’s motion is calculated. Here, the tower and the blade structures were modeled using the dimension and mass of the demonstration project’s barge-type FOWT, while the nacelle was modeled with a point mass and inertia matrix attached to the top of the tower. Meanwhile, the mooring system was modeled using analytic catenary lines and the floating support structure was assumed to be rigid. The simulation model created for the time domain analysis is shown in Figure 7.

4. Environment Condition

The environment condition measured by the barge-type FOWT during typhoon Tapah is investigated in this study. The hourly statistical environment data from 22 September 2019 12:00 to 23 September 2019 12:00 GMT + 9 is summarized in Table 5. These hourly statistical environment conditions were used as simulation inputs to the time domain numerical analysis. The high-frequency wind time series were re-generated using Kaimal spectrum using the average wind speed and the 1-h turbulence data, while the waves were re-generated using ISSC spectrum using the hourly significant wave height and significant wave period from the measurement. The wave spreading was modeled using cosn spreading function. Here, a wave spreading exponent n of 8.0 is assumed for all cases. The generated wave train in the form of directional wave spectrum was used to recreate the sea surface’s time series and shall be compared with the measured wave spectrum to ensure the accuracy of the time domain simulation. During the whole duration of the typhoon, the wind turbine was in idle condition.
For the spectral analysis of the motion response, the data during 23 September 2019 03:00–04:00 shall be used. While for the statistical analysis, only the hourly standard deviation of the motion response data will be used.

5. Results and Discussion

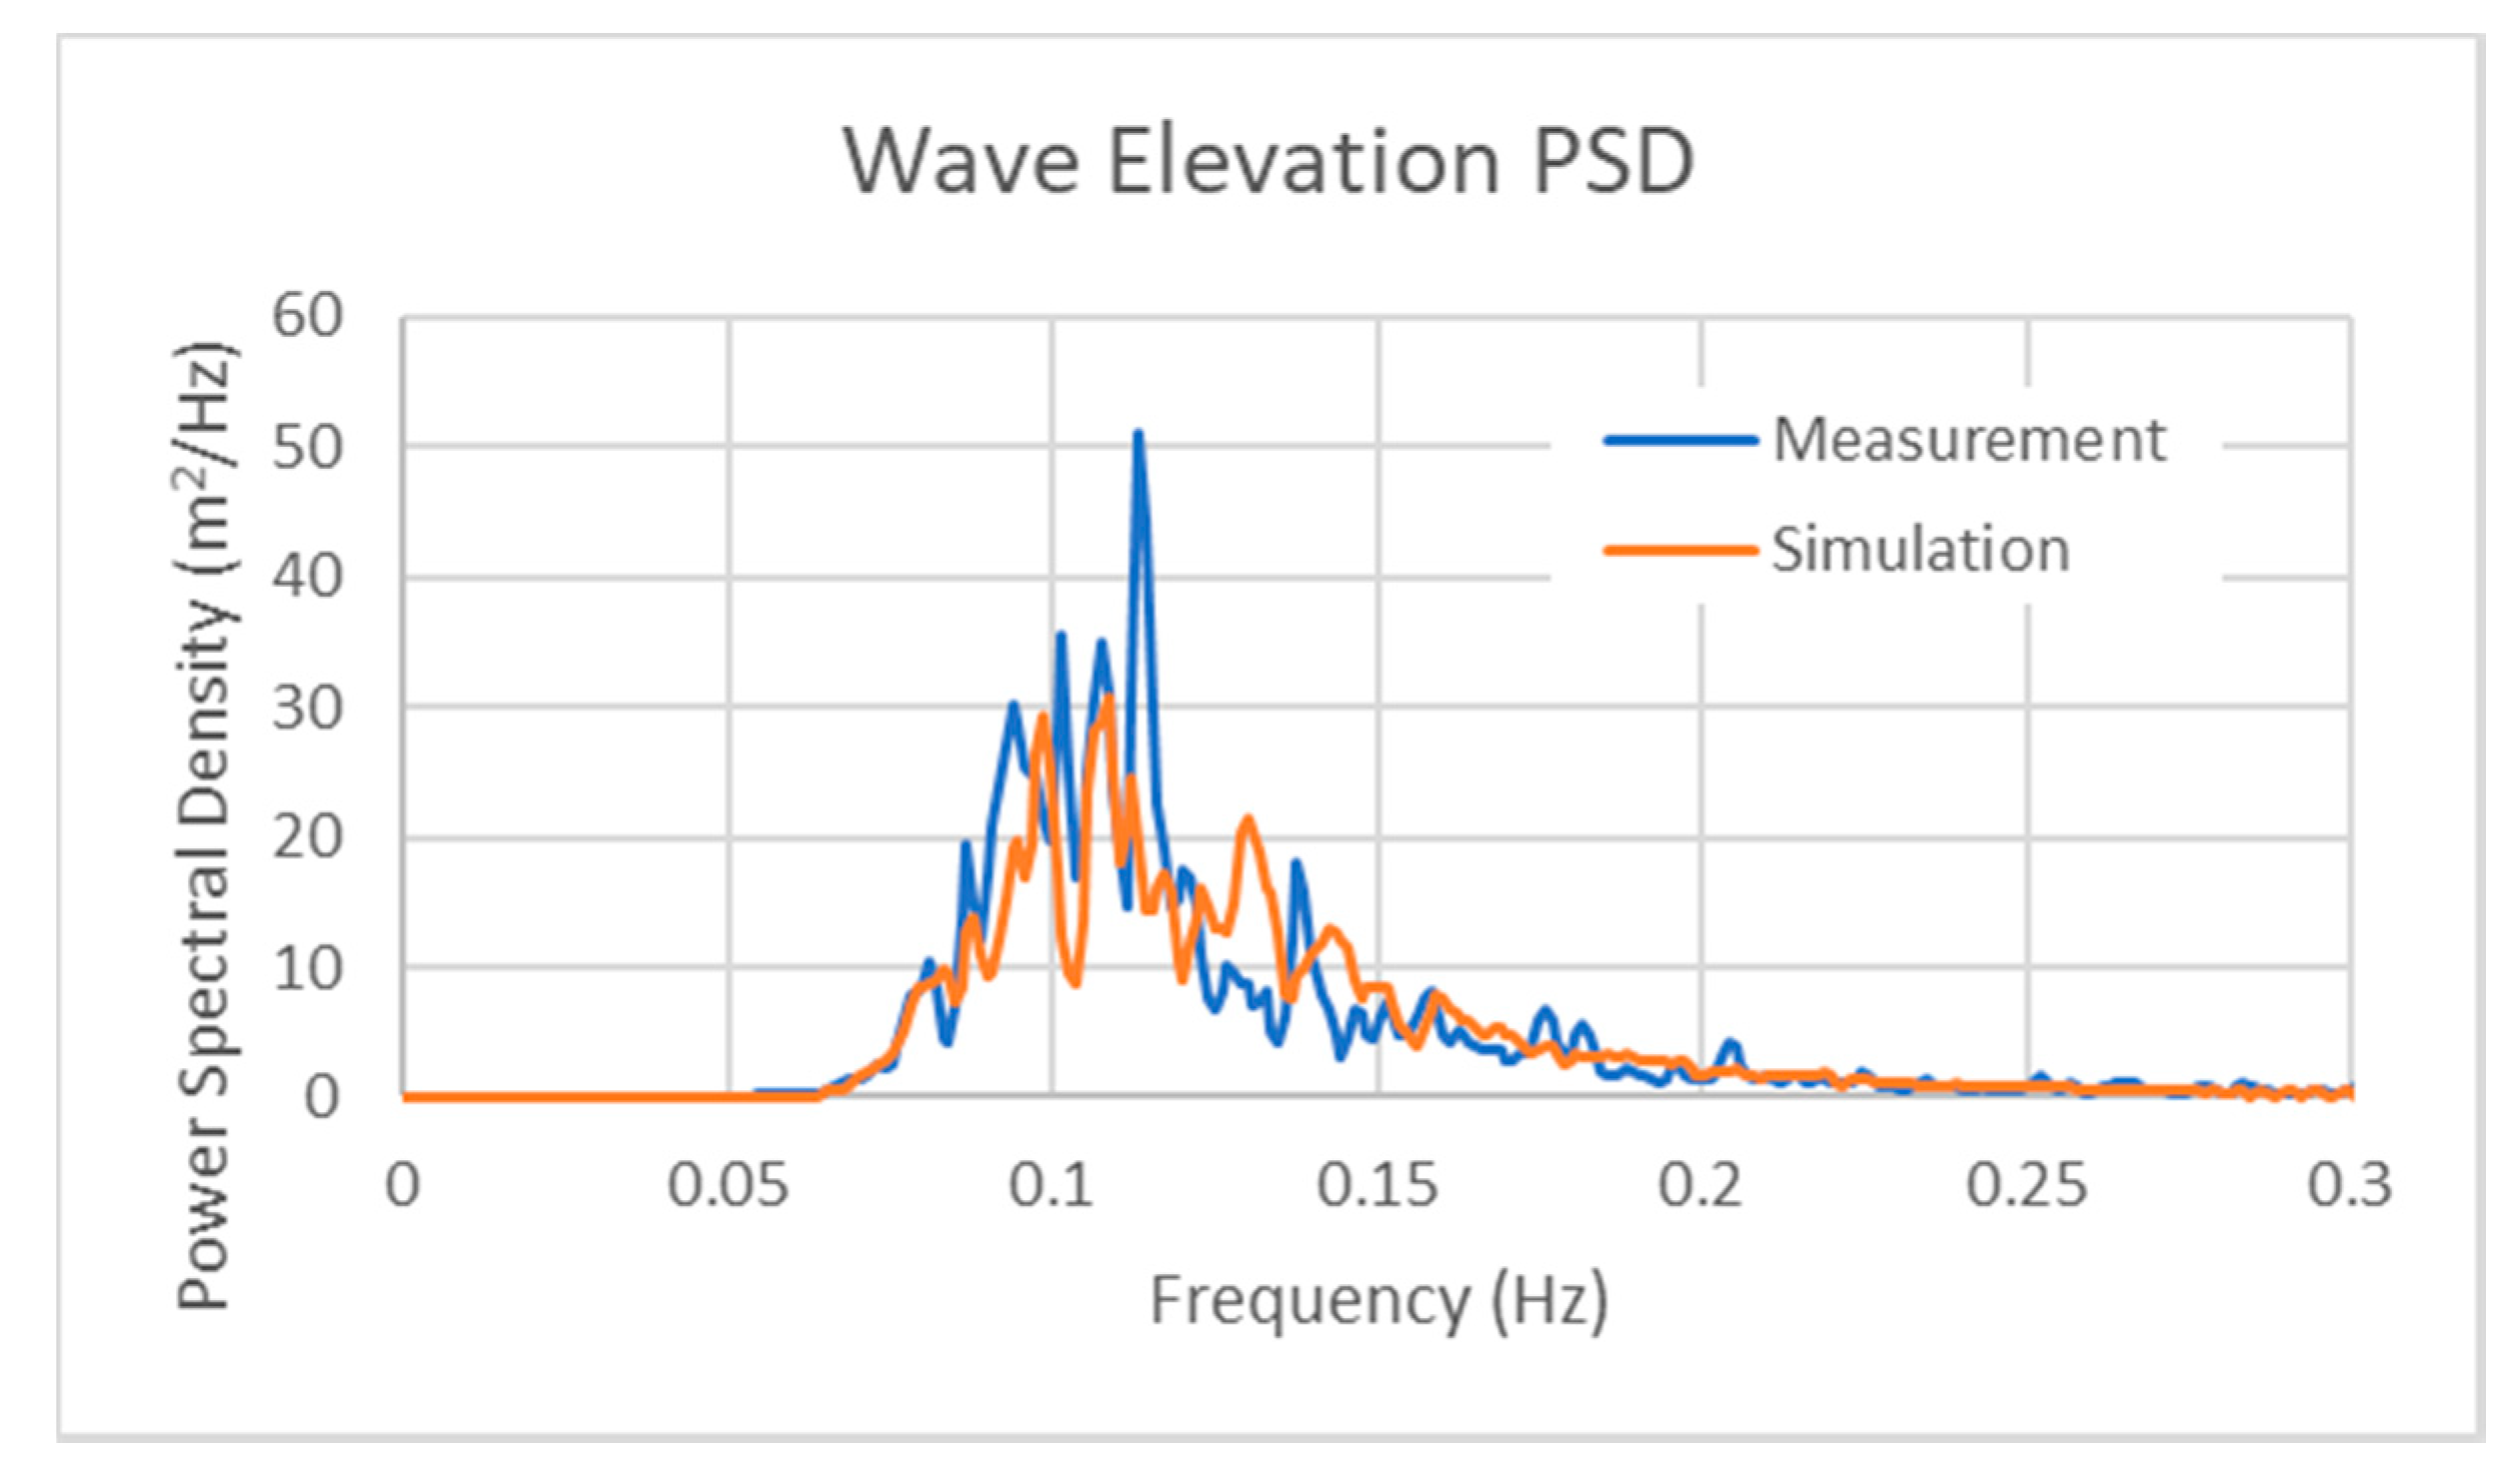
5.1. Power Spectral Density

The power spectral density (PSD) of the wave elevation and 6 DOF the barge-type FOWT motion response during 23 September 2019 03:00–04:00 are shown in Figure 8 and Figure 9, respectively. Although different wave time series was used in the time domain analysis, the spectrum of the wave elevation is roughly the same as the wave elevation during the typhoon. This ensures that the wave train acted on the barge-type FOWT in the simulation and in during the actual operation are statistically similar.
Although the best practice is to input the wave spectrum directly into the numerical simulation model, only the significant wave height, the significant wave period, and the wave spreading coefficient were inputted to the numerical simulation due to the availability of the measured wave data and to ensure that the generated wave trains include wave spreading.
The surge and sway PSD graphs show that the measured surge and sway response has much lower frequency than the wave, with peak at 0.011 Hz (90 s). It also can be observed that surge and sway responses are quite identical. However, there is a clear peak frequency shift between the measurement and the simulation. The surge response’s peak frequency in the simulation is 0.0088 Hz (113 s) and sway is at 0.0029 Hz (345 s).
Another peak frequency shift of the simulation response is also observed in the heave PSD graph, 0.106 Hz (9.43 s) for the simulation and 0.094 Hz (10.63 s) for the measurement data. The overall distribution of the simulation’s heave PSD also shows more response in the higher frequency compared to the measured data. In the simulation’s heave PSD, a small bump at around 0.01 Hz (100 s) to 0.03 Hz (33 s) is also observed. This indicates that the heave response is coupled with the surge, sway, or yaw quite strongly in the simulation.
The spectral response of roll and pitch of the simulation and measurement are in a good agreement. Both the power spectral density and the frequency distribution of the simulation match the measurement data. Meanwhile, the yaw response of the simulation shows similar frequency shift to the surge and sway response to the lower frequency compared to the measured one.
The low-frequency responses of the surge, sway, and yaw measurement data indicates that these modes are mainly affected by low-frequency forces, like wave drift force or mooring restoring force. In these modes, high-frequency response is hardly visible, which indicates lower influence from the incoming wave force. On the other hand, the motion response of the roll, pitch, and heave mode showed high-frequency response, which the peak is about the same as the wave peak frequency. This indicates that the roll, pitch, and heave mode of the FOWT are affected mostly by incident wave forces. Although the high-frequency responses of the simulation and the measurement showed good agreements, the low-frequency responses showed large shifts in peak frequencies. This suggests that the high-frequency radiation and diffraction wave forces are well modeled by the BEM hydrodynamic analysis, but the low-frequency wave drift or mooring forces need more calibration.
Then, the heave PSD of the simulation result showed more heave response at higher frequency of more than 0.1 Hz (10 s) and at lower frequency almost coincident with the surge, sway, and yaw’s peak frequency compared to the measurement data. The possible cause of these differences is that current modeling of the moonpool and the skirt is not adequate to model the entrapped water in the moonpool and the vortex shedding around the floating support structure which may induce viscous drag as described by Beyer et al. [7]. According to Waris and Ishihara on their study of semi-submersible FOWT [11], the addition of heave plates or skirt may decrease the FOWT’s natural frequency in the heave mode. In this study, the moonpool is modeled only as an external damping lid, which functions mainly to prevent the occurrence of standing waves inside the moonpool during the hydrodynamic analysis. Meanwhile, the possible additional damping effect from the moonpool and the skirt is modeled by the additional damping coefficients, as described in the previous chapter. Adding an oscillating water column mechanism into the time series simulation may increase the fidelity of the numerical simulation of a floating support structure with moonpool.
Regarding the peak shifts, compared to the experiment, the surge and sway response’s peak frequencies of the simulation are shifted to the lower frequency, while the heave’s peak frequency is shifted to the higher frequency. This is interesting because, if those shifts are caused inaccurate mass definition of the FOWT, all translational motion modes should be shifted to the same higher or lower frequency direction instead to different directions. To calibrate such shift caused by mass inaccuracy, different additional masses can be added to each direction. In this case, positive additional mass can be added to the heave direction to shift the peak to lower-frequency and negative additional mass can be added to the surge and sway directions to shift the peak to higher-frequency. However, such addition needs the measurement data of the natural periods of the actual FOWT from the decay test.
Another explanation for the frequency shift is because of the difference in the mooring response of the simulation and the actual FOWT. Mooring response differences can occur from the difference between the actual mooring lengths and the design mooring lengths, although only to a degree. The mooring response difference can also be caused by the difference in the actual conditions of the mooring lines. Those conditions include marine growth condition, which affects buoyancy and drag force of the mooring.
For further studies, the cause of the peak frequency’s shift should be confirmed. Calibration of the wave drift forces using wave tank experiment or Computational Fluid Dynamic (CFD) analysis can be investigated to adjust the low-frequency motion responses. Dynamic mooring analysis and inclusion of marine growth may give better mooring response compared to the catenary mooring method due to the difference in the drag force. Then, inclusion of more detailed modeling of the moonpool can also be investigated.

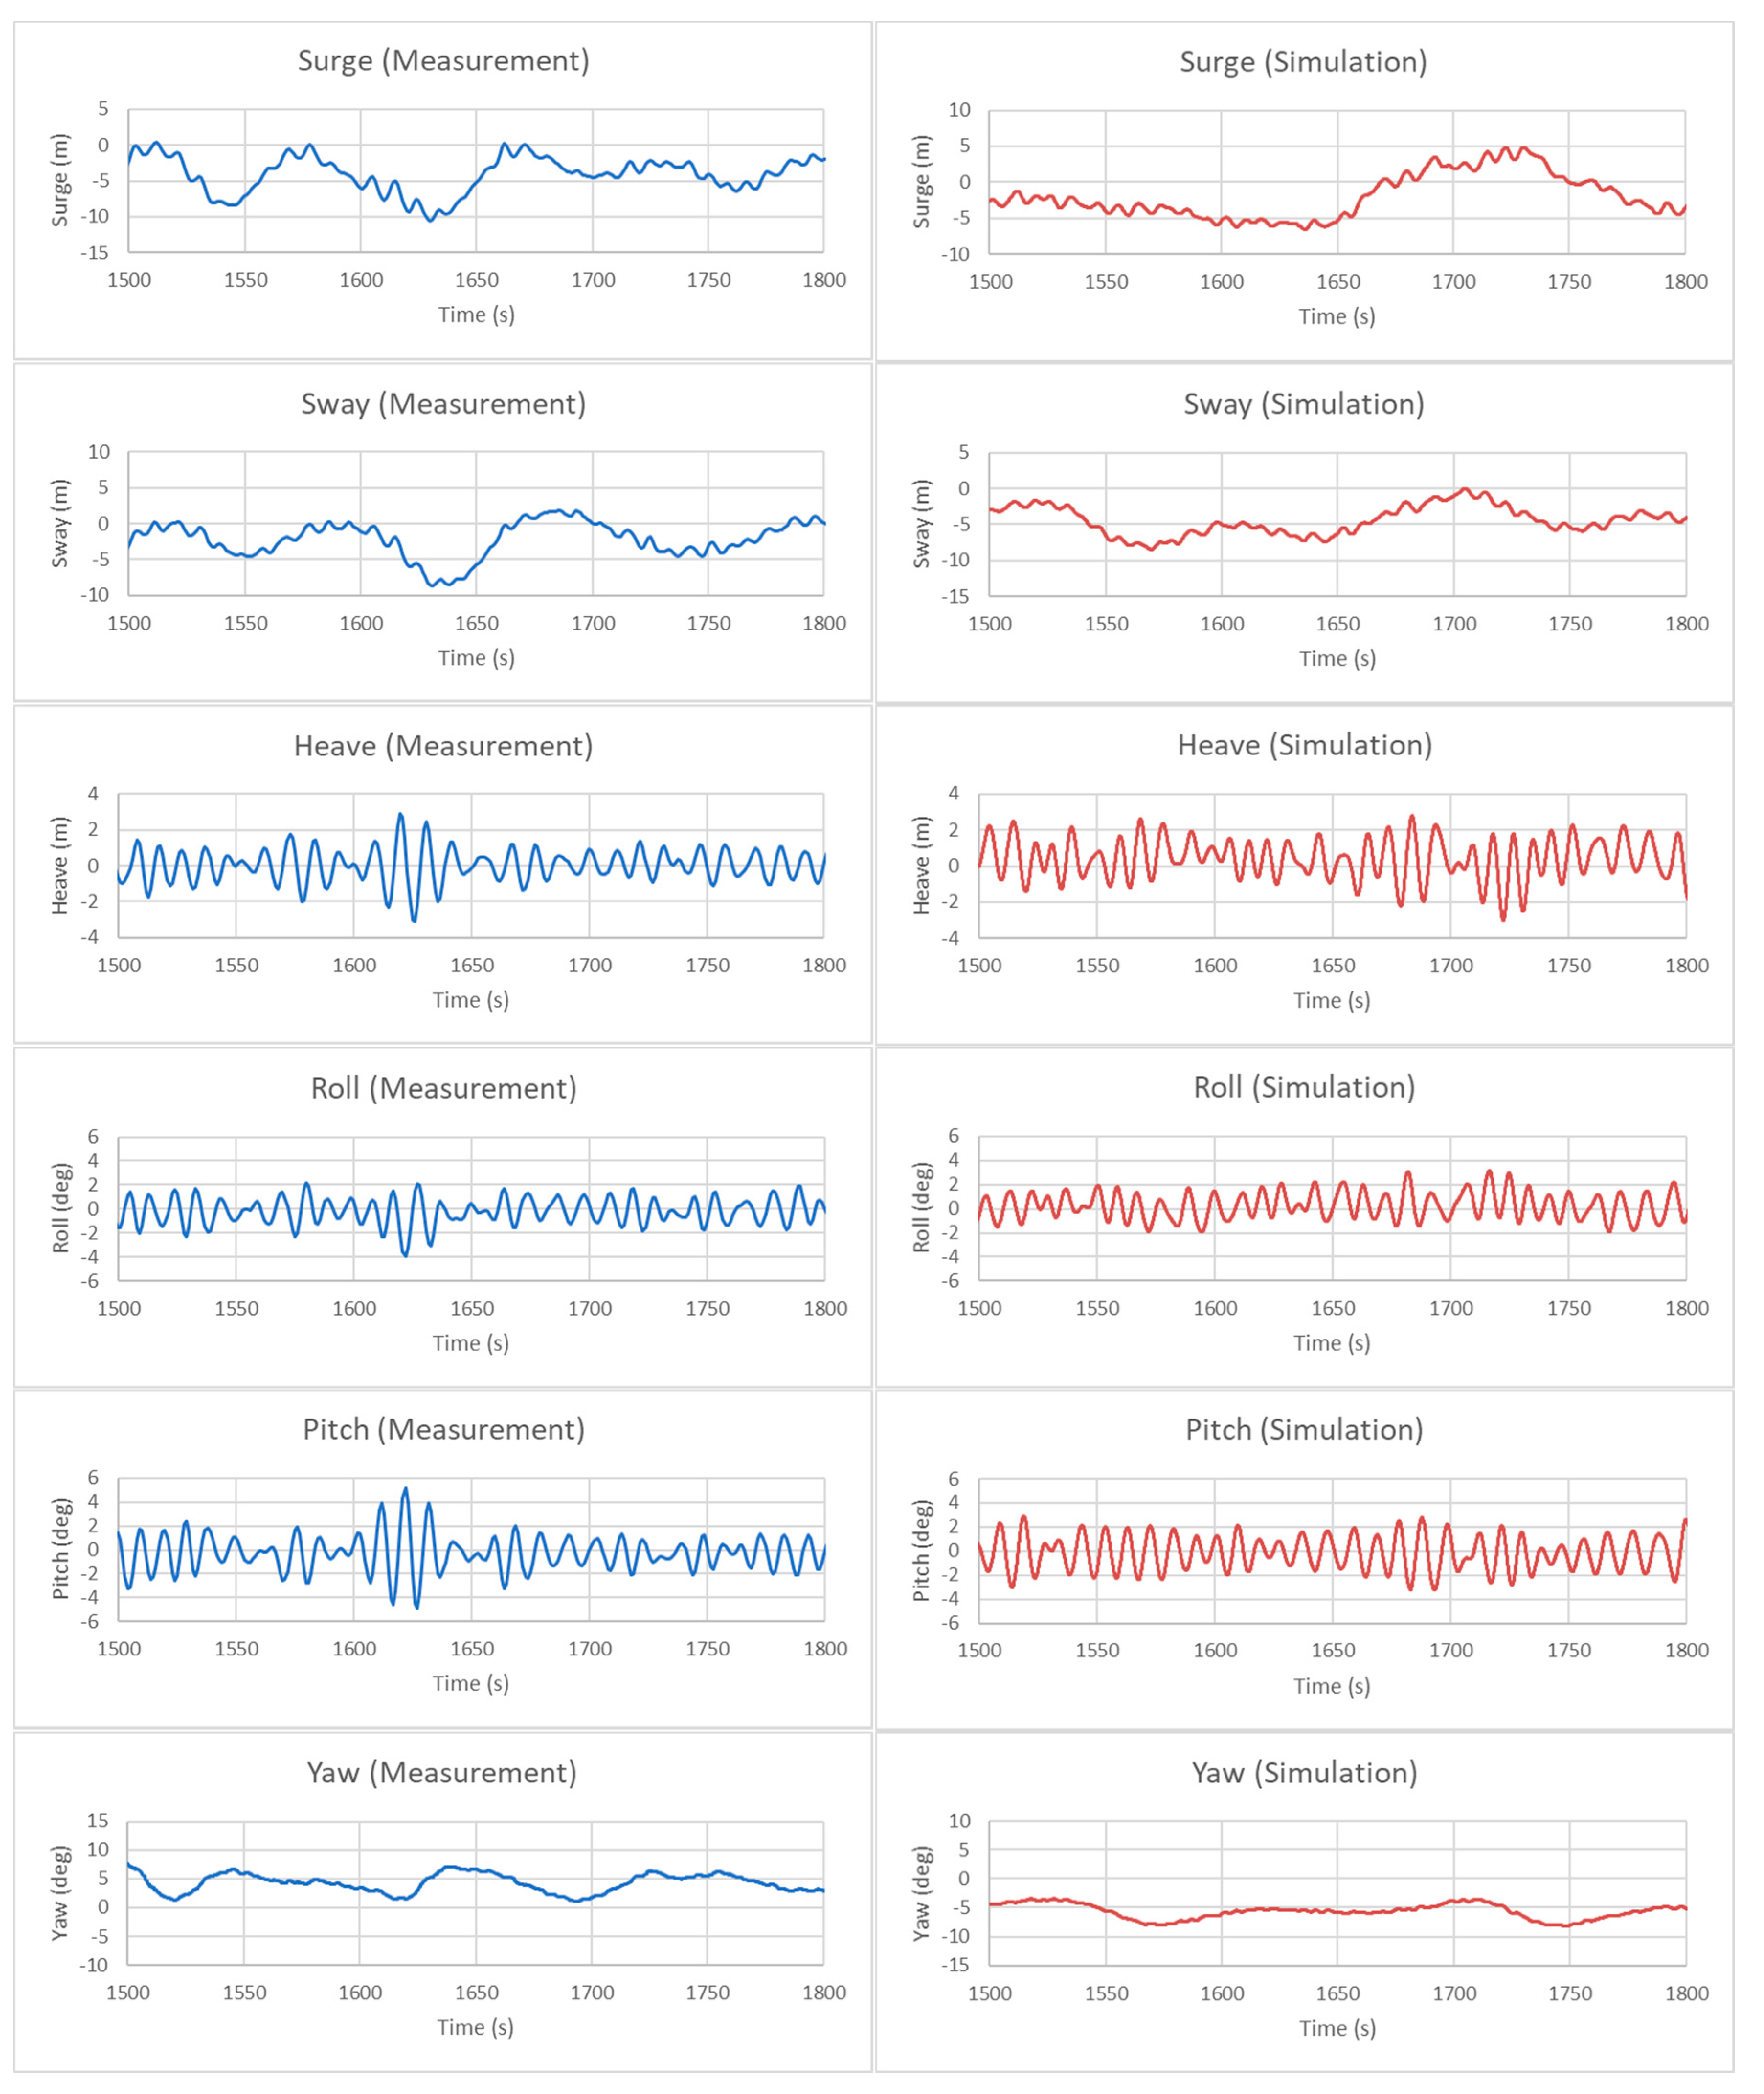
5.2. Sample Time Series During the Typhoon

Time series of the measured and simulated motion response are shown in Figure 10. As the wave train data inputted into the time domain numerical analysis was only based on its spectrum and statistical data, i.e., not an exact wave elevation measured data, the time series of the simulation differs from the measured ones.
Although direct comparison of the time series between the measurement and simulation is quite difficult, the measurement and simulation showed a similar pattern, as indicated by the PSD comparison in the previous sub-chapter.

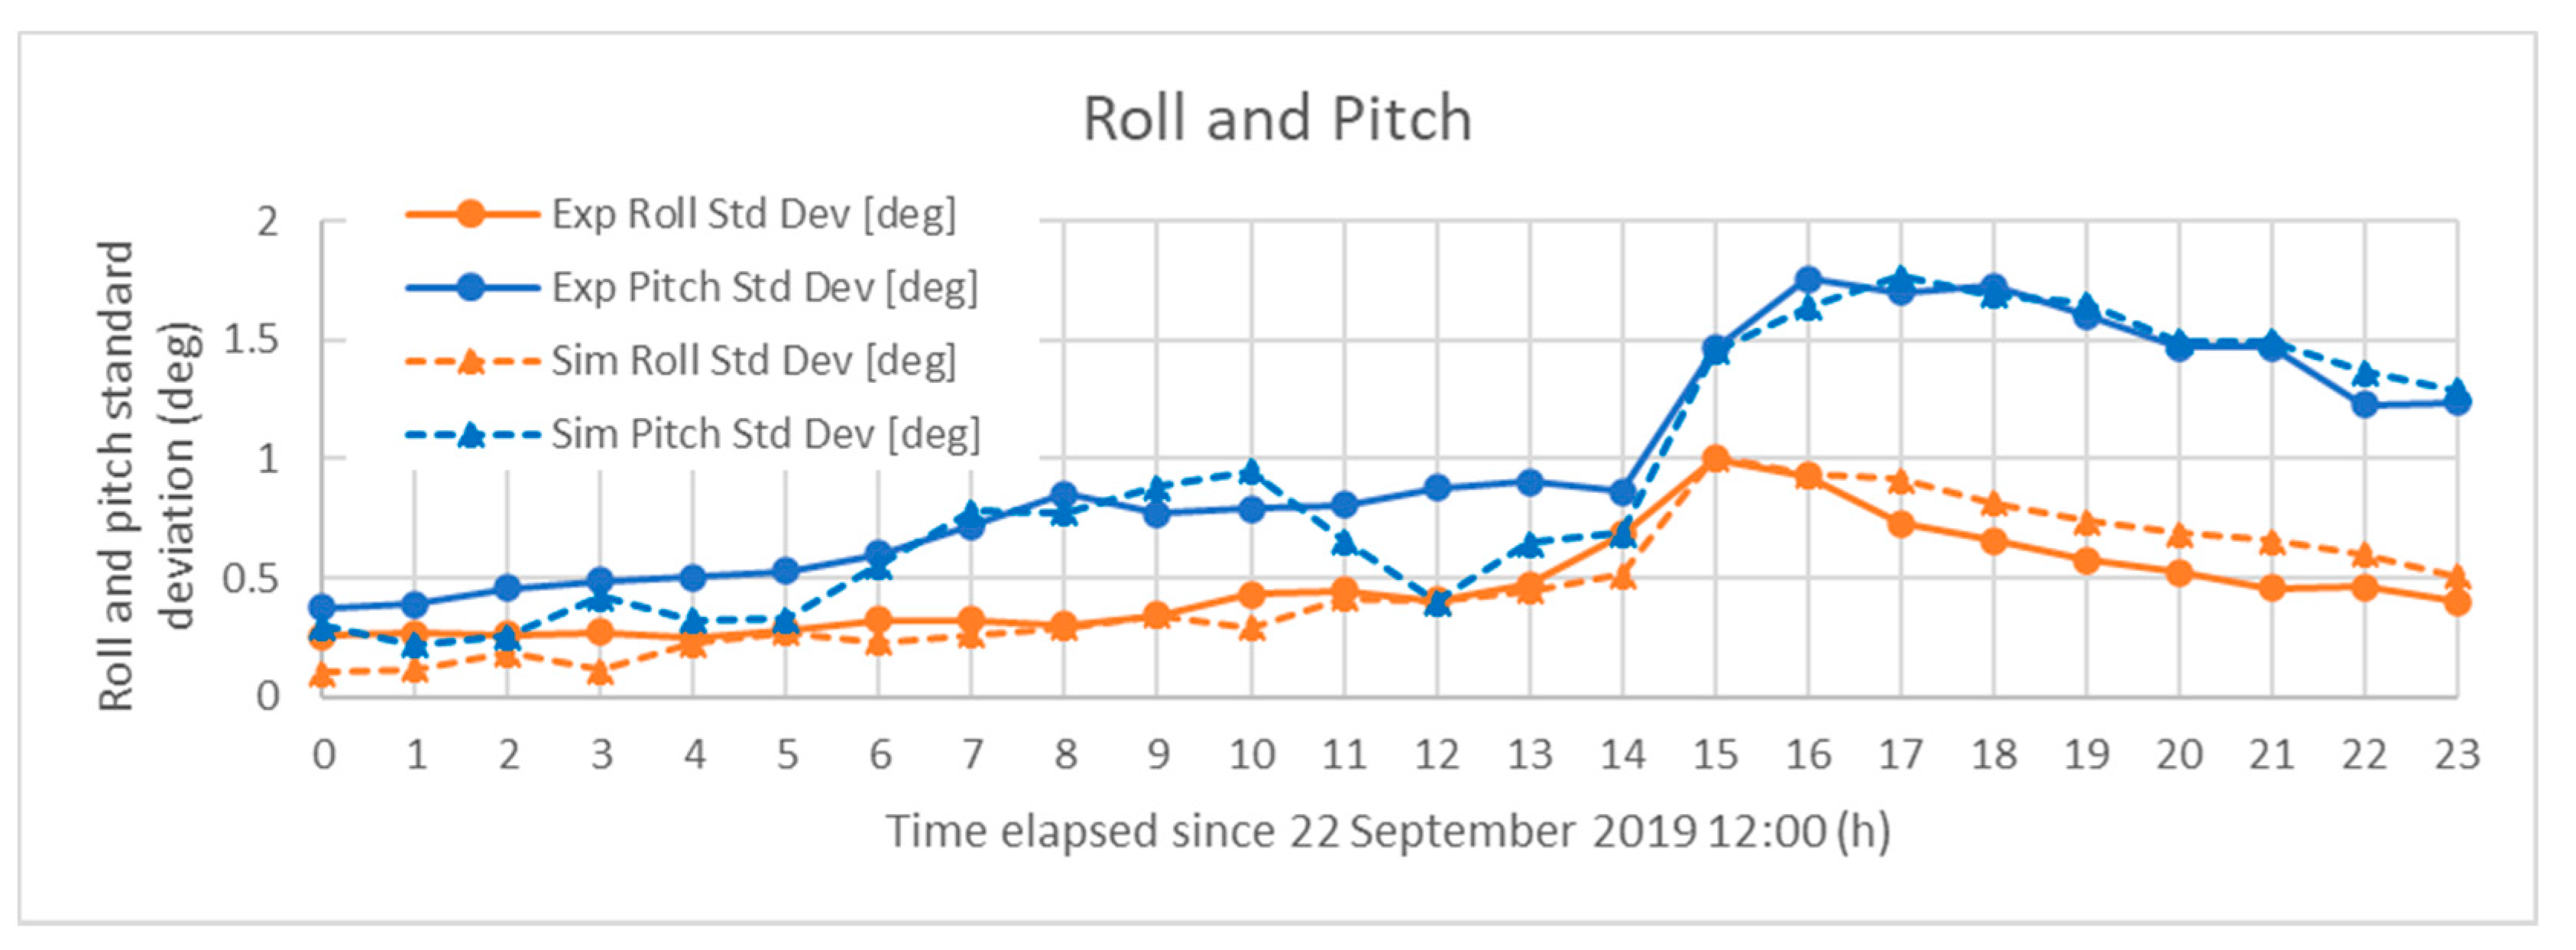
5.3. Hourly Statistical Motion Response of the Barge-type FOWT during 24 H of the Typhoon

The numerical simulations were also done for the time before the typhoon came to the FOWT and right after. The result of those simulations was summarized as hourly standard deviation of the roll and pitch motion response of the barge-type FOWT which is shown in Figure 11. The horizontal axis of the graph shows the time elapsed since 22 September 2019 12:00 in h. The 0h data represents the statistical data of the 22 September 2019 12:00–13:00 period.
Firstly, for the period of the 23 September 2019 03:00–04:00 (15 h marker), which was used in the spectral analysis, the roll and pitch’s standard deviation of the simulation and the measurement showed exact match. For the time after 15 h, in which the significant wave periods were quite long at around 9 s, the numerical simulation and the measurement show a good agreement in general. However, there are bigger differences at the time before 15 h, especially before 6 h and at 12 h. For the time before 6 h, the difference is probably caused by the difference of the magnitude of the effect of the additional linear and quadratic damping coefficients to the FOWT motion’s attenuation. The additional damping coefficients were added to account the viscous effect of the skirt and brackets; however, they were calibrated to the extreme wave conditions instead of calmer wave condition like in the time before 6 h in the graph, which have significant wave periods of around 6 s. Thus, this suggests that different wave conditions require different additional viscous damping coefficients. This presents a challenge to the method of predicting the value of the damping coefficient suitable for each wave condition and how to model it in the simulation.
As for the 12 h data, it is probably caused by transient phenomenon like sudden wave condition change which can be explained by the wave direction during 12 h (23 September 2019, 00:00–01:00) is the only one different than the adjacent 11 h and 13 h.
Regarding the numerical stability of the time domain analysis, all cases that encompassed the 24 h before and after the Typhoon Tapah were successfully calculated without any error. However, as the hydrodynamic analysis assumed that the floating support structure and the wave amplitude are small, the simulation may become unstable or inaccurate as the FOWT’s motion becomes quite large.

6. Conclusions

The power spectral density graphs of the measurement data showed that the surge, sway, and yaw motion response peaked at lower-frequency compared to the waves, while the heave, roll, and pitch peaked around the incoming wave’s peak frequency. The comparison between the measurement and simulation spectral analysis result showed a good agreement in the magnitude of the motion response’s spectrum especially for the roll and pitch of the FOWT. However, some shifts in the peak frequency of the surge, sway, heave, and yaw were also observed. Possible explanations of the surge and sway’s shifts include the difference in wave drift force or the mooring restoring force, while the difference in the heave response may be linked to the effect of the moonpool. Meanwhile, the statistical analysis of the numerical simulation result and the measurement data showed a good agreement at longer significant wave period of around 9 s and a disagreement at shorter significant wave period of around 6 s, which suggests that different wave conditions require different additional viscous damping coefficients. With suitable additional damping coefficients to model the moonpool and skirt’s viscous effect, the BEM-based numerical simulation method presented in this paper in general can sufficiently model the dynamic behavior of the barge-type FOWT in extreme wave conditions. However, further studies confirming the cause of the peak frequency shifts and the dynamic behavior in different wave conditions are needed.

Author Contributions

Conceptualization, K.M.A.K. and H.S.; methodology, K.M.A.K.; validation, K.M.A.K., H.S., H.N., and S.O.; formal analysis, K.M.A.K.; investigation, K.M.A.K., H.S., and H.N.; data curation, K.M.A.K. and S.O.; writing—original draft preparation, K.M.A.K.; writing—review and editing, K.M.A.K., H.S., H.N., and S.O.; supervision, H.S.; project administration, H.N. and S.O. All authors have read and agreed to the published version of the manuscript.

Funding

This paper is based on results obtained from a project, JPNP14022, commissioned by the New Energy and Industrial Technology Development Organization (NEDO).

Conflicts of Interest

The authors declare no conflict of interest regarding the publication of this paper.

References

  1. Ishida, M. Renewable Energy Utilization Report No. 10, Japan’s First Commercial Operational Floating Offshore Wind Turbine; Renewable Energy Institute: Tokyo, Japan, 2017. (In Japanese) [Google Scholar]
  2. Suzuki, H. Fukushima Project and Floating Offshore Wind Turbine System. Bull. Jpn. Soc. Nav. Archit. Ocean Eng. 2018, 81, 32–33. (In Japanese) [Google Scholar]
  3. Imakita, A. 2 MW Floating Offshore Wind Turbine Facility Fukushima Mirai. Bull. Jpn. Soc. Nav. Archit. Ocean Eng. 2018, 81, 34–37. (In Japanese) [Google Scholar]
  4. Komatsu, M.; Hitoshi, K.; Ohta, M.; Hiroshi, T.; Mori, H.; Miyazaki, S. Development of Offshore Wind Turbine Floater That Blends Into Japanese Waters; Evaluation of the Validity for Design and Applied Methods for V-shaped Semi-Submersible Floating Structure. Mitsubishi Heavy Ind. Tech. Rev. 2016, 53, 30–39. [Google Scholar]
  5. Kitakoji, Y. The Construction of Floating Transformer (Fukushima Kizuna) and 5 MW Floating Offshore Wind Turbine (Fukushima Hamakaze) Advanced Spar-type Floating Structure. Bull. Jpn. Soc. Nav. Archit. Ocean Eng. 2018, 81, 44–47. (In Japanese) [Google Scholar]
  6. Jonkman, J.M.; Buhl, M.L., Jr. Loads Analysis of a Floating Offshore Wind Turbine Using Fully Coupled Simulation. In Proceedings of the Wind Power 2007 Conference and Exhibition, Los Angeles, CA, USA, 3–6 June 2007. [Google Scholar]
  7. Beyer, F.; Choisnet, T.; Kretschmer, M.; Cheng, P.W. Coupled MBS-CFD Simulation of the IDEOL Floating Offshore Wind Turbine Foundation Compared to Wave Tank Model Test Data. In Proceedings of the 25th International Offshore and Polar Engineering Conference (ISOPE-2015), Hawaii, HI, USA, 21–26 June 2015. [Google Scholar]
  8. Vijay, K.G.; Karmakar, D.; Uzunoglu, E.; Soares, C.G. Performance of Barge-Type Floaters for Floating Wind Turbine. In Proceedings of the 2nd International Conference of Renewable Energies Offshore (Renew 2016), Lisbon, Portugal, 24–26 October 2016. [Google Scholar]
  9. Kosasih, K.M.A.; Niizato, H.; Okubo, S.; Mitani, S.; Suzuki, H. Wave Tank Experiment and Coupled Simulation Analysis of Barge-Type Offshore Wind Turbine. In Proceedings of the 29th International Society of Offshore and Polar Engineering Conference (ISOPE-2019), Hawaii, HI, USA, 16–21 June 2019. [Google Scholar]
  10. New Energy and Industrial Technology Development Organization. Floating Offshore Wind Turbine Technology Guidebook. Available online: https://www.nedo.go.jp/content/100891410.pdf (accessed on 25 September 2020). (In Japanese)
  11. Waris, M.B.; Ishihara, T. Dynamic Response Analysis of Floating Offshore Wind Turbine with Different Types of Heave Plates and Mooring Systems by Using a Fully Nonlinear Model. Coupled Syst. Mech. 2012, 1, 247–268. [Google Scholar] [CrossRef]
Figure 1. (a) Location of the demonstration project’s Floating Offshore Wind Turbines (FOWT) in Kitakyushu, Fukuoka Prefecture, Japan; (b) photo of the barge-type FOWT (photo: New Energy and Industrial Technology Development Organization (NEDO)).
Jmse 08 00880 g001
Figure 2. Main dimensions and parts of the barge-type FOWT.
Jmse 08 00880 g002
Figure 3. Brackets on the skirt of the floating support structure (photo: NEDO).
Jmse 08 00880 g003
Figure 4. Mooring configuration of the barge-type FOWT.
Jmse 08 00880 g004
Figure 5. Measuring instruments installed on the barge-type FOWT.
Jmse 08 00880 g005
Figure 6. The mesh used in the hydrodynamic analysis.
Jmse 08 00880 g006
Figure 7. Model view of the time domain analysis.
Jmse 08 00880 g007
Figure 8. Power spectral density of the wave elevation during 23 September 2019 03:00–04:00.
Jmse 08 00880 g008
Figure 9. Power spectral density of the 6 degrees of freedom (DOF) motion response during 23 September 2019 03:00–04:00.
Jmse 08 00880 g009
Figure 10. Time series of the barge-type FOWT motion response from 23 September 2019 03:00:00.
Jmse 08 00880 g010
Figure 11. Hourly standard deviation of the barge-type FOWT’s roll and pitch response.
Jmse 08 00880 g011
Table 1. General specifications of the barge-type FOWT.
ParameterValue
Rated power3 MW
Rotor diameter100 m
Number of blades2
Rotor orientationUpwind
Hub height 172 m
Draught7.5 m
Floating support structure’s dimension (including skirt)51 m × 51 m ×10 m
Water depth53 m
Total mass (incl. ballast and mooring lines)9,858,000 kg
1 Height is measured from still-water level (SWL).
Table 2. Properties of the mooring lines.
ParameterValue
Line length522 m
Line typeStudless chain
Nominal diameter132 mm
Weight in air0.349 t/m
Minimum Breaking Load15,965 kN
Table 3. Specifications of the wind turbine [10].
ParameterValue
Wind turbine makerAerodyn Engineering GmbH
Wind turbine typeSCD3MW–NEDO
Rated power3 MW
Rotor diameter100 m
Hub height 172 m
Number of blades2 blades
Rotor orientationUpwind
Tilt angle
Coning angle
Control schemeVariable speed, individual pitch controlled
Cut-in wind speed3 m/s
Cut-out wind speed25 m/s
Rated rotor speed17.1 rpm
RNA mass133,000 kg
1 Height is measured from SWL.
Table 4. Measuring instruments used in this study.
Measurement ItemInstrument Used (Location)
Wind speedCup anemometer (72 m above SWL)
Wind directionWind vane (72 m above SWL)
Wave height, period, and directionUltrasonic wave meter (120 m west of FOWT)
Surge motionRTK-GPS 1 (FOWT’s starboard side deck)
Sway motionRTK-GPS 1 (FOWT’s starboard side deck)
Heave motionRTK-GPS 1 (FOWT’s starboard side deck)
RollFiber-Optic Gyroscope (inside transition piece)
PitchFiber-Optic Gyroscope (inside transition piece)
YawCompass (FOWT’s starboard side deck)
Table 5. Environment condition during typhoon Tapah.
TimeMean Wind Speed [m/s]Wind Direction 1 [°]Turbulence Intensity [%]Significant Wave Height [m]Significant Wave Period [s]Wave Direction 1 [°]
22-Sep-19, 12 h20.13126.68.6%1.336.0614.3
22-Sep-19, 13 h21.18128.67.8%1.315.8630.9
22-Sep-19, 14 h19.63132.311.4%1.346.1142.0
22-Sep-19, 15 h21.45127.413.1%1.316.501.0
22-Sep-19, 16 h23.10126.36.5%1.426.3542.3
22-Sep-19, 17 h24.43129.05.4%1.526.4250.7
22-Sep-19, 18 h22.67135.47.7%1.517.0221.3
22-Sep-19, 19 h21.05140.88.0%1.667.974.0
22-Sep-19, 20 h24.44145.17.9%1.967.6114.7
22-Sep-19, 21 h20.42159.012.9%2.007.9814.7
22-Sep-19, 22 h23.21187.117.2%1.988.182.0
22-Sep-19, 23 h24.57200.111.0%2.197.05323.4
23-Sep-19, 00 h24.44212.411.0%2.136.46301.2
23-Sep-19, 01 h20.72272.914.4%2.217.08318.0
23-Sep-19, 02 h22.80325.99.9%2.656.92318.3
23-Sep-19, 03 h22.76336.29.2%4.698.75322.3
23-Sep-19, 04 h21.10343.110.9%4.939.11332.0
23-Sep-19, 05 h17.34347.014.6%4.839.43336.7
23-Sep-19, 06 h16.28348.914.1%4.859.39338.3
23-Sep-19, 07 h14.77349.213.8%4.209.29340.0
23-Sep-19, 08 h13.47358.812.8%3.919.59340.3
23-Sep-19, 09 h11.918.112.3%3.649.68341.3
23-Sep-19, 10 h11.0311.617.3%3.289.33340.3
23-Sep-19, 11 h11.5213.611.4%3.019.20345.0
1 Wind and wave direction is defined as the direction where the wind or wave is coming from measured clockwise; 0° is coincident with wind or wave coming from north direction and 90° is coincident with wind or wave coming from east.
Publisher’s Note: MDPI stays neutral with regard to jurisdictional claims in published maps and institutional affiliations.

