Article

Microbial Abundance and Enzyme Activity Patterns: Response to Changing Environmental Characteristics along a Transect in Kongsfjorden (Svalbard Islands)

1
Institute of Polar Sciences (ISP), National Research Council (CNR), 98122 Messina, Italy
2
Laboratory of Experimental Oceanology and Marine Ecology, Department of Ecological and Biological Sciences (DEB), University of Tuscia, 00053 Civitavecchia, Rome, Italy
3
Fondazione CMCC-Centro Euro-Mediterraneo sui Cambiamenti Climatici, 73100 Lecce, Italy
4
Institute of Polar Sciences (ISP), National Research Council (CNR), 40129 Bologna, Italy
*
Author to whom correspondence should be addressed.
J. Mar. Sci. Eng. 2020, 8(10), 824; https://doi.org/10.3390/jmse8100824
Submission received: 10 August 2020 / Revised: 16 October 2020 / Accepted: 17 October 2020 / Published: 21 October 2020

Abstract

:
Svalbard archipelago is experiencing the effects of climate changes (i.e., glaciers’ thickness reduction and glacier front retreat), but how ice melting affects water biogeochemistry is still unknown. Microbial communities often act as environmental sentinels, modulating their distribution and activity in response to environmental variability. To assess microbial response to climate warming, within the ARctic: present Climatic change and pAst extreme events (ARCA) project, a survey was carried out along a transect in Konsfjorden from off-shore stations towards the Kronebreen glacier. Total bacterial abundance and the fraction of actively respiring cells (labelled by cyanotetrazolium chloride, CTC), cultivable heterotrophic bacterial abundance, and extracellular enzymatic activities (leucine aminopeptidase (LAP), beta-glucosidase (GLU), and alkaline phosphatase (AP)) were measured. In addition, water temperature, salinity, dissolved oxygen, turbidity, total suspended matter (TSM), particulate and chromophoric dissolved organic matter (CDOM), chlorophyll-a (Chl-a), and inorganic compounds were determined, in order to evaluate whether variations in microbial abundance and metabolism were related with changes in environmental variables. Colder waters at surface (3.5–5 m) depths and increased turbidity, TSM, and inorganic compounds found at some hydrological stations close to the glacier were signals of ice melting. CDOM absorption slope values (275–295 nm) varied from 0.0077 to 0.0109 nm−1, and total bacterial cell count and cultivable heterotrophic bacterial abundance were in the order of 106 cells/mL and 103 colony forming units/mL, respectively. Enzymatic rates <1.78, 1.25, and 0.25 nmol/L/h were recorded for AP, LAP, and GLU, respectively. Inorganic compounds, TSM, and turbidity correlated inversely with temperature; AP was significantly related with CDOM absorption spectra and heterotrophic bacteria (r = 0.59, 0.71, p < 0.05); and LAP with Chl-a, Particulate Organic Carbon (POC) and Particulate Organic Nitrogen (PON) (0.97, 0.780, 0.734, p < 0.01), suggesting that fresh material from ice melting stimulated the metabolism of the cultivable fraction.

Graphical Abstract

1. Introduction

Arctic regions are currently experiencing a rapid global warming due to climate change, with its detrimental effects, such as ice melting, glacier retreat, and/or thickness reduction. Besides rising temperatures and salinity variations, increased water turbidity due to particulate matter inputs from glacier meltwater outflow and river runoff are frequently recorded in coastal or close to coastal ecosystems. The cumulative effects of increased temperatures and UV radiation on aquatic and terrestrial domains as well as on living organisms have been widely studied [1]. At the microbial level, a significant contribution to current knowledge of the distribution, community dynamics, and metabolic activities of marine microorganisms inhabiting Arctic marine ecosystems has been provided by a number of previous investigations [2,3,4,5,6,7,8,9]. Higher phytoplankton growth, bacterial production, and grazing pressure on bacteria were previously observed in sites directly affected by sea-ice melting compared to others that were unaffected, suggesting a substantial influence of the ice melting process on the productivity and the biogeochemistry of Arctic waters [10]. However, rapidly occurring changes induced by environmental variability in polar regions stimulate further research on the response of microbial communities, since the literature available on this issue is still far from being exhaustive [11,12].
Microbial communities, including bacteria and phytoplankton, are potential sentinels of ecosystem changes and anthropogenic disturbances in marine ecosystems [13,14]; they play a key role in relevant processes, such as carbon fluxes and nutrient regeneration, and can also be viewed as amplifiers of global change [15]. Organic matter decomposition, bacterial production, respiration, growth efficiency, and bacterial–grazer trophic interactions are microbially mediated functions [16]. All these ecosystem processes involved in the biogeochemical carbon cycle are regulated by temperature; as a consequence, they are likely undergoing significant changes in a warmer ocean [17]. In this context, monitoring microbial abundance and function could represent a key strategy to improve the comprehension of the history of the ecosystem and to predict the future variability of water biogeochemistry under different global change scenarios [18,19].
Within the Arctic region, the Svalbard Archipelago (Norway) is changing rapidly in relation to climate change; in fact, it is considered a suitable model ecosystem to study climate-driven physical and biological changes, being affected by the inflow of warm, saline, and nutrient-rich Atlantic waters (AW) and the glacial meltwater runoff in its inner part [20,21,22,23]. During the last decade, these conditions have generated both freshwater and sediment gradients, affecting the whole fjord productivity, carbon sequestration, and overall ecosystem status [24]. Due to its peculiar characteristics, Svalbard fjords can therefore represent natural archives that allow us to reconstruct environmental variability and establish baseline values for the changes occurring in the Arctic Ocean [25]. Moreover, connecting land to ocean, Arctic fjords play an important role in climate change in the overall area [26]. Pelagic and sea-ice algae production, as well as blue carbon stock in the shelf seafloor, are important sources of organic matter in these regions [27,28]; in addition, increased meltwater alters organic matter retention and processing, modifying the organic matter pool provided to coastal Arctic microbial communities [9]. Therefore, an understanding of microbial interactions with organic matter across salinity gradients is needed to evaluate the biogeochemical effects of increasing freshwater inputs from glacial melting.
In Kongsfjorden, the dynamics of carbon inputs and fate in both the pelagic and benthic food webs have been investigated only recently [29,30]. Since 2013, the laboratory of biological oceanography of the CNR Section of Messina has been performing an interdisciplinary (chemical and microbiological) research on the variability of the virio-, bacterio-, picophyto-, and micro-plankton communities as well as of the microbial metabolic rates involved in the organic matter decomposition in relation to environmental characteristics of the Svalbard region. The rationale of these studies is that microbial communities in Kongsfjorden undergo variations in their distribution and activity following environmental changes. Previous studies [31] documented the occurrence of alterations in the phytoplankton community structure (even including harmful and toxic species) and the biogeochemical functions in relation to the inflow of Atlantic water and the freshwater runoff from melting glaciers.
To extend current knowledge on the microbial response to Arctic environmental changes, in the framework of the “ARctic: present Climatic change and pAst extreme events” (ARCA) Project (2014–2016) funded by the Italian National Research Council-Department of Earth System Science and Environmental Technologies, an oceanographic cruise was carried out in May 2016 in Kongsfjorden. Environmental and biological characteristics were studied, paying attention to the concentration of chromophoric dissolved organic matter (CDOM), the abundance of total bacteria, and its actively respiring fraction, the cultivable heterotrophic bacteria, and the potential rates of microbial enzymatic activities involved in organic matter decomposition.

2. Materials and Methods

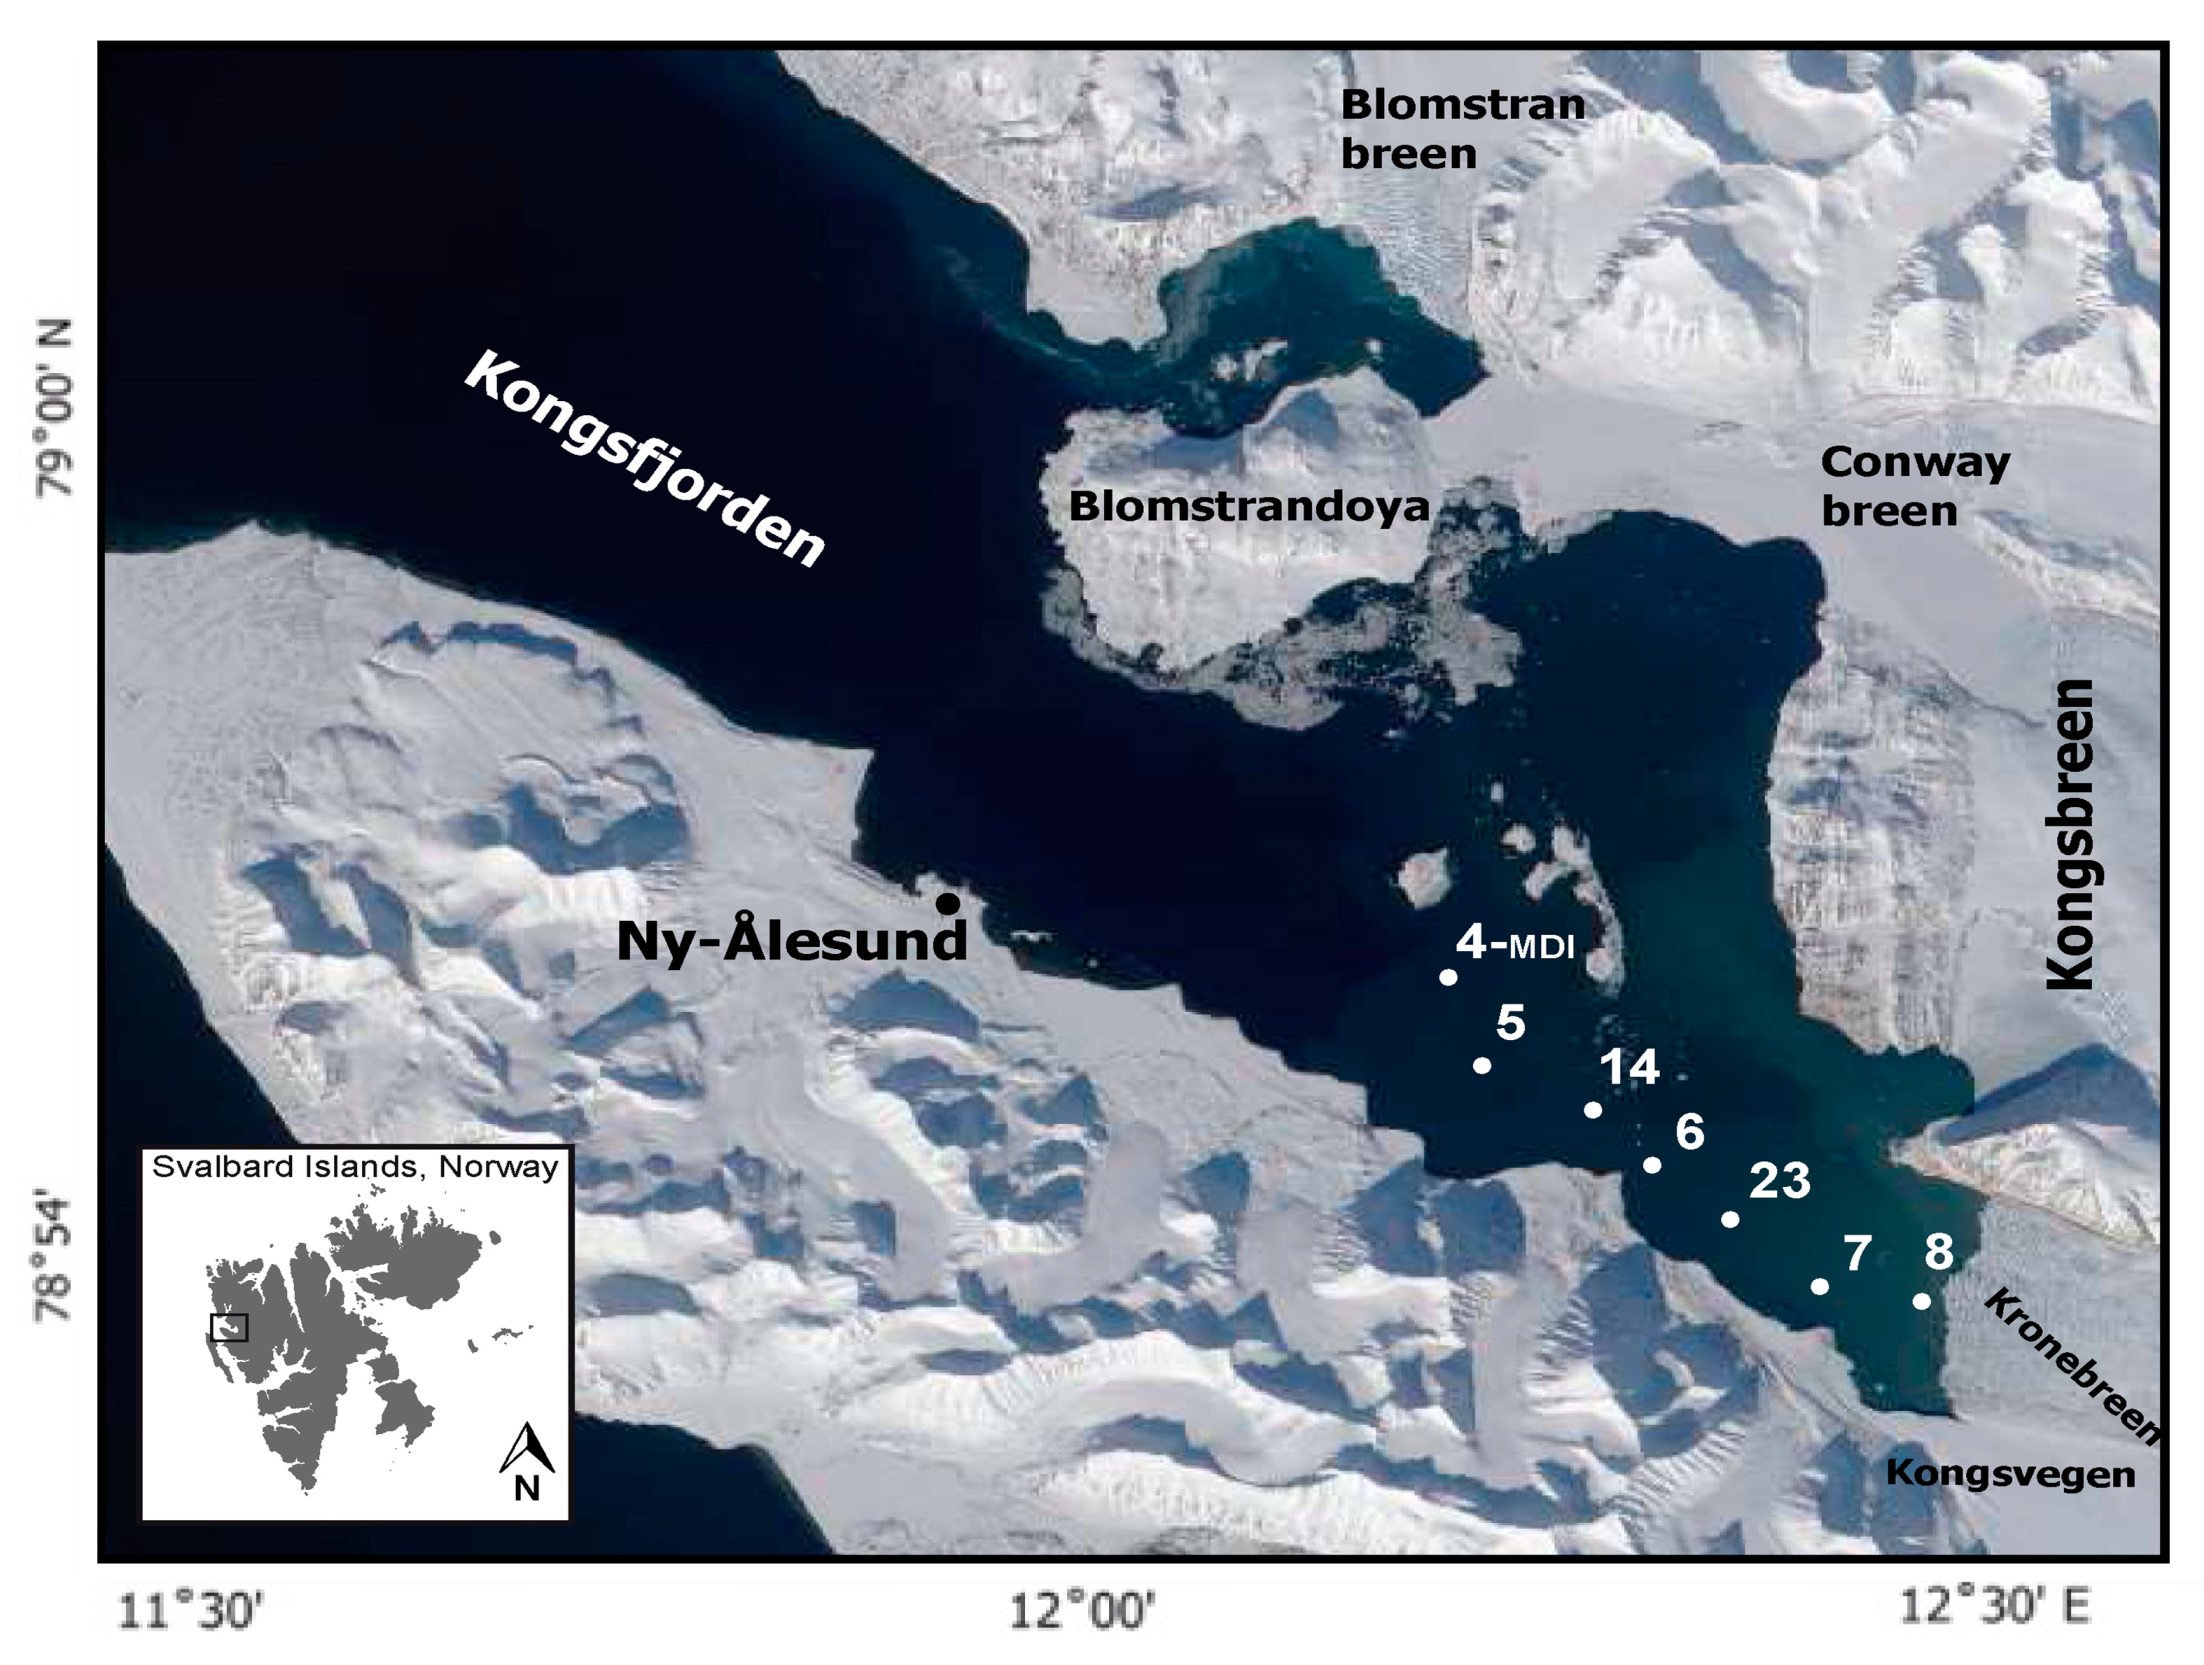
2.1. Study Area and Collection of Samples

Kongsfjorden (latitude 79° N; longitude 12° E) is an open fjord without a sill and is influenced by the melting water from several glaciers (Kongsbreen, Conwaybreen, Blomstrandbreen, Kronebreen, and Kongsvegen) that enrich the waters of the fjord with particles of mineral and organic origin [24,32,33]. Inside the fjord, the distribution of water masses is the result of complex interactions between the bottom topography and coastline, coupled with the forces governing the fjord circulation [21,24]. The dynamics and amounts of Atlantic-derived water, with warm water cores at mid depth [34], depend on the general water circulation in the North Atlantic Sea. In fact, due to the proximity of the Kongsfjorden mouth to the West Spitzbergen Current (WSC) eastward front, as well as of the morphology of the deeper part of the fjord, veins of warm (about 5 °C) and salty (up to 35) waters enter the inner part of Kongsfjorden, reaching the glaciers’ front. The intrusion of warm waters of Atlantic origin is particularly enhanced during late summer, while during fall and winter, the fjord water masses are replaced by fresher and cold Arctic waters [21]. In addition to the WSC inputs, in summer, the freshwater runoff from land and glaciers produces strong gradients inside the fjord, which also led to stratification at shallow depths [28]. Inter-annual variability in the water masses and Atlantic water intrusion, with a net outflow of surface freshwater from Kongsfjorden, has, however, recently been documented [35].
The interface between the ocean and glaciers’ ice tongues is a unique opportunity to study the effects that ice melting may have on the hydrological and biological properties of the ocean.
A survey was performed in Kongsfjorden in May 2016 onboard the vessel MS Teisten (Kings Bay AS). Seven hydrological stations located along a transect in the inner part up to the edge of Kronebreen glacier were sampled at surface (0.5 m) depth using sterile containers (Figure 1). Their geographical coordinates are reported in Table 1. Station 4, close to the mooring Dirigibile Italia (MDI), was sampled at six depths (1, 5, 25, 50, 75, and 100 m), using different 10-liter Niskin bottles mounted on a single rope, which were closed at the chosen depths.

2.2. Physical and Chemical Variables

Temperature, salinity, dissolved oxygen, and turbidity measurements were carried out at all the hydrological stations by a Sea Bird 16 self-recording multiparametric probe (Sea Bird Electronics, Bellevue, WA, USA). Inorganic compounds (ammonium NH4,, nitrites NO2, nitrates NO3, and orthophosphate PO4), chlorophyll-a (Chl-a), total suspended matter (TSM), particulate organic carbon (POC), and CDOM absorption were measured. The concentration of inorganic compounds was determined by filtering water samples on Whatman GF/F glass filters and storing the filtered seawater in a freezer at −20 °C. Analytical measurements were carried out according to Strickland and Parsons [36], while NH4 was measured according to Aminot and Chaussepied’s method [37]. Inorganic N was determined by the sum of NH4, NO2, and NO3. Measurements were performed using a Cary 50 spectrophotometer (Varian SpA, Turin, Italy).
Chl-a concentration was measured fluorometrically [38]. Water samples (1.0 liter) after collection were filtered on Whatman GF/F glass-fiber filter (Fisher Scientific Italia, Rodano, Milan, Italy). The filters were stored at −20 °C, extracted in a 90% acetone solution, and measured with a Cary Eclipse spectrofluorometer (Varian SpA, Turin, Italy) calibrated with known concentrations of pure Chl-a from Anacystis nidulans (Sigma).
For TSM measurements, samples were filtered on pre-weighed and pre-combusted Whatman GF/F filters, rinsed with MilliQ water (Merck Life Science, Milan, Italy) and oven-dried (50 °C) overnight, and then weighed by a precision analytical scale. Total C and particulate organic carbon (POC) were measured after filtration on pre-combusted Whatman GF/F filters (nominal pore size 0.7 µm) that were stored at −20 °C until analysis. Both filters were analyzed using a FISONS NA2000 Elemental Analyzer (EA, Carlo Erba Instruments, Milan, Italy). POC filters were treated with 1.5 N hydrochloric acid (Carlo Erba Reagents, Milan, Italy) to remove the inorganic carbon [39], while inorganic carbon was determined by subtracting to the measured total C content the one of POC and assuming that is composed mainly of calcium carbonate [40].
For CDOM measurements, seawater samples were immediately filtered through 0.22-μm Nuclepore polycarbonate filters (Whatman, Fisher Scientific Italia, Rodano, Milan, Italy) under low pressure and collected in 200-mL amber glass bottles treated with hydrochloric acid (10% final concentration), preconditioned with ultrapure water, and maintained at 4 °C in the dark until the laboratory analysis. Once at the laboratory, CDOM absorbance was measured in the spectral range of 250–700 nm by a UV mini 1240 spectrophotometer (Shimadzu Italia, Milan, Italy) with a 10-cm quartz cuvette, by subtracting the spectrum of Milli-Q water at each spectrum, measured in the same conditions. Absorbance values were converted into absorption coefficients according to Mitchell et al. [41] and Twardowski et al. [42]. The spectral slope (S) of the absorption curve was calculated in the wavelength range 275–295 nm (S275–295) according to Bricaud et al. [43] and Helms et al. [44] to retrieve information about the molecular characteristics of CDOM as well as the origin of CDOM pool.

2.3. Microbial Variables

Direct counts of the total bacterial cell abundance (BA) were performed after staining with 4’6-diamidino-2-phenylindole (DAPI, final concentration 10 μg/mL, Sigma-Aldrich Corporate, Merck Life Science, Milan, Italy) [45] while the fraction of actively respiring cells by labelling with 5-cyanotetrazolium chloride (CTC). Both determinations were performed by observation under an image analysis epifluorescence microscope (AXIOPLAN 2 Imaging microscope, Zeiss, Oberkochen, Germany) equipped with a digital camera Axiocam (Zeiss, Oberkochen, Germany) and AXIOVISION 3.1 software. Cell counts were performed on a minimum of 20 randomly selected fields in two replicate slides. Direct bacterial counts were performed using the following filter sets: G365 exciter filter, FT395 chromatic beam splitter, LP420 barrier filter; CTC counts using the rhodamine-specific filter set (BP546/12; FT580; LP590).
The counts of psychrophilic or psychrotolerant cultivable heterotrophic bacteria, expressed in terms of colony forming units (CFU)/mL, were obtained by spreading of 0.1 mL volumes on marine agar plates (Difco, Fisher Scientific Italia, Rodano, Milan, Italy), incubated at 4 °C for 15 days.
For extracellular enzymatic activity rates, all the samples were pre-filtered on a 250-µm pore-size nylon net to remove zooplankton, potentially interfering with the measurements. Extracellular enzymatic activity rates were determined by incubation of 10-mL sub-samples with increasing amounts (final concentrations ranging from 10 to 320 nmol/liter) of fluorogenic substrates specific for leucine aminopeptidase (LAP), beta-glucosidase (GLU), and alkaline phosphatase (AP), involved in the decomposition of major components of organic matter present in the sea, such as proteins, mucopolysaccharides, and organic phosphates, respectively. The activity of these hydrolytic enzymes provides information on the ability of microbes to have access to nitrogen, carbon, and phosphorus, respectively [46,47]. Particularly, measurements were performed at time 0, immediately after substrate addition, and after incubation for 5 h at the in situ temperature, using a GloMax fluorimeter model Multi JR (Promega Corporation, Madison, WI, USA), equipped with filter sets of 365 and 440–455 nm excitation and emission wavelengths, respectively. It was calibrated with known concentrations of 7-methylcoumarin and 4-methylumbelliferone used as standards. L-leucine-7-amido-4-methylcoumarinhydrochloride, 4-methylumbelliferyl, B-D-glucopyranoside, and 4-methylumbelliferyl phosphate were the fluorogenic substrates specific for LAP, GLU, and AP determinations, respectively. All reagents were purchased from Sigma-Aldrich Corporate (Merck Life Science, Milan, Italy).
All microbial counts and enzyme assays were performed in triplicate and data are reported as the mean values ± S.E.

2.4. Statistical Analysis

Statistical analyses of the environmental and microbiological dataset were performed using the Sigma-Stat software version 3.1 (SYSTAT Software, Inc, San Jose, CA, USA). Pearson correlation analysis was used to explore the correlations among the assayed microbial variables, Cluster and MDS analyses were performed with the statistical software PRIMER (Plymouth Routines in Multivariate Ecology Research) v 6.0 [48].

3. Results

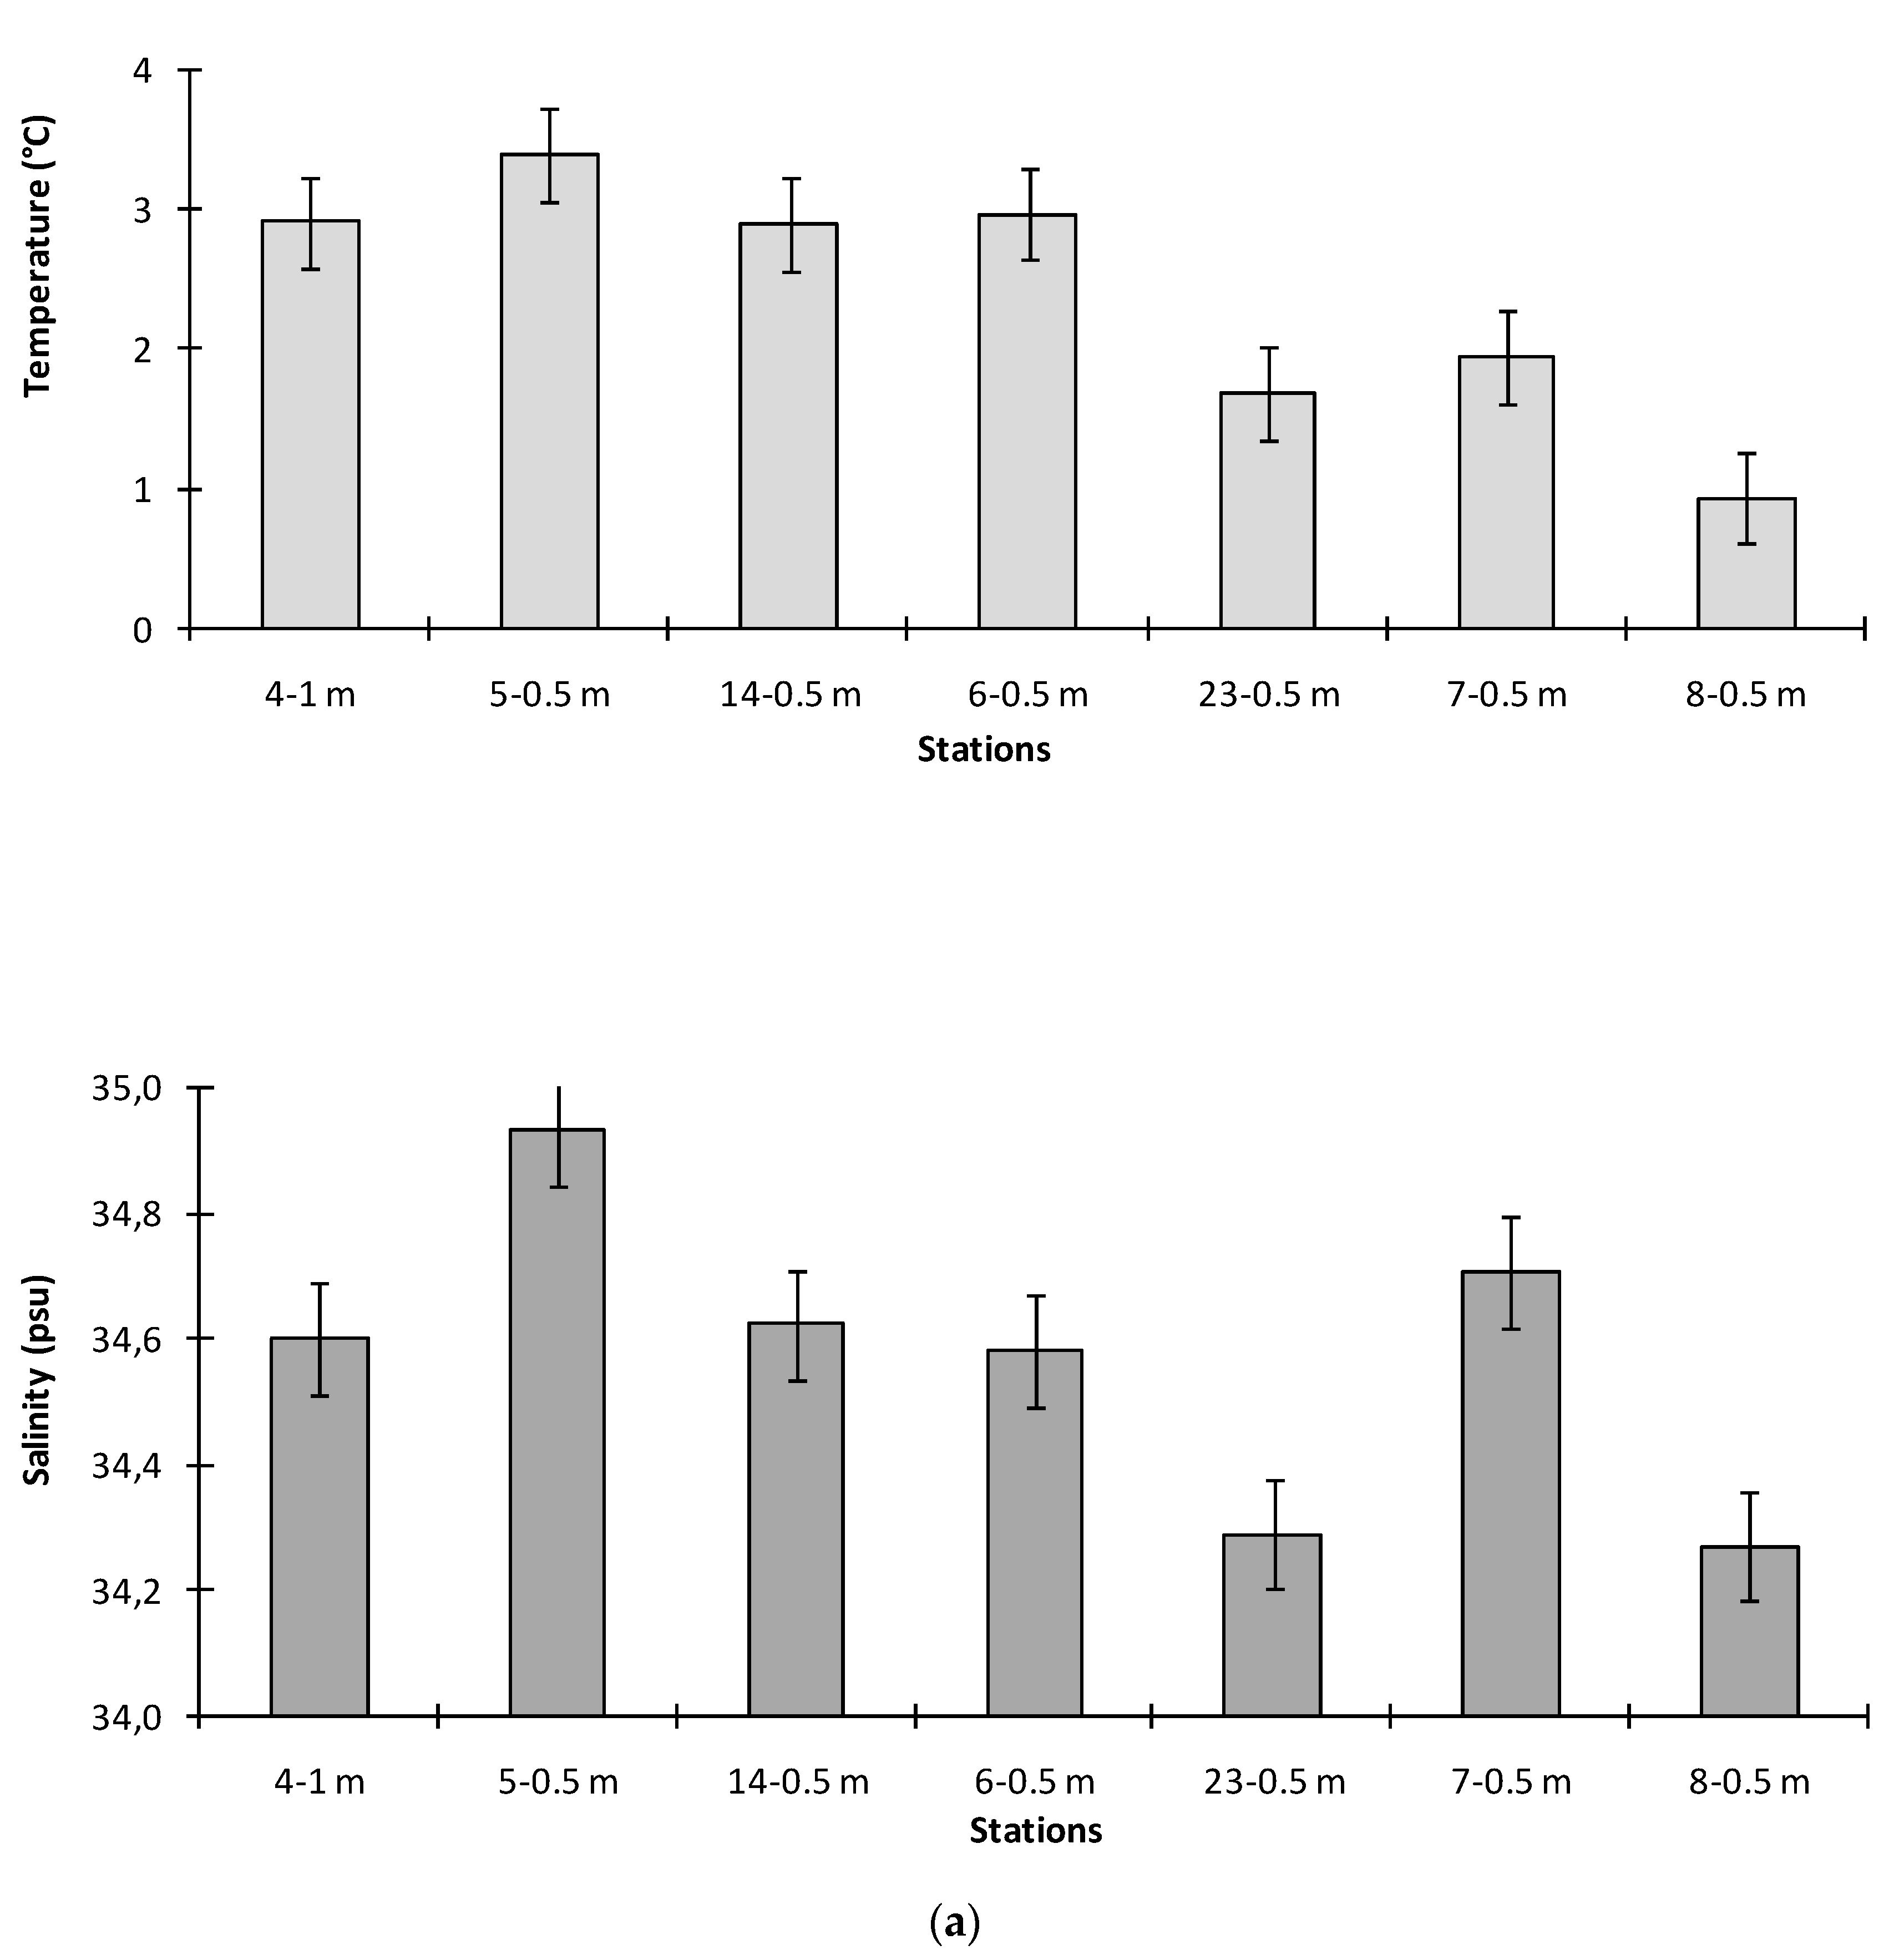
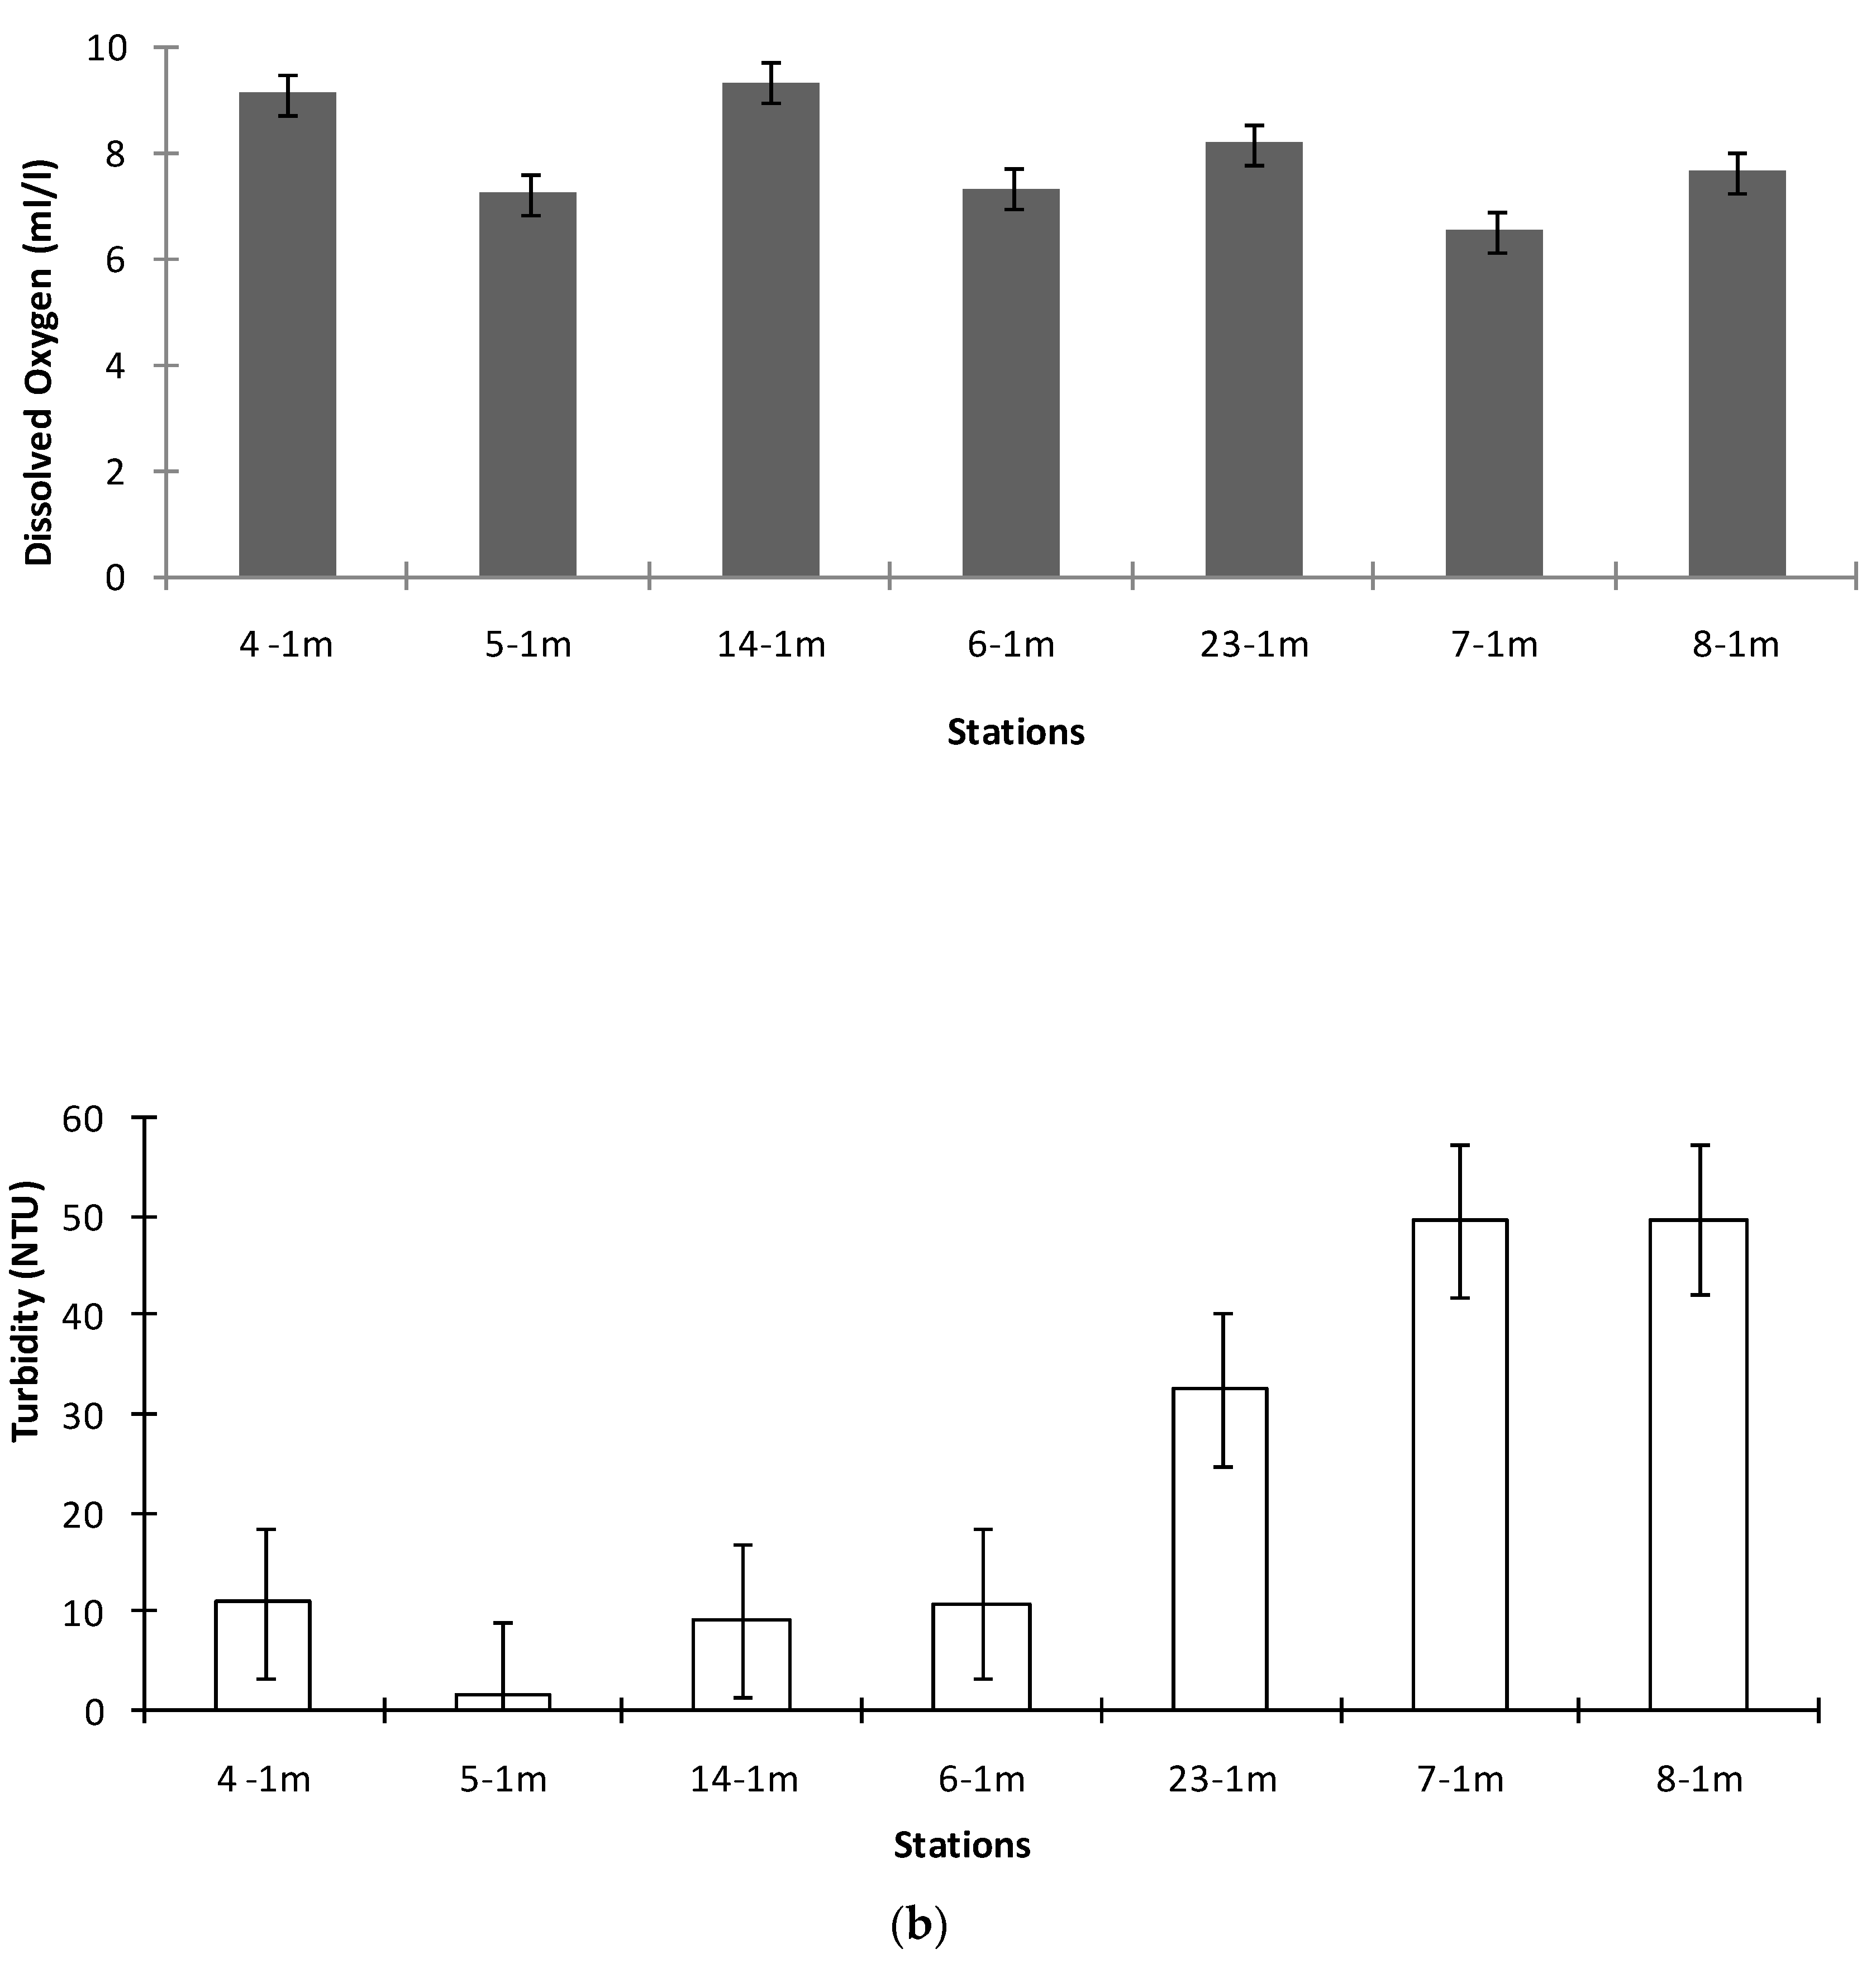
3.1. Environmental Conditions

The distribution patterns followed by the physical and chemical variables measured during this survey are shown in Figure 2a,b. Temperature values were in the range of 0.93–3.38 °C (at st.8 and st.5, respectively), and salinity of 34.27–34.94 psu (at st. 8 and.4–75 m, respectively) (Figure 2a). Dissolved oxygen ranged from 6.53 to 9.36 mL/L (at st. 7 and 4–5m, respectively), while turbidity was comprised between 1.48 and 49.72 (at st.5 and st.8, respectively) (Figure 2b). At station 4, temperature and dissolved oxygen values decreased slightly along the water column; conversely, salinity increased with depth. More variable, although not statistically significant, were the vertical patterns of turbidity (data not shown in Figure 2). Temperature and salinity values decreased from st. 4 to 8 (glacier), while an opposite trend was observed for turbidity and inorganic compounds.
The temperature profiles showed a detectable signal of colder water that moved away from the glacier toward the bottom, as observed along the vertical profiles of the stations 14 and 23, at the depth of 5 and 3.5 m respectively (Figure 3).
Low concentrations of inorganic compounds (min-max range: NH4 0.45–1.44 µmol/L; NO2+ NO3 0.12–5.60 µmol/L; PO4 0.10–0.48 µmol/L) and reduced concentrations of Chl-a and TSM (0.03–1.56 mg/m3 and 0.2–16.7 mg/l, respectively) characterized the Kongsfjorden area (Table 2). Surface Chl-a concentration was lower than 0.4 mg/m3, whereas higher values (>1.0 mg/m3) were found at the sub-surface layer (from 25 to 50 m). TSM peaked at station 8 (Figure 4).
Total C values were comprised between 103.86 and 293.63 µg/L (st. 6—st. 14, respectively); inorganic C content ranged from 12.57 to 140.35 µgC/L (st. 4–75 m—st. 14, respectively), while the organic fraction from 67.94 to 397.20 µgC/L (st. 8—st. 4–25m, respectively). PON concentrations were on average 5.4 times lower than POC, varying between 12.50 and 60.69 µgN/L (st. 7- and st. 4-25 m respectively). POC and PON distribution patterns reflected those of Chl-a, being concentrated in the outer part of the fjord. Averaged C/N molar ratios were 6.72 ± 367.20, ranging from 50.63 to 9.60 within the same station 4. These values provided qualitative information of the organic matter present within the fjord. Generally, an active autotrophic biomass prevailed within the particulate matter pool (C/N ratios between 6 and 8), except for same stations (5, 14, 8, 4–5 m, and 4–50 m) where the heterotrophic biomass (C/N < 6) or, differently, the detrital fraction (C/N > 8, st. 4-100 m) were predominant.
CDOM absorption spectra (Figure 5a) showed a classical unstructured shape with the near exponential decrease at increasing wavelengths (from the ultraviolet to the visible region). Values at 400 nm varied from 0.1175 (st. 4, 100 m) to 0.4905 (st. 14). At st.4, a first (sub)surface peak linked to terrestrial inputs was followed by a less pronounced peak (50 m), related to in situ marine production processes, laying just below the peak of Chl-a detected at 25 m (Figure 5b). CDOM absorption slope values (S275–295) varied from 0.0077 to 0.0109 nm−1, indicating the occurrence of molecules with high molecular weight and aromaticity degree, typical of waters influenced by the presence of terrestrial inputs [31]. In particular, the lowest value was observed at the st.14, in correspondence of the detected colder water from the glacier melting and the highest CDOM absorption values.

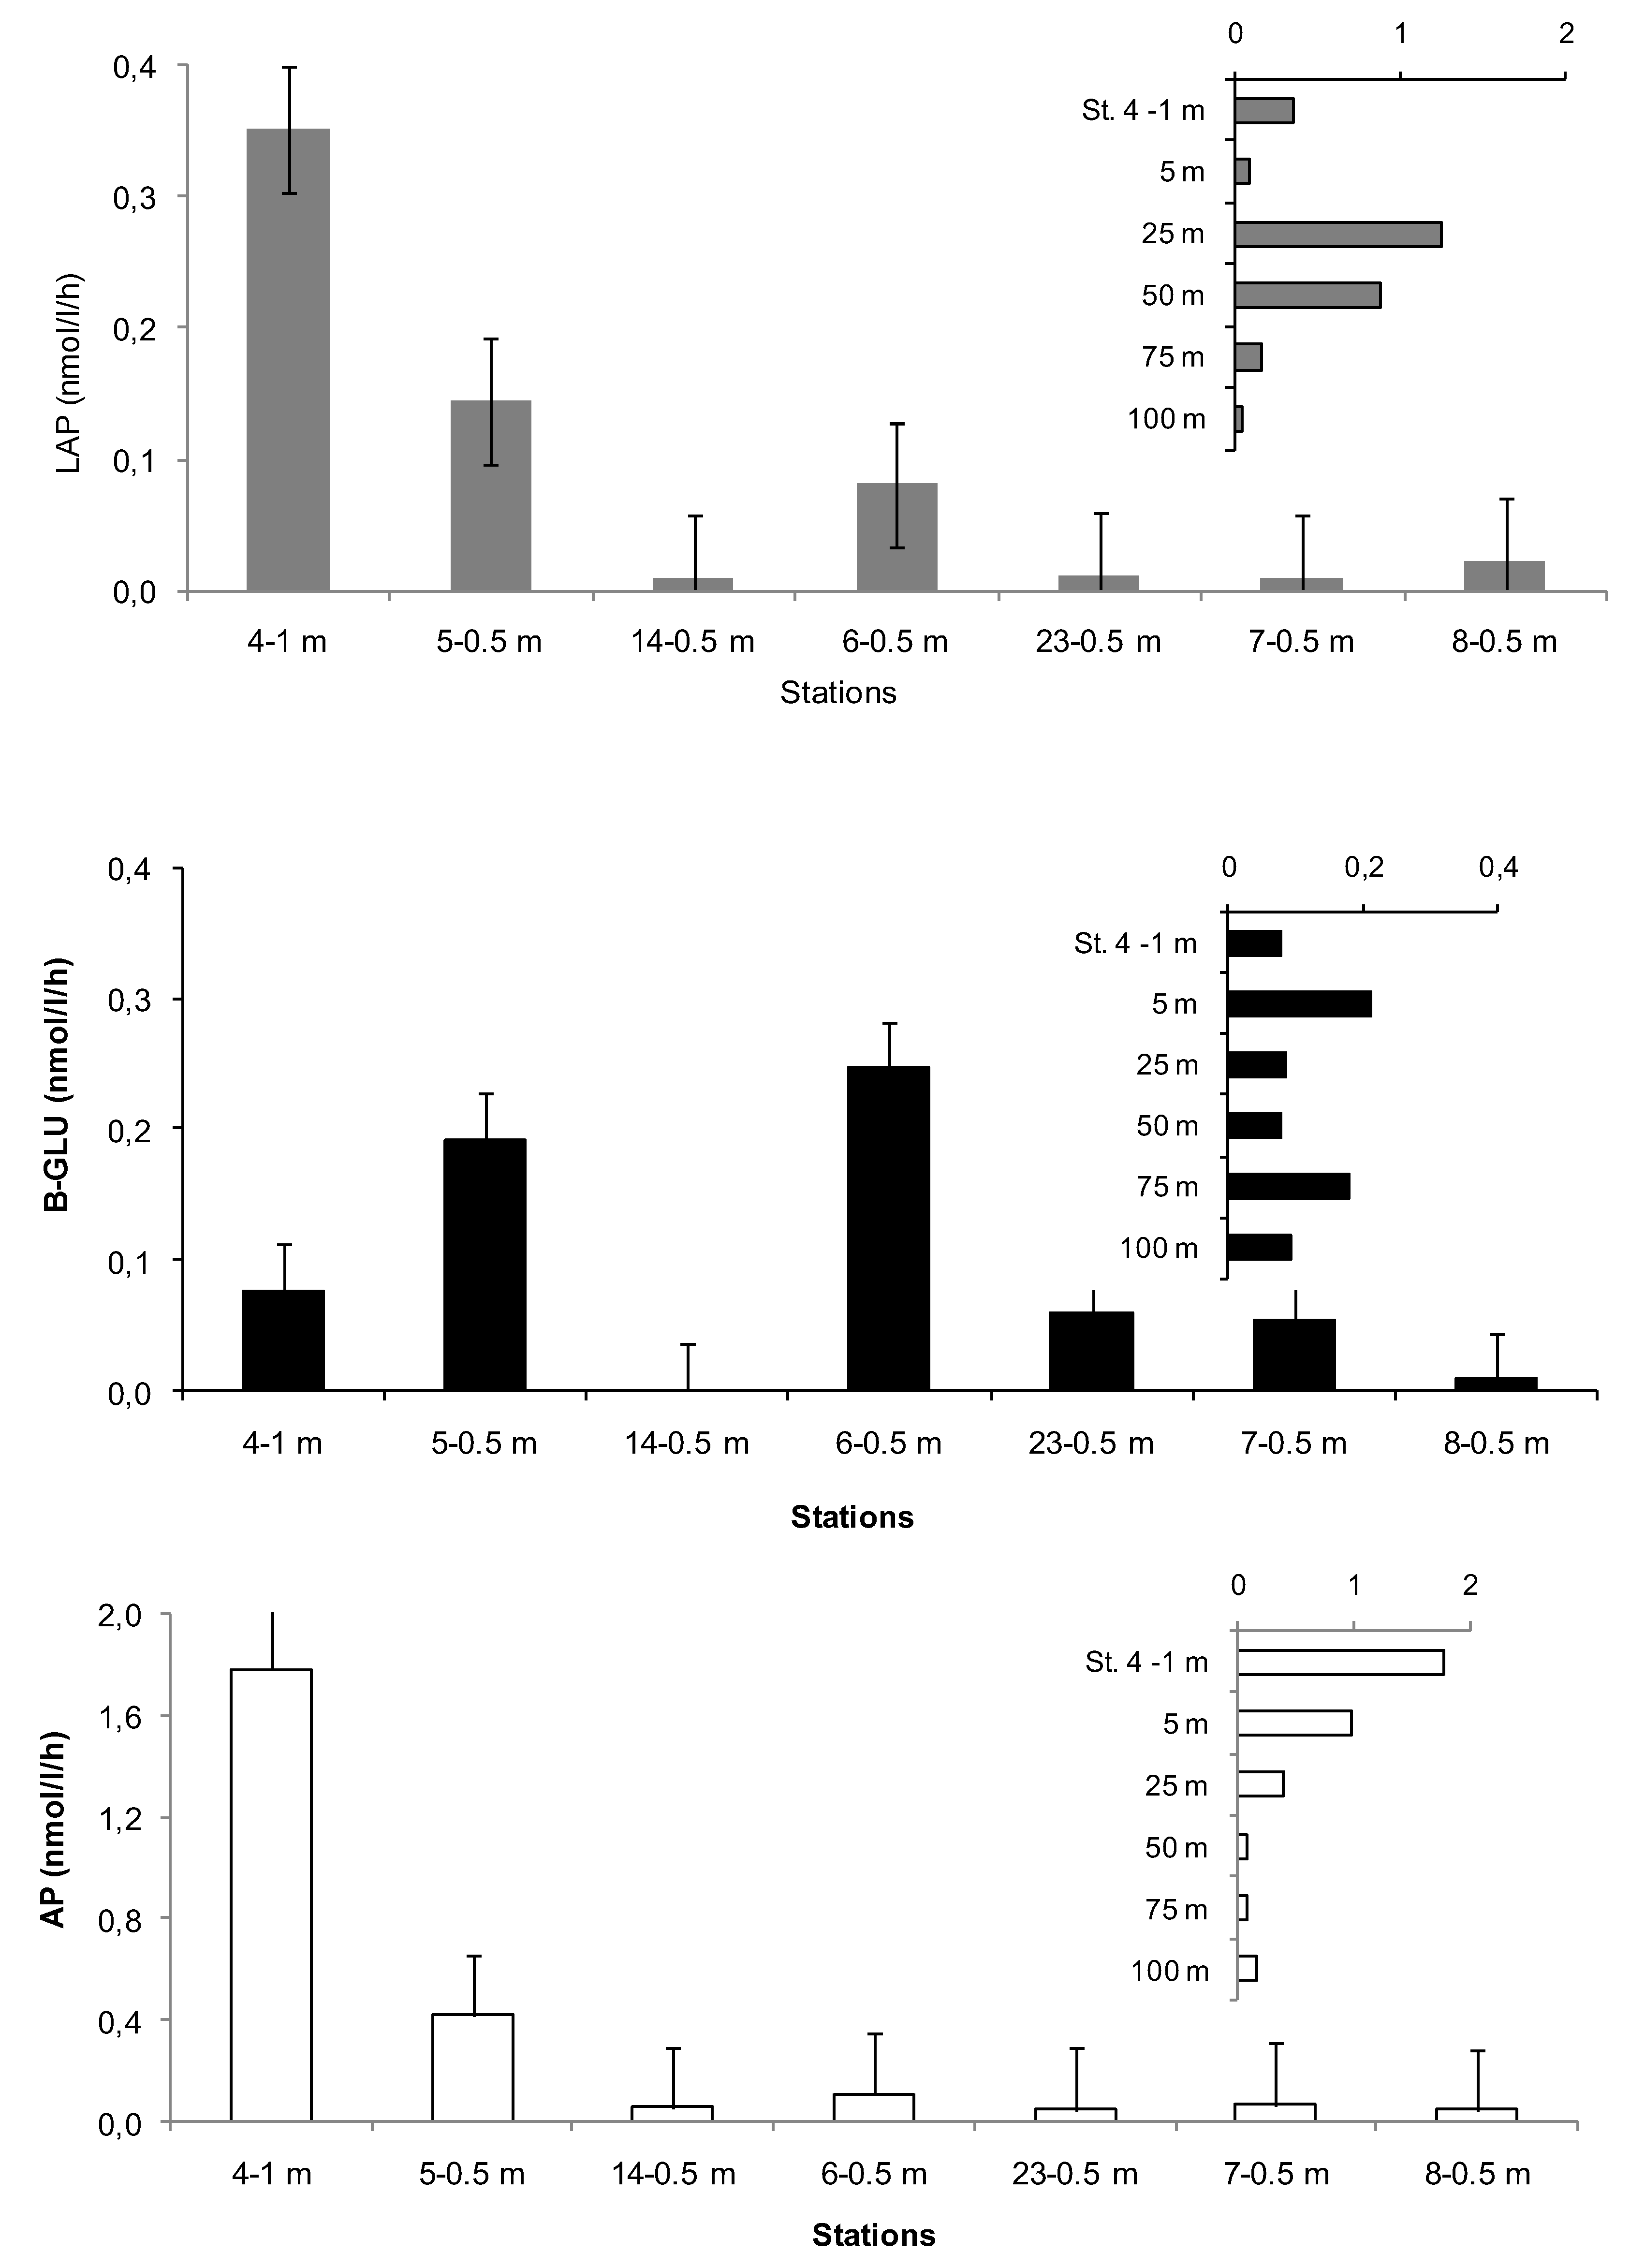
3.2. Microbial Variables

Direct bacterial cell counts (BA) and the fraction of actively respiring cells (CTC) were in the magnitude order of 106 and 104 cells/mL, respectively. Minimum and maximum abundance of BA and CTC+ were recorded at stations-23 and 4–75 m, respectively (Figure 6). CTC counts accounted for percentages of 0–5.39% of total BA. Cultivable heterotrophic bacteria were in the order of 103 CFU/mL. They showed the lowest abundance at st. 4–50 m, the highest one at the same station at surface layer; overall, they represented 0.002–2.11% of total BA.
Enzymatic activity patterns were in the magnitude order AP > LAP > GLU, with rates lower than 1.78, 1.25, and 0.25 nmol/L/h, respectively. At st. 4, AP prevailed at the surface, enabling the recycling of phosphorous for primary production, while LAP and GLU were more active at intermediate depths (Figure 7).
The LAP/GLU ratio, which indicates the reciprocal ratio between the proteolytic and glycolytic processes and depends on the functional features of the ecosystem, was calculated in order to get insights on the qualitative composition of the metabolizable organic matter. Its values ranged from 0.18 (station 7) to 14.61 (station 4–25 m) and on average 3.89 ± 5.20. LAP/GLU ratios were frequently lower than 1, indicating that within the organic matter pool the polysaccharidic material, more refractory than labile proteins, was predominant; conversely, the latter prevailed within the organic matter at stations 4 (0, 25 and 50 m), 8, and particularly 14.
Information on the reciprocal role of phytoplankton and bacterial communities within the Kongsfjorden ecosystem and their contribution to POC was obtained. Bacterial biomass (BB) was calculated from BA using the conversion factor of 20 fgC per cell [49], while phytoplankton biomass (Phyto-B) was calculated from Chl-a values assuming a C:Chl-a conversion ratio of 40 [50]. The contribution of the detrital fraction was obtained after subtraction of BB and Phyto-B from POC. Detritus was the predominant fraction of POC, followed by BB and Phyto-B. BB contribution was high at stations 6 and 8 where lower percentages of Phyto-B and detritus were found (Table 3).
Detritus and BB generally exceeded Phyto-B, with average values of 102.22 and 34.47 µgC/L respectively, compared to Phyto-B (14.69 µgC/L). Their distribution patterns showed higher values starting from the station 6 towards the station 8 close to the Kronebreen glacier, confirming the relevance of the detritus released from ice melting for bacterial metabolism in the inner part of the fjord. Phyto-B contributed to POC in a percentage varying from a minimum of 1.56% at st. 6 to a maximum of 26.74% at st.4–50 m, constituting on average 8.43% of POC. Conversely, BB oscillated between 16.60% at st. 23 and 57.52% at st.4–75 m, with an average weight of 26.62% of POC. The contribution of both auto- and heterotrophic biomasses (in terms of phytoplankton and bacteria, respectively) to POC appeared more balanced at stat. 4–50 m. Total living microbial biomass, as BB+Phyto-B, was predominant at stat. 8 (54.02% of POC), while the minimum percentage contribution on POC (25.97%) was recorded at st. 23.
Using a conversion factor of 72 ng of C released by both LAP and GLU from the hydrolysis of 1 nmol of substrate [46], LAP and GLU values were converted into nanograms of mobilized C. Comparing the sum of C released per day by both LAP+GLU activities to the whole amount of POC, and assuming that this latter was fully bioavailable, we calculated that the microbial community was potentially able to mobilize per day a percentage ranging from 0.08% to 0.67% of total POC, at stations 8 and 6, respectively.
The following formula was used:
% hydrolyzed   POC   ( per   day ) = ( LAP + GLU )   × 24 POC   × 100

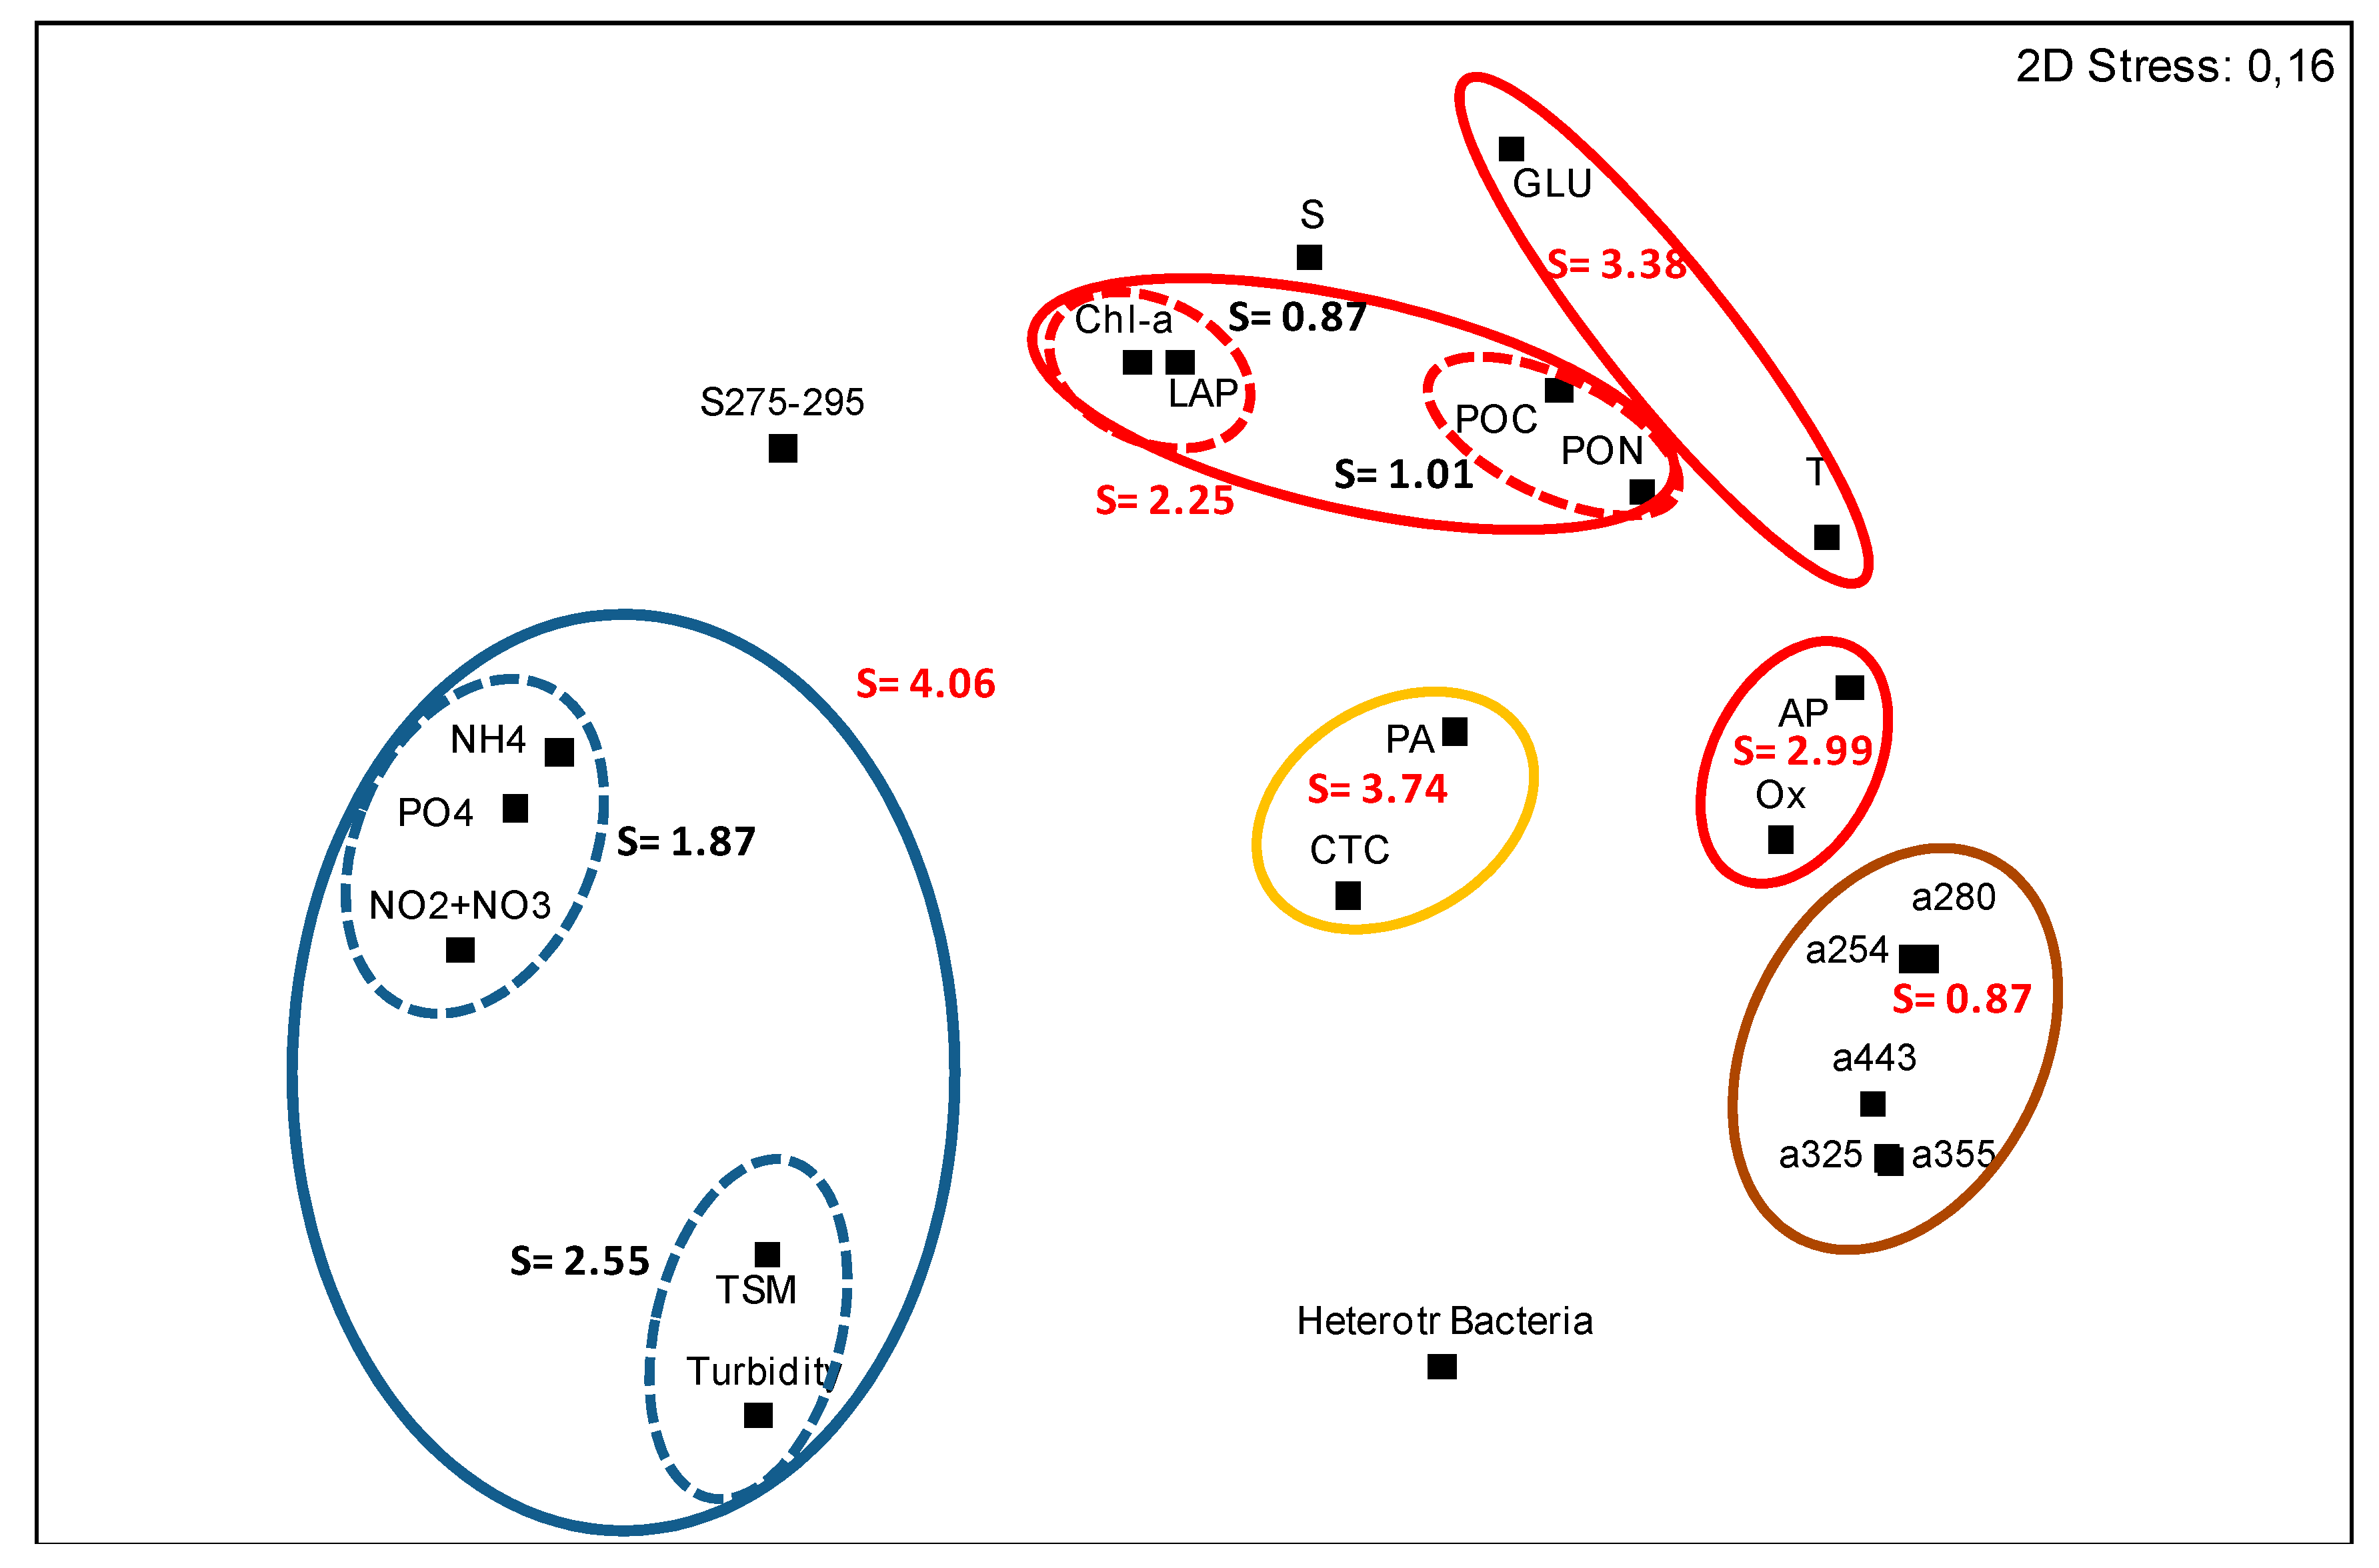
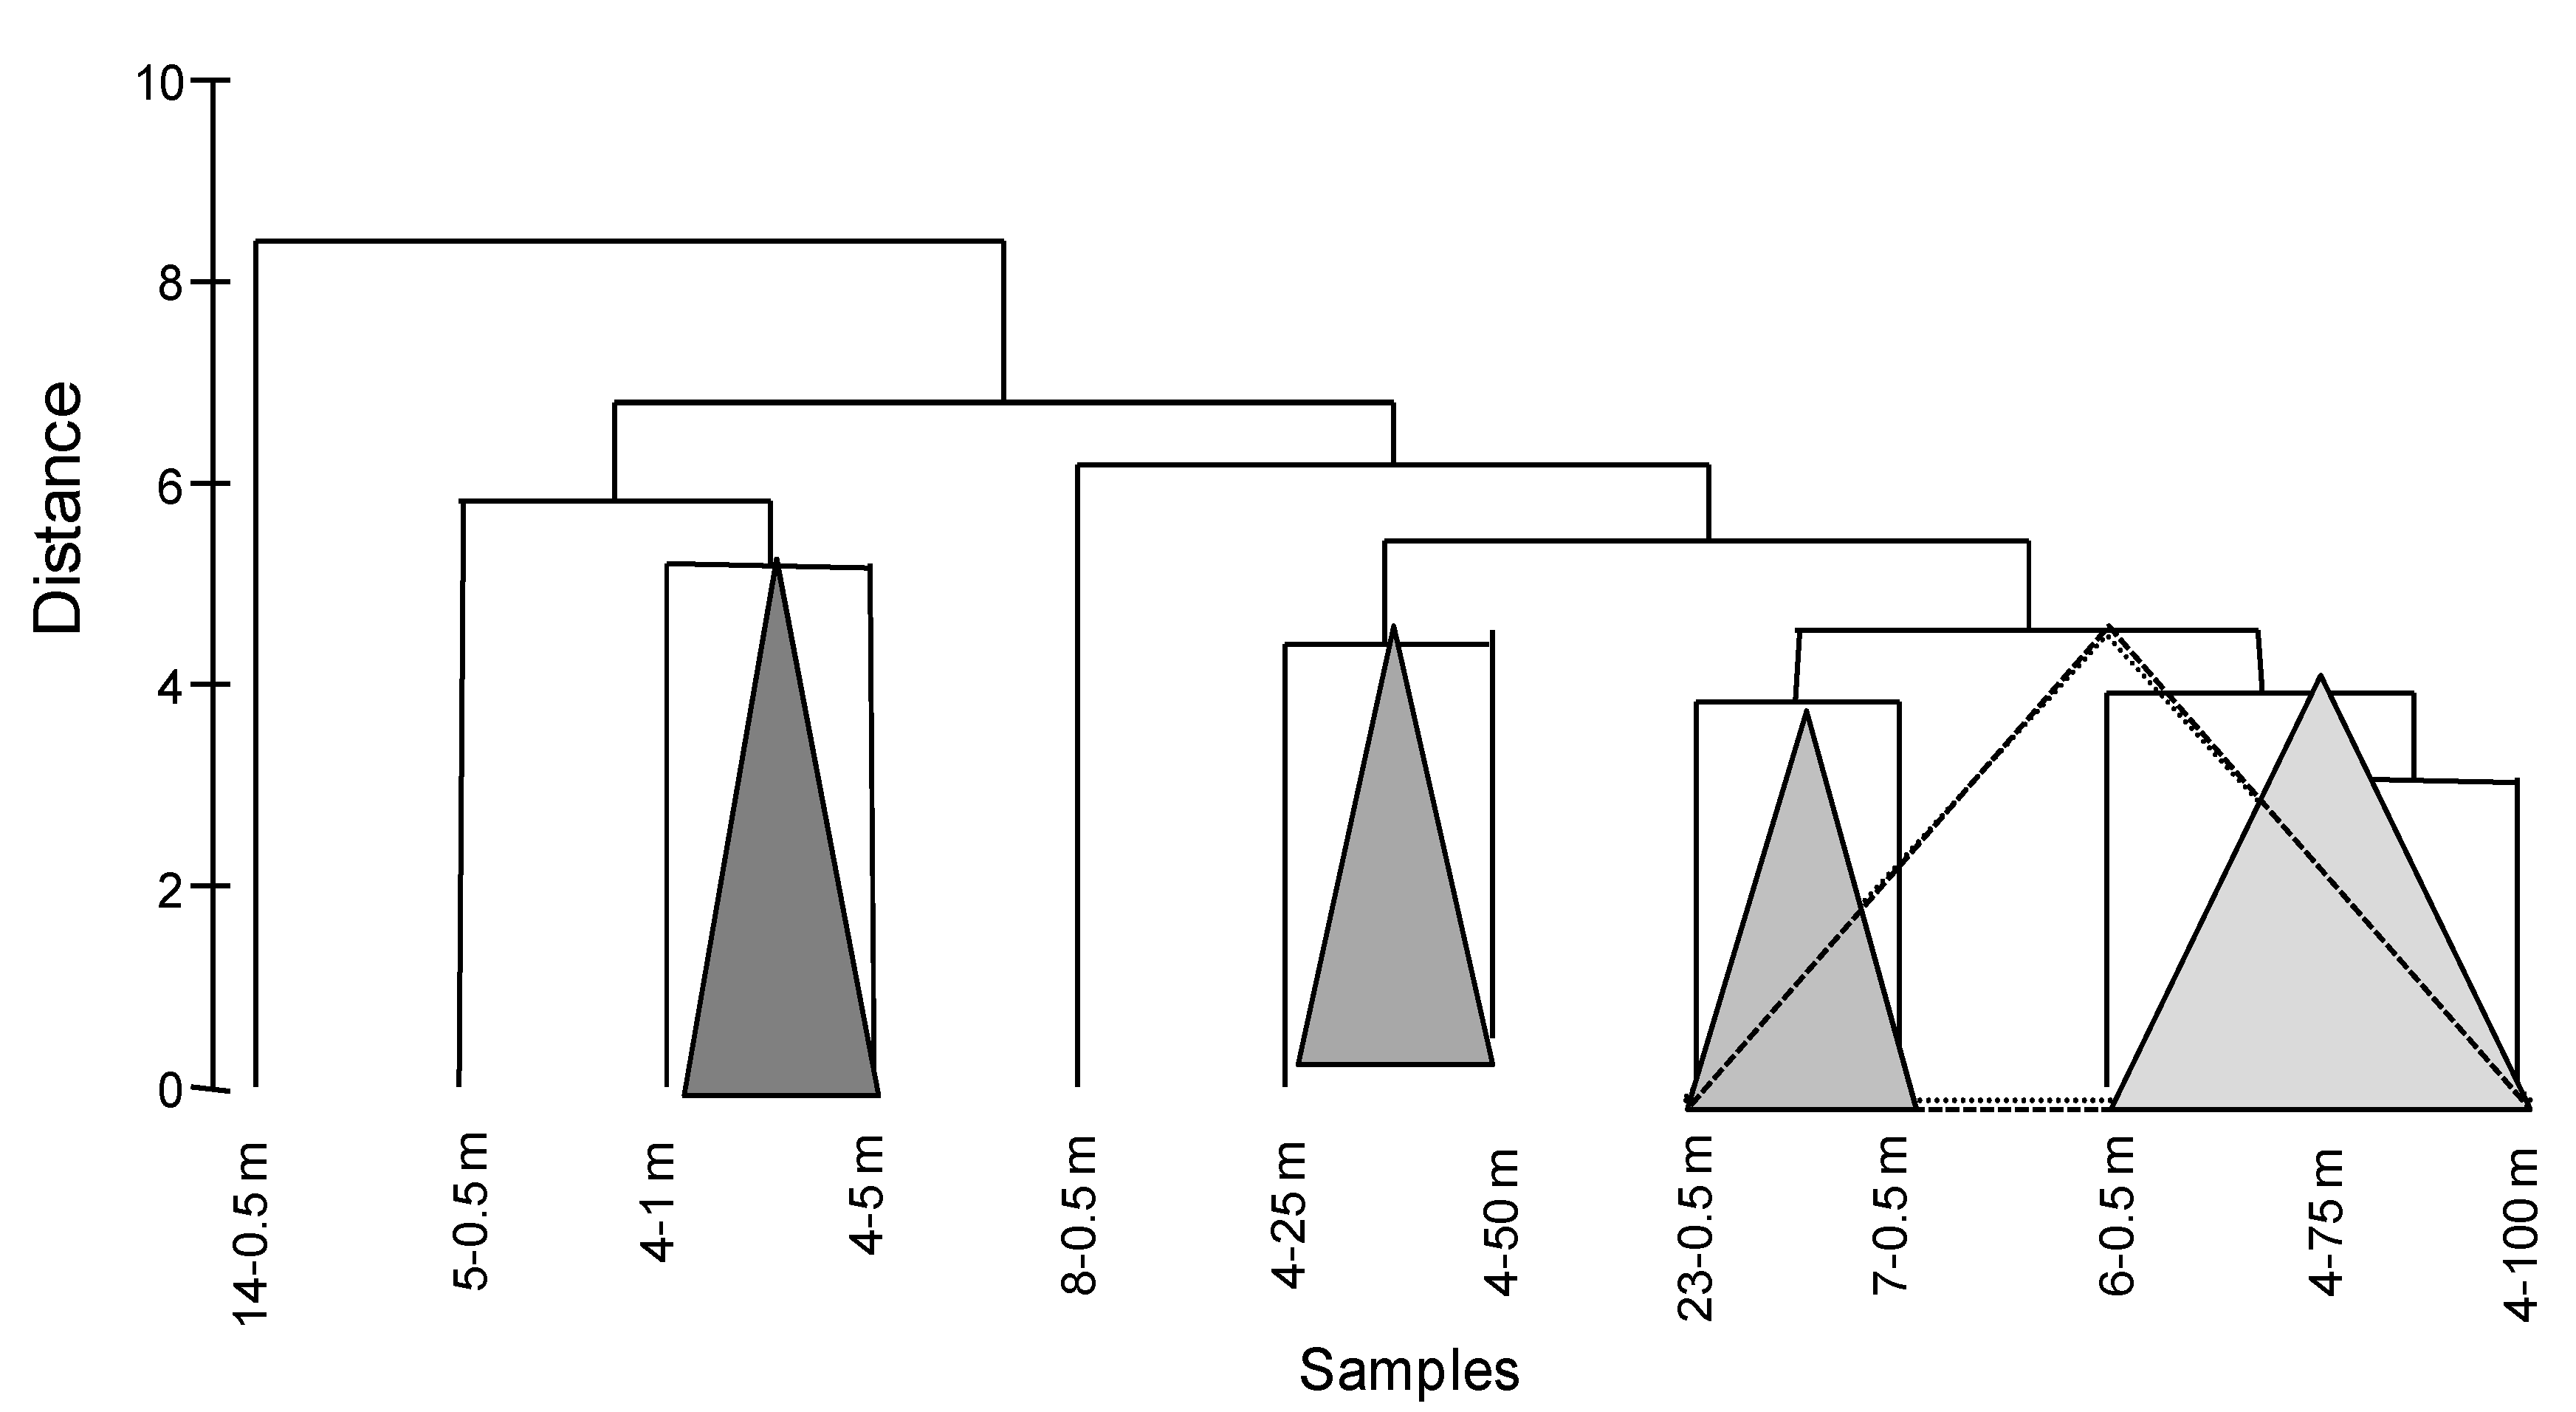
3.3. Statistical Data Elaboration

Pearson correlation and multidimensional scaling analysis (MDS, Figure 8) performed on the whole dataset underlined that temperature was inversely related to inorganic compounds (Pearson r = −0.67, p < 0.05), TSM and turbidity (r = −0.78 and −0.82, p < 0.01, respectively). Although at a low probability level, temperature also correlated positively to GLU (r = 0.57, p < 0.05) and AP to the cultivable heterotrophic bacteria (r = 0.594, p < 0.05). AP and CDOM absorption spectra (a 254 nm) were significantly related (r = 0.71, p < 0.05), as well as LAP with Chl-a (r = 0.97, p < 0.01), suggesting enzymatic synthesis stimulation by fresh material. LAP levels also correlated significantly with POC and PON contents (r = 0.780, 0.734, p < 0.005, respectively), indicating a good synergy between organic matter, autotrophic biomass, and proteolytic activities, or, in other words, that production and degradation processes were well balanced. Similarity levels (S) calculated in the MDS analysis confirmed the close association between LAP and trophic parameters, such as Chl-a, POC, and PON (S = 2.25), as well as between TSM and turbidity (S = 2.55) or T and GLU (S = 3.38).
Both biochemical and optical parameters individuated different sub-areas, having terrestrial or marine properties. Within st. 4, cluster analysis discriminated the surface layers, including the water samples up to a 5 m depth and associated to st. 5 by an Euclidean distance of 5.14, from the deepest ones (75 and 100 m), associated to st. 6 with an Euclidean distance of 4.05. This last-subcluster was similar to another one (that included st. 23 and st. 7 with an Euclidean distance of 3.85) and both the clusters grouped together with an Euclidean distance of 4.35 (Figure 9). Samples 4–25 m and 4–50 m, characterized by high phytoplankton biomass, clustered together (Euclidean distance of 4.15), while st.14–0 m remained unclustered.

4. Discussions

This study investigated the spatial distribution of phytoplankton and bacterial communities in Kongsfjorden, evaluating their response to the environmental conditions during late spring. This is a transition period between spring, during which phytoplankton growth and primary production processes are high, and summer, when the heterotrophic processes start to increase, playing a key role in organic matter decomposition and nutrient recycling.
Kongsfjorden, characterized by Atlantic water influx and melting of tidal glaciers, is one of the most studied polar ecosystems; these features make it suitable as a study site to evaluate the impacts of climate variability and several studies have proliferated in this region over the last decade [51]. Climate change, with consequent global warming, is one emerging driver of change in the Arctic environments, causing glaciers’ retreat, increased meltwater outflow, and riverine discharge [52] In this context, understanding how the structure and functional diversity of the microbial community vary is a hot topic and a major challenge for future studies in aquatic polar microbiology [53]. Since microorganisms constitute the living basis of pelagic food webs and represent the drivers of carbon and nutrient cycling, the possible impacts of climate change in shaping the distribution and diversity of microbial communities is far more concerning, Arctic warming can potentially have severe consequences on large-scale microbial population dynamics, trophic-level interactions, and ecological processes driven by microbes. As a consequence of deglaciation, the land-to-ocean flux of organic carbon is increasing, making it necessary to determine the bioavailability of the different carbon sources in the Arctic fjord systems [54]. Thus, questions addressing how environmental changes will impact on the structure and functional diversity of the microbial community and, in turn, on ecosystem functions and/or net carbon status are of priority interest. In spite of these considerations, studies regarding the abundance and metabolism of microbes in Kongsfjorden and attempts to link their abundance and processes to the environmental characteristics of the fjord have been undertaken only recently [55,56,57,58,59,60,61,62,63,64]. Further insights on the structure of the microbial community in the Kongsfjorden ecosystem could be obtained in the next years by also including molecular methods, such as next-generation sequencing through 16S amplicons, allowing the analysis of several samples.

4.1. Environmental Characterization

The structure and function of marine ecosystems may differ among geographical areas due to the heterogeneous nature of high-latitude seas [65]. The thermohaline structure of the water column at the station 4 showed a decreased trend in temperature values with increasing depth, while salinity displayed an opposite trend. Moving along the examined transect towards the glacier, salinity showed a decreasing course too. These patterns confirmed the scenario described in previous studies in Kongsfjorden during the same seasonal period [29], pointing out that the runoff of freshwater and suspended loads from ice melting of land and glaciers produces, as a direct effect, strong environmental gradients in salinity, temperature, and sedimentation rates and stratification at shallow depths. At station 4, warm and salty Atlantic waters were found in the two deepest samples (75 and 100 m depth), confirming the enhanced intrusion of these waters. Evidence of freshwater runoff from glaciers, with colder waters at a depth of 3.5 and 5 m, was observed at stations 14 and 23, respectively. These vertical profiles represented one of the most evident signals of Kronebreen glacier melting caused by a warming increase. Studying the spatial and temporal (on seasonal/interannual timescales) variations of the basal properties of this glacier, Vallot et al. [66] pointed out its sliding behavior over an annual scale, primarily driven by changes in the amount of meltwater reaching the bottom. From a 376-day time series of water temperature measurements performed by a LoTUS buoy moored at a depth of 67 m and about 1 km from the calving front of Kronebreen, Holmes et al. [67] assessed the dynamics of frontal ablation from August 2016 to September 2017, recording an increasing trend in glacial retreat, an average of 1.03 m/day (396.8 m in the whole study period); these values were comparable to annual retreat values previously reported [66]. Indeed, Kronebreen is considered a fast-moving tidewater glacier with surface speeds of 2–3 m/day; its surface melting results in freshwater runoff that not only freshens fjord waters but also plays a key role in glaciomarine sedimentary processes, transporting sediment material into the fjord [68]. Turbidity and TSM measurements performed in our survey confirmed the input of material released from the glacier, particularly significant at the stations close to Kronebreen.
The concentration of inorganic compounds varied in a range similar to that reported by Hop et al. [22] for nitrate (1.6–3.3 µmol/L) and phosphate (0.5 µmol/L) in the upper 20 m of the outer part of Kongsfjorden. Iversen and Seuthe [29] reported in the upper 50 m average concentrations of 0.45 ± 0.51 µM and 0.30 ± 0.10 µM for nitrate and phosphate, respectively.
The surface Chl-a concentration showed low values (<0.35 µg/L) with strong decreases at stations 6 and 8; these values were in line with the seasonal study period and the nature of oligo-mesotrophic environments. The vertical distribution of Chl-a (st. 4) displayed a notable increase at the 25 and 50 m depth, with values five times higher than the surface, indicating a typical condition of the stratified water column. Total Chl-a concentrations measured in this study were comparable to those reported by Iversen and Seuthe [28] (0.18 ± 0.01 µg/L), who also found POC concentrations of 314 ± 46 µg/L in May and minimum ratios (4.6) of C:N. Wide variations in primary productivity are currently recorded in Kongsfjorden, due to pronounced seasonal variations in sunlight, glacier melting, and sea ice cover; all these conditions largely affect the downward export of biogenic matter [69]. Melted ice water inputs from several tidewater glaciers (Kongsbreen, Conwaybreen, Blomstrandbreen, Kronebreen, and Kongsvegen) enrich the fjord with particles of mineral and organic origin [31,32,70,71]. According to a recent study [30], the same particles may act as specific substrates able to select the structure and function of a specific particle-attached bacterial community.

4.2. Microbial Variables and Their Response to Natural Forcings

Bacteria are recognized to be significant heterotrophic components of the structure and function of marine pelagic ecosystems since they are major consumers of the photosynthetic production through decomposition and mineralization processes [71]. In contrast with the wide knowledge available on its hydrography, mesozooplankton, and higher trophic levels in the Svalbard archipelago [22], the role of the microbial food web components is yet relatively unknown [29]. Particularly, in Kongsfjorden, the effects on bacteria of glacier melting due to high air temperature, in association with the intrusion of freshwater, are not well understood [51,63].
The values of BA found in our study fall in a magnitude range similar to the concentrations reported in other studies in Kongsfjorden or other Arctic ecosystems. Bacterial abundances ranging from 1.84 × 10⁸ to 4.01 × 10⁸ cells/L were reported in August in Kongsfjorden by Jiang et al. [55]; this value is slightly higher than that (0.8 × 10⁸ ~ 1.3 × 10⁸ cells/L) found in a similar Svalbard fjord, Hornsund [72], and is comparable with ranges of 108 to 109 cells/L typical of other Arctic marine ecosystems [18,73,74]. In Kongsfjorden, BA values of 1.46–4.26 × 10⁵ cells/mL were reported by Kalinowska et al. [75], while Jankowska et al. [56] found higher concentrations (7.8–80 × 105 cells/mL). More recently, total BA estimated by Sinha et al. [64] in Kongsfjorden ranged around 107–109 cells/L during June-September while pelagic cultivable heterotrophic bacteria from 103–107 CFU/L in June.
Bacterial growth is affected by temperature and the availability of metabolizable substrates. Dissolved organic matter (DOM) is a resource for heterotrophic bacteria [73]. CDOM absorption spectra measured at all the stations showed a typical descending exponential trend at increasing wavelengths in the UV-visible range, with a marked decrease in the absorption coefficients at increasing distances from the glacier, in concomitance with the decreasing temperature and salinity gradients. CDOM absorption slope values (S275–295) < 0.03 nm−1 were detected within the entire study area, confirming the dominance of a CDOM pool of terrestrial origin [76,77]. The analysis of CDOM absorption along the water column at st.4 evidenced a sub-surface distribution (5 m) of such a pool, in correspondence with the elevated levels of detritus found in terms of the percentage of total POC (71.12%). The less pronounced peak observed at the 50 m depth revealed the presence of a second CDOM pool, as a result of the accumulation of CDOM molecules produced by the microbial community. Such results were confirmed by the elevated contributions of both Phyto-B and BB obtained at st.4–50 m (26.74% and 50.55%, respectively), highlighting the crucial role of microbes in producing new CDOM, acting on substrates, such as natural DOC, zooplankton excreta, or algal exudates [78]. The overlapping trend between the peaks in phytoplankton biomass (as Chl-a) and CDOM confirmed that phytoplankton exudates provided a source of DOM that supported bacterial growth. A similar result was reported by Sherr et al. [79] in the upper water column of the central Arctic Ocean, where bacterial abundance increased simultaneously with phytoplankton during the initial spring bloom. Jiang et al. [55] suggested DOM concentration as the key factor controlling bacterial distribution in Kongsfjorden during summer. POM was reported to provide a favorable habitat for bacterial consortia by Kalinowska et al. [75].
In our study, estimates of CTC-labelled cells as a marker of actively respiring bacteria allowed identification that an average percentage of 1.08% of total BA (with a peak of 5.39% at station 5) was metabolically active. To date, the physiological status of bacteria in Kongsfjorden has been assessed by few studies only. In agreement with our results, Howard-Jones et al. [80] reported that during summer in the marginal ice zone of the central Barents Sea, a significant fraction (25–80%) of the total bacteria was dormant or expressed very low activity. An increase in the productivity, abundance, and proportion of active bacteria during the spring season in relation to the hydrographic and phytoplankton variability was reported by Piquet et al. [63] in a comparative study between Kongsfjorden and Krossfjorden. In marine Canadian Arctic environments, the number of viable bacteria ranged from 0.7 to 1.8 × 10⁶ cells/L [81].
Microorganisms play a critical role in the ecosystem functioning, modulating organic matter decomposition and the nutrient cycling and energy fluxes [82], and high microbial activities are found on and around POM, which represents a hotspot of heterotrophic bacterial abundance and activity [83]. In cold regions, however, a very limited knowledge is still available on in situ organic matter hydrolysis mediated by the microbial community as well as on its functional changes in response to climate change. Sea ice retreat and glacier melting result in the release of both autochthonous and allochthonous particles [33] having different size and physical, chemical, and biological properties that could affect carbon export and storage [84]. Investigating the metabolic diversity of heterotrophic bacterioplankton by Biolog ecoplates, Sala et al. [85] underlined that in spring, the bacterial community had preferential access to the freshly produced organic substrates from the early phytoplankton bloom, mostly consisting of polysaccharides, and in these conditions those phenotypes able to grow rapidly were favored.
According to Arnosti et al. [86], Arctic microbial communities exhibited enzymatic activity patterns different from their temperate counterparts; most of these communities were found to be able to access a narrow range of substrates and the functional difference in enzyme activities depended on several factors, including nutrient levels and genetic characteristics [7]. However, organic matter hydrolysis by extracellular enzyme activity was reported to occur in cold Arctic waters at rates similar to those measured in warmer lower latitude waters [87]; in fact, microorganisms were specialized to mineralize specific substrates or to control key mechanisms involved in carbon cycling, adapting their metabolism to the rhythms of primary productivity that are unique to high-latitude environments [23].
Kellogg et al. [88] estimated that enzymes associated with sinking aggregates could mobilize as much as 2–44% of the carbon present in surface waters. In our study, the potential organic matter turnover, estimated by enzyme activity rates, indicated that during May 2016, only a low percentage of POC (<0.67%) were metabolized by the microbial community, suggesting that the Kongsfjorden ecosystem acted in the late spring-early summer period mostly as a carbon sink rather than as a source. All the enzymes measured showed activity rates <2 nmol/L/h; AP was the predominant enzyme, followed by LAP and GLU. The prevalence of LAP over GLU is a typical characteristic of temperate regions [46]. In agreement with our findings, high peptide hydrolysis rates were also found in pelagic bacterial communities in high Arctic surface waters, especially at ice-free regions, and decreased with depth [9].
In Kongsfjorden, the present investigation pointed out a patchy distribution of microbial abundances and metabolism along the transect in response to the physical and chemical forcings, with the bacterial and phytoplankton biomasses mostly concentrated at the outer stations of the fjord. In fact, at station 4, the peaks in enzymatic rates measured in this survey were closely associated to high BA. Conversely, the inner part of Kongsfjorden, more affected by glacier runoff, was characterized by high concentrations of inorganic compounds and TSM as well as turbidity peaks. These patterns confirmed the decreasing distribution of the microbial community from the outer to the inner part of the fjord previously observed by Hop et al. [23] in response to changes in the water temperature, salinity, and turbidity inside the fjord. In this ecosystem, in fact, changes in the microbial composition related to salinity may interact with changes in organic supply, modifying the spectra and rates of enzymatic activities [10]. Since microbial activities depend on the community composition, and both are influenced by environmental conditions, shifts in the microbial community caused by changing Arctic conditions can result in complex functional consequences on biogeochemical cycles.
The simultaneous measurements of trophic parameters, microbial abundance, and metabolic rates performed in our study made it possible to identify within Kongsfjorden two distinct areas: (i) an outer area that included stations 4-whole column, 5, and 6, where LAP activity rates were coupled with productive processes in terms of Chl-a and POC concentrations (r = 0.977, 0.751, p < 0.01, 0.05, respectively) and AP was related to heterotrophic cultivable bacteria (r = 0.751, p < 0.05); and (ii) an inner area, comprising stations 23, 7, and 8, affected by the glacier influence and with increased availability of inorganic compounds and reduced microbial activity and metabolism. Here, LAP activity rates correlated with TSM and BA (r = 0.998 and 0.967, p < 0.01, respectively), suggesting that suspended matter sustained the growth of bacteria with proteolytic activity. The overall picture of Kongsfjorden conditions during late spring 2016 was that in the outer zone, the microbial loop components (phytoplankton and bacteria) were particularly active in both productive and degradative processes, allowing a prompt recycling of organic matter. In the inner part of the fjord, ice melting from glaciers released suspended materials, which increased water turbidity and the availability of inorganic compounds, while it decreased microbial abundance and activities. The inverse relationships of temperature with turbidity, TSM, and inorganic compounds reinforced our hypothesis that the organic substrates originated from the glacier inputs. In this study, temperature did not seem to act as a major driver of total BA, given the lack of significant correlations between temperature and direct bacterial cell counts. A similar result was also found in the same area in September 2015 [89]. The detection of high GLU activity at the station 6 in the middle of the transect was in agreement with the high activities of this enzyme also reported by Sala et al. [90] in polar surface waters; these authors suggested that possible variations in the bacterioplankton functional diversity could be the main evidence of rapid environmental changes affecting the polar regions, with consequent solubilization of organic aggregates and implications on the carbon cycle. From a speculative point of view, forecasts on how the Kongsfjorden microbial community will react in response to a continuous increase of temperature could be made, hypothesizing an increasing trend of microbial metabolism towards heterotrophy, with a more rapid remineralization and a more rapid carbon flux than that actually measured.

5. Conclusions

Kongsfjorden is a marine ecosystem where physical dynamics are rapidly changing. Significant spatial variability in microbial biomass and activity patterns was observed during the late spring survey. The variability in the amounts of total bacteria and enzymatic activity rates reflected the changes in the hydrological conditions; indeed, the inflow of Atlantic waters from the open ocean and the freshwater runoff from the melting glaciers stimulated microbial abundance and metabolism within the fjord. The Atlantic enrichment of Kongsfjorden waters with organic substrates supported both phytoplankton and bacterial growth and metabolism; moving towards the inner part of the fjord, microbial abundance and metabolism values decreased with the decrease of temperature. In the inner part of the fjord, TSM was released from glaciers, as confirmed by the increased water turbidity. Although final considerations on the long-term dynamics of the eemicrobial community in Kongsfjorden should be formulated over a prolonged period of observations, at least over a decadal basis, the observed microbial abundance and metabolic changes suggested an active response to environmental variations, highlighting the role of microbial communities as potential sentinels of changing conditions. Therefore, altered microbial dynamics might highlight instabilities in the ecosystem processes and the current datasets could represent a baseline for future long-term data series of environmental scenarios that are continuously evolving, also acquired through the use of advanced technology devices [47,91].

Author Contributions

Conceptualization, G.C., A.M., S.M., M.A.; methodology, G.C., A.M., S.B., S.M., F.G., G.M., F.A., F.D., R.L.F., V.P., D.P., M.A.; software: G.C., A.M.; validation, G.C., A.M., S.M., F.D., M.A.; formal analysis, G.C., A.M., F.D., M.A.; investigation, S.M., F.G., A.M.; data curation, all the authors; writing, original draft preparation, all the authors; writing-review and editing, G.C., A.M., F.D., M.A., M.M.; resources, M.A.; supervision, G.C., A.M., M.A. All authors have read and agreed to the published version of the manuscript.

Funding

This research was funded by the Italian Ministry of Education, University and Research through the ARCA project, coordinated by the Italian National Research Council.

Conflicts of Interest

The authors declare no conflict of interest. The funders had no role in the design of the study; in the collection, analyses, or interpretation of data; in the writing of the manuscript, or in the decision to publish the results.

References

  1. Boy, M.; Thomson, E.S.; Acosta-Navarro, J.C.; Arnalds, O.; Batchvarova, E.; Bäck, J.; Berninger, F.; Bilde, M.; Brasseur, Z.; Dagsson-Waldhauserova, P.; et al. Interactions between the atmosphere, cryosphere, and ecosystems at northern high latitudes. Atmos. Chem. Phys. 2019, 19, 2015–2061. [Google Scholar] [CrossRef] [Green Version]
  2. Arnosti, C. Functional differences between Arctic seawater andsedimentary microbial communities: Contrasts in microbialhydrolysis of complex substrates. FEMS Microb. Ecol. 2008, 66, 343–351. [Google Scholar] [CrossRef] [PubMed] [Green Version]
  3. Teske, A.; Durbin, A.; Ziervogel, K.; Cox, C.; Arnosti, C. Microbial community composition and function in permanently cold seawater and sediments from an Arctic fjord of Svalbard. Appl. Environ. Microbiol. 2011, 77, 2008–2018. [Google Scholar] [CrossRef] [PubMed] [Green Version]
  4. Arnosti, C.; Steen, A.D. Patterns of extracellular enzyme activities and microbial metabolism in an Arctic fjord of Svalbard and in the northern Gulf of Mexico: Contrasts in carbon processing by pelagic microbial communities. Front. Microbiol. 2013, 4, 318. [Google Scholar] [CrossRef] [Green Version]
  5. Steen, A.D.; Arnosti, C. Extracellular peptidase and carbohydrate hydrolase activities in an Arctic fjord (Smeerenburgfjord, Svalbard). Aquat. Microb. Ecol. 2013, 69, 93–99. [Google Scholar] [CrossRef] [Green Version]
  6. Steen, A.D.; Arnosti, C. Picky, hungry eaters in the cold: Persistent substrate selectivity among polar pelagic microbial communities. Front. Microbiol. 2014, 5, 527. [Google Scholar] [CrossRef]
  7. Arnosti, C. Contrasting patterns of peptidase activities in seawater and sediments: An example from Arctic fjords of Svalbard. Mar. Chem. 2015, 168, 151–156. [Google Scholar] [CrossRef]
  8. Balmonte, J.P.; Teske, A.; Arnosti, C. Structure and function of high Arctic pelagic, particle associated and benthic bacterial communities. Environ. Microbiol. 2018, 20, 2941–2954. [Google Scholar] [CrossRef]
  9. Balmonte, J.P.; Hasler-Sheetal, H.; Glud, R.N.; Andersen, T.J.; Sejr, M.K.; Middelboe, M.; Teske, A.; Arnosti, C. Sharp contrasts between freshwater and marine microbial enzymatic capabilities, community composition, and DOM pools in a NE Greenland fjord. Limnol. Oceanogr. 2020, 65, 77–95. [Google Scholar] [CrossRef]
  10. Boras, J.A.; Sala, M.M.; Arrieta, J.M.; Sà, E.L.; Felipe, J.; Agustí, S.; Duarte, C.M.; Vaqué, D. Effect of ice melting on bacterial carbon fluxes channelled by viruses and protists in the Arctic Ocean. Polar Biol. 2010, 33, 1695–1707. [Google Scholar] [CrossRef]
  11. Gabrielsen, G.W.; Hop, H.; Hübner, C.; Kallenborn, R.; Weslawski, J.M.; Wiencke, C. (Eds.) The Kongsfjorden System-a Flagship Programme for Ny-Ålesund, a Concluding Document from Workshop 28–31 March 2008; Brief Report Series No. 11; Norwegian Polar Institute: Tromsø, Norway, 2009. [Google Scholar]
  12. Dutta, H.; Dutta, A. The microbial aspect of climate change. Energy Ecol. Environ. 2016, 1, 209–232. [Google Scholar] [CrossRef] [Green Version]
  13. Caruso, G.; Azzaro, M.; Caroppo, C.; Decembrini, F.; Monticelli, L.S.; Leonardi, M.; Maimone, G.; Zaccone, R.; La Ferla, R. Microbial community and its potential as descriptor of environmental status. ICES J. Mar. Sci. 2016, 73, 2174–2177. [Google Scholar] [CrossRef] [Green Version]
  14. Laganà, P.; Votano, L.; Caruso, G.; Azzaro, M.; Lo Giudice, A.; Delia, S.A. Bacterial isolates from the Arctic region (Pasvik river, Norway). biofilm production and antibiotic susceptibility. Environ. Sci. Pollut. Res. 2018, 25, 1089–1102. [Google Scholar] [CrossRef] [PubMed]
  15. Post, E.; Forchhammer, M.C.; Bret-Harte, M.S.; Callaghan, T.V.; Christensen, T.R.; Elberling, B.; Fox, A.D.; Gilg, O.; Hik, D.S.; Høye, T.T.; et al. Ecological dynamics across the arctic associated with recent climate change. Science 2009, 325, 1355–1358. [Google Scholar] [CrossRef] [PubMed] [Green Version]
  16. Vincent, W. Microbial ecosystem responses to rapid climate change in the Arctic. ISME J. 2010, 4, 1087–1090. [Google Scholar] [CrossRef] [Green Version]
  17. Kirchman, D.L.; Moran, X.; Ducklow, H. Microbial growth in the polar oceans-role of temperature and potential impact of climate change. Nat. Rev. Microbiol. 2009, 7, 451–459. [Google Scholar] [CrossRef]
  18. Pomeroy, L.R.; Macko, S.A.; Ostrom, P.H.; Dunphy, J. The microbial food web in Arctic seawater: Concentration of dissolved free amino acids and bacterial abundance and activity in the Arctic Ocean and in Resolute Passage. Mar. Ecol. Prog. Ser. 1990, 61, 31–40. [Google Scholar] [CrossRef]
  19. Sarmento, H.; Montoya, J.M.; Vazquez-Dominguez, E.; Vaqué, D.; Gasol, J.M. Warming effects on marine microbial food web processes: How far can we go when it comes to predictions? Phil. Trans. R. Soc. B 2010, 365, 2137–2149. [Google Scholar] [CrossRef] [Green Version]
  20. Beszczynska-Møller, A.; Weslawski, J.M.; Walczowski, W.; Zajaczkowski, M. Estimation of glacial meltwater discharge into Svalbard coastal waters. Oceanologia 1997, 39, 289–298. [Google Scholar]
  21. Cottier, F.R.; Tverberg, V.; Inall, M.E.; Svendsen, H.; Nilsen, F.; Griffiths, C. Water mass modification in an Arctic fjord through cross-shelf exchange: The seasonal hydrography of Kongsfjorden, Svalbard. J. Geophys. Res.-Ocean. 2005, 110, 12005. [Google Scholar] [CrossRef] [Green Version]
  22. Hop, H.; Pearson, T.; Hegseth, E.H.; Kovacs, K.M.; Wiencke, C.; Kwasniewski, S.; Eiane, K.; Mehlum, F.; Gulliksen, B.; Wlodarska-Kowalczuk, M.; et al. The marine ecosystem of Kongsfjorden, Svalbard. Polar Res. 2002, 21, 167–208. [Google Scholar] [CrossRef]
  23. Hop, H.; Wiencke, C. The Ecosystem of Kongsfjorden, Svalbard. In The Ecosystem of Kongsfjorden, Svalbard; Hop, H., Wiencke, C., Eds.; Advances in Polar Ecology 2; Springer Nature: Cham, Switzerland, 2019; Chapter 1; pp. 1–20. [Google Scholar] [CrossRef]
  24. Svendsen, H.; Beszczynska-Moller, A.; Hagen, J.O.; Lefauconnier, B.; Tverberg, V.; Gerland, S.; Ørbøk, J.B.; Bischof, K.; Papucci, C.; Zajaczkowski, M.; et al. The physical environment of Kongsfjorden–Krossfjorden, an Arctic fjord system in Svalbard. Polar Res. 2002, 21, 133–166. [Google Scholar] [CrossRef] [Green Version]
  25. Husum, K.; Howe, J.A.; Baltzer, A.; Forwick, M.; Jensen, M.; Jernas, P.; Korsun, S.; Miettinen, A.; Mohan, R.; Morigi, C.; et al. The marine sedimentary environments of Kongsfjorden, Svalbard: An archive of polar environmental change. Polar Res. 2019, 38, 3380. [Google Scholar] [CrossRef]
  26. Isaksen, K.; Nordli, Ø.; Førland, E.J.; Łupikasza, E.; Eastwood, S.; Niedźwiedź, T. Recent warming on Spitsbergen-Influence of atmospheric circulation and sea icecover. J. Geophys. Res.-Atmos. 2016, 121, 11913–11931. [Google Scholar] [CrossRef]
  27. Bourgeois, S.; Kerhervé, P.; Calleja, M.L.; Many, G.; Morata, N. Glacier inputs influence organic matter composition and prokaryotic distribution in a high Arctic fjord (Kongsfjorden, Svalbard). J. Mar. Syst. 2016, 164, 112–127. [Google Scholar] [CrossRef]
  28. Solan, M.; Archambault, P.; Renaud, P.E.; März, C. The changing Arctic Ocean: Consequence for biological communities, biogeochemical processes and ecosystem functioning. Phil. Trans. R. Soc. A 2020, 378, 20200266. [Google Scholar] [CrossRef]
  29. Iversen, K.R.; Seuthe, L. Seasonal microbial processes in a high-latitude fjord (Kongsfjorden, Svalbard): I. Heterotrophic bacteria, picoplankton and nanoflagellates. Polar Biol. 2011, 34, 731–749. [Google Scholar] [CrossRef] [Green Version]
  30. Jain, A.; Padinchati Krishnan, K.; Singh, A.; Thomas., F.A.; Begum, N.; Tiwari, M.; Parli Bhaskar, V.; Gopinath, A. Biochemical composition of particles shape particle-attached bacterial community structure in a high Arctic fjord. Ecol. Indic. 2019, 102, 581–592. [Google Scholar] [CrossRef]
  31. Caroppo, C.; Pagliara, P.; Azzaro, F.; Miserocchi, S.; Azzaro, M. Late summer phytoplankton blooms in the changing polar environment of the Konsfjorden (Svalbard, Arctic). Cryptogam. Algol. 2017, 38, 53–72. [Google Scholar] [CrossRef]
  32. Kuliński, K.; Kedra, M.; Legezyńska, J.; Gluchowska, M.; Zaborska, A. Particulate organic matter sinks and sources in high Arctic fjord. J. Mar. Syst. 2014, 139, 27–37. [Google Scholar] [CrossRef]
  33. Sagan, S.; Darecki, M. Inherent optical properties and particulate matter distribution in summer season in waters of Hornsund and Konsfjorden, Spitsbergen. Oceanologia 2018, 60, 65–75. [Google Scholar] [CrossRef]
  34. Aliani, S.; Sciascia, R.; Conese, I.; D’Angelo, A.; Del Bianco, F.; Giglio, F.; Langone, L.; Miserocchi, S. Characterization of seawater properties and ocean heat content in Kongsfjorden, Svalbard Archipelago. Rend. Fis. Acc. Lincei 2016, 27, 155–162. [Google Scholar] [CrossRef]
  35. Divya David, T.; Krishnan, K.P. Recent variability in the Atlantic water intrusion and water masses in Kongsfjorden, an Arctic fjord. Polar Sci. 2017, 11, 30–41. [Google Scholar] [CrossRef]
  36. Strickland, J.D.H.; Parson, T.R. A practical handbook of seawater analysis. Bull. Fish. Res. Bd. Can. 1972, 167, 1–311. [Google Scholar]
  37. Aminot, A.; Chaussepied, M. Manuel des Analyses Chimiques en Milieu Marin; CNEXO (Centre National pour l’Exploration des Oceans): Brest, France, 1983; pp. 1–395. [Google Scholar]
  38. Yentsch, C.S.; Menzel, D.W. A method for the determination of phytoplankton chlorophyll and phaeophytin by fluorescence. Deep Sea Res. Oceanogr. Abstr. 1963, 10, 221–231. [Google Scholar] [CrossRef]
  39. Hedges, J.I.; Stern, J.H. Carbon and nitrogen determination of carbonate-containing solids. Limnol. Oceanogr. 1984, 19, 984–989. [Google Scholar] [CrossRef]
  40. Monaco, A.; Courp, T.; Heussner, S.; Carbonne, J.; Fowler, S.W.; Deniaux, B. Seasonality and composition of particulate fluxes during ECOMARGE-I, western Gulf of Lions. Cont. Shelf Res. 1990, 10, 959–987. [Google Scholar] [CrossRef]
  41. Mitchell, B.G.; Kahru, M.; Wieland, J.; Stramska, M. Determination of spectral absorption coefficients of particles, dissolved material and phytoplankton for discrete water samples. In Ocean Optics Protocols for Satellite Ocean Color Sensor Validation, Revision 3; Muller, J.L., Fargion, G.S., Eds.; NASA: Hanover, NH, USA, 2002; Chapter 15; Volume 2, pp. 231–257. [Google Scholar]
  42. Twardowski, M.S.; Boss, E.; Sullivan, J.M.; Donaghay, P.L. Modeling the spectral shape of absorption by chromophoric dissolved organic matter. Mar. Chem. 2004, 89, 69–88. [Google Scholar] [CrossRef]
  43. Bricaud, A.; Morel, A.; Prieur, L. Absorption by dissolved organic matter of the sea (yellow substance) in the UV and visible domains 1. Limnol. Oceanogr. 1981, 26, 43–53. [Google Scholar] [CrossRef]
  44. Helms, J.R.; Stubbins, A.; Ritchie, J.D.; Minor, E.C.; Kieber, D.J.; Mopper, K. Absorption spectral slopes and slope ratios as indicators of molecular weight, source, and photobleaching of chromophoric dissolved organic matter. Limnol. Oceanogr. 2008, 53, 955–969. [Google Scholar] [CrossRef] [Green Version]
  45. Porter, K.G.; Feig, Y.S. The use of DAPI for identifying and counting aquatic microflora. Limnol. Oceanogr. 1980, 25, 943–948. [Google Scholar] [CrossRef]
  46. Caruso, G. Leucine aminopeptidase, beta-glucosidase and alkaline phosphatase activity rates and their significance in nutrient cycles in some coastal Mediterranean sites. Mar. Drugs 2010, 8, 916–940. [Google Scholar] [CrossRef] [PubMed] [Green Version]
  47. Zappalà, G.; Bruzzone, G.; Caruso, G.; Azzaro, M. Development of an automatic sampler for extreme environments: First in situ application in Svalbard. Rend. Fis. Acc. Lincei 2016, 27, 251–259. [Google Scholar] [CrossRef]
  48. Clarke, K.R.; Gorley, R.N. PRIMER v6: User Manual/Tutorial; PRIMER-E Ltd.: Plymouth, UK, 2006. [Google Scholar]
  49. Lee, S.; Furhman, J.A. Relationship between biovolume and biomass of naturally derived marine bacterioplankton. Appl. Environ. Microbiol. 1987, 53, 1298–1303. [Google Scholar] [CrossRef] [Green Version]
  50. Caruso, G.; Monticelli, L.; Azzaro, F.; Azzaro, M.; Decembrini, F.; La Ferla, R.; Leonardi, M.; Zaccone, R. Dynamics of extracellular enzymatic activities in a shallow Mediterranean ecosystem (Tindari ponds, Sicily). Mar. Freshw. Res. 2005, 56, 173–188. [Google Scholar] [CrossRef]
  51. Wiencke, C.; Hop, H. Ecosystem Kongsfjorden: New views after more than a decade of research. Polar Biol. 2016, 39, 1679–1687. [Google Scholar] [CrossRef] [Green Version]
  52. Müller, O.; Seuthe, L.; Bratbak, G.; Paulsen, M.L. Bacterial response to permafrost derived organic matter input in an Arctic fjord. Front. Mar. Sci. 2018, 5, 263. [Google Scholar] [CrossRef] [Green Version]
  53. Dinasquet, J.; Ortega-Retuerta, E.; Lovejoy, C.; Obernosterer, I. Editorial: Microbiology of the Rapidly Changing Polar Environments. Front. Mar. Sci. 2018, 5, 154. [Google Scholar] [CrossRef]
  54. Vallot, D.; Pettersson, R.; Luckman, A.; Benn, D.J.; Zwinger, T.; van Pelt, W.J.J.; Kohler, J.; Schafer, M.; Claremar, B.; Hulton, N.R.J. Basal dynamics of Kronebreen, a fast-flowing tidewater glacier in Svalbard: Non-local spatio-temporal response to water input. J. Glaciol. 2017, 63, 1012–1024. [Google Scholar] [CrossRef] [Green Version]
  55. Paulsen, M.L.; Nielsen, S.E.B.; Müller, O.; Møller, E.F.; Stedmon, C.A.; Juul-Pedersen, T.; Markager, S.; Sejr, M.K.; Delgado Huertas, A.; Larsen, A.; et al. Carbon Bioavailability in a High Arctic Fjord Influenced by Glacial Meltwater, NE Greenland. Front. Mar. Sci. 2017, 4, 176. [Google Scholar] [CrossRef] [Green Version]
  56. Holmes, F.A.; Kirchner, N.; Kuttenkeuler, J.; Krutzfeldt, J.; Noonnets, R. Relating ocean temperatures to frontal ablation rates at Svalbard tidewater glaciers: Insights from glacier proximal datasets. Sci. Rep. 2019, 9, 9442. [Google Scholar] [CrossRef] [PubMed]
  57. Darlington, E. Meltwater Delivery from the Tidewater Glacier Kronebreen to Kongsfjorden, Svalbard: Insights from In Situ and Remote-Sensing Analyses of Sediment Plumes. Ph.D. Thesis, Loughborough University, Loughborough, UK, November 2015; p. 230. Available online: https://core.ac.uk/download/pdf/288374364.pdf (accessed on 28 September 2020).
  58. Jiang, X.; Jianfeng, H.E.; Caim, I. Abundance and biomass of heterotrophic microbes in the Kongsfjorden, Svalbard. Acta Oceanol. Sin. 2005, 24, 143–152. [Google Scholar]
  59. Jankowska, K.; Wiodarska-Kowalczuk, M.; Wieczorek, P. Abundance and biomass of bacteria in two glacial fjords. Pol. Polar Res. 2005, 26, 77–84. [Google Scholar]
  60. Wiktor, J.; Wojciechowska, K. Differences in taxonomic composition of summer phytoplankton in two fjords of West Spitsbergen, Svalbard. Pol. Polar Res. 2005, 26, 259–268. [Google Scholar]
  61. Thingstad, T.F.; Bellerby, R.G.; Bratbak, G.; Børsheim, K.Y.; Egge, J.K.; Heldal, M.; Larsen, A.; Neill, C.; Nejstgaard, J.; Norland, S.; et al. Counteractive carbon-to-nutrient coupling in an Arctic pelagic ecosystem. Nature 2008, 455, 387–390. [Google Scholar] [CrossRef]
  62. Piwosz, K.; Walkusz, W.; Hapter, R.; Wieczorek, P.; Hop, H.; Wiktor, J. Comparison of productivity and phytoplankton in a warm (Kongsfjorden) and a cold (Hornsund) Spitsbergen fjord in mid-summer 2002. Polar Biol. 2009, 32, 549–559. [Google Scholar] [CrossRef]
  63. Wang, G.; Guo, C.; Luo, W.; Cai, M.; He, J. The distribution of picoplanktonand nanoplankton in Kongsfjorden, Svalbard during late summer 2006. Polar Biol. 2009, 32, 1233–1238. [Google Scholar] [CrossRef] [Green Version]
  64. Piquet, A.M.-T.; Scheepens, J.F.; Bolhuis, H.; Wiencke, C.; Buma, A.G.J. Variability of protistan and bacterial communities in two Arctic fjords (Spitsbergen). Polar Biol. 2010, 33, 1521–1536. [Google Scholar] [CrossRef] [Green Version]
  65. Piquet, A.M.-T.; van de Poll, W.H.; Visser, R.J.W.; Wiencke, C.; Bolhuis, H.; Buma, A.G.J. Springtime phytoplankton dynamics in Arctic Krossfjorden and Kongsfjorden (Spitsbergen) as a function of glacier proximity. Biogeosciences 2014, 11, 2263–2279. [Google Scholar] [CrossRef] [Green Version]
  66. Piquet, A.M.-T.; Maat, D.S.; Confurius-Guns, V.; Sintes, E.; Herndl, G.J.; van de Poll, W.H.; Wiencke, C.; Buma, A.G.J.; Bolhuis, H. Springtime dynamics, productivity and activity of prokaryotesin two Arctic fjords. Polar Biol. 2016, 39, 1749–1763. [Google Scholar] [CrossRef]
  67. Sinha, R.K.; Krishnan, K.P.; Kerkar, S.; David, T.D. Spatio-temporal monitoring and ecological significance of retrievable pelagic heterotrophic bacteria in Konsfjorden, an Arctic Fjord. Indian J. Microbiol. 2016, 57, 116–120. [Google Scholar] [CrossRef] [Green Version]
  68. Carmack, E.; Wassmann, P. Food webs and physical-biological coupling on pan-Arctic shelves: Unifying concepts and comprehensive perspectives. Progr. Oceanogr. 2006, 71, 446–477. [Google Scholar] [CrossRef]
  69. Lalande, C.; Moriceau, B.; Leynaert, A.; Morata, N. Spatial and temporal variability in export fluxes of biogenic matter in Kongsfjorden. Polar Biol. 2016, 39, 1725–1738. [Google Scholar] [CrossRef]
  70. Zaborska, A.; Pempkowiak, J.; Papucci, C. Some sediment characteristics and sedimentation rates in an Arctic Fjord (Kongsfjorden, Svalbard). Annu. Environ. Prot. 2006, 8, 79–96. [Google Scholar]
  71. Azam, F.; Malfatti, F. Microbial structuring of marine ecosystems. Nature Rev. Microbiol. 2007, 5, 782–791. [Google Scholar] [CrossRef]
  72. Zajączkowska, B.; Zajączkowski, M. Quantitative microbiological survey in Hornsund, SW Spitsbergen. Reconnaissance study in summer 1985. Bull. Pol. Acad. Sci. 1989, 37, 79–84. [Google Scholar]
  73. Møller, E.F.; Nielsen, T.G. Plankton community structure and carbon cycling off the western coast of Greenland, with emphasis on sources of DOM for the bacterial community. Aquat. Microb. Ecol. 2000, 22, 13–25. [Google Scholar] [CrossRef]
  74. Cota, G.F.; Pomeroy, L.R.; Harrison, W.G.; Jones, E.P.; Peters, F.; Sheldon, W.M., Jr.; Weingartner, T.R. Nutrients, primary production and microbial heterotrophy in the southeastern Chukchi Sea: Arctic summer nutrient depletion and heterotrophy. Mar. Ecol. Prog. Ser. 1996, 135, 247–258. [Google Scholar] [CrossRef]
  75. Kalinowska, A.; Ameryk, A.; Jankowska, K. Microbiological Survey in Two Arctic Fjords: Total Bacterial Number and Biomass Comparison of Hornsund and Kongsfjorden. In Impact of Climate Changes on Marine Environments; Zielinski, T., Weslawski, M., Kuliński, K., Eds.; GeoPlanet: Earth and Planetary Sciences; Springer: Cham, Switzerland, 2015. [Google Scholar] [CrossRef]
  76. Fichot, C.G.; Benner, R. The spectral slope coefficient of chromophoric dissolved organic matter (S 275–295) as a tracer of terrigenous dissolved organic carbon in river-influenced ocean margins. Limnol. Oceanogr. 2012, 57, 1453–1456. [Google Scholar] [CrossRef] [Green Version]
  77. Stedmon, C.A.; Markager, S.; Kaas, H. Optical Properties and Signatures of Chromophoric Dissolved Organic Matter (CDOM) in Danish Coastal Waters. Estuar. Coast. Shelf Sci. 2000, 51, 267–278. [Google Scholar] [CrossRef]
  78. Nelson, N.B.; Carlson, C.A.; Steinberg, D.K. Production of chromophoric dissolved organic matter by Sargasso Sea microbes. Mar. Chem. 2004, 89, 273–287. [Google Scholar] [CrossRef]
  79. Sherr, E.B.; Sherr, B.F.; Wheeler, P.A.; Thompson, K. Temporal and spatial variation in stocks of autotrophic and heterotrophic microbes in the upper water column of the central Arctic Ocean. Deep Sea Res. I 2003, 50, 557–571. [Google Scholar] [CrossRef]
  80. Howard-Jones, M.H.; Ballard, V.D.; Allen, A.E.; Frischer, M.E.; Verity, P.G. Distribution of bacterial biomass and activity in the marginal ice zone of the central Barents Sea during summer. J. Mar. Syst. 2002, 38, 77–91. [Google Scholar] [CrossRef]
  81. Tam, L.; Kevan, P.G.; Trevors, J.T. Viable bacterial biomass and functional diversity in fresh and marine waters in the Canadian Arctic. Polar Biol. 2003, 26, 287–294. [Google Scholar] [CrossRef]
  82. Azam, F.; Smith, D.C.; Steward, G.F.; Hagström, Å. Bacteria-organic matter coupling and its significance for oceanic carbon cycling. Microb. Ecol. 1994, 28, 167–179. [Google Scholar] [CrossRef]
  83. Azam, F.; Long, R.A. Sea snow microcosms. Nature 2001, 414, 495–498. [Google Scholar] [CrossRef]
  84. Jiao, N.; Robinson, C.; Azam, F.; Thomas, H.; Baltar, F.; Dang, H.; Hardman-Mountford, N.J.; Johnson, M.; Kirchman, D.L.; Koch, B.P.; et al. Mechanisms of microbial carbon sequestration in the ocean—Future research directions. Biogeosciences 2014, 11, 5285–5306. [Google Scholar] [CrossRef] [Green Version]
  85. Sala, M.M.; Terrado, R.; Lovejoy, C.; Unrein, F.; Pedrós-Alió, C. Metabolic diversity of heterotrophic bacterioplankton over winter and spring in the coastal Arctic Ocean. Environ. Microbiol. 2008, 10, 942–949. [Google Scholar] [CrossRef]
  86. Arnosti, C.; Steen, A.D.; Ziervogel, K.; Ghobrial, S.; Jeffrey, W.H. Latitudinal gradients in degradation of marine dissolved organic carbon. PLoS ONE 2011, 6, e28900. [Google Scholar] [CrossRef]
  87. Huston, A.L.; Deming, J.W. Relationships between microbial extracellular enzymatic activity and suspended and sinking particulate organic matter: Seasonal transformations in the North Water. Deep-Sea Res. II 2002, 49, 5211–5225. [Google Scholar] [CrossRef]
  88. Kellogg, C.T.E.; Carpenter, S.D.; Renfro, A.A.; Sallon, A.; Michel, C.; Cochran, J.K.; Deming, J.W. Evidence for microbial attenuation of particle flux in the Amundsen Gulf and Beaufort Sea: Elevated hydrolytic enzyme activityon sinking aggregates. Polar Biol. 2011, 34, 2007–2023. [Google Scholar] [CrossRef]
  89. Azzaro, M.; Aliani, S.; Azzaro, F.; Decembrini, F.; Caroppo, C.; Giglio, F.; Langone, L.; Maimone, G.; Rappazzo, A.C.; Mancuso, M.; et al. Short-term dynamics of nutrients, planktonic abundances and microbial respiratory activity in the Arctic Kongsfjorden (Svalbard, Norway). Polar Biol. submitted.
  90. Sala, M.M.; Arrieta, J.M.; Boras, J.A.; Duarte, C.M.; Vaqué, D. The impact of ice melting on bacterioplankton in the Arctic Ocean. Polar Biol. 2010, 33, 1683–1694. [Google Scholar] [CrossRef] [Green Version]
  91. Zappalà, G.; Bruzzone, G.; Azzaro, M.; Caruso, G. New advanced technology devices for operational oceanography in extreme conditions. Int. J. Sus. Dev. Plann. 2017, 12, 61–70. [Google Scholar] [CrossRef] [Green Version]
Figure 1. Location of the sampling stations along a transect in Kongsfjorden, Svalbard Islands (Arctic Norway).
Jmse 08 00824 g001
Figure 2. (a) Mean values ± S.E. of water temperature and salinity measured along the Kongsfjorden transect from the entrance to the glacier, and vertical profile of the station 4 (0–100 m). (b) Mean values ± S.E. of water dissolved oxygen and turbidity measured along the Kongsfjorden transect, from the entrance to the glacier, and vertical profile of the station 4 (0–100 m).
Jmse 08 00824 g002aJmse 08 00824 g002b
Figure 3. Vertical profiles of temperature at stations 14 and 23, showing the signal of colder waters from ice melting at 5 and 3.5 m, respectively.
Jmse 08 00824 g003
Figure 4. Mean values ± S.E. of Chl-a and TSM concentrations measured along the Kongsfjorden transect, from the entrance to the glacier, and vertical profile of the station 4 (0–100 m).
Jmse 08 00824 g004
Figure 5. (a) Absorption coefficients measured in the study area; (b) vertical profile of the absorption coefficient obtained at a 400 nm wavelength at station 4.
Jmse 08 00824 g005
Figure 6. Mean abundance ± S.E of total bacterial cells (black columns), active respiring cells (labelled by CTC treatment, grey columns), heterotrophic bacteria (line).
Jmse 08 00824 g006
Figure 7. Mean values ± S.E. of enzyme activity rates (LAP, leucine aminopeptidase; GLU, beta-glucosidase; AP, alkaline phosphatase) measured in the Kongsfjorden transect from the entrance to the glacier, and vertical profile of the Station 4 (0–100 m).
Jmse 08 00824 g007
Figure 8. Multidimensional scaling (MDS) analysis of environmental and microbiological variables; the similarity (S) level among the variables is indicated.
Jmse 08 00824 g008
Figure 9. Dendrogram obtained by the cluster analysis of environmental and microbiological data. The main sub-clusters identified according to the Euclidean distance values were indicated by the triangles.
Jmse 08 00824 g009
Table 1. Geographical coordinates of the studied stations.
StationsLatitudeLongitude
478°54′ 36.00″ N12°15′ 0.00″ E
578°54′ 0.00″ N12°16′ 12.00″ E
1478°53′ 24.00″ N12°19′ 12.00″ E
678°53′ 24.00″ N12°22′ 12.00″ E
2378°52′ 48.00″ N12°25′ 12.00″ E
778°52′ 12.00″ N12°28′ 12.00″ E
878°52′ 12.00″ N12°31′ 48.00″ E
Table 2. Concentrations of trophic variables: inorganic compounds (ammonium NH4, nitrites NO2+ nitrates NO3, and orthophosphate PO4), Total Carbon, Inorganic and Particulate Organic Carbon (POC), Particulate Organic Nitrogen (PON), and C/N molar ratio measured at the examined stations.
SampleNH4NO2+NO3PO4Total CInorganic CPOCPONC/N
(Station-Depth)µMµMµMµgC/LµgC/LµgC/Lµg/LMolar Ratio
4–1 m0.500.140.15173.6026.19147.4128.206.10
4–5 m0.580.120.13249.2838.23211.0543.735.63
4–25 m0.760.140.19--397.2060.697.64
4–50 m1.441.870.40204.4652.50151.9630.795.76
4–75 m0.993.120.48188.5812.57176.0127.157.56
4–100 m1.305.600.46170.1444.26125.8815.389.55
5–0.5 m0.450.170.10165.4129.62135.7926.545.97
14–0.5 m0.610.130.10293.93140.35153.5831.615.67
6–0.5 m0.731.050.19103.8619.0684.7914.786.69
23–0.5 m0.983.360.34154.2262.5991.6414.487.38
7–0.5 m1.052.620.33112.8339.5273.3112.506.84
8–0.5 m1.152.670.39174.5347.2567.9413.435.90
Table 3. Relative contribution of phytoplanktonic biomass (Phyto-B), prokaryotic biomass (PB), and detritus to total Particulate Organic Carbon (POC) pool.
SamplePhyto-B
(mg/l)
%
of POC
BB
(mg/l)
%
of POC
Detritus (mg/l)%
of POC
4–1 m8.285.6242.3228.7196.8165.68
4–5 m5.642.6755.3126.21150.1071.12
4–25 m62.5215.7421.985.53312.7078.73
4–50 m40.6426.7450.5533.2660.7739.99
4–75 m12.447.0757.4232.62106.1560.31
4–100 m5.64.4522.9318.2197.3577.34
5–0.5 m12.49.1325.2418.5998.1472.28
14–0.5 m10.526.8534.8322.68108.2370.47
6–0.5 m1.321.5633.1339.0750.3459.37
23–0.5 m7.27.8616.6018.1267.8474.03
7–0.5 m7.29.8219.1226.0846.9964.10
8–0.5 m2.483.6534.2250.3731.2445.98
Publisher’s Note: MDPI stays neutral with regard to jurisdictional claims in published maps and institutional affiliations.

