1. Introduction
The preservation of sandy coastlines around the world requires regular maintenance with ‘soft measures’ using sand to mitigate potential erosion from natural and anthropogenic causes [
1,
2,
3,
4,
5,
6]. Over time, these sand nourishments will disappear, but the sand will still be beneficial for the sediment balance of the coastal cell. Historically, the most common type of sand nourishment is placed at the beach from 2 m below mean sea level (MSL) up to the dunefoot at MSL +5 m (e.g., [
7,
8]), but considerably larger sub-tidal nourishments (referred to as ‘shoreface nourishments’) are also placed nowadays to replenish the beach [
9]. These shoreface nourishments are placed as relatively long (2 to 10 km) sand bodies in depths ranging from MSL −10 to −4 m, which simplifies the process of nourishing as dredging vessels can navigate towards the location where the sand needs to be placed. Investigations of the behaviour of shoreface nourishments in the Netherlands at Terschelling, Egmond and Noordwijk [
10,
11,
12,
13] show that shoreface nourishments remain in place for a much longer period than beach nourishments. About 45% of the sediment was, for example, still in place at the Egmond 1999 nourishment after three years [
12]. The available studies showed erosion at the shoreface nourishment and some accretion in the inner surfzone (i.e., ∼MSL −2 m). This is explained by Hoekstra et al. [
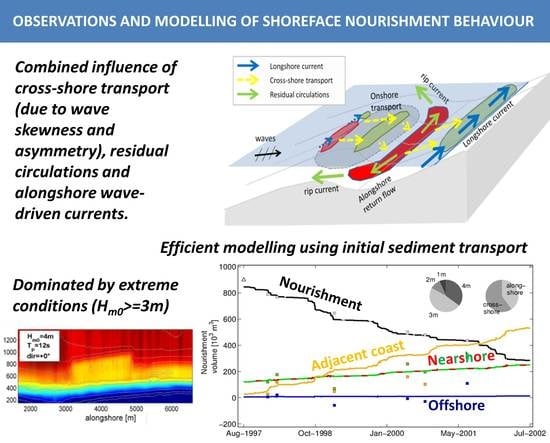
10] with a concept of a shoreface nourishment which acts as a submerged breakwater which retains sand from the alongshore wave-driven current, while cross-shore processes play only a subtle role. A study for Egmond ([
12]) did, however, conclude that part of the accretion in the shallow nearshore zone is due to cross-shore processes on the basis of simulations with a cross-shore model capable of resolving bar migration. In addition, schematic computations by Grunnet and Ruessink [
11] indicate an enhancement of the skewness of the wave orbital motion (i.e., enhanced landward velocities of the orbital wave motion) at the nourishment resulting in onshore transport. The relative contribution of alongshore and cross-shore processes could, however, not be quantified, as 2DH models were hindered by artificial flattening of the bars (e.g., [
14]), while a stable sub-tidal bar could only be maintained in cross-shore profile models ([
15,
16]). This is a problem since answering the questions on the driving processes at shoreface nourishments will require a method, which can compute both alongshore and cross-shore profile change while keeping the natural profile (with sub-tidal bar) in place.
In addition, the representativeness of the studied shoreface nourishments for other regions is under discussion as the shoreface nourishment at Terschelling is placed inside the trough of the natural bar system [
10], while other shoreface nourishments (e.g., at Egmond; [
12]) are placed at the seaward side of the sub-tidal bar. Furthermore, the Noordwijk nourishment eroded at a slower pace than the other nourishments [
13]. It is therefore very relevant to better understand the behaviour of shoreface nourishments at other field sites (and with different properties) to create generic knowledge and modelling methods that can be used effectively for future beach maintenance plans.
Relevant for the investigation of shoreface nourishments is the interaction with the natural bar system, which according to Van der Spek and Elias [
9] consists of a temporary blockage of the natural offshore bar migration at the Dutch coast. Landward transport was even observed at the Delfland coast (i.e., southern Holland coast) by Radermacher et al. [
17] as a result of the placement of shoreface nourishments which pushed the existing bars towards the coast. It is envisioned that the delicate balance of onshore (e.g., [
18,
19]) and offshore directed transport processes (e.g., due to the undertow current and long infra-gravity waves; [
20,
21]) at natural sub-tidal bars also controls the behaviour of shoreface nourishments. Since placing a disturbance in the profile (such as a shoreface nourishment) is likely to adjust the balance of cross-shore transport processes. Model simulations by Jacobsen and Fredsoe [
16] showed such detailed cross-shore profile changes after placement of a nourishment, which consisted of an increase of the crest height of the bar (located between MSL −1 m and MSL −2 m) and erosion at the landward side of the nourishment crest. Furthermore, Jacobsen and Fredsoe [
16] found an increase of offshore losses after placement of nourishment sand in the trough region for the considered situation, but large offshore losses were not observed by Hoekstra et al. [
10] and Grunnet and Ruessink [
11] for the Terschelling nourishment which was also placed in a trough. It is uncertain what causes this discrepancy for both situations (e.g., the crest height of the bar or wave conditions), but illustrates the difficulties in finding general rules for the behaviour of shoreface nourishments.
This research aims at providing an overview of the morphological development of multiple shoreface nourishments with varying properties, which is then used to validate a modelling approach for the erosion and redistribution of sediment from the nourishments showing the relevance of the driving processes. For this purpose, the cross-shore profile change and alongshore redistribution are studied for 19 shoreface nourishments on the alongshore uniform sections of the Dutch coast. Volumetric changes are computed over time for predefined spatial regions (e.g., nourishment, trough and nearshore) and related to the geometrical properties, thus showing erosion and accretion rates for each of the spatial regions, especially the morphological development in the first 3 years after construction is studied. A modelling approach using precomputed sedimentation and erosion rates for a matrix of possible conditions is then validated against the observed rates of erosion and accretion. In this way, understanding is created of the driving processes, as well as a validated generic forecast method.
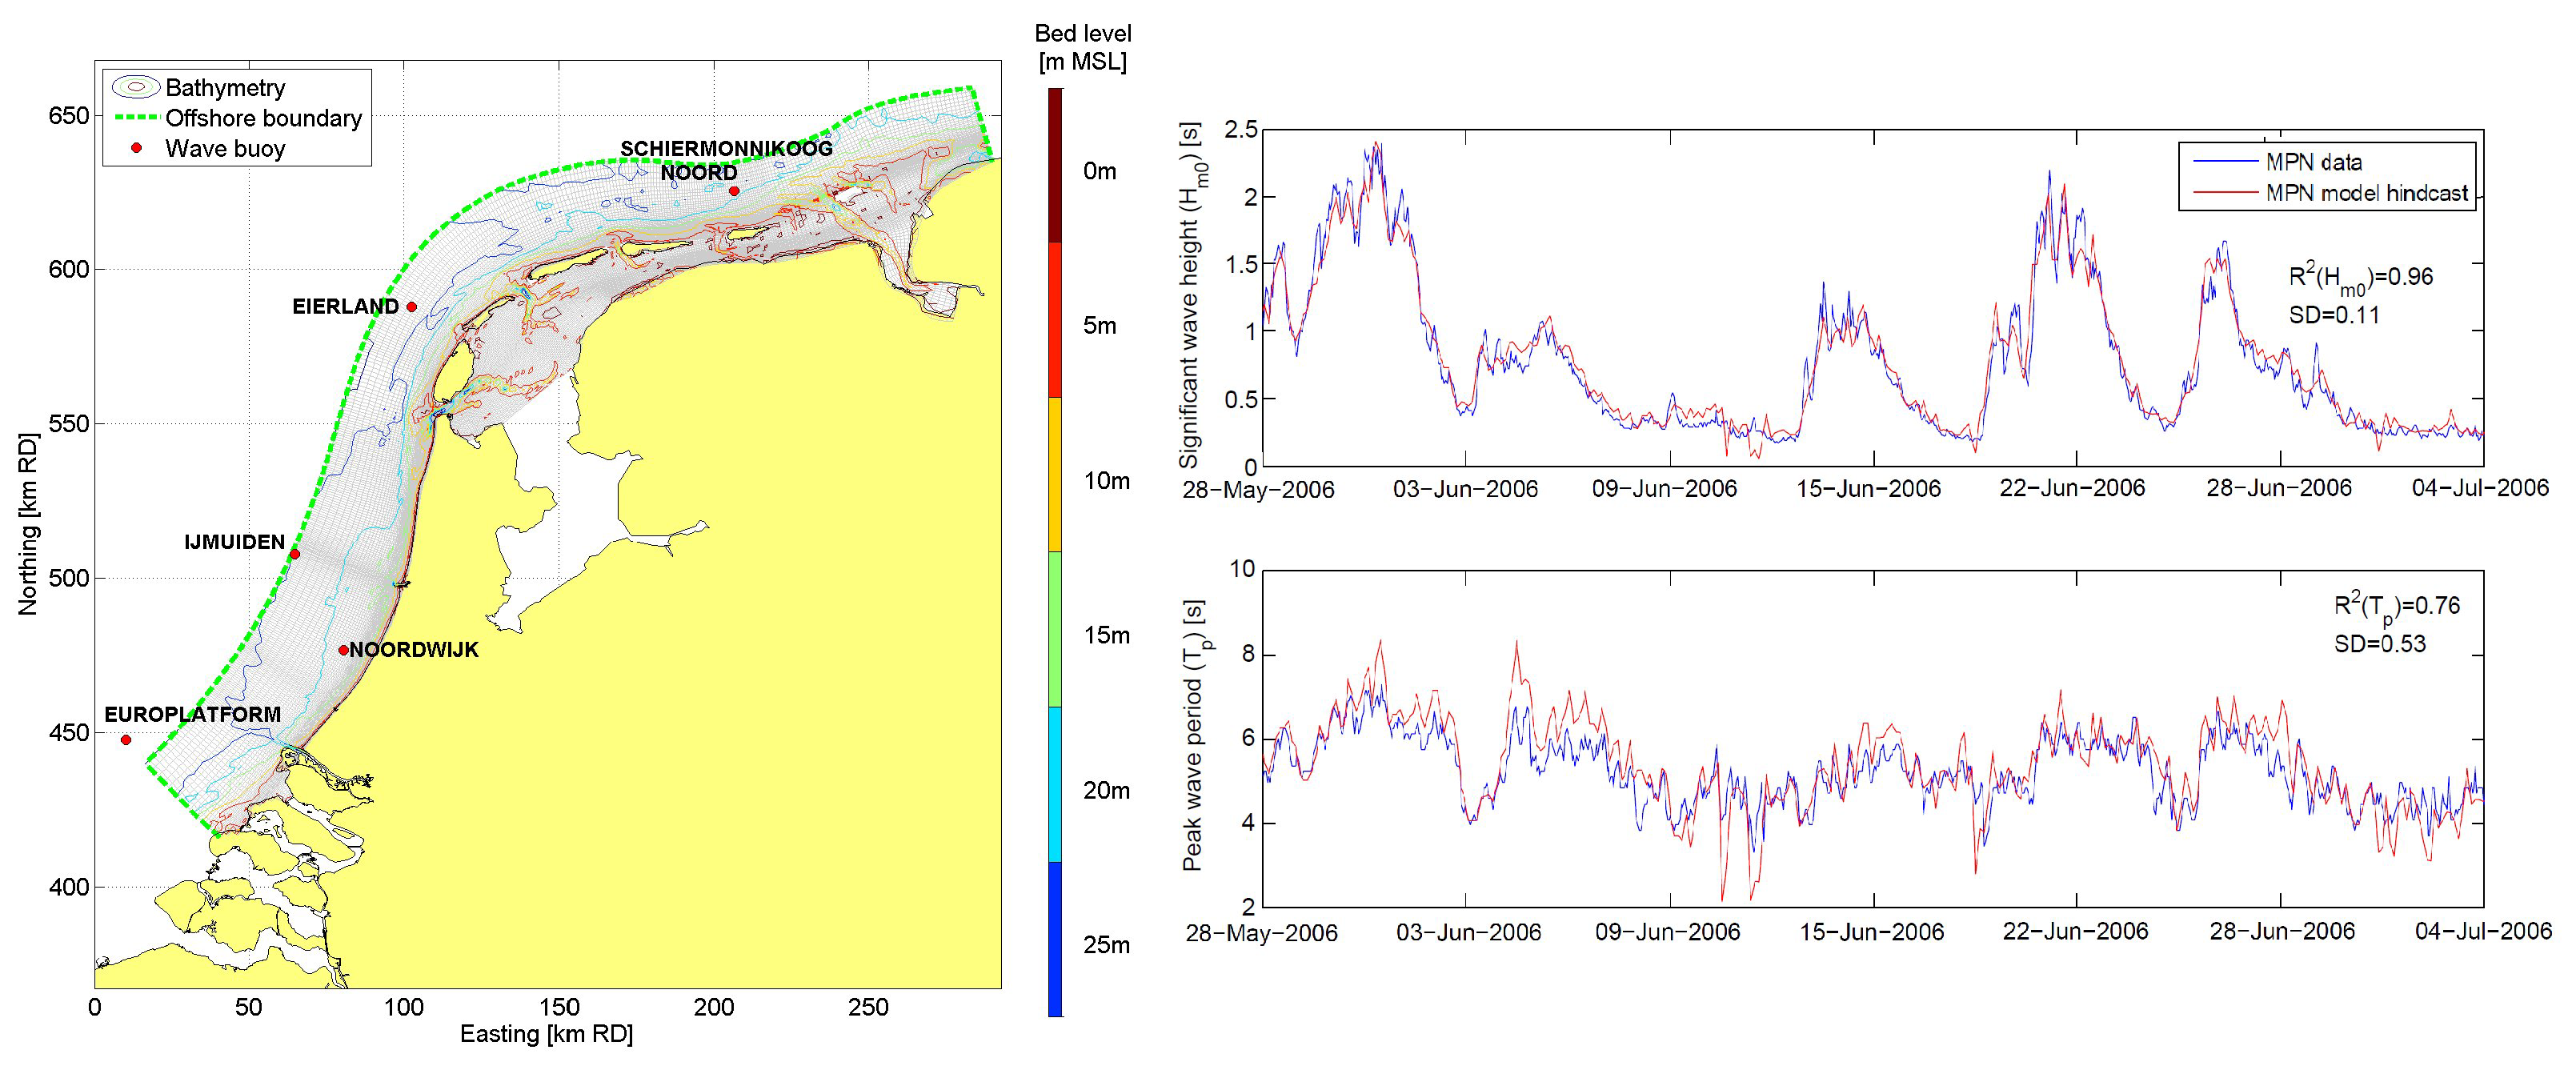
2. Study Area
The Dutch coast is characterized as a sandy coast with a micro-tidal environment [
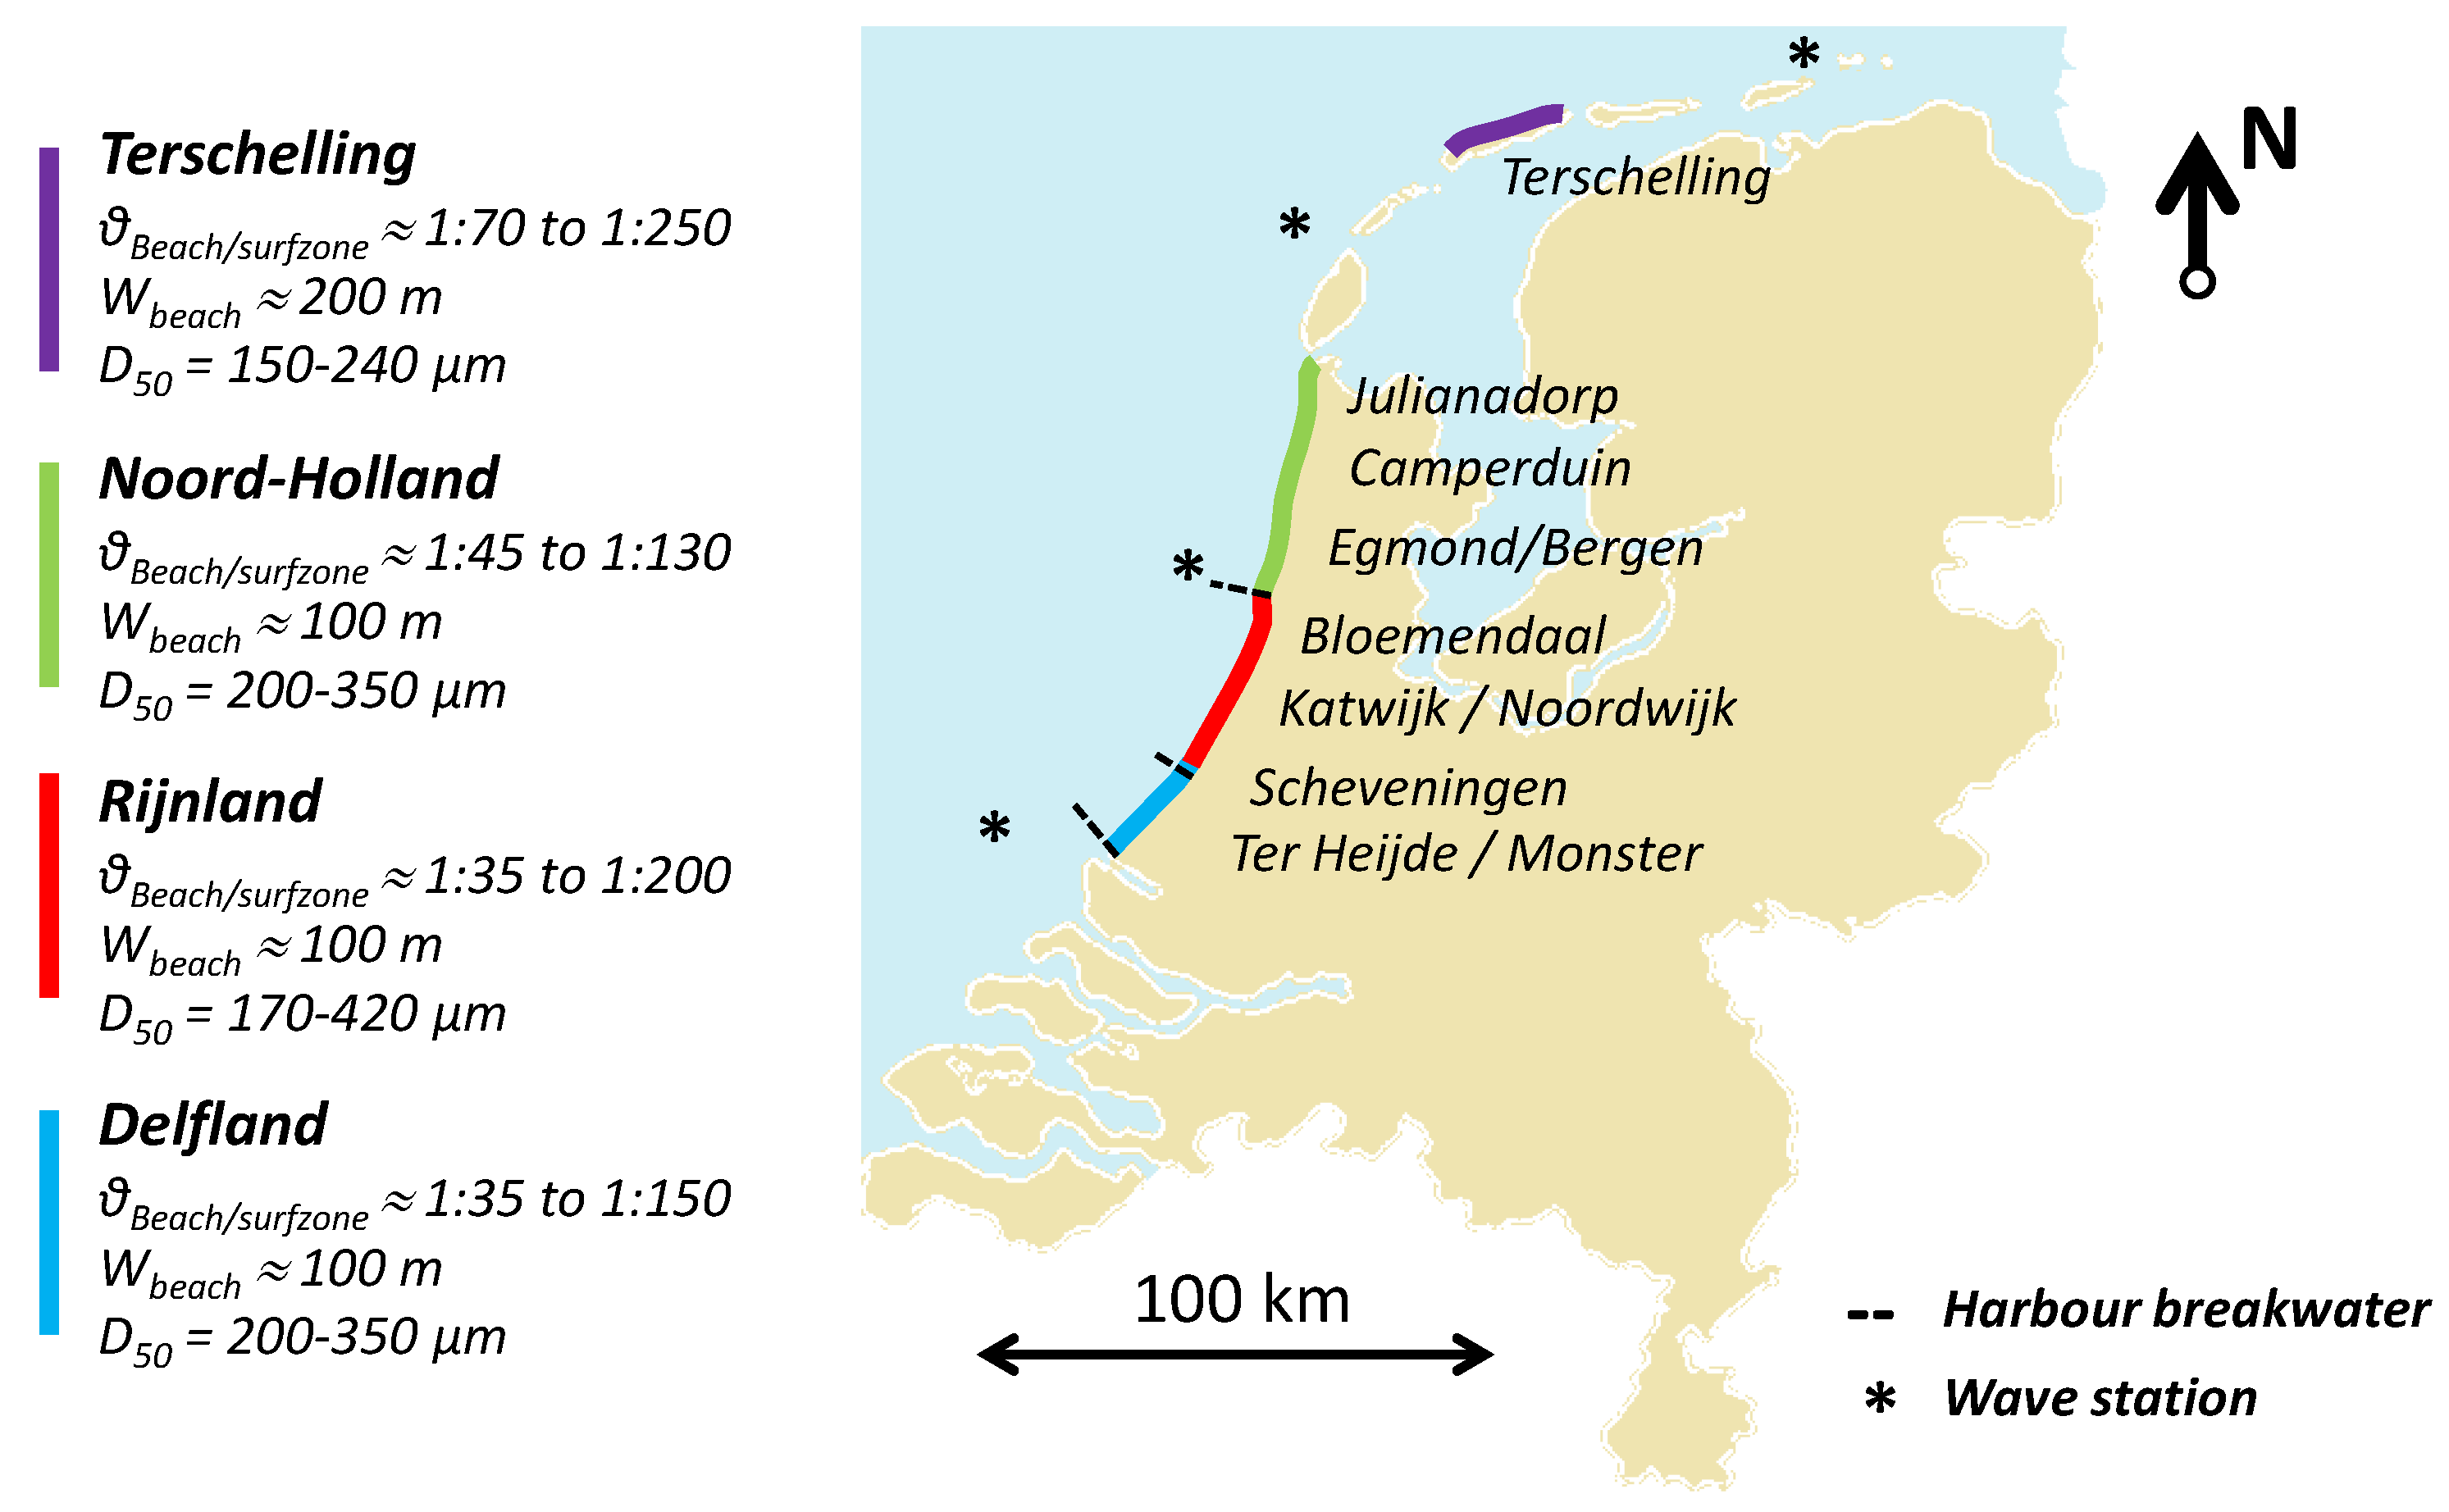
22]. This study considers nourishments at four different sections of the Dutch coast (‘Delfland’, ‘Rijnland’ and ‘North–Holland’ and ‘Terschelling’). Each of these regions has specific characteristics with respect to the bathymetry, wave conditions and sediment composition (
Figure 1).
The Delfland and Rijnland beaches are characterized by a beach slope of 1:35 with a gradual transition to a milder slope of 1:150 to 1:200 in the surfzone (MSL to MSL −8 m; [
23,
24]). The North–Holland coast has a beach slope of 1:45 to 1:60, a steeper sub-tidal profile (1:100 to to 1:130) and a more complex shoreface with a large tidal channel in the North. The beach and surfzone at Terschelling are milder with a beach slope of 1:70 and a 1:200 to 1:250 slope in the sub-tidal profile. A maximum of five sand bars can be present in a single cross-shore profile at the Holland coast [
15,
25,
26] of which the amplitude varies in seaward direction. Ruessink et al. [
23] shows that largest bar-crest amplitudes are found at water depths of about MSL −4 m at the Delfland and Rijnland coast, MSL −5 m at North–Holland and MSL −6 m at Terschelling. The natural bars are influenced by storms which push the bar in seaward direction, while onshore movement of the bar takes place during quiet conditions [
27]. Over longer time-frames, they show a net offshore migration with cycle times between 3 and 15 years at the Dutch coast (e.g., [
23,
25,
28,
29]), but this behaviour is affected by nourishments as the offshore migration of the sub-tidal bar at Egmond is temporarily halted after nourishment construction [
9].
A range of shoreface nourishments was investigated in this research (
Table 1). This comprises nourishments on alongshore uniform sections of coast, which includes the central sections of the barrier island of Terschelling. Each of the nourishments is monitored with sufficient frequency and is not influenced by other nourishments (i.e., within the first 3 to 5 years after construction). Most of the shoreface nourishments are constructed at the seaward side of the sub-tidal bar between MSL −8 m to MSL −3 m (e.g., [
12]), with the exception of the Terschelling nourishment which was constructed in the trough landward of the sub-tidal bar [
11].
The wave climate of the Dutch coast is characterized by wind waves which originate either from the southwest (i.e., dominant wind direction) or the northwest (i.e., direction with largest fetch length). For Terschelling, this means that the waves predominantly approach from the northwest, because the southwestern component is shielded by land. Offshore wave data are available from an offshore platform (‘Europlatform’) at 32 m water depth West off the Delfland coast, the IJmuiden wave station (between Rijnland and North–Holland), the ‘Eierland’ wave measurement buoy in the northwest (between the islands of Texel and Vlieland) and the Schiermonnikoog North buoy (at about 40 km East of Terschelling). The wave climate is characterized by average significant wave height (
) of about one meter in summer and 1.7 m in winter [
22] with typical winter storms with wave heights (
) of 4 to 5 m and a wave period of about 10 s [
30]. The storms originate from the northwest and coincide with a typical storm surge of 0.5 to 2 m. The tidal current is asymmetric with largest flow velocities towards the north during the flood (∼0.7 m/s) and a longer period with ebb-flow in the southern direction (∼0.5 m/s; [
22]). The tidal wave at this part of the North Sea is a progressive wave with largest flood velocities occurring just before high water.
The natural sediment at the Delfland, Rijnland and North–Holland coast can be characterized as medium sand at the waterline (
D of 300 to 400 µm at the Delfland coast) which gradually fines in seaward direction to a
D of 150 to 200 µm at MSL −8 m and deeper [
31,
32]. Sediment at Terschelling is finer than at the other locations with a
of about 240 µm at the waterline with a gradual decrease to 150 µm at MSL −8 m [
33]. Specifications from Rijkswaterstaat prescribe that the nourishment sediment is similar to the natural beach sediment [
34,
35]. The
at Egmond’99, Bergen’00 and Noordwijk’98 nourishments was measured, which indicated a
of respectively 228 µm, 250 µm and 400 µm [
13]. However, some uncertainty is present in these measurements as the sediment size is expected to vary over the cross-shore profile of the shoreface nourishment. Nourished sediment at the Terschelling coast was slightly coarser than the natural sediment at the depth where it was applied (i.e.,
about 10 to 50 µm larger at MSL −4 m to MSL −6 m depth). Details on the applied sediment for the other nourishment sites are not available. The borrow areas are typically located in relative close proximity (i.e., 10 to 50 km) from the coastal section where the sediment is placed, which implies that the origin of the sediment is typically similar. It is therefore expected that the grain size distribution of the nourished material matches with the native material, which is relevant for the stability of the nourished material [
36,
37], although too little field measurements of sediment at shoreface nourishments are available to understand potential sorting processes during the placement of the nourished material. For the Holland coast, it is expected that sorting processes are especially relevant outside the surfzone (i.e., where the suspension of size fractions differs for coarse and fine sand grains; [
38]), while shoreface nourishments are placed for a large part inside the surfzone. The importance of sorting processes at shoreface nourishments should, however, be judged per site and and may need further investigation.
4. Observed Nourishment Behaviour
Post-construction morphological change of the considered shoreface nourishments is shown in
Figure 5 with respect to the pre-construction situation. A decrease in the volume (i.e., fading of the yellow and orange colours) is visible for most nourishments within the bounds of the initial nourishment area, which is demarcated as a black line. While some nourishments erode substantially within a few years (e.g., Katwijk’98 and Bergen’00), others hardly erode over a long period (e.g., Ter Heijde’01 and Terschelling’93). In addition, alongshore bands of erosion and accretion can be seen landward of the nourishment (i.e., shown in blue and yellow), which indicate a trough directly landward of the nourishment and accretion in the inner surfzone (∼MSL −2 m).
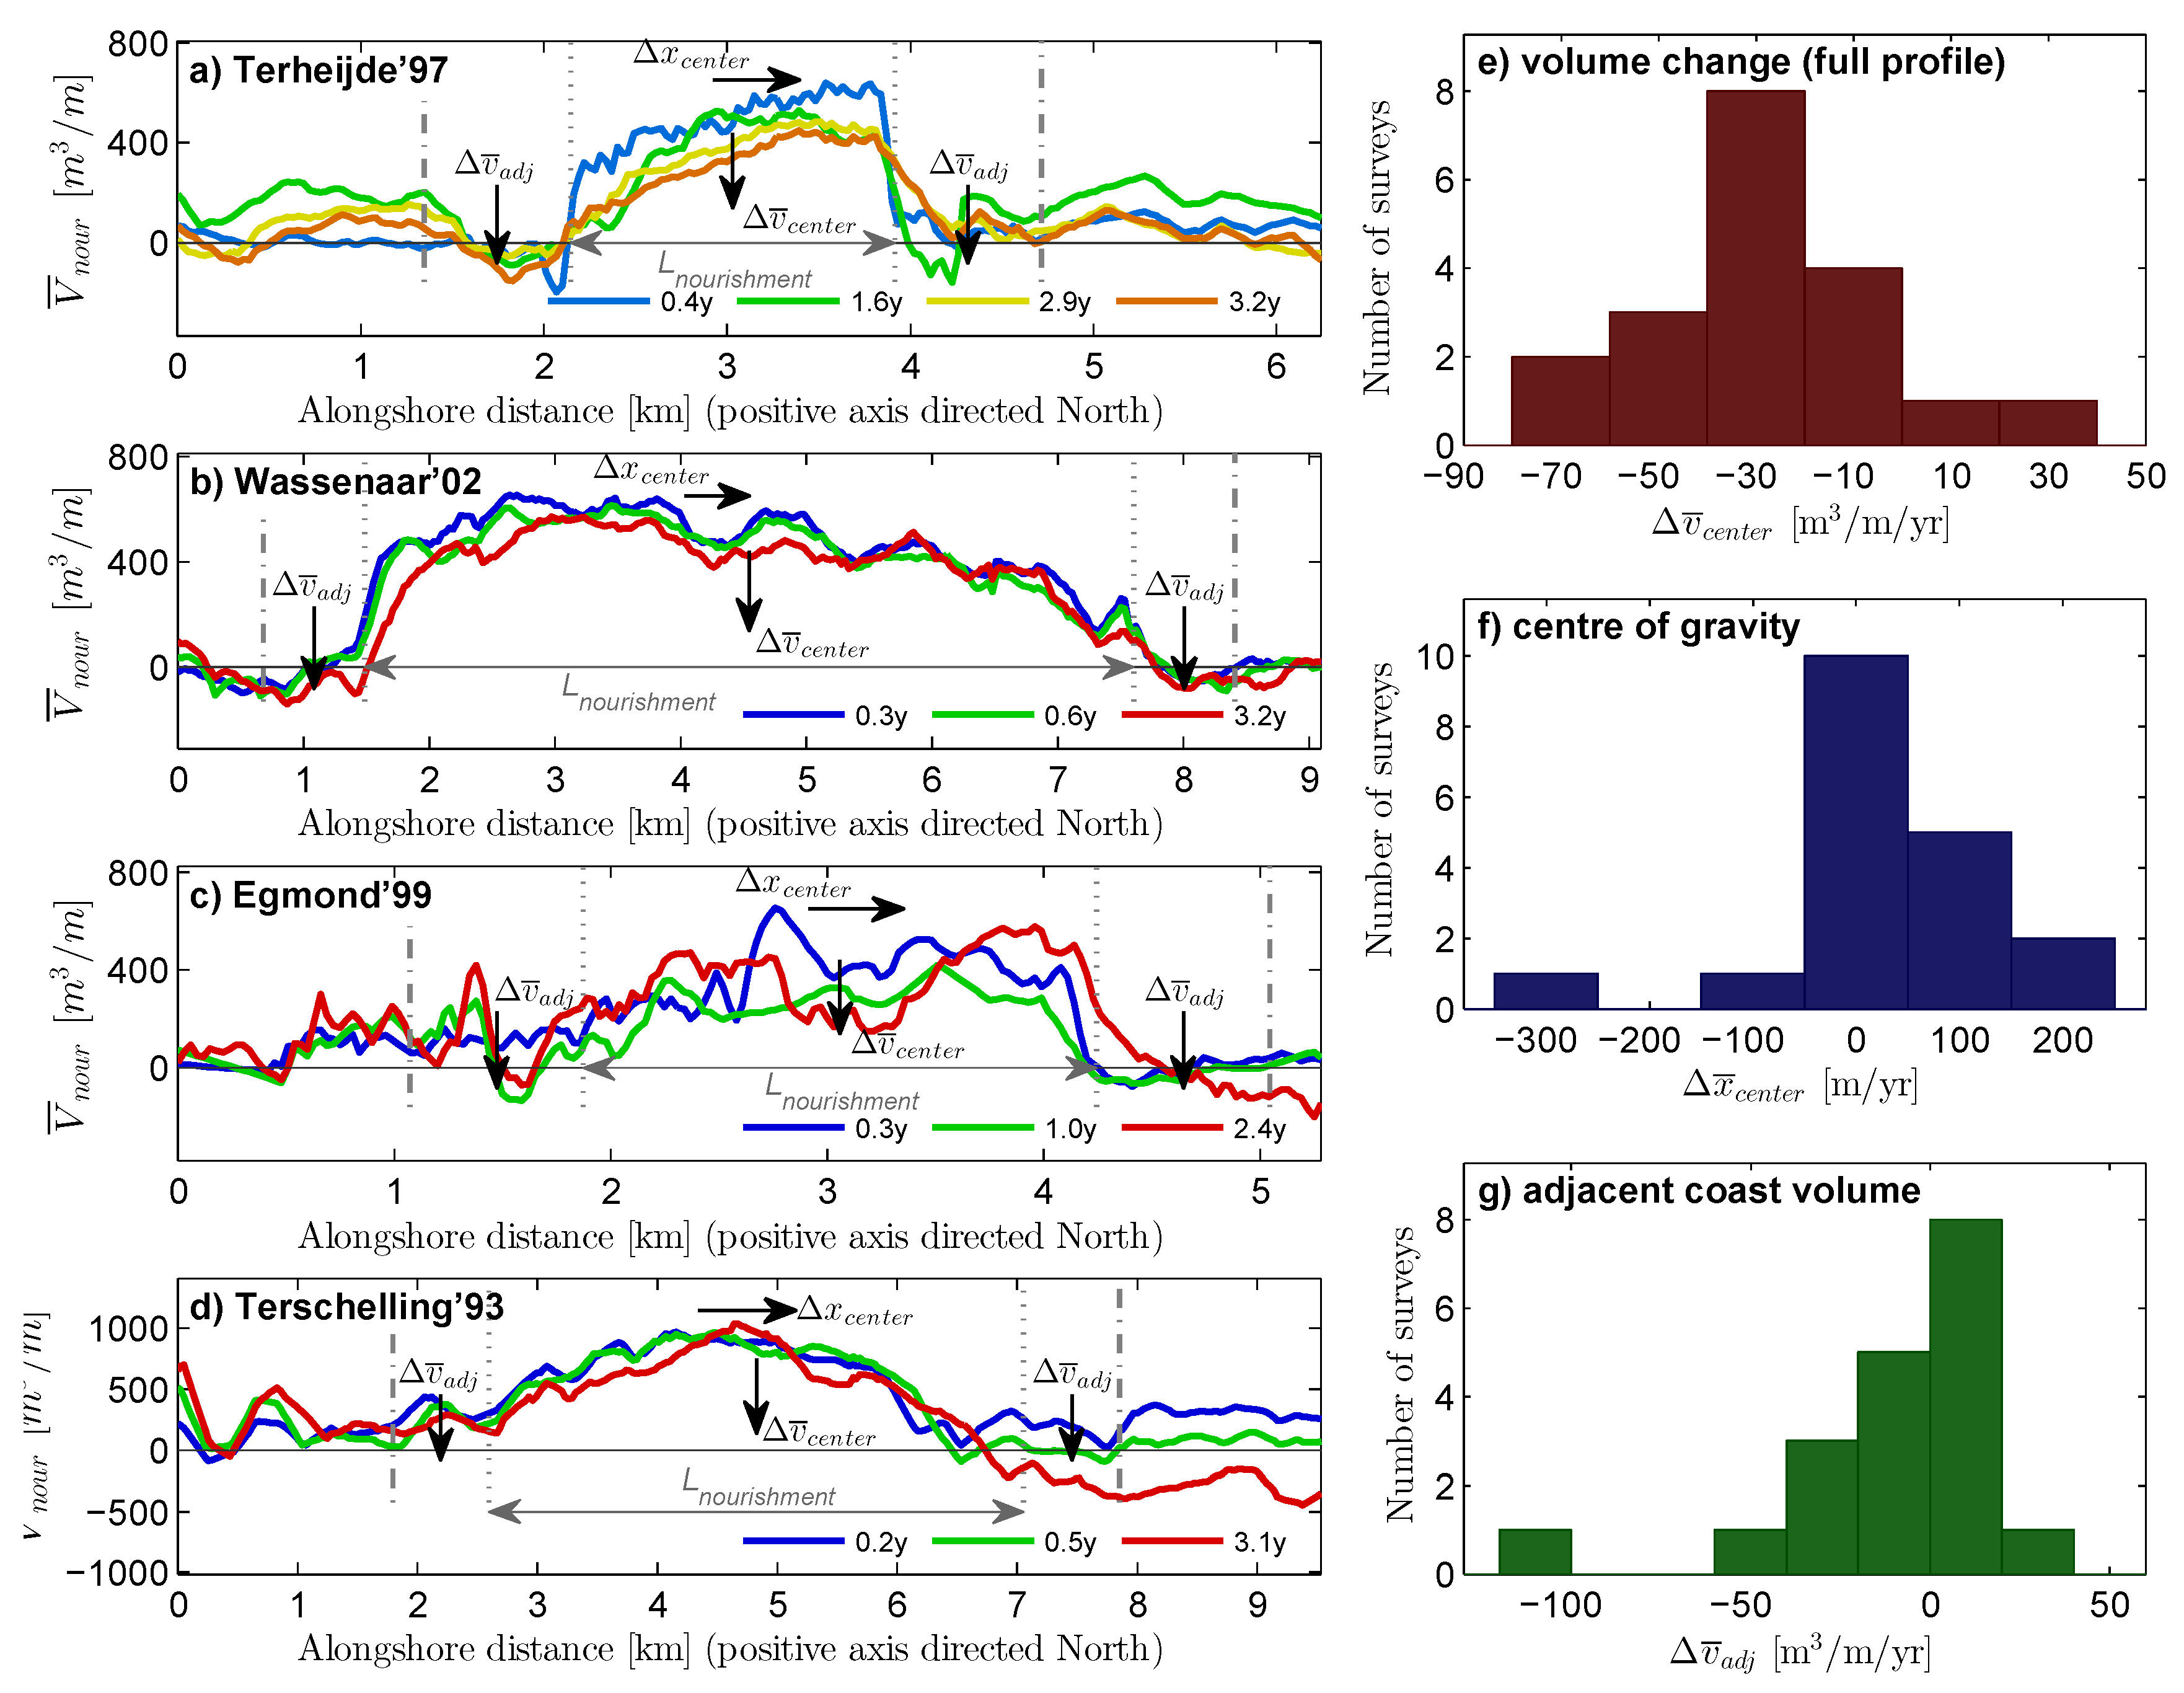
A cross-shore integration of the sediment volume (from MSL −10 m to MSL +2 m) is made for all considered coastal sections and exemplified for Ter Heijde’97, Wassenaar’02, Egmond’99 and Terschelling’93 (
Figure 6). The average erosion rate of these coastal sections where the nourishment was placed was 28 m
/m/yr (see
in
Figure 6e) with a standard deviation (
) of 27 m
/m/yr. The storage of sediment in the cross-shore profile can therefore differ substantially between sites. For some sites, a net increase in the sediment volume (in the full cross-shore profile) was found after placement of the nourishment (Zandvoort–Zuid’08 and Bloemendaal’08). More erosion took place on the southern ends of the coastal sections with the nourishments (i.e., within inner dashed boundaries) resulting in an alongshore shift of the center of gravity (
in
Figure 6f) of the sediment volume towards the North (e.g., at Ter Heijde’97). A southward movement of the center of gravity is observed only for Bergen’00 and Noordwijkerhout’02. The eroded sediment can often not be traced back at the adjacent coastal sections (
in
Figure 6g). Considerable erosion (>30 m
/m/yr) can take place directly adjacent to the coastal section of the nourishment (e.g., Noordwijk’98, Camperduin’02, Julianadorp’09 and Terschelling’93), but also moderate accretion (10 to 30 m
/m/yr) is observed adjacent at some adjacent coastal sections (e.g., Ter Heijde’97, Scheveningen’99 Bergen’00 and Hondsbossche & Pettemer Zeewering’09). It is expected that sediment has been moved out of the monitoring area, as a closed balance could not be obtained.
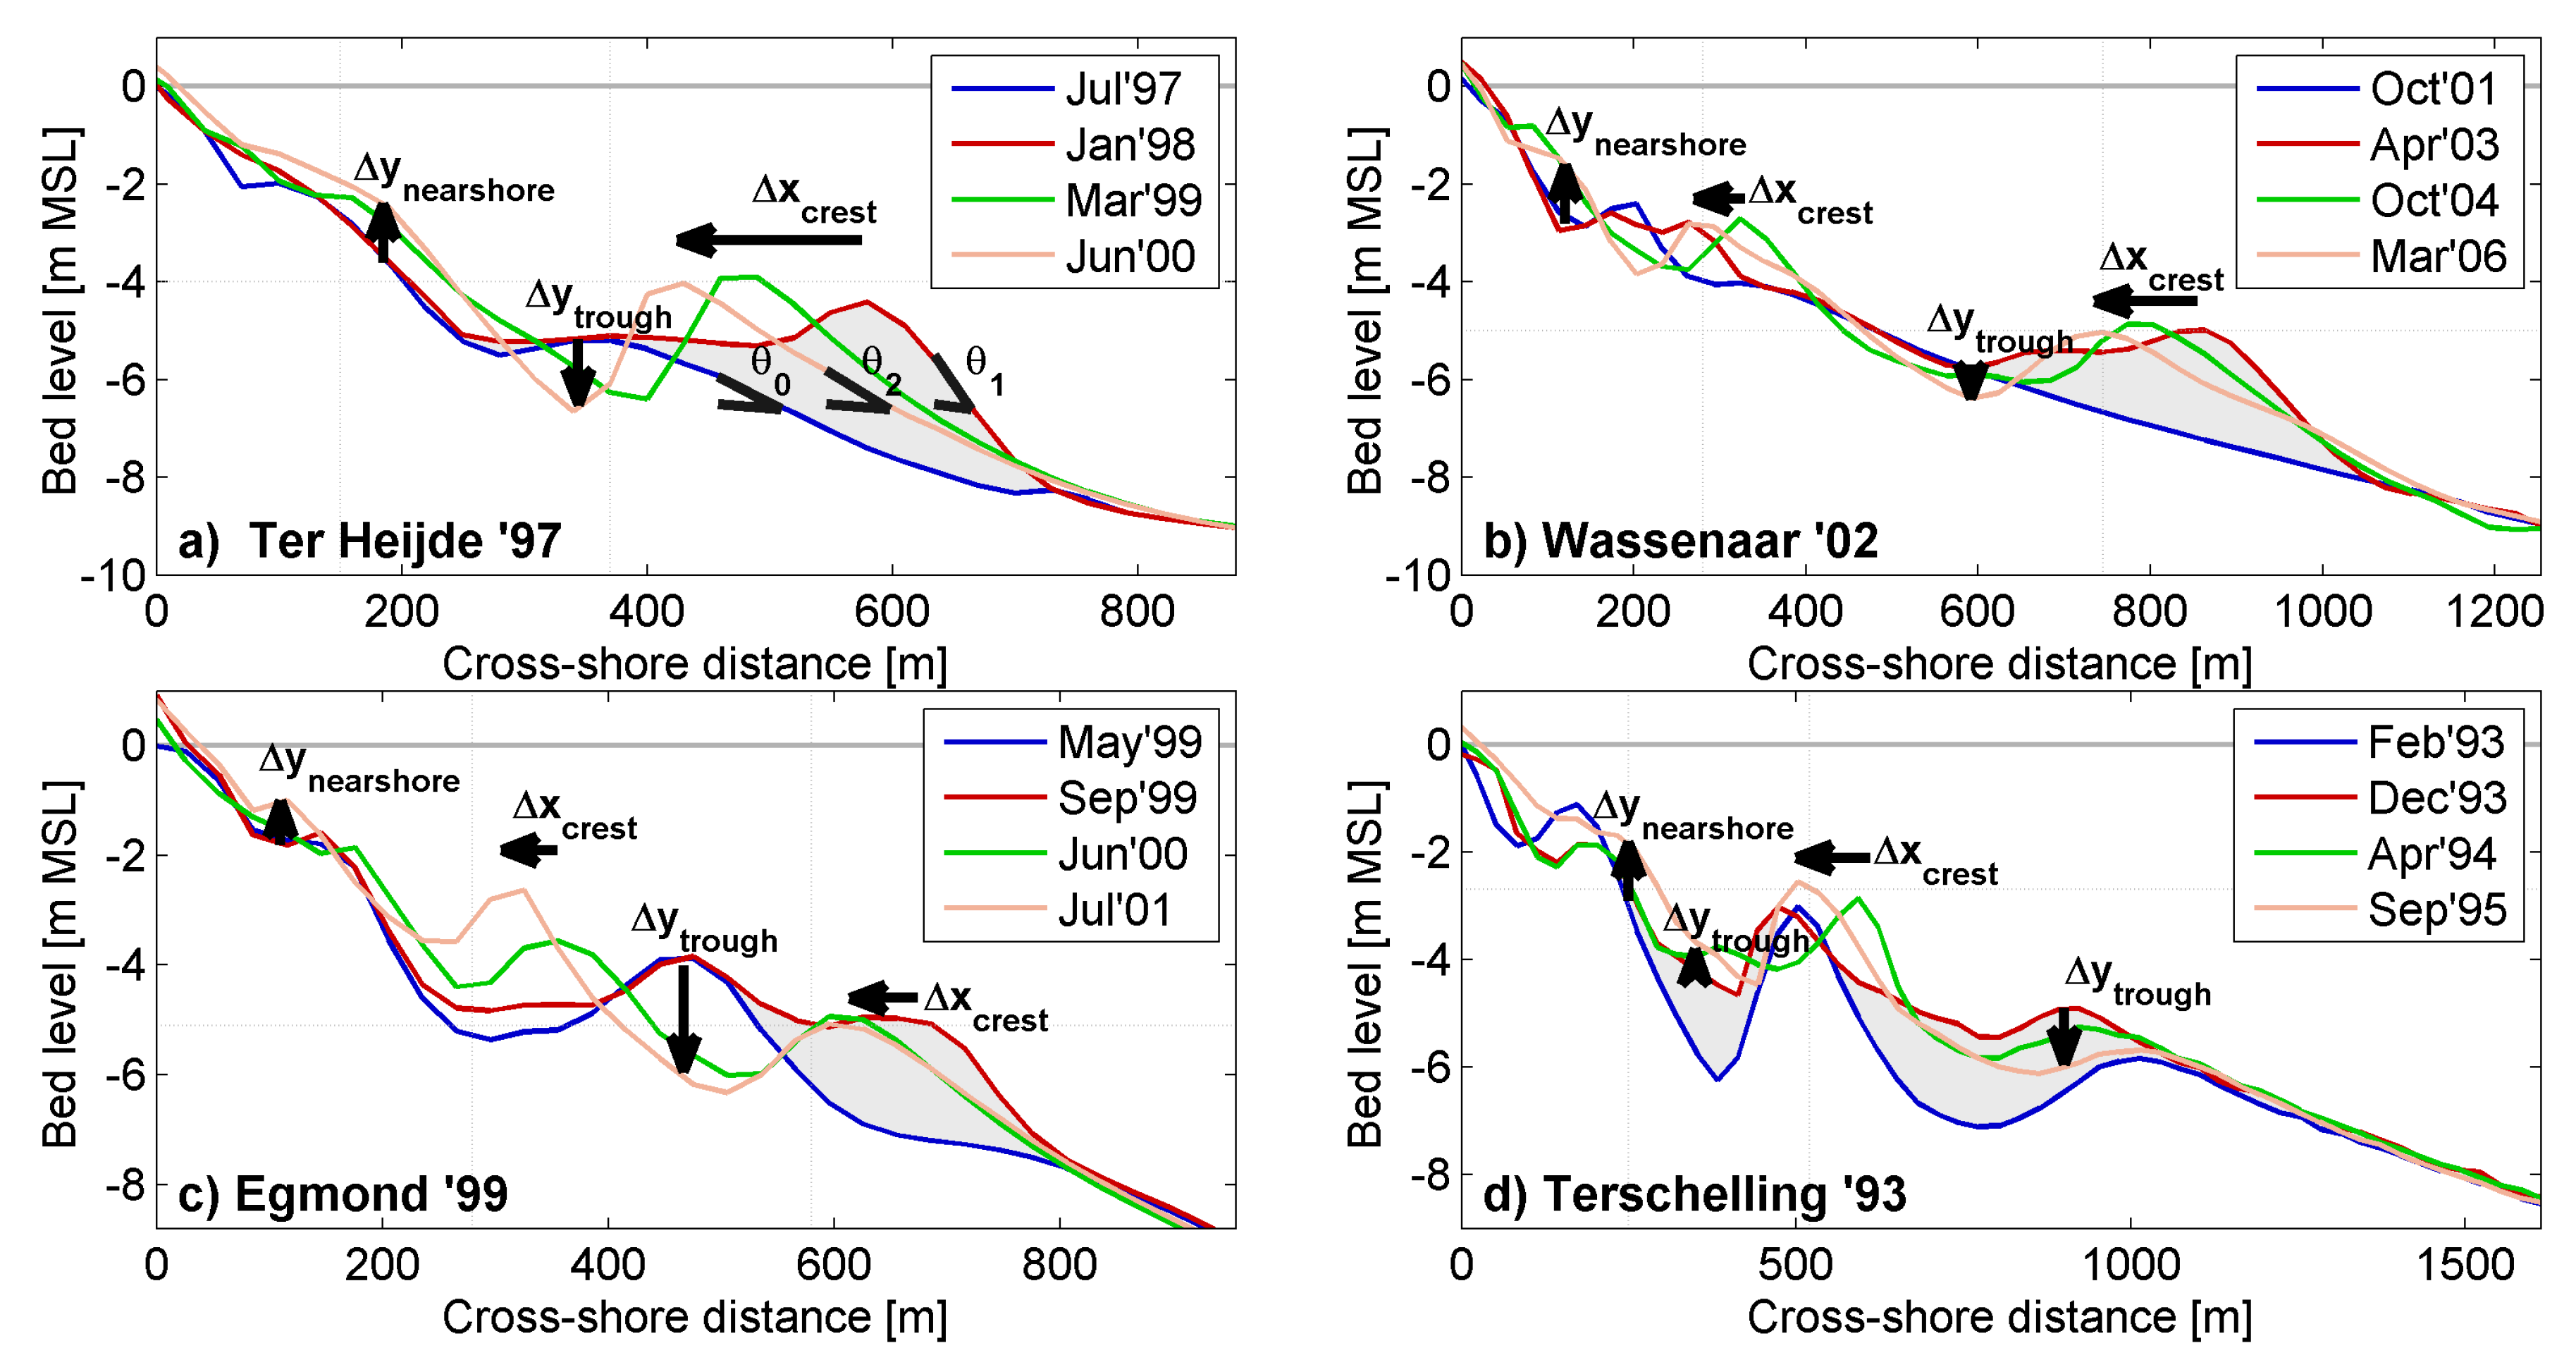
An overview of the cross-shore profile changes at the center of the shoreface nourishments (
Figure 7) is shown for four selected nourishments at the Delfland, Rijnland, North–Holland and Terschelling coast (Ter Heijde’97, Wassenaar’02, Egmond’99 and Terschelling’93), which exemplify the observed behaviour for other nourishments. The cross-section data show that a landward shift and increase in the height of the ‘nourishment crest’ can be observed for the post-construction profiles (
), which is most visible for the relatively short Ter Heijde’97 nourishment. After one to two years, the nourishment crest attains a depth of about MSL −4 m to −5 m and a cross-shore position that ranges between
x = 400 and
x = 800 m from the shoreline. This cross-shore location is in line with the cross-shore position and depth at which highest bar amplitudes are present in the cross-shore profile at the Holland coast [
23]. It is noted that the observed onshore migration of the nourishment crest in the first years after construction is opposite to the natural offshore directed bar cycle. After four to five years, the natural bar cycle takes over again and starts to move the bar in offshore direction.
On the other hand, the seaward side of the nourishments was eroding. As a result, the seaward facing slope of the nourishment had the tendency to become milder (from to ) and therefore more similar to the pre-construction profile slope (). The seaward sides of the considered nourishments had an average profile slope of 1:50 with a standard deviation () of 33 (for the first post-construction survey), and were therefore much steeper than the natural profile slope of 1:100 to 1:200. The seaward facing side of all of the nourishments gradually became milder over time with an average slope of 1:80 for the considered nourishments after ∼3 years (with a of 48), but remained steeper than the natural profile. The profile change is consistent over the length of the nourishment, which suggests that sediment is transported onto the nourishment in the cross-shore direction.
The landward facing slope of the nourishment became steeper in the first years due to an increase in crest height of the nourishment and the development of a trough at the landward side (
; between MSL −4 m and −6.5 m in
Figure 7) with a cross-shore extent of 100 to 150 m. The mean depth of the trough with respect to a long-term averaged profile was 0.5 to 2 m, which was within the bounds of the natural bar-migration cycle. However, a considerable erosion of up to 4 m has taken place for the Egmond’99 nourishment where a trough developed at the location of the existing bar (see
Figure 7). Most pronounced troughs developed for nourishments at the North–Holland coast. When considering all the nourishments, the trough depth seemed to be related to regional characteristics rather than a geometry related property (e.g., the length or volume of the nourishment). It can also be seen from
Figure 7 that some interaction of the shoreface nourishment with the natural bars took place in the measurements. Most of the 19 considered nourishments had only a small interaction with the natural bars, while a few show a landward push of the natural bar (e.g., Bergen & Egmond’05 and Bloemendaal’08). At Egmond’99, the natural bar is pushed towards the coast, while the nourishment merged with the existing bar at Ter Heijde’97, while the Wassenaar’02 site shows the creation of a small nearshore bar, which can be considered an in-between situation. The Terschelling’93 nourishment differed from other nourishments in the respect that accretion took place in the trough, but on the other hand showed a landward movement of the bar crest as for the other sites.
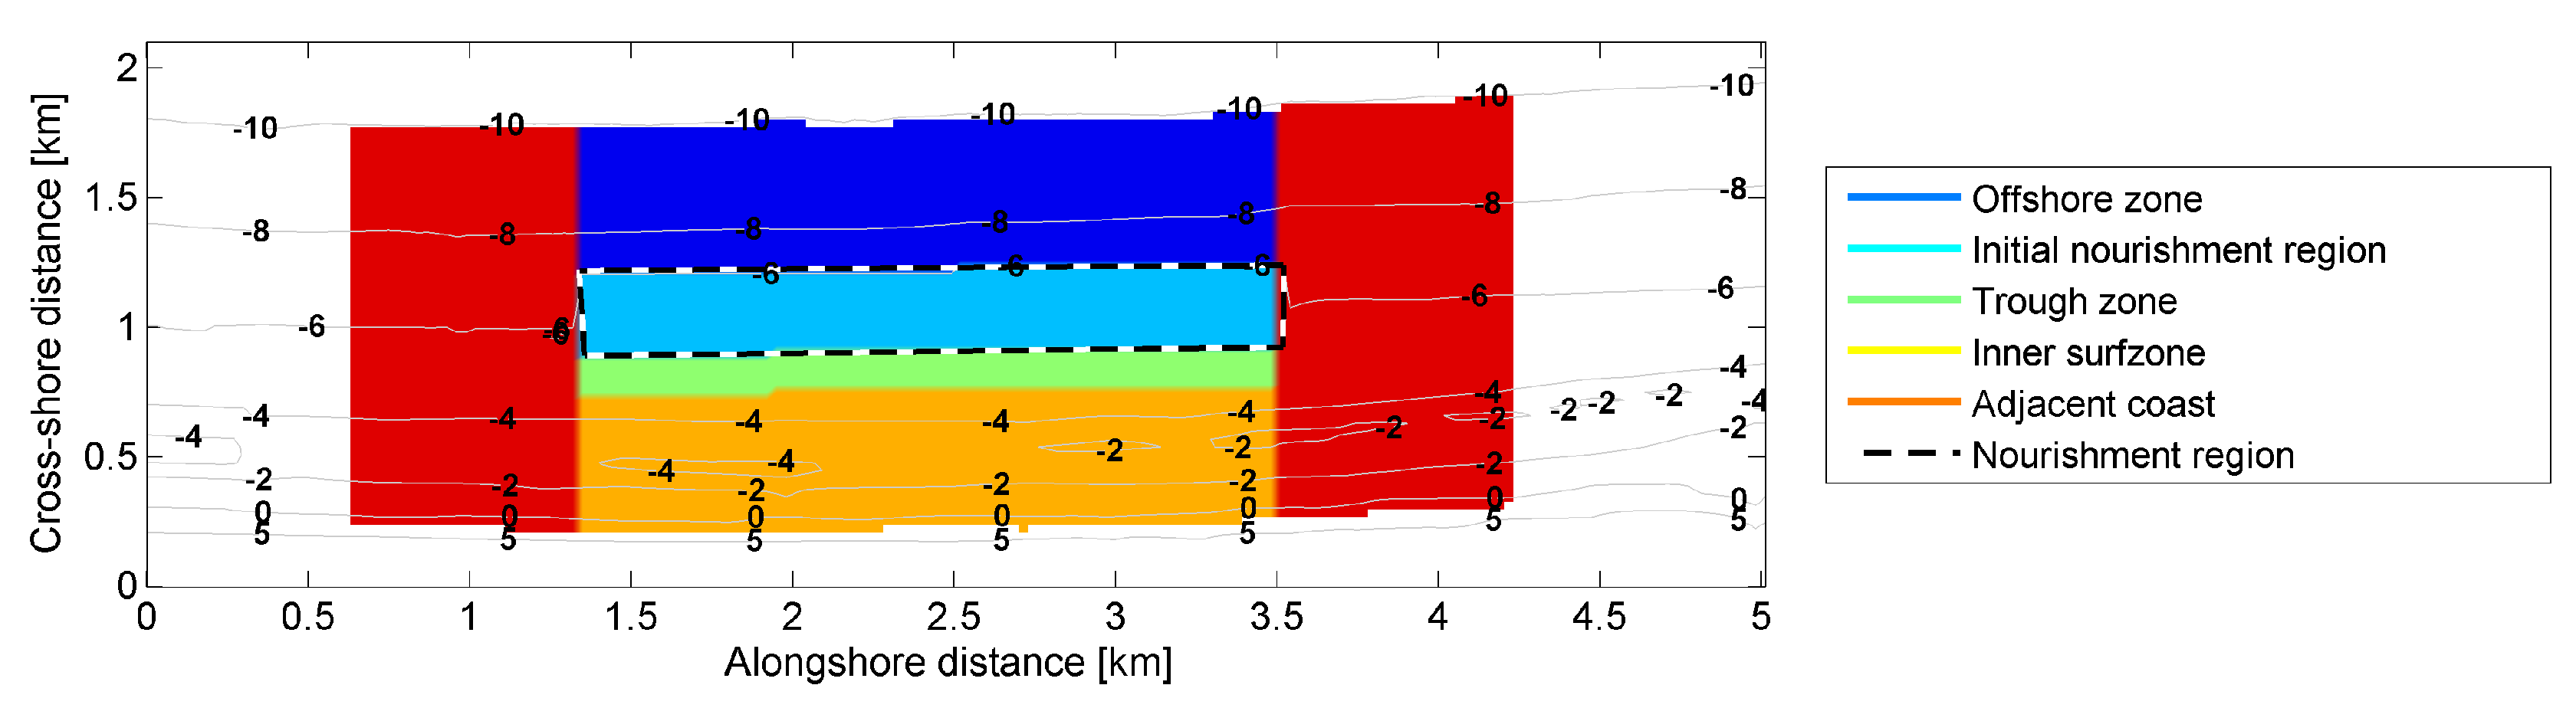
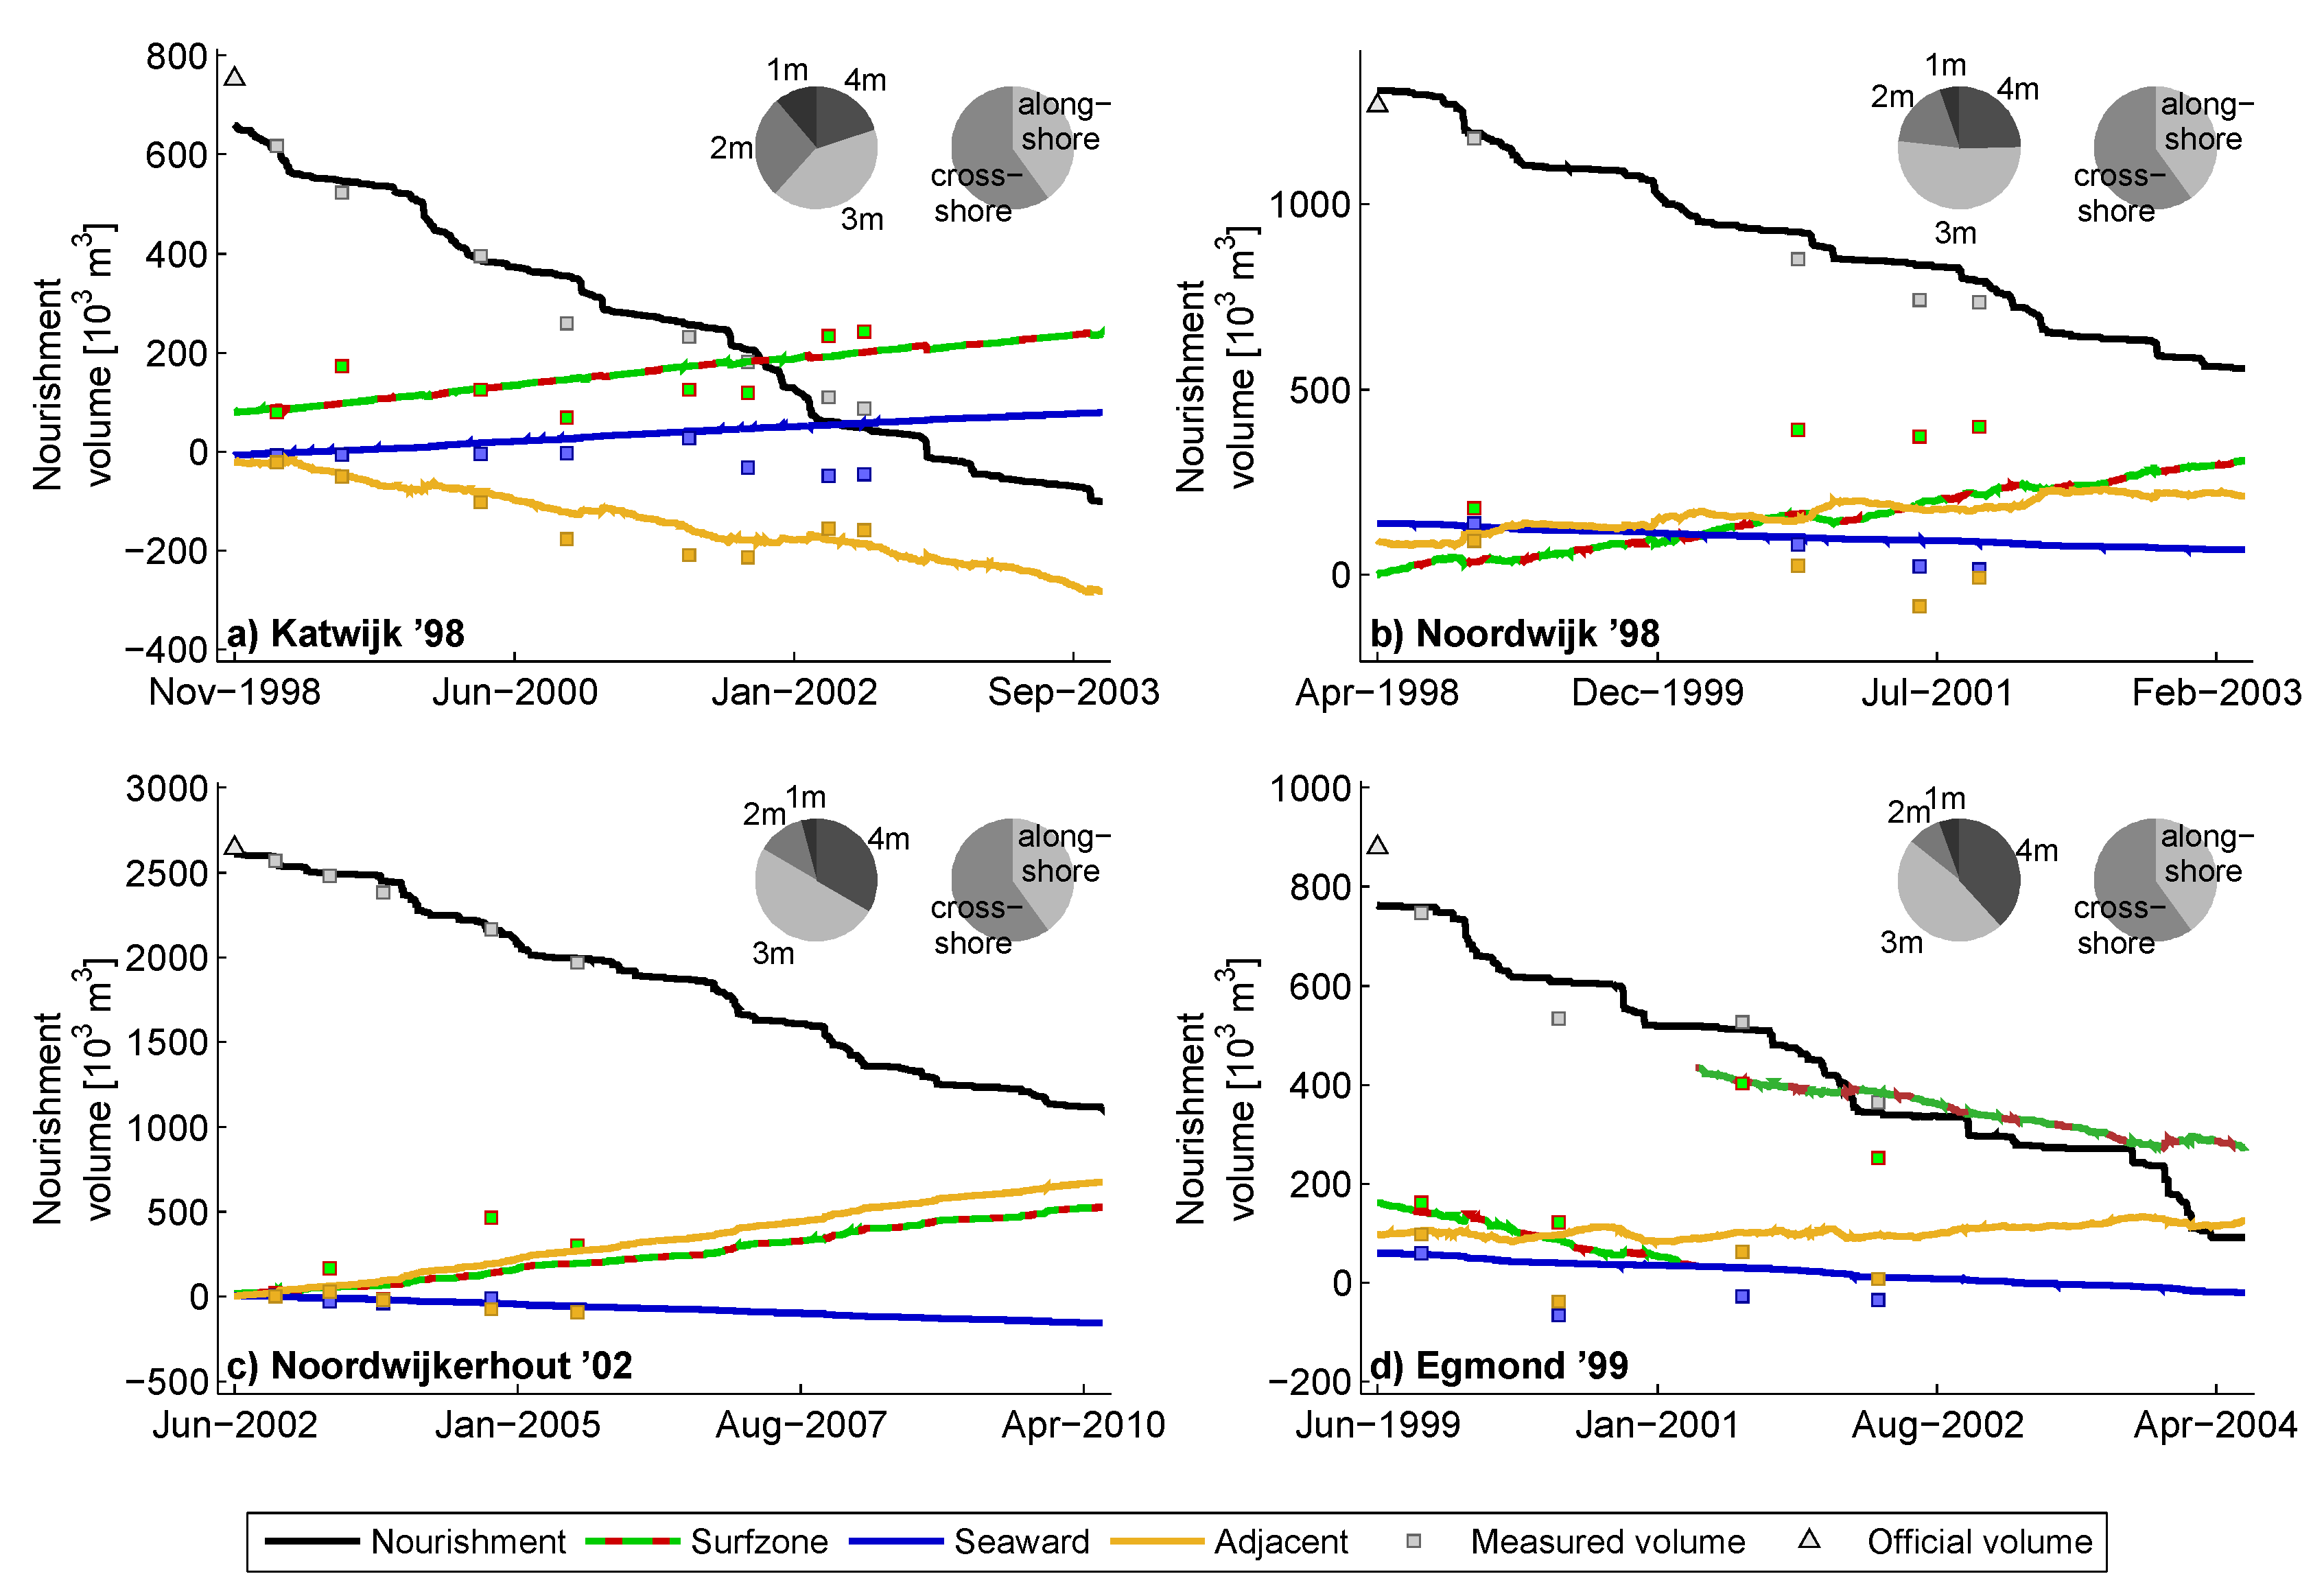
A quantitative analysis of the volume change in the predefined cross-shore regions (see
Figure 2) shows a decrease of the nourishment volume
(dark gray markers in
Figure 8) and volumetric changes in the seaward, trough and nearshore regions (
,
and
)). The measured change in
can be represented reasonably well with a linear trend for most nourishments (i.e., dashed gray line in
Figure 8). For some nourishments, a discrepancy is present between the initial nourishment volume that is computed from the bathymetric measurements and the official nourishment volume. For example, a much larger volume was nourished at Bergen & Egmond’05 than could be shown in the measurements.
The multi-year average rate of erosion ( using the linear trend in the measurements) varied from 37,000 to 247,000 m/yr. The erosion rate per alongshore length unit () was on average 34 m/m/yr with a of 17 m/m/yr. The least erosion took place at Terschelling (about 8 m/m/yr). The largest erosion was observed at Katwijk’98 (about 70 m/m/yr).
The considered shoreface nourishments have an estimated halftime of the nourishment volume varying from three years for Katwijk’98 to a theoretical halftime of ∼30 years for the Terschelling’93 nourishment (based on a linear extrapolation of the computed erosion rate; see
Figure 8). The volume of sediment remaining in the initial nourishment region after three years ranged from 26% (at Katwijk’98) to ∼90% (at Scheveningen’99, Ter Heijde’01, Camperduin’02 and Terschelling’93) with an average of 68% for all considered nourishments with a
of 17%. It should, however, be noted that some of the more persistent shoreface nourishments in this study were preceded by earlier nourishments (e.g., Ter Heijde’01), which may have lengthened the lifetime of the nourishment.
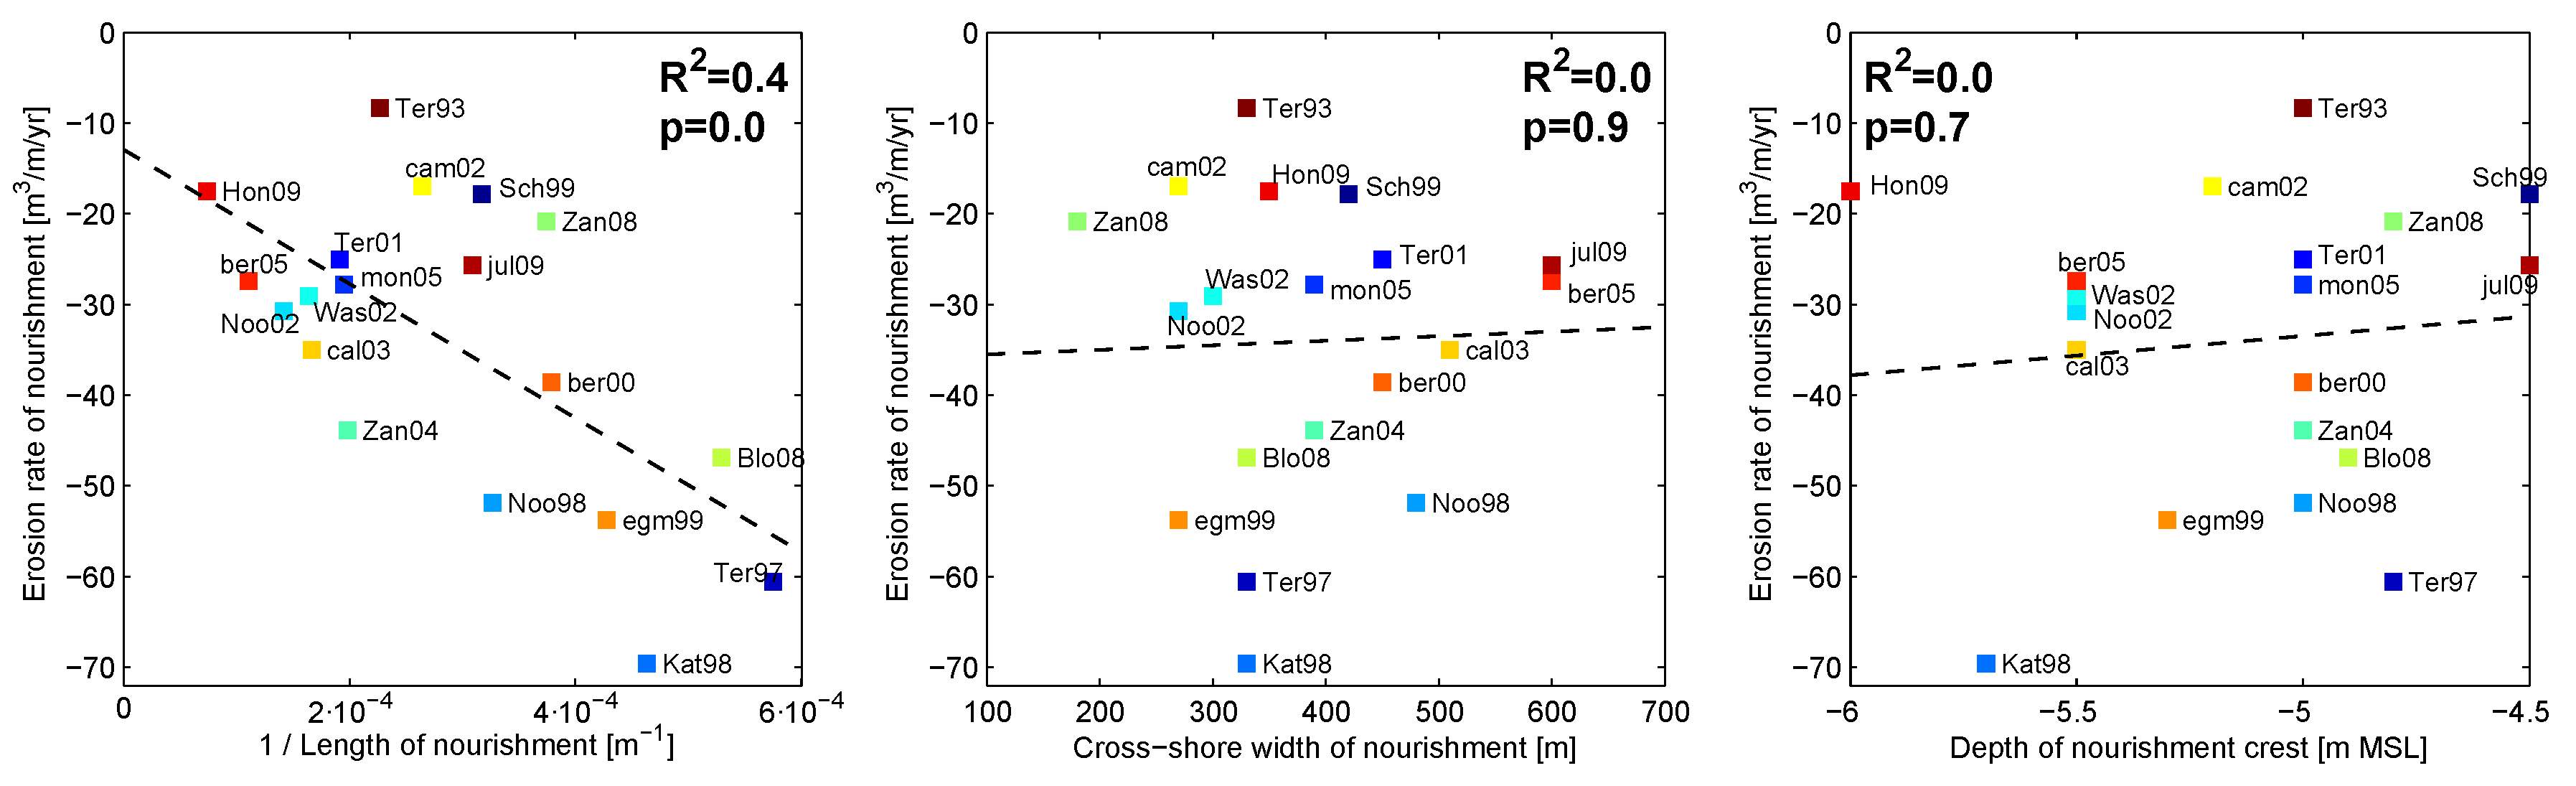
Geometrical properties have an influence on the erosion rates, as the inverse alongshore length of the nourishment correlates significantly with the erosion rate per meter length of the nourishment (with
of 0.4; see
Figure 9). Apparently, the shorter nourishments experience a relatively larger loss (per alongshore length unit) than longer nourishments. The cross-shore width and depth of the nourishment crest are, however, not significantly correlated to the erosion rate (
Figure 9).
The volumetric changes in the nearshore region landward of the shoreface nourishments (i.e.,
and
) are also influenced by the construction of the nourishment (
Figure 8), while sediment volume in the seaward region (
) is hardly affected by the nourishment, which is not unexpected given that the depth of closure is approximately at the toe of the nourishment at 9 m water depth [
52,
53]. A linear trend of accretion is generally observed in the inner surfzone (
) in the first three years after construction of the nourishment, while an erosive trend is observed in the region directly landward of the nourishment (
). The accretion in the nearshore (
) was on average 46 m
/m/yr with a
of 19 m
/m/yr over the first three years after construction, while the erosion of the trough (
) was about 32 m
/m/yr with a
of 26 m
/m/yr, meaning that the volume changes in the trough and nearshore regions are of similar magnitude as the changes in the initial nourishment region. Typically, the volumetric changes in the trough and inner surfzone become smaller after three to four years with a small tendency to return to the original situation (see Camperduin’02 in
Figure 8). It is noted that the Zandvoort–Zuid’08 nourishment behaved somewhat different as considerable accretion was observed in the trough zone. The accretion in the nearshore region at Terschelling’93 is considerably larger than the erosion from the nourishment.
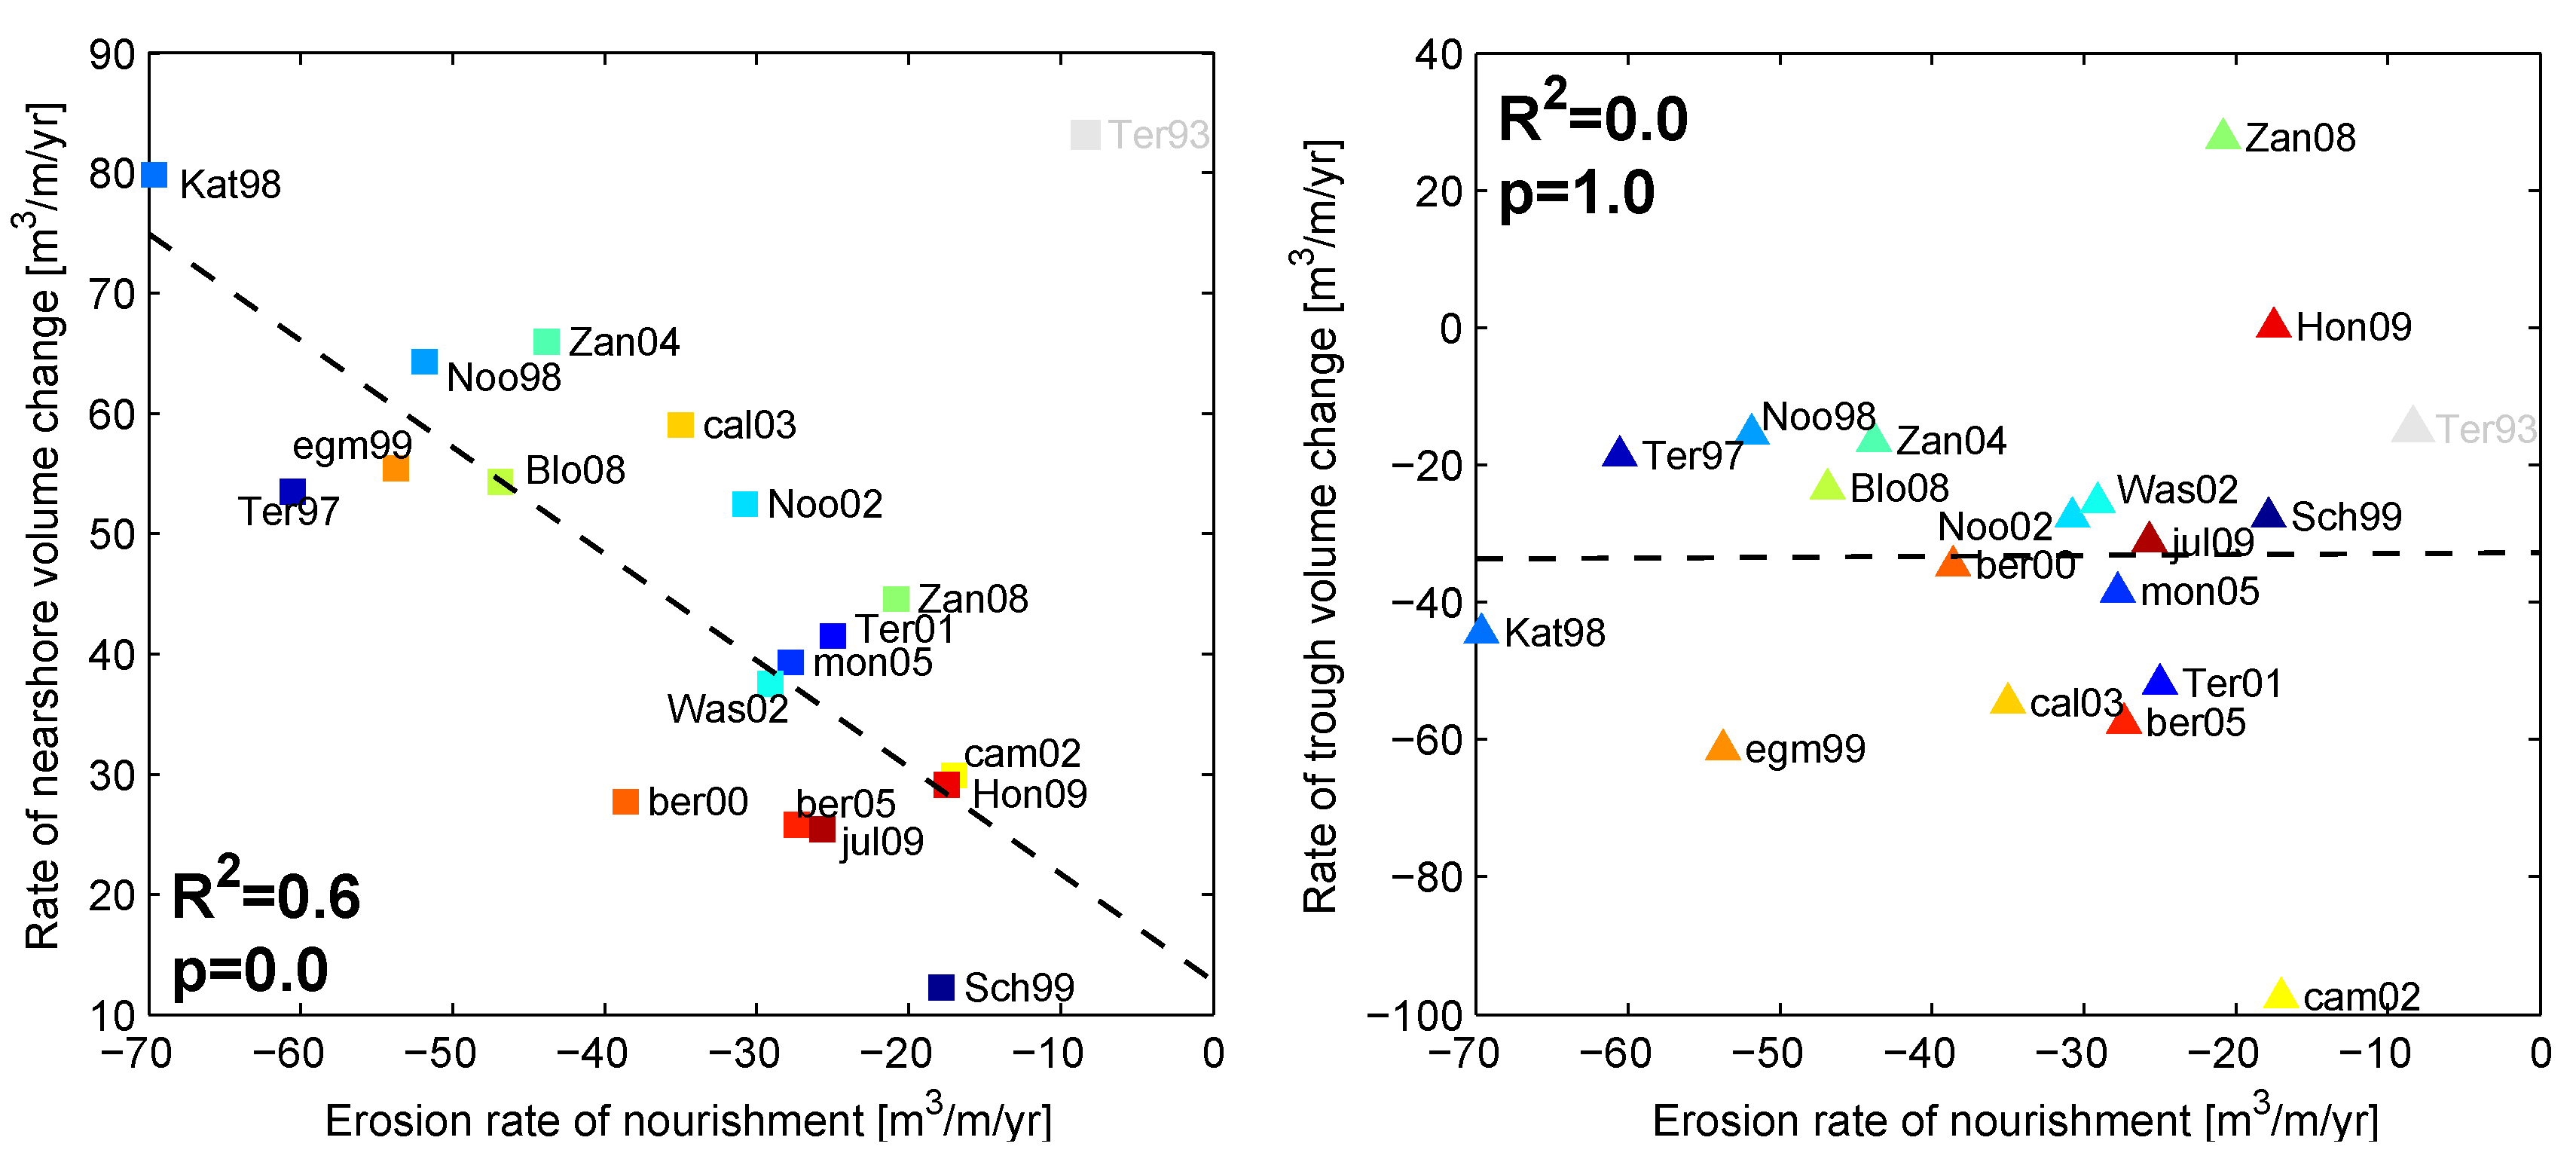
A relation between the rate of volumetric change in the nearshore region (in the first three years after construction) and the erosion rate of the nourishment region (
Figure 10;
) suggests that the shoreface nourishments have a considerable positive impact on the nearshore sediment budgets. Nearshore accretion may even exceed the erosion in the initial nourishment region, which shows that a supply from the trough region or adjacent coast is present. The rate of erosion in the trough region is, however, not correlated to the erosion of the nourishment (see right panel in
Figure 10), but does show that an erosion of 20 to 60 m
/m/yr is typically present in the trough in the first three years after construction of the nourishment.
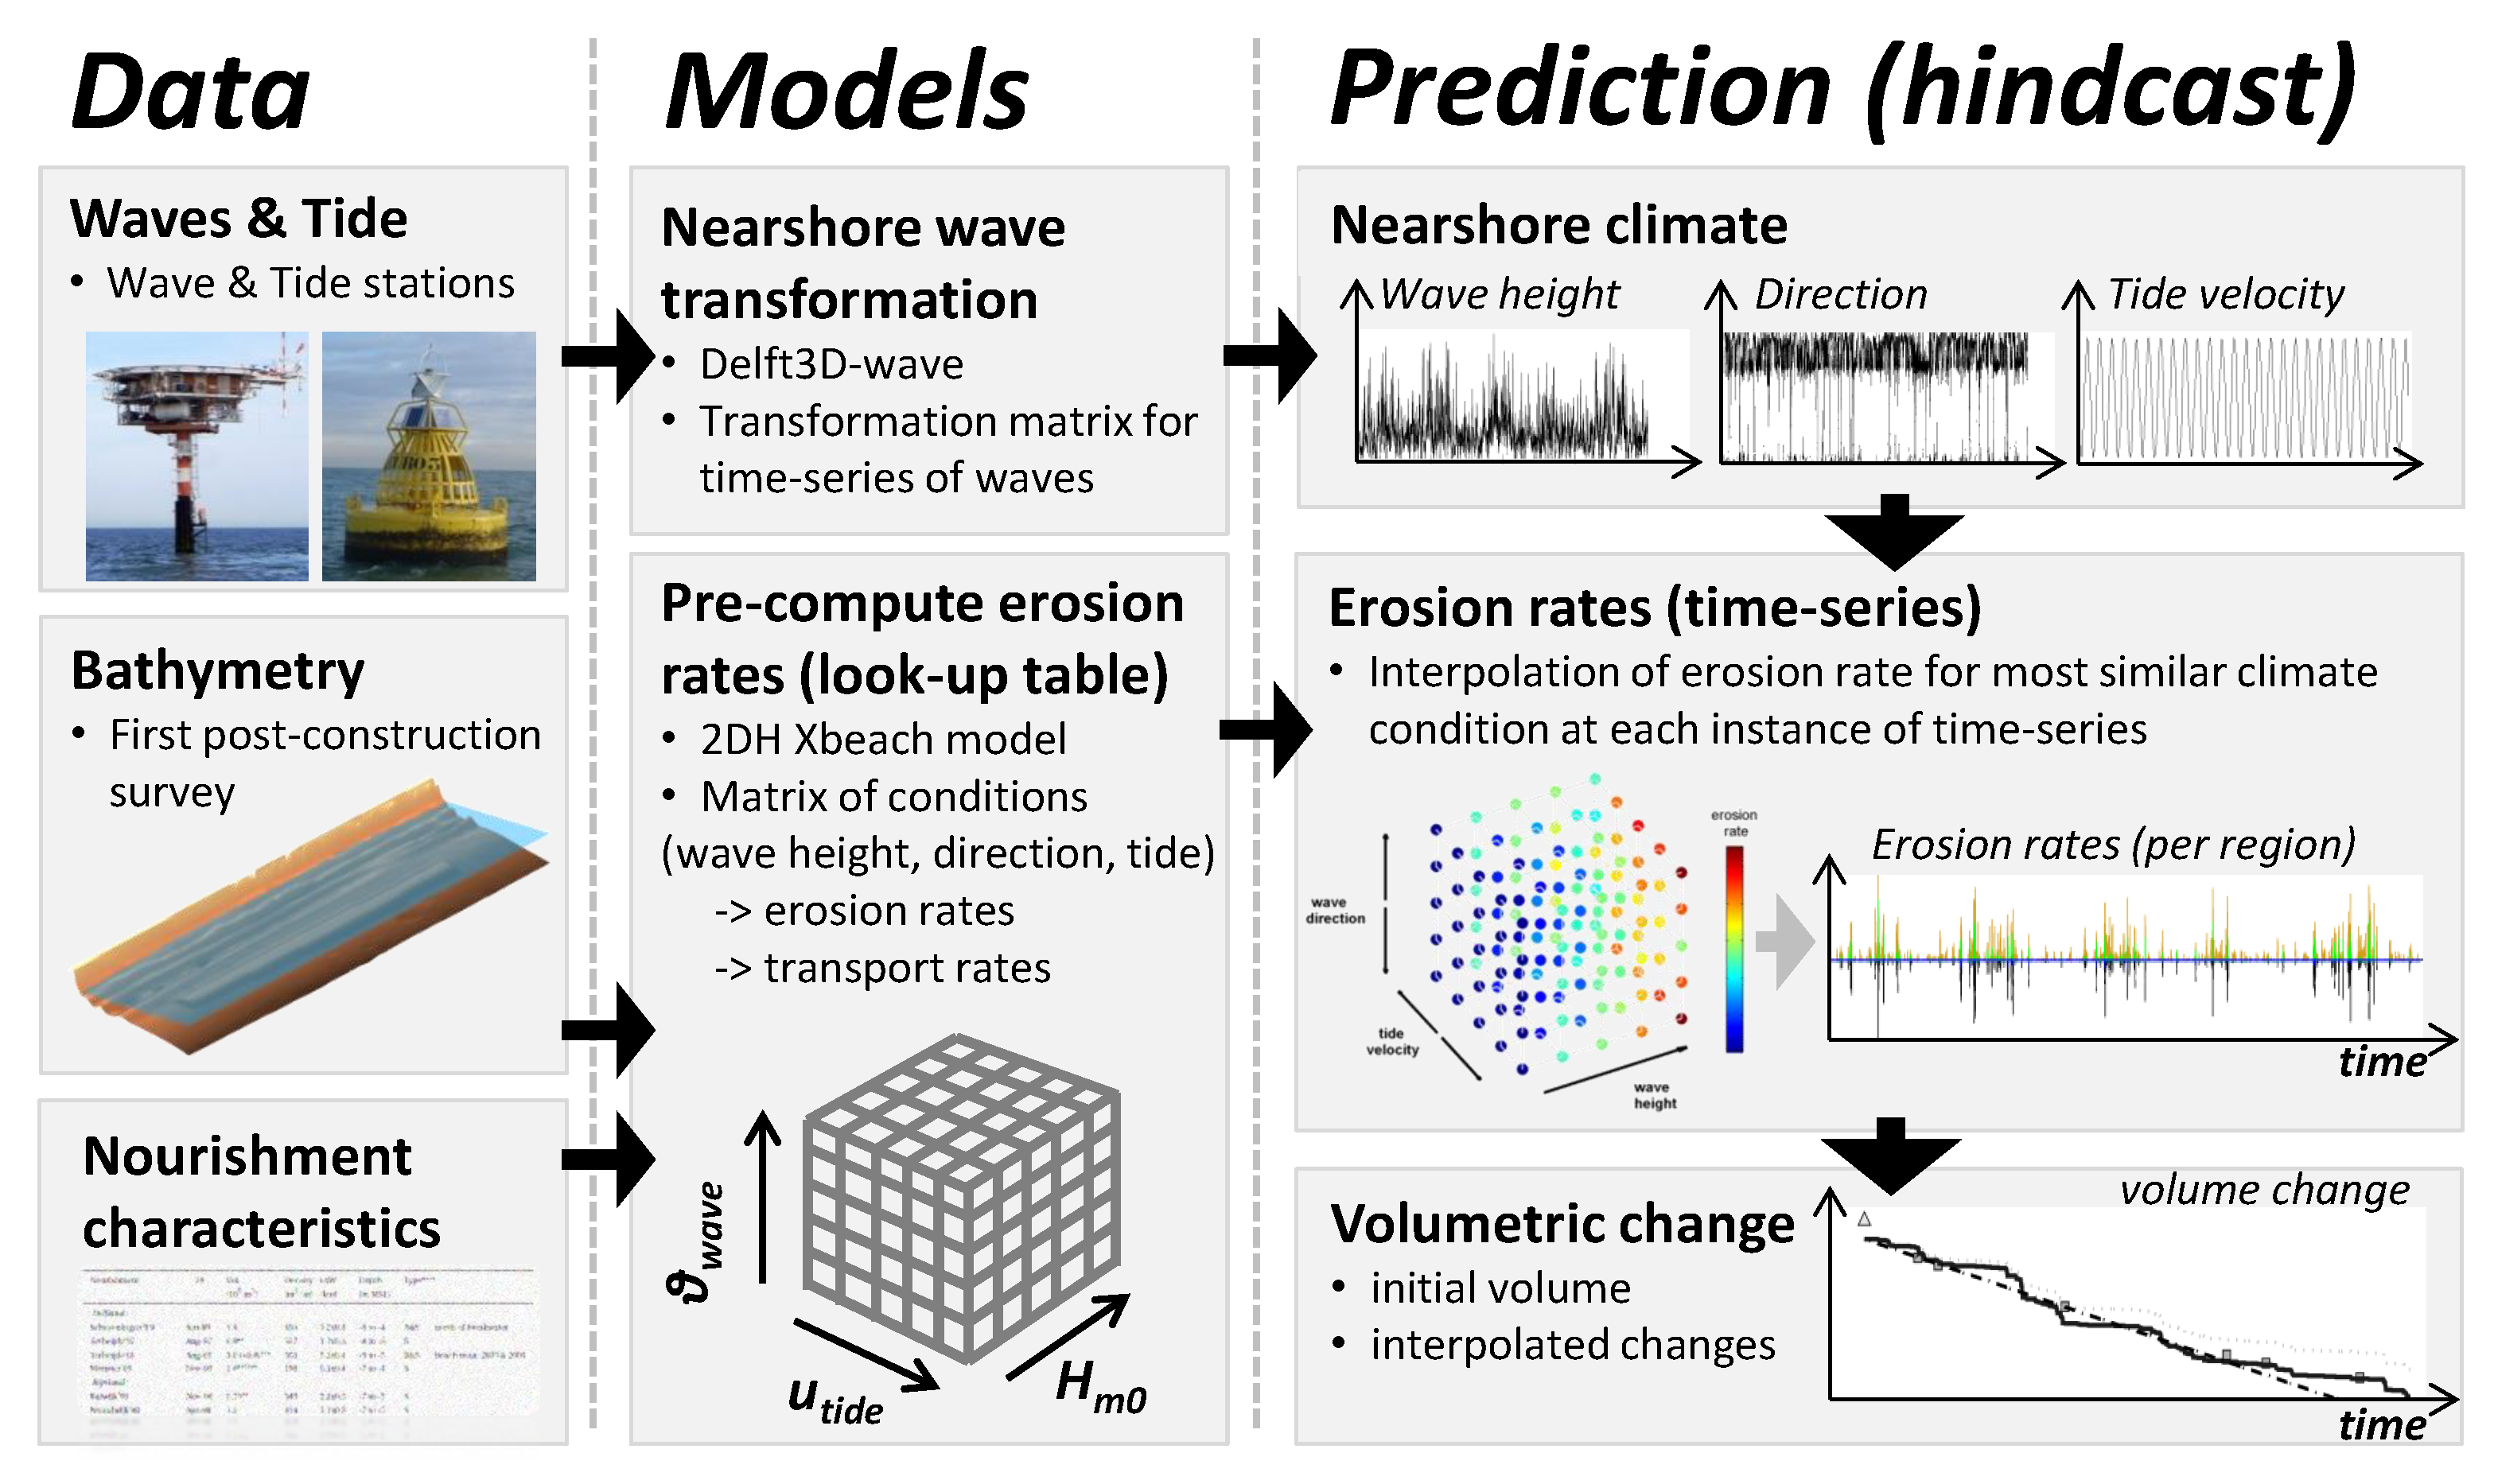
5. Efficient Modelling of Shoreface Nourishments
The XBeach numerical model is used to assess the impact of hydrodynamic processes acting at the shoreface nourishment and for pre-computing the erosion rates for a matrix of wave heights (
ranging of 1, 2, 3 and 4 m), directions (−30
, −15
, 0
, 15
, 30
,) and tide conditions (−1, −0.5, 0, 0.5 and 1 m/s; see
Section 3). The erosion rates of five shoreface nourishments over ∼ the first 2.5 years were then reconstructed at each time-instance of a (measured) hindcast time-series of wave conditions using an interpolation of the pre-computed erosion rates. The Ter Heijde’97 nourishment is used as an illustration case, since measurements show a clear morphological development over time. In addition also four other nourishments (Katwijk’98, Noordwijk’98, Egmond’99 and Noordwijkerhout’02) were modelled to provide information on the consistency of the results for nourishments with a different size or location along the coast.
Results of the illustration case (Ter Heijde’97) show that the smaller waves are propagated without breaking over the shoreface nourishment
Figure 11, while larger waves (partially) break at the shoreface nourishment. A substantial part of the wave energy is therefore transmitted to the landward side during mild conditions (e.g., significant wave height <1 m, occurring 64% of the time). Obliquely incident waves induce similar wave patterns, but with the shadow area shifted somewhat downdrift of the nourishment. Onshore currents are present at the crest of the nourishment, while a strong offshore directed current is present at both lateral sides of the nourishment during shore-normal incident waves with
m (see left panels in
Figure 12). This rip current is only present at the updrift side for moderately oblique incident waves (from 15
) while the rip currents are absent during very oblique wave incidence. In that situation, the lateral sides are influenced by the alongshore current. The alongshore current velocities landward of the nourishment during obliquely incident wave conditions (from 15
) are hardly reduced for mild to moderate wave conditions (
2 m), while a considerable reduction of longshore current velocities is found landward of the nourishment for energetic conditions (
3 m from 15
).
The initial transport rates for each individual condition of the 2.5 year hindcast time-series were derived from the computed matrix of XBeach computations (for a range of environmental conditions) using an interpolation of the most similar conditions (see
Figure 3). The resulting transport rates for the Ter Heijde’97 nourishment
Figure 13, as shown relative to the pre-nourishment situation) show a transport away from the initial nourishment region in both the alongshore and cross-shore direction. In addition, a reduction of the alongshore transport rates is present in the shadowed zone nearshore of the shoreface nourishment, which results in a convergence of the transport at the coast. This shielding of the waves by the nourishment takes place especially during the more energetic wave conditions.
In addition, the volume change of the Ter Heijde’97 nourishment
Figure 14 was reconstructed using (at each moment of the actual hindcast time-series) an interpolation of the computed initial erosion rates in the matrix of XBeach computations for the predefined environmental conditions. The trend in the computed volumetric change of the nourishment and inner surfzone (i.e., trough and nearshore zone combined) was similar to the observations, while the model was using just the initial transport computations for a single post-construction bathymetry. This is surprising knowing that various properties of the bathymetry change over time. Apparently, the most important parameters for the erosion of the nourishment do not change substantially in consecutive measured bathymetries. It is envisioned that the use of more measured bathymetries may be even more accurate, but these are in practice often not available when a prediction is made of the performance of shoreface nourishments (i.e., prior to the construction). Relevant for practical applications is also that the longer-term trend in the nourishment volume can be represented with an average climate (see dash-dot line). The volume changes of the region seaward of the nourishment and at the adjacent coast show a larger deviation from the measurements, which vary considerably over time, but do still represent the trend reasonably well.
Similarly, a prediction was made of the volumetric changes at the Katwijk’98, Noordwijk’98, Noordwijkerhout’02 and Egmond’99 shoreface nourishments (
Figure 15), which showed the same trend in the erosion volume of the initial nourishment area as the measurement data. In particular, the initial nourishment region, seaward region and inner surfzone were predicted well. Less agreement with measurements was present for the adjacent coast, although Katwijk’98 was still well represented. In addition, the more energetic wave conditions (
= 3 m) contribute to the erosion of the nourishment, as can be seen from the left pie-chart in
Figure 14, which is in line with the expected transmission of wave energy over the nourishment during mild conditions. This erosion of the nourishment takes place for about 60% to 85% due to cross-shore transport.
A quantification of the capability of the model to compute the initial volumetric changes (in the first three years) at the shoreface nourishments is provided in
Figure 16, which shows a similar trend of the volume in the initial nourishment region (
0.9) and inner surfzone (
0.8) as the measurements. The seaward region is reasonably well resolved (
0.6 with
0.11), while impacts on the adjacent coast are more difficult to predict (
0.3 with
0.33). The number of cases is, however, still small.
6. Discussion
Bathymetric surveys at 19 shoreface nourishments show that shoreface nourishments (with a lifetime of 4 to 20 years) are quite persistent compared to beach nourishments. The larger shoreface nourishments were only partly eroded after three years with 40% to 80% of volume still in the initial nourishment region. This is in line with the findings of Van Duin et al. [
12] who showed that about 45% of the sediment remained after three years in the initial nourishment region at the Egmond’99 nourishment. Measurements show that a rather linear decrease of the volume in the initial nourishment region takes place for the considered shoreface nourishments. The observed behaviour is clearly different from beach or mega nourishments (e.g., Sand Motor, [
54]), which act as coastline perturbations that gradually spread along the coast over time as a result of gradients in the wave-driven alongshore transport. The beach and mega nourishments are, however, almost exclusively influenced by the alongshore wave driven current which induces transport gradients depending on the local coastline orientation [
5,
55,
56,
57], while a much smaller influence of the wave-driven alongshore transport is observed at the shoreface nourishments.
Alongshore transport takes place at the seaward side of the shoreface nourishment during (obliquely incident) stormy conditions (
3 m;
Figure 11), but causes only 15 to 40% of the erosion of the shoreface nourishment as smaller waves are propagated without breaking over the shoreface nourishment. Instead the erosion of a shoreface nourishment is controlled by onshore transport of sediment contributing 60 to 85% for the five modelled nourishments in this study (
Figure 14 and
Figure 15). However, relatively speaking, the shorter nourishments do experience a larger impact of the longshore transport, which acts at the lateral ends (as shown from the relation between length and erosion per alongshore length unit in
Figure 9). Onshore currents are present at the middle section of the nourishment as a result of mass transport by the waves, wave skewness induced velocity asymmetry and residual circulations (
Figure 12 and
Figure 17), which also feed the strong seaward directed currents at the lateral sides of the nourishment.
Computations of the impact of the Ter Heijde’97 nourishment on the wave asymmetry and skewness (i.e., the difference between the post-construction and T0 situation;
and
) suggest that the geometrical change of the profile affects the velocity asymmetry of the wave orbital motion (see
Figure 18), thus providing at least a partial contribution to the cross-shore transport in shoreward direction (analogous to [
11]). The contribution of wave skewness and asymmetry was also confirmed by a simulation with disabled wave skewness and asymmetry, which showed only half of the erosion at the shoreface nourishment and an absence of accretion in the nearshore. From
Figure 18, it is also shown that the T2 survey (in August 1998), which has a more pronounced trough and bar crest, has a larger impact on the wave skewness and asymmetry in the trough area than the T1 survey while the influence on the skewness and asymmetry at the nourishment crest is similar. This suggests that an internal feedback mechanism may take place during the development of the trough.
In practice, this means that the actual magnitude of the cross-shore transport in the applied method depends (to some extent) on settings for wave skewness and asymmetry (
and
) in the XBeach model, which requires a calibration for the pre-nourishment situation. The current study used the default calibration settings for safety assessments of the Holland coast [
44] for all considered cases. Findings in this study are in line with Grunnet and Ruessink [
11] who computed a considerable enhancement of onshore transport for the Terschelling’93 nourishment. Onshore transport of sediment is expected to take place at the seaward side of any shoreface nourishment moving sediment to the ‘nourishment crest’. Most nourishments therefore develop a ‘triangular’ landward skewed shape in the first year(s) after construction, which can be perceived as a migration of the nourishment in landward direction. This process is expected to continue until the moment that the sediment source at the seaward toe of the nourishment depletes (i.e., when the seaward slope gets milder), which happens typically after two to four years. The crest of the shoreface nourishment will then become less pronounced (i.e., lower and more rounded) and the natural offshore bar cycle resumes.
A short steep back slope is present on the landward side of the shoreface nourishment, where a trough develops over time with a depth of 0.5 to 4 m with respect to the pre-nourishment situation. Sediment from the nourishment which reaches the trough (i.e., the loss from the initial nourishment region) moves either (1) to the sides of the nourishment by water-level gradient driven currents which expel sediment with rip currents at the lateral sides during shore-normal to mildly oblique wave conditions (see
Figure 12 and
Figure 17) or (2) towards the shallow nearshore zone as a result of enhanced onshore transport
Figure 18. The correlation of the erosion in the area directly landward of the nourishment and accretion in the shallow nearshore zone (
= 0.6;
Figure 10) suggests that most of the sediment that initially accretes in the shallow nearshore zone originates from the erosion in the ‘area directly landward of the nourishment’ rather than the supply from the shoreface nourishment itself. The erosion in the region landward of the nourishment (at about MSL −4 m) is therefore considered beneficial for the accretion near to the waterline in shallow water. After about three years, the area landward of the nourishment fills up and nearshore accretion decreases again when onshore sediment supply diminishes, which is the case for Camperduin’02 and Egmond’99
Figure 7. In addition, wave shielding by the nourishment may also contribute to accretion in the shallow nearshore zone, although an effect is only expected during the energetic wave conditions (
3 m;
Figure 11), while the wave-driven current is likely to spread sediment alongshore during mild to moderate conditions. This aligns with Van Duin et al. [
12] who recognizes the difference in impact of the wave shielding by the nourishment for mild and energetic conditions. The part of the sediment from the shoreface nourishment that is not transported to the shallow nearshore is spread over a large area by the rip currents at the lateral ends of the nourishment, which explains the lack of visible accretion at the coast directly adjacent to the shoreface nourishment. However, this offshore transported sand will eventually end up in the surfzone as a result of onshore transport.
The applied simplified XBeach modelling method provides a good representation of the trend of the erosion of the shoreface nourishment (with
0.9) and subsequent nearshore accretion rates (with
0.8) using just the initial erosion rates for a single post-construction bathymetry. It is envisioned that the use of more measured bathymetries may be even more accurate, but these are in practice often not available when a prediction is made of the performance of shoreface nourishments. This is considerably more efficient than a modelling approach using a brute-force morphological hindcast (e.g., [
57]) or reduced wave climate (e.g., [
12] or [
58]). Some uncertainty will always remain as the precise occurrence of conditions will not be available for future forecasts (e.g., yearly variation in storminess), but still the method proved to be rather robust even when a measured bathymetry of one year later is applied or when an average wave climate is used. The method is therefore of practical use for future morphological forecasts of shoreface nourishments. In fact, the applied measured bathymetries are considered more realistic than the model-generated bathymetries of morphodynamic model studies, which show a considerable flattening of the bar features (e.g., [
12,
14]) and suggests that a realistic crest height is essential for an accurate reproduction of the onshore sediment transport. The current model also has a good representation of the accretion in the inner surfzone, while volumetric changes seaward of the nourishment and at the adjacent coast are more difficult to predict. This is expected to relate to the chosen approach using only the initial morphological changes, which disregards the feedback from accretion at the adjacent coast on the local accretion. As a result, the computed changes at the adjacent coast are expected to be larger than the actual accretion because sediment will in practice be spread over a larger area. The model for Ter Heijde’97 even predicts a local reduction of the skewness and asymmetry at the location of the trough, which can promote the growth of the trough depth (
Figure 18). The applied approach (using hydrostatic assumptions and 2DH processes) still cannot fully capture the processes at the interface of the bar and trough area, where complex 3D currents, turbulence (from breaking waves penetrating to the bed) and phase lags between wave stirring and advection play a role (e.g., [
59,
60,
61,
62]). This may be resolved using detailed Navier Stokes models (including these processes) which generate more realistic sub-tidal bars and troughs (e.g., [
63]), but these models cannot easily be applied at the scale of a shoreface nourishment. In fact, a parameterization of the complex processes at the bar will be needed to improve the performance of morphological models in predicting bar-trough features. In addition, the models using Boussinesq type wave parameterization may need to be explored (e.g., [
64]). It is noteworthy that qualitatively realistic behaviour is obtained with the UNIBEST-TC model for cross-shore profiles that uses a parameterization of the transport processes [
15,
19]. The development of sub-tidal bars is, however, still a field of research that is heavily debated on and not a principal aim of this research. In practice, this means that the current modelling approach is less suitable for evaluating the precise erosion depth of a trough (e.g., for landfalls of power and communication cables). The applied modelling approach can, however, be used to predict the lifetime of shoreface nourishments and redistribution of the sediment, which is essential for efficient placement of future coastal maintenance measures.
This research also sheds light on the applicability of shoreface nourishments, as the functioning of this measure and lifetime is better understood. The shoreface nourishment is a very cost-effective solution to replenish a large volume of sand at the coast (about two to five times cheaper per than beach nourishments), of which almost all sand contributes to the sediment balance of the coastal cell in which it is placed (i.e., hardly any offshore transport). The shoreface nourishment feeds the coast especially during storms, thus, effectively, providing a sub-tidal buffer volume to mitigate storm erosion. It should, however, be kept in mind that the shoreface nourishment does not provide a quick solution to restore a too narrow beach, as it will take time before the inner surfzone benefits from the sand. In addition, the low visibility of the measure can be an issue for (local) governments who would like to see their coastal investment from land. The possible presence of large-scale rip-currents, on the other hand, is in practice not really a drawback for swimmer safety as these rip currents occur especially for wave heights of over three meters when hardly any swimmers will be in the water.
7. Conclusions
The objective of this research was to examine (1) the behaviour of shoreface nourishments, (2) the contribution of processes driving the morphological changes and (3) an efficient method to predict the evolution of shoreface nourishments. Morphological data of 19 sub-tidal sand nourishments at the Dutch coast and numerical modelling with XBeach were used for this purpose.
Field measurements show that considerable cross-shore profile change takes place at shoreface nourishments, while alongshore redistribution is hard to distinguish. In this respect, the shoreface nourishment behaviour is very different from a beach or mega nourishment, which is moved predominantly by the alongshore wave-driven current. The shoreface nourishments are more persistent compared to beach nourishments with on average ∼65% of volume still in the initial nourishment region after three years, but considerable variation is present in the halftime of the considered shoreface nourishments (ranging from 3 to 30 years). The cross-shore shape of the shoreface nourishment skews in a landward direction over time as a result of transport from the (eroding) seaward side of the nourishment (between MSL −8 m and MSL −4 m) to the landward side of the nourishment crest (at about MSL −4 m). This onshore transport is due to water-level setup driven residual circulations as well as a local increase of the skewness and asymmetry of the wave orbital motion due to the geometrical change of the cross-shore profile by the nourishment. The dominance of the onshore directed transport is expected to last until the seaward slope of the nourishment becomes milder (i.e., more similar to the natural coast, as observed in measurements in the first years after construction). For most of the nourishments, a trough developed landward of the shoreface nourishment (i.e., where the pre-existing natural sand bar was located) with a cross-shore width of 100 to 150 m resulting in 0.5 to 4 m erosion. The eroded sediment from the trough region is transported to the shallow nearshore region between MSL −3 m and MSL resulting in local accretion.
A validation of the erosion and accretion rates for five shoreface nourishments showed that a good hindcast of volume change of the nourishment area and inner surfzone can be achieved with the XBeach model using a lookup table with a matrix of initial sedimentation–erosion rates for a range of potential environmental conditions. The method uses a single post-construction bathymetry for all simulations, which is considerably more efficient than a brute-force morphological hindcast. This is remarkable in view of the considerable morphological changes that take place at a shoreface nourishment. It is envisioned that the use of more measured bathymetries may be even more accurate, but these are, in practice, often not available when a prediction is made of the performance of shoreface nourishments. Using the model, it is shown that cross-shore transport (for shore-normal waves) is governing the first year erosion rates of the nourishment (contributing about 60 to 85% to the erosion), while alongshore transport contributes about 15 to 40% to the erosion. Most erosion of the nourishment takes place during energetic wave conditions (about 60% to 80% for waves 3 m) as the mild to moderate wave conditions are propagated without breaking over the nourishment. Tidal currents and the oblique incidence of the waves hardly affect the erosion rates, but may contribute to some extent for a nourishment that is placed in deeper water. In addition, the numerical model shows that strong rip currents can be present at both lateral sides of the shoreface nourishment for relatively shore-normal waves (<15). These rip currents spread the sediment from the nourishment over a large area (i.e., at some distance from the sides of the nourishments and partially in offshore direction) during moderate and energetic wave conditions, which explains the absence of a clear accretion directly adjacent to the nourishment.

 ,
, 


