Potential Impacts of Anthropogenic Forcing on the Frequency of Tropical Depressions in the North Indian Ocean in 2018


IIHR-Hydroscience & Engineering, The University of Iowa, Iowa City, IA 52242, USA
*
Author to whom correspondence should be addressed.
J. Mar. Sci. Eng. 2019, 7(12), 436; https://doi.org/10.3390/jmse7120436
Submission received: 15 November 2019
/
Revised: 28 November 2019
/
Accepted: 28 November 2019
/
Published: 29 November 2019
(This article belongs to the Special Issue Extreme Weather and Climate Events: Physical Drivers, Modeling and Impact Assessment)
Abstract
:Fourteen tropical depressions formed in the North Indian Ocean during 2018—the most active season since 1986 and the second most active season since 1980. Among the 14 tropical depressions during 2018, seven developed into cyclonic storms, with five intensifying into severe cyclonic storms—three of which became very severe cyclonic storms. The sea surface temperature anomaly associated with El Niño appears to have played a minor role in shaping this extreme event (i.e., the 14 tropical depressions in the North Indian Ocean). Using large ensemble experiments performed by the Community Earth System Model developed by the National Center for Atmospheric Research, we detected an important role potentially played by anthropogenic forcing in increasing the risk of the 14 tropical depressions in the North Indian Ocean that were observed in the active 2018 season. Moreover, the projection experiments suggest a rising frequency of tropical depressions in the second half of the 21st century.
1. Introduction
Tropical depressions are responsible for torrential rainfall and flash flooding, which can be exacerbated after the depressions intensify into cyclones or severe cyclones in the North Indian Ocean [1,2]. These depressions can therefore exert strong impacts on the coastal regions adjacent to the Bay of Bengal and the Arabian Sea.
Major progress has been made towards understanding the characteristics and climate drivers of cyclones in the North Indian Ocean [3,4,5,6,7]. For example, Indian Ocean cyclones feature a unique bimodal pattern with a peak in both the pre- and post-monsoon seasons [5,8]. In addition, sea surface temperature (SST) warming in the tropical Atlantic can influence the frequency of cyclones during the pre-monsoon season in the Arabian Sea [9]; the Indian Ocean Dipole (IOD) can also influence tropical cyclones in the North Indian Ocean [10,11,12]. Moreover, the intensity of pre-monsoon and post-monsoon tropical cyclones in the Bay of Bengal has increased over the past several decades [13,14]. The SST warming anomaly in the central Pacific, known as El Niño Modoki, can also enhance Indian Ocean cyclones [15,16]. Climate model experiments have projected an increase in cyclone frequency over the Arabian Sea and a decrease in the Bay of Bengal [17]. More recently, the very severe cyclones in the Arabian Sea have been attributed to anthropogenic forcing due largely to warmer SSTs [18].
The 2018 cyclone season produced 14 tropical depressions in the North Indian Ocean, with seven developing into tropical storms or above, and was ranked the most active season since 1986 in terms of frequency [19]. Although some progress has been made in understanding the year-to-year variability of the storms in this basin, it is still challenging to make skillful forecasts and reliable projections for cyclones and tropical depressions in particular. Here we evaluated the potential role of anthropogenic forcing in the 2018 season by combining observations and large-ensemble experiments performed by the Community Earth System Model developed by the National Center for Atmospheric Research (NCAR CESM; [20]). More specifically, we assessed the extent to which the risk of tropical depressions in the North Indian Ocean (i.e., the 2018 event with 14 depressions) would change under anthropogenic forcing.
2. Methodology
We used the large-ensemble experiments performed by NCAR CESM, made available from 1920 to 2100 at 6-hour and daily temporal scales. These experiments provide 35-member outputs freely available at a spatial resolution of ~1 degree, which has a higher horizontal resolution than most of the Coupled Model Intercomparison Project Phase 5 (CMIP5, [21]) models from which previous studies have tracked tropical cyclones [22,23]. As this study targeted tropical depressions or above, the spatial resolution (~1 degree) was reasonable to resolve these low-pressure systems. Although CMIP5 models include more experiments and members than the CESM large-ensemble experiments, we did not use CMIP5 models based on three reasons. First, most models in the CMIP5 [21] have a lower resolution that limits the capability of resolving tropical depressions. Second, the internal variability in CMIP5 models is mixed with model error, because only a very limited number of realizations have been archived in CMIP5. Third, the results based on the CMIP5 may introduce large inter-model uncertainties with different dynamic cores, physics, parameterization schemes, and resolution. By contrast, the CESM large-ensemble experiments have the advantage of disentangling the internal variability and externally forced responses with a large number of realizations with small differences in initial conditions. We used daily outputs because six-hour data were only available for a limited number of ensemble members and a short period of time in the large-ensemble experiments. We focused on two types of experiments: the historical experiments where historical forcings (e.g., anthropogenic forcing, aerosol, and land-use—land-cover change) are prescribed up to 2005, while future levels are prescribed under the Representative Concentration Pathways (RCP) 8.5 scenario for the projection experiments for 2006–2100.
We identified the tropical depressions from the daily outputs of the experiments using a tracker (TempestExtremes) [24]. This tracker has been useful in tracking tropical depressions, extratropical cyclones, and tropical easterly waves with flexible criteria in terms of variables (e.g., sea level pressure and low-level winds) (a detailed description of tracking processes and criteria is included in [24]).
We employed a probabilistic approach to examine the exceedance probability of an event that quantifies the frequency of tropical depressions (FRE), similar to previous studies [25,26,27]:
where x is the selected frequency of tropical depressions in the North Indian Ocean, and P(x) is the probability with the frequency of tropical depressions larger than x. The fraction of attributable risk (FAR) [28,29] was used to assess the role of human influence or anthropogenic forcing in modulating the events larger than x. FAR is defined as 1 – (P0/P1), where P0 (P1) is the probability of exceeding the observed frequency of tropical depressions (x) in the experiments with low (high) anthropogenic forcing. Here, we computed FAR using P0 from the historical experiments (1980–2005) of the NCAR CESM and P1 from the projection experiments (2080–2100) under the RCP 8.5 scenario using the same model. To assess how the probability for the frequency of 2018 tropical depressions in the North Indian Ocean would change under anthropogenic forcing, the 2018 frequency of tropical depressions was used as the threshold (x) to calculate P0/P1.
3. Observations
Figure 1 shows the 14 tropical depressions with their tracks and intensity during 2018; among them, seven developed into cyclonic storms, with five intensifying into severe cyclonic storms—three of which became very severe cyclonic storms. These storms in 2018 were responsible for ~343 fatalities and ~4.3 billion USD economic losses. The SST anomaly in the tropical Atlantic features a spatial pattern similar to the Atlantic Niño during 2018 (Figure 2). Given the impacts of North Atlantic SST on the pre-monsoon Arabian Sea [9], the active season of tropical depressions in the North Indian Ocean may be tied with the strong Atlantic Niño. However, the correlation between the frequency of tropical depressions and the Atlantic Niño index ([30]; SST anomaly averaged over 20° W to 0° and 3° S to 3° N, detrended) is weak and negative during 1980–2018 (correlation coefficient = −0.21), indicating a minor role of the Atlantic Niño in modulating the active season of tropical depressions in the North Indian Ocean. Moreover, El Niño Modoki may exert impacts on the frequency of tropical depressions in the North Indian Ocean [15]. The El Niño Modoki index had a value of 0.24 during 2018, and this index had a correlation of 0.1 (not statistically significant) with the frequency of tropical depressions during 1980–2018. In summary, the natural climate modes seem to play minor roles in the active season of tropical depressions during 2018. Overall, the frequency of tropical depressions in the North Indian Ocean reached a peak in 1985 (15 depressions), which is the year with the highest activity during the period 1980–2018, while the 2018 season was the most active season after 1986 (Figure 3a).
4. Effect of Anthropogenic Forcing
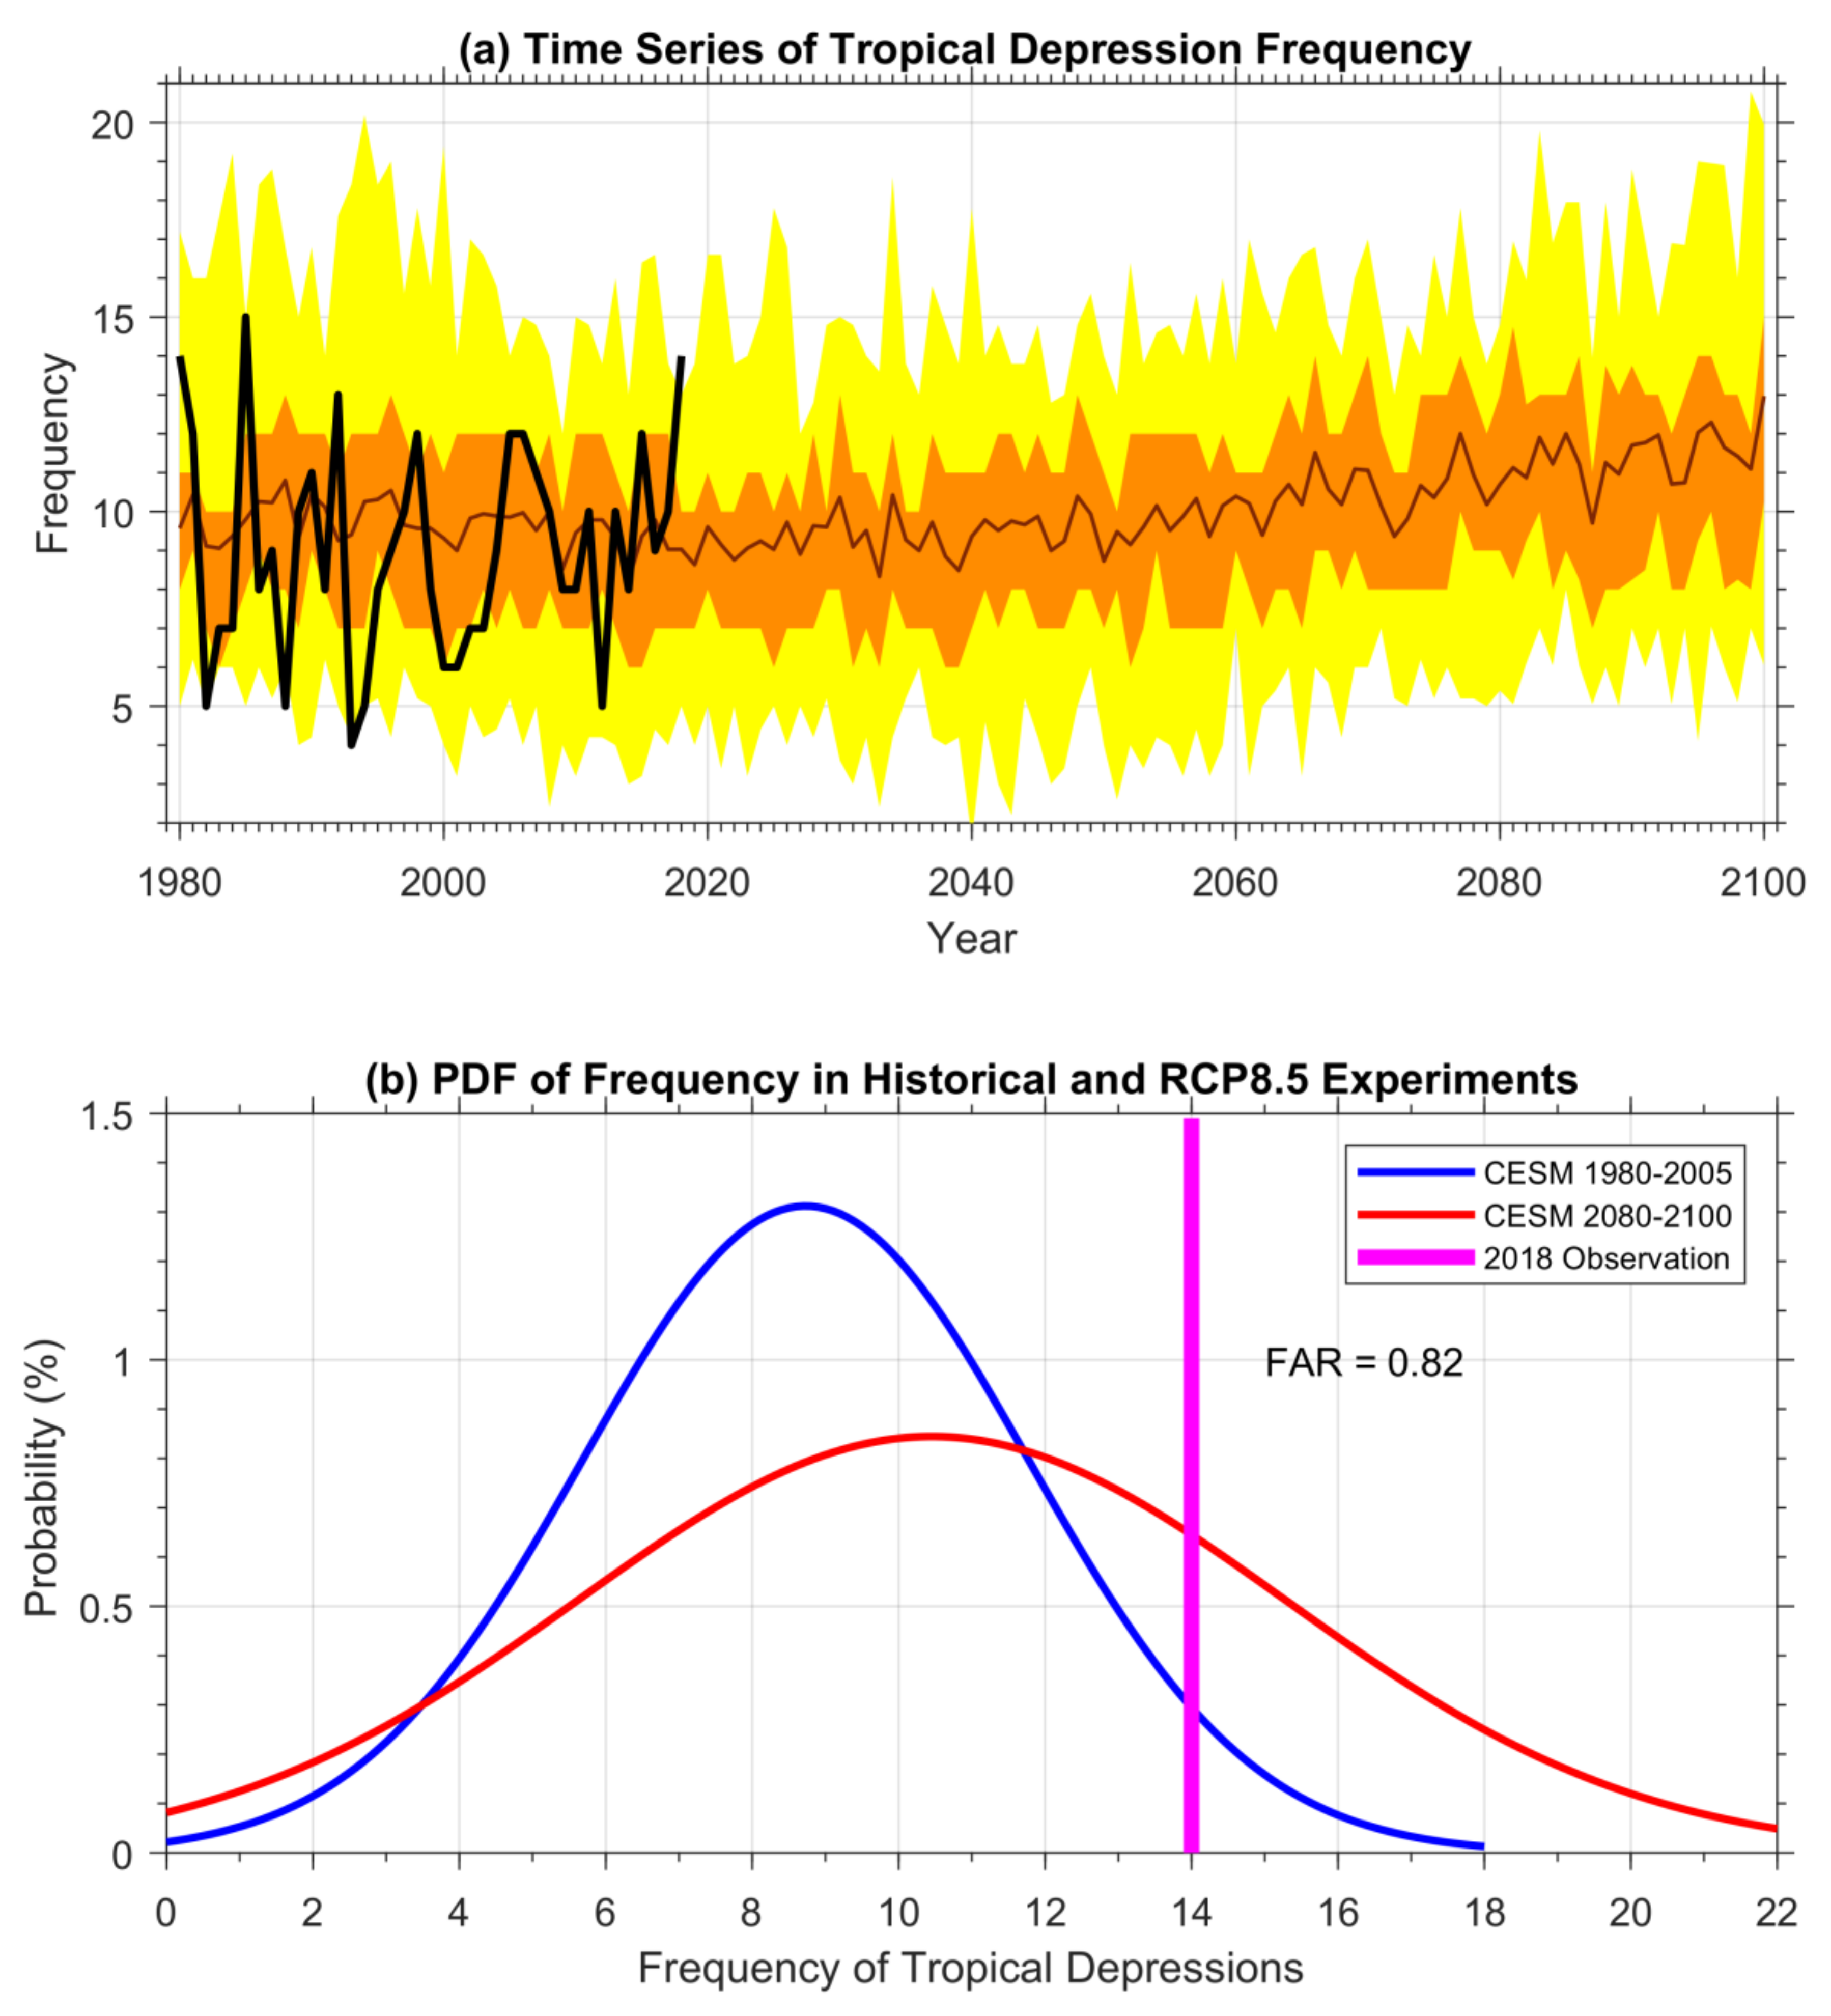
To assess the potential impacts of anthropogenic forcing in driving the likelihood of such events, we first investigate the frequency of tropical depressions in the North Indian Ocean based on 35-member historical and projection experiments with the CESM (Figure 3a). A rise was shown in the annual frequency of tropical depressions from ~9 in the early 1980s to ~12 events in the last part of the 21st century. Overall, the frequency of tropical depressions in the observations falls within the range of the 35-member historical experiments (Figure 3a), adding confidence to our further analysis of FAR using these experiments.
The probability density functions of the frequency of tropical depressions in the historical and projection experiments exhibited different features (Figure 3b); they had a larger mean and variance in the projection experiments than the historical experiments, resulting in a fatter tail. Using the observed frequency of tropical depressions (14 events) for the 2018 season as a threshold, we obtained a FAR value (1 – P0/P1) of 0.82 based on the two probability density functions, suggesting that anthropogenic forcing made events with the same frequency in 2018 ~4 times more likely to occur. In other words, we detected strong impacts of anthropogenic forcing on shaping the occurrence frequency of these storms, particularly in the late 21st century.
5. Discussion and Conclusions
The extremely active season of tropical depressions in 2018 has led to severe damage in the coastal regions of the Bay of Bengal and the Arabian Sea. Using the large-ensemble experiments performed with the NCAR CESM, we have identified an important role played by anthropogenic forcing in increasing the risk of the event with 14 tropical depressions in the North Indian Ocean, with a FAR value of 0.82. This suggests that anthropogenic forcing made events with the same frequency in 2018 ~4 times more likely to occur. Although the frequency of global tropical cyclones has been projected to increase or decrease [31,32,33], these results suggest that the frequency of tropical depressions in the North Indian Ocean is projected to increase with rising greenhouse gas concentration.
In terms of natural variability, we cannot detect a strong modulation of tropical depressions in the North Indian Ocean by the SST anomalies in the tropical North Atlantic or tropical central Pacific. As the coverage period of satellite data over the oceans is extending, we may better quantify the role of anthropogenic forcing in shaping tropical depressions in the future.
Author Contributions
Conceptualization, W.Z.; Formal analysis, W.Z. and V.H.; Funding acquisition, G.V.; Methodology, W.Z.; Writing—Original draft, W.Z.; Writing—Review and editing, V.H. and G.V.
Funding
This material is based in part upon work supported by the United States Army Corps of Engineers (USACE) Institute for Water Resources and by the National Science Foundation under Grant EAR-1840742. V.H. acknowledges the support by the Fulbright-Kalam Fellowship (Grant 2338/FKPDR/2018).
Acknowledgments
We thank the two anonymous reviewers for insightful comments that improved the quality of this study.
Conflicts of Interest
The authors declare no conflict of interest.
References
- Fritz, H.M.; Blount, C.D.; Albusaidi, F.B.; Al-Harthy, A.H.M. Cyclone Gonu storm surge in Oman. Estuar. Coast. Shelf Sci. 2010, 86, 102–106. [Google Scholar] [CrossRef]
- Raghavan, S.; Rajesh, S. Trends in Tropical Cyclone Impact: A Study in Andhra Pradesh, India: A Study in Andhra Pradesh, India. Bull. Am. Meteorol. Soc. 2003, 84, 635–644. [Google Scholar] [CrossRef]
- Singh, O.; Khan, T.A.; Rahman, M.S. Changes in the frequency of tropical cyclones over the North Indian Ocean. Meteorol. Atmos. Phys. 2000, 75, 11–20. [Google Scholar] [CrossRef]
- Krishna, K.M. Intensifying tropical cyclones over the North Indian Ocean during summer monsoon—Global warming. Glob. Planet. Change 2009, 65, 12–16. [Google Scholar] [CrossRef]
- Evan, A.T.; Camargo, S.J. A Climatology of Arabian Sea Cyclonic Storms. J. Clim. 2011, 24, 140–158. [Google Scholar] [CrossRef]
- Ng, E.K.; Chan, J.C. Interannual variations of tropical cyclone activity over the north Indian Ocean. Int. J. Climatol. 2012, 32, 819–830. [Google Scholar] [CrossRef]
- Sugi, M.; Murakami, H.; Yoshimura, J. Mechanism of the Indian ocean tropical cyclone frequency changes due to global warming. In Monitoring and Prediction of Tropical Cyclones in the Indian Ocean and Climate Change; Springer: Dordrecht, The Netherlands, 2008; pp. 40–49. [Google Scholar]
- Wahiduzzaman, M.; Oliver, E.C.; Wotherspoon, S.J.; Holbrook, N.J. A climatological model of North Indian Ocean tropical cyclone genesis, tracks and landfall. Clim. Dyn. 2017, 49, 2585–2603. [Google Scholar] [CrossRef]
- Zhang, W.; Villarini, G. On the role of the Atlantic Ocean in forcing tropic cyclones in the Arabian Sea. Atmos. Res. 2019, 220, 120–124. [Google Scholar] [CrossRef]
- Yuan, J.; Cao, J. North Indian Ocean tropical cyclone activities influenced by the Indian Ocean Dipole mode. Sci. China Earth Sci. 2013, 56, 855–865. [Google Scholar] [CrossRef]
- Mahala, B.K.; Nayak, B.K.; Mohanty, P.K. Impacts of ENSO and IOD on tropical cyclone activity in the Bay of Bengal. Nat. Hazards 2015, 75, 1105–1125. [Google Scholar] [CrossRef]
- Li, Z.; Li, T.; Yu, W.; Li, K.; Liu, Y. What controls the interannual variation of tropical cyclone genesis frequency over Bay of Bengal in the post-monsoon peak season? Atmos. Sci. Lett. 2016, 17, 148–154. [Google Scholar] [CrossRef]
- Balaguru, K.; Taraphdar, S.; Leung, L.R.; Foltz, G.R. Increase in the intensity of postmonsoon Bay of Bengal tropical cyclones. Geophys. Res. Lett. 2014, 41, 3594–3601. [Google Scholar] [CrossRef]
- Wang, S.Y.; Buckley, B.M.; Yoon, J.H.; Fosu, B. Intensification of premonsoon tropical cyclones in the Bay of Bengal and its impacts on Myanmar. J. Geophys. Res. Atmos. 2013, 118, 4373–4384. [Google Scholar] [CrossRef]
- Sumesh, K.; Kumar, M.R. Tropical cyclones over north Indian Ocean during El-Niño modoki years. Nat. Hazards 2013, 68, 1057–1074. [Google Scholar] [CrossRef]
- Sattar, M.A.; Cheung, K.K. Comparison between the Active Tropical Cyclone Seasons over the Arabian Sea and Bay of Bengal. Int. J. Climatol. 2019, in press. [Google Scholar] [CrossRef]
- Murakami, H.; Sugi, M.; Kitoh, A. Future changes in tropical cyclone activity in the North Indian Ocean projected by high-resolution MRI-AGCMs. Clim. Dyn. 2013, 40, 1949–1968. [Google Scholar] [CrossRef]
- Murakami, H.; Vecchi, G.A.; Underwood, S. Increasing frequency of extremely severe cyclonic storms over the Arabian Sea. Nat. Clim. Change 2017, 7, 885. [Google Scholar] [CrossRef]
- India Meteorological Department. Annual Frequency of Cyclonic Disturbances (Maximum Wind Speed of 17 Knots or More), Cyclones (34 Knots or More) and Severe Cyclones (48 Knots or More) Over the Bay of Bengal (BOB), Arabian Sea (AS) and Land Surface of India. Available online: http://www.rsmcnewdelhi.imd.gov.in (accessed on 2 March 2019).
- Kay, J.; Deser, C.; Phillips, A.; Mai, A.; Hannay, C.; Strand, G.; Arblaster, J.; Bates, S.; Danabasoglu, G.; Edwards, J. The Community Earth System Model (CESM) large ensemble project: A community resource for studying climate change in the presence of internal climate variability. Bull. Am. Meteorol. Soc. 2015, 96, 1333–1349. [Google Scholar] [CrossRef]
- Taylor, K.E.; Stouffer, R.J.; Meehl, G.A. An Overview of CMIP5 and the Experiment Design. Bull. Am. Meteorol. Soc. 2011, 93, 485–498. [Google Scholar] [CrossRef]
- Camargo, S.J. Global and Regional Aspects of Tropical Cyclone Activity in the CMIP5 Models. J. Clim. 2013, 26, 9880–9902. [Google Scholar] [CrossRef]
- Tan, K.; Huang, P.; Liu, F.; Murakami, H.; Hsu, P. Simulated ENSO’s impact on tropical cyclone genesis over the western North Pacific in CMIP5 models and its changes under global warming. Int. J. Climatol. 2019, 1–11. [Google Scholar] [CrossRef]
- Ullrich, P.A.; Zarzycki, C.M. TempestExtremes: A framework for scale-insensitive pointwise feature tracking on unstructured grids. Geosci. Model Dev. 2017, 10, 1069–1090. [Google Scholar] [CrossRef]
- Murakami, H.; Vecchi, G.A.; Delworth, T.L.; Paffendorf, K.; Jia, L.; Gudgel, R.; Zeng, F. Investigating the influence of anthropogenic forcing and natural variability on the 2014 Hawaiian hurricane season. Bull. Am. Meteorol. Soc. 2015, 96, S115–S119. [Google Scholar] [CrossRef]
- Yang, X.; Vecchi, G.; Delworth, T.; Paffendorf, K.; Jia, L.; Gudgel, R.; Zeng, F.; Underwood, S.D. Extreme North America winter storm season of 2013/14: Roles of radiative forcing and the global warming hiatus. Bull. Am. Meteorol. Soc. 2015, 96, S25–S28. [Google Scholar] [CrossRef]
- Zhang, W.; Vecchi, G.A.; Murakami, H.; Delworth, T.L.; Paffendorf, K.; Jia, L.; Villarini, G.; Gudgel, R.; Zeng, F.; Yang, X. Influences of natural variability and anthropogenic forcing on the extreme 2015 accumulated cyclone energy in the western north Pacific. Bull. Am. Meteorol. Soc. 2016, 97, S131–S135. [Google Scholar] [CrossRef]
- Allen, M. Liability for climate change. Nature 2003, 421, 891. [Google Scholar] [CrossRef]
- Stott, P.A.; Stone, D.A.; Allen, M.R. Human contribution to the European heatwave of 2003. Nature 2004, 432, 610. [Google Scholar] [CrossRef]
- Zebiak, S.E. Air–sea interaction in the equatorial Atlantic region. J. Clim. 1993, 6, 1567–1586. [Google Scholar] [CrossRef]
- Emanuel, K.A. Downscaling CMIP5 climate models shows increased tropical cyclone activity over the 21st century. Proc. Natl. Acad. Sci. USA 2013, 110, 12219–12224. [Google Scholar] [CrossRef]
- Knutson, T.R.; McBride, J.L.; Chan, J.; Emanuel, K.; Holland, G.; Landsea, C.; Held, I.; Kossin, J.P.; Srivastava, A.; Sugi, M. Tropical cyclones and climate change. Nat. Geosci. 2010, 3, 157. [Google Scholar] [CrossRef]
- Vecchi, G.A.; Delworth, T.L.; Murakami, H.; Underwood, S.D.; Wittenberg, A.T.; Zeng, F.; Zhang, W.; Baldwin, K.; Bhatia, K.; He, J.; et al. Tropical cyclone sensitivities to CO2 doubling: Roles of atmospheric resolution, synoptic variability and background climate changes. Clim. Dyn. 2019, 53, 5999–6033. [Google Scholar] [CrossRef] [Green Version]
Figure 1.
Tracks of tropical depressions during 2018 in the North Indian Ocean. Shading represents the intensity of the tropical depressions (unit: knot).
Figure 1.
Tracks of tropical depressions during 2018 in the North Indian Ocean. Shading represents the intensity of the tropical depressions (unit: knot).
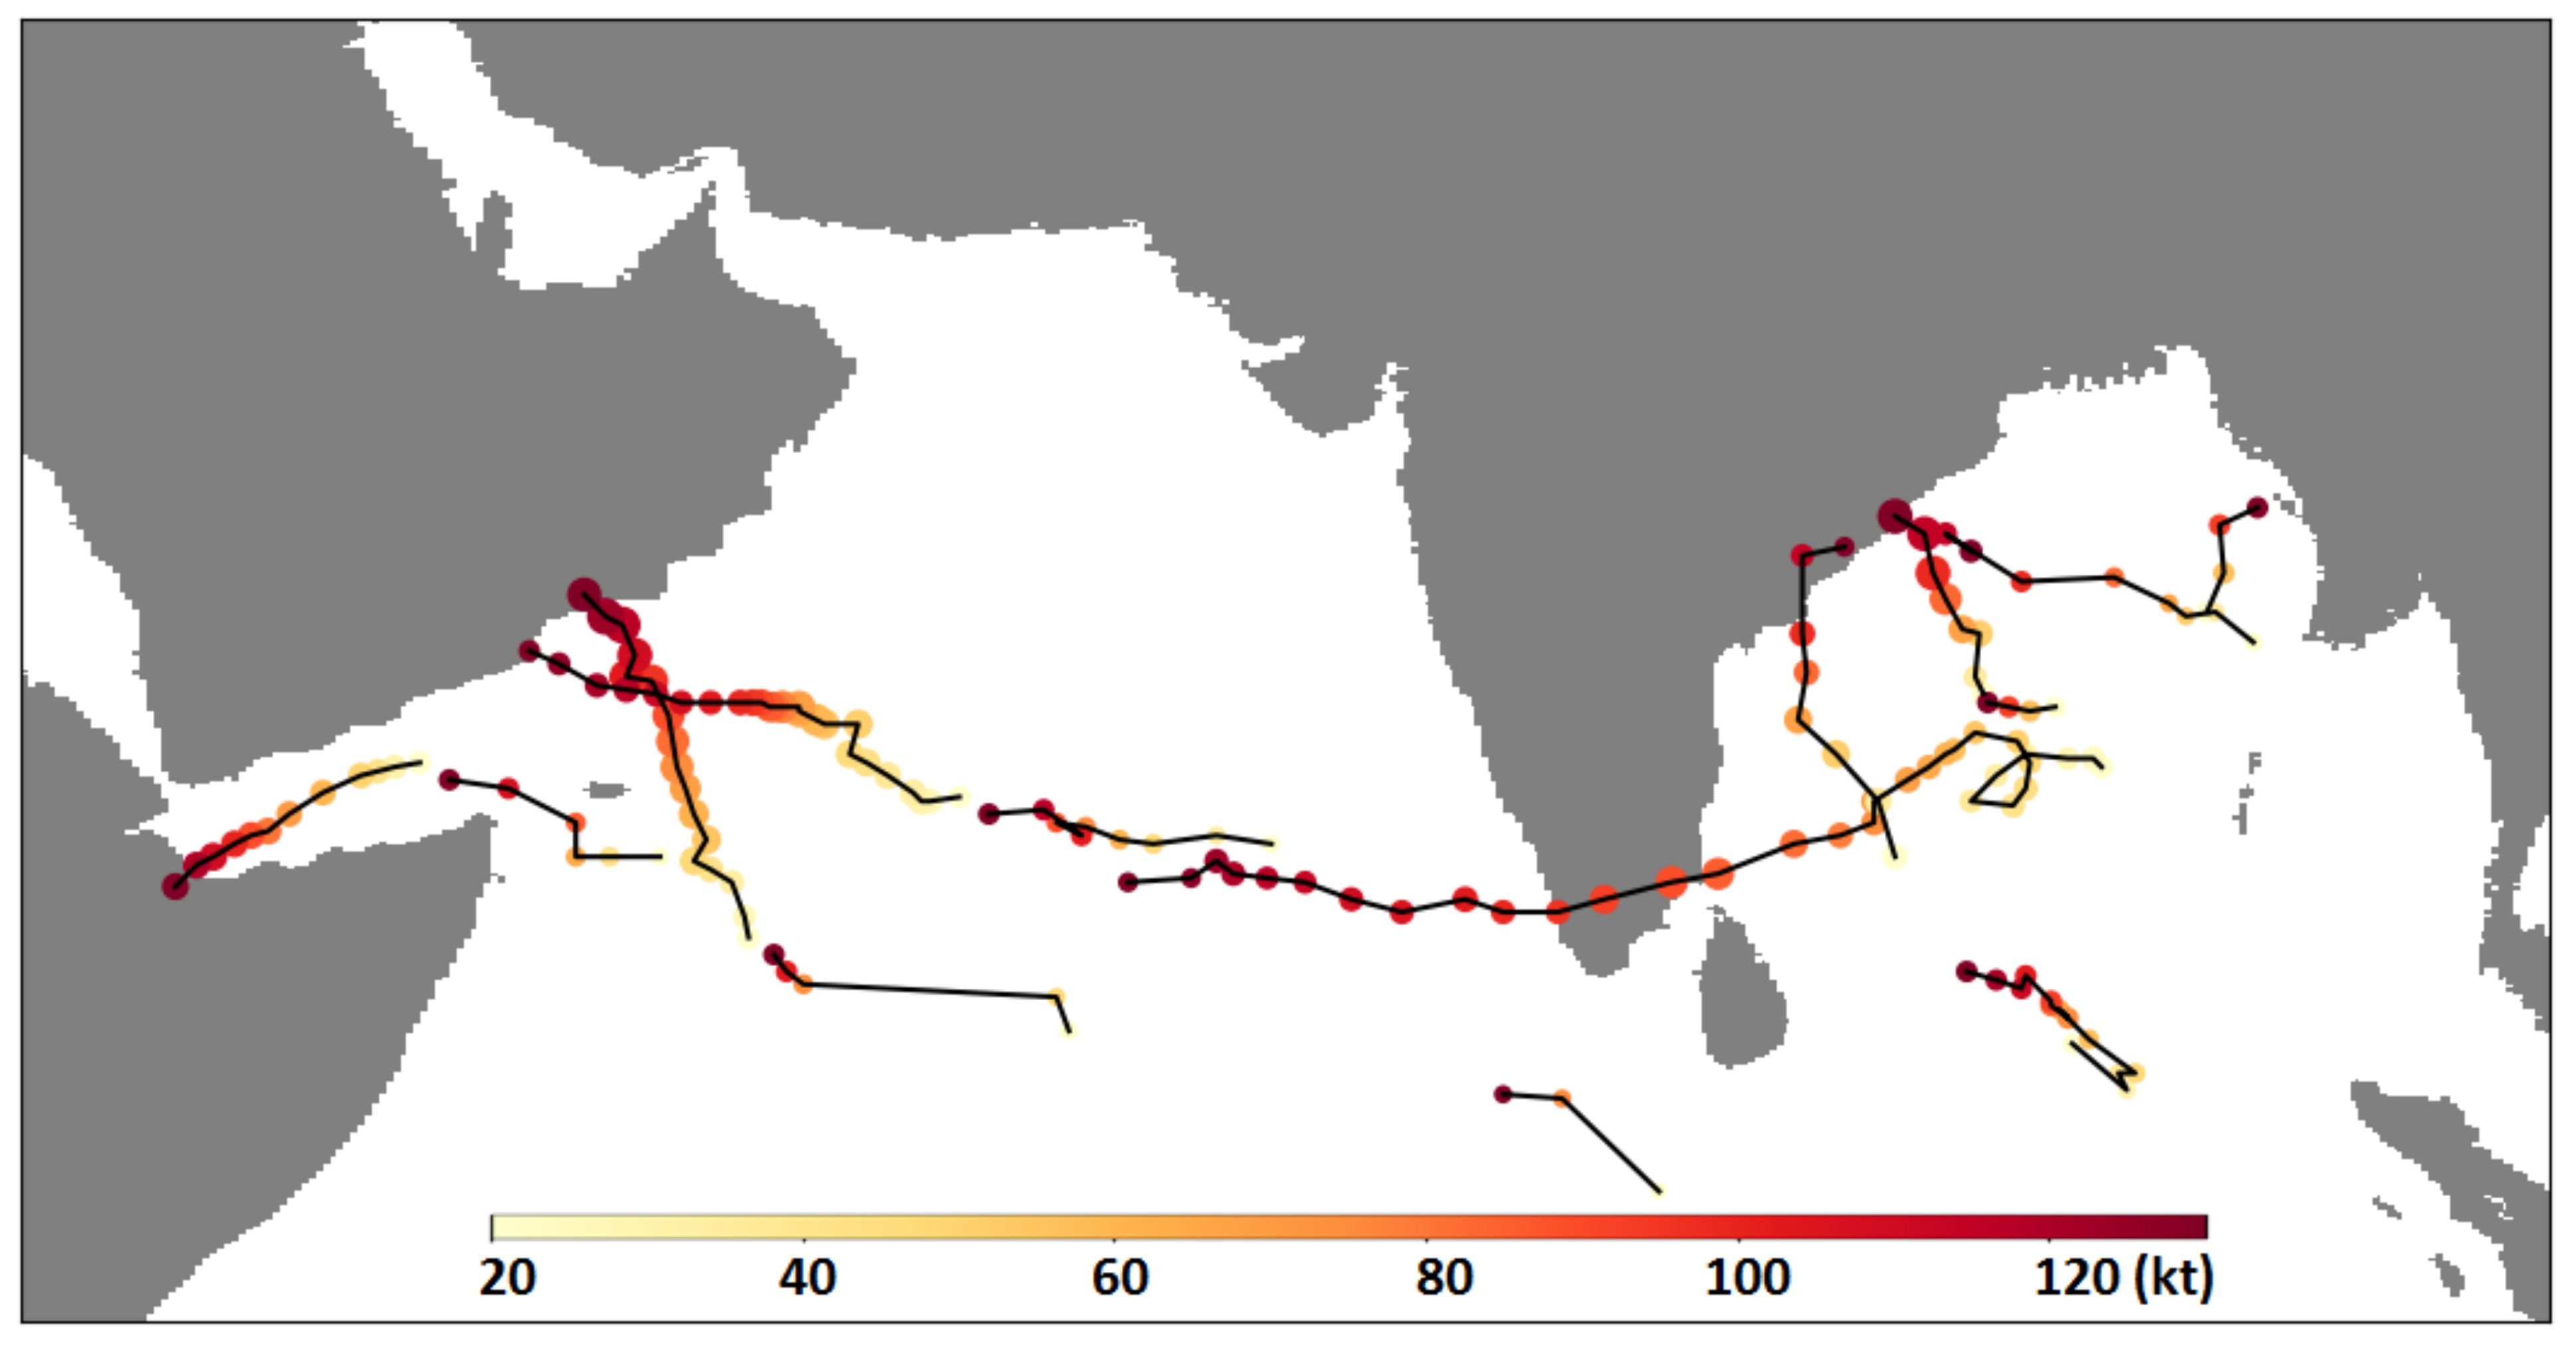
Figure 2.
Sea surface temperature (SST) anomaly in 2018 in the Atlantic and Indian Ocean. The anomaly is based on the base period of 1981–2010.
Figure 2.
Sea surface temperature (SST) anomaly in 2018 in the Atlantic and Indian Ocean. The anomaly is based on the base period of 1981–2010.
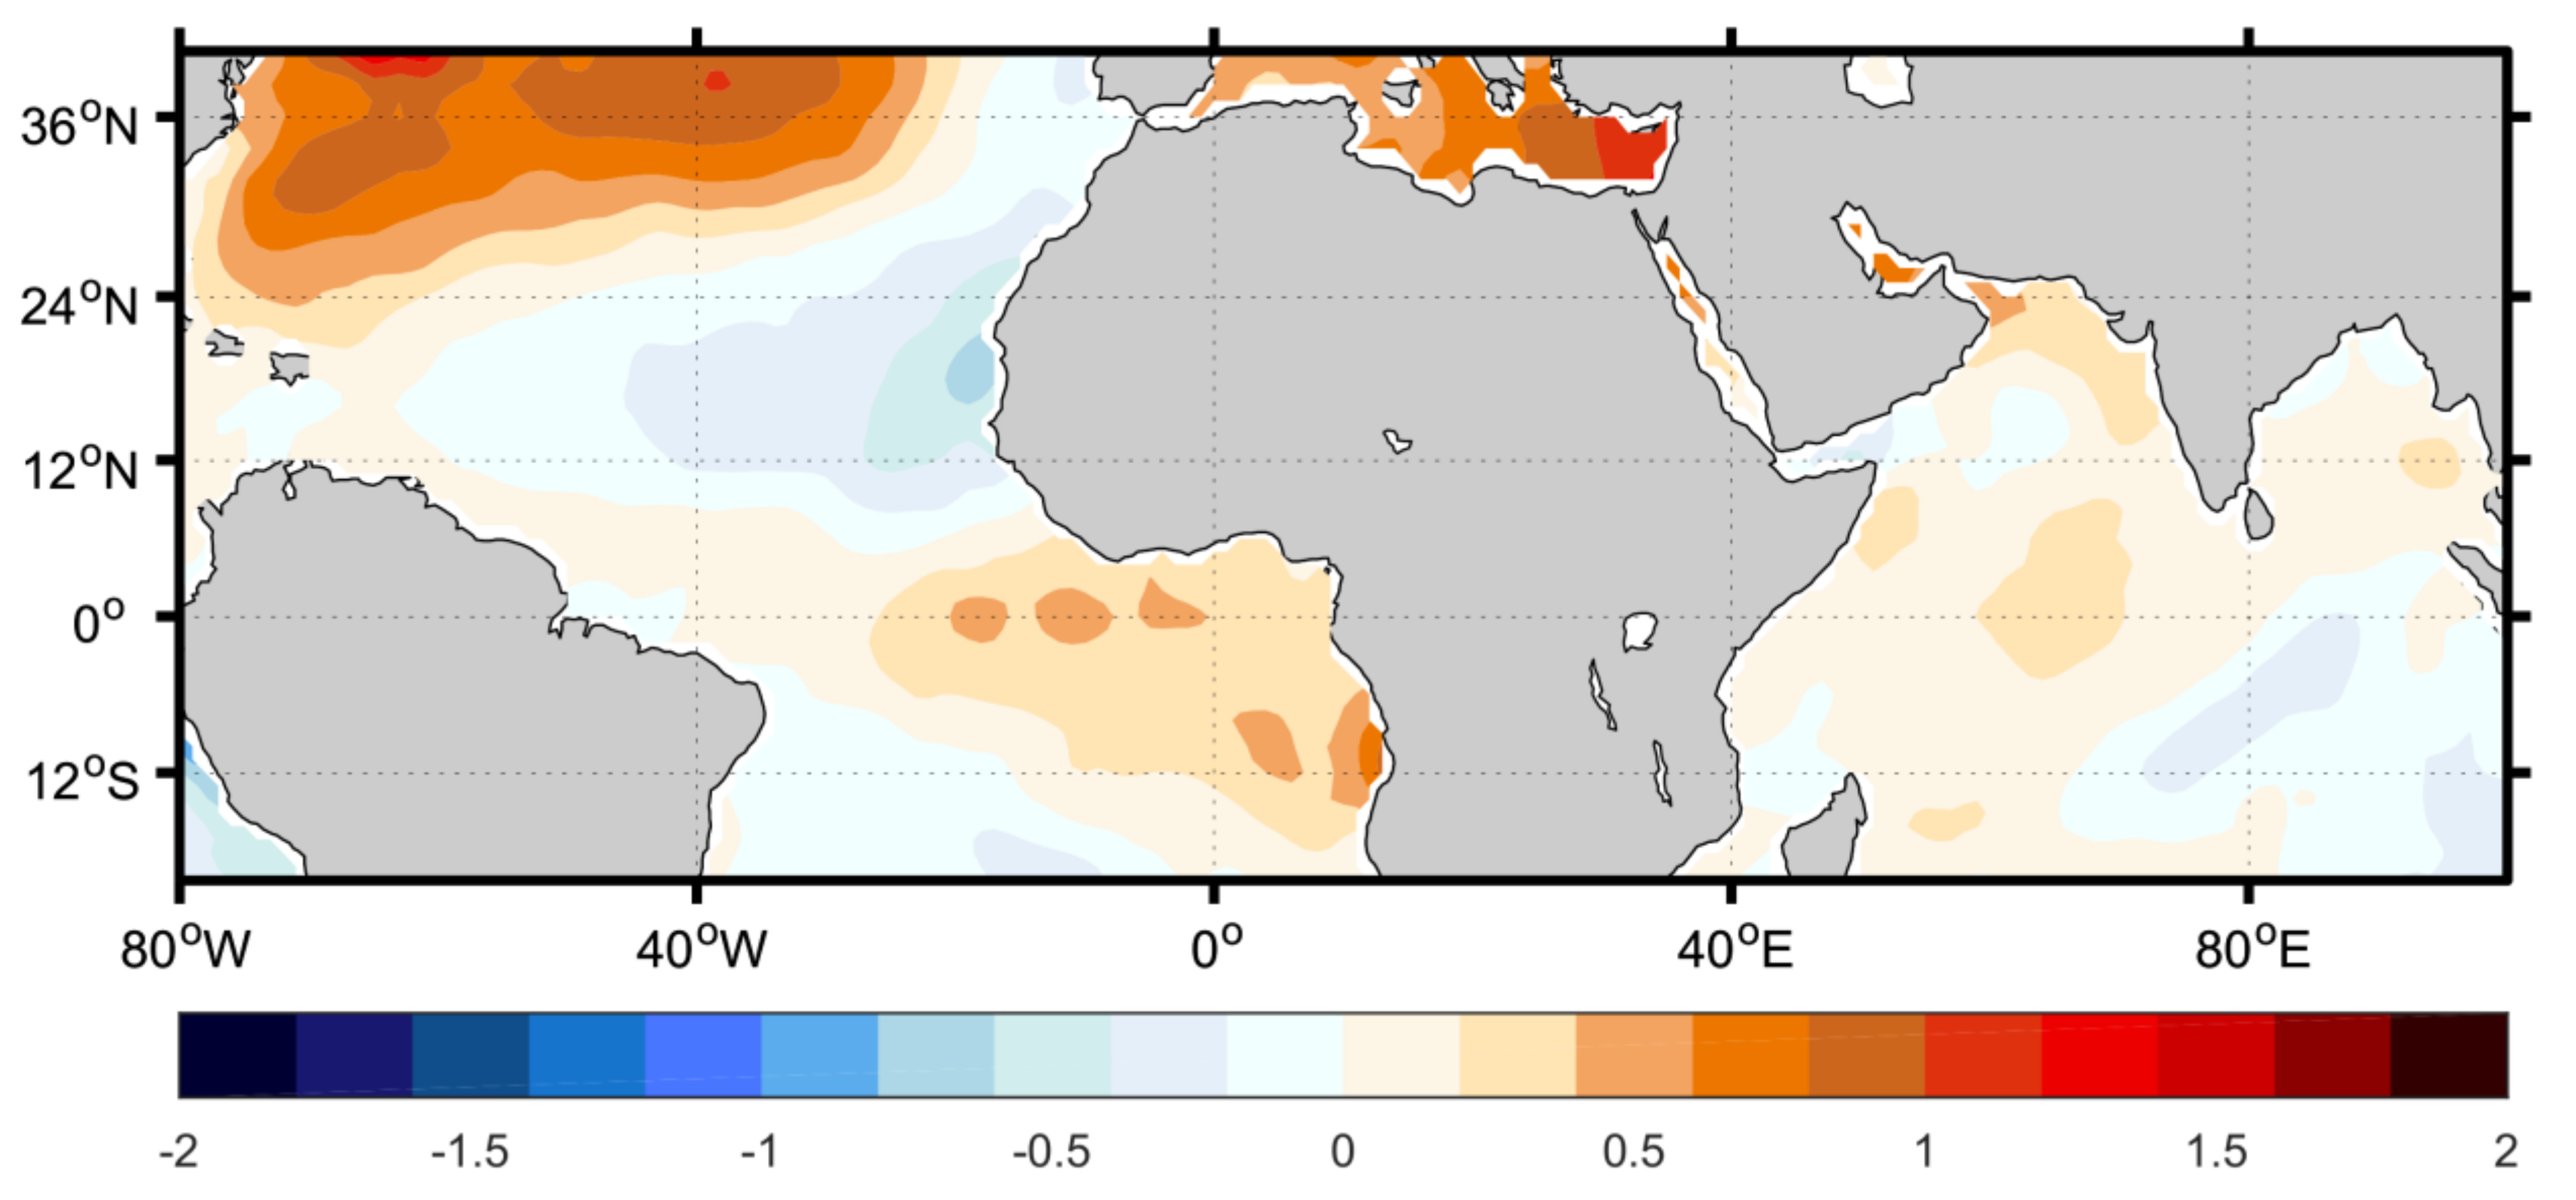
Figure 3.
(a) Frequency of tropical depressions in observations (black line) and in the historical experiments (red line) for 1980–2005, and the projection experiments under the Representative Concentration Pathways 8.5 (RCP8.5) scenario for 2006–2100 using the large-ensemble experiments performed by the Community Earth System Model developed by the National Center for Atmospheric Research (NCAR CESM). The orange shading indicates the range of 25th–75th percentile while the yellow one represents the range of 5th–95th percentile. (b) The probability density function of the frequency of tropical depressions in the 35-member historical experiments (in blue, during 1980–2005) and RCP 8.5 experiments (in red, during 2080–2100). The magenta bar represents the observed frequency of tropical depressions during 2018, which is used as the threshold for calculating the exceedance probability in the experiments. The P(x) in Equation (1) is represented by the areas formed by the magenta bar and the right tails of the probability distributions (red and blue). PDF—probability density function; FAR—fraction of attributable risk.
© 2019 by the authors. Licensee MDPI, Basel, Switzerland. This article is an open access article distributed under the terms and conditions of the Creative Commons Attribution (CC BY) license (http://creativecommons.org/licenses/by/4.0/).
Share and Cite
MDPI and ACS Style
Zhang, W.; Hari, V.; Villarini, G. Potential Impacts of Anthropogenic Forcing on the Frequency of Tropical Depressions in the North Indian Ocean in 2018. J. Mar. Sci. Eng. 2019, 7, 436. https://doi.org/10.3390/jmse7120436
AMA Style
Zhang W, Hari V, Villarini G. Potential Impacts of Anthropogenic Forcing on the Frequency of Tropical Depressions in the North Indian Ocean in 2018. Journal of Marine Science and Engineering. 2019; 7(12):436. https://doi.org/10.3390/jmse7120436
Chicago/Turabian StyleZhang, Wei, Vittal Hari, and Gabriele Villarini. 2019. "Potential Impacts of Anthropogenic Forcing on the Frequency of Tropical Depressions in the North Indian Ocean in 2018" Journal of Marine Science and Engineering 7, no. 12: 436. https://doi.org/10.3390/jmse7120436
Note that from the first issue of 2016, this journal uses article numbers instead of page numbers. See further details here.