Wave-Induced Seafloor Instability in the Yellow River Delta: Flume Experiments


1
College of Environmental Science and Engineering, Ocean University of China, Qingdao 266000, China
2
Shandong Provincial Key Laboratory of Marine Environment and Geological Engineering, Qingdao 266000, China
3
Laboratory for Marine Geology, Qingdao National Laboratory for Marine Science and Technology, Qingdao 266000, China
4
Shandong Provincial Key Laboratory of Marine Ecology and Environment & Disaster Prevention and Mitigation, Qingdao 266000, China
*
Authors to whom correspondence should be addressed.
J. Mar. Sci. Eng. 2019, 7(10), 356; https://doi.org/10.3390/jmse7100356
Submission received: 11 August 2019
/
Revised: 23 September 2019
/
Accepted: 1 October 2019
/
Published: 6 October 2019
(This article belongs to the Special Issue New Advances in Marine Engineering Geology)
Abstract
:Geological disasters of seabed instability are widely distributed in the Yellow River Delta, posing a serious threat to the safety of offshore oil platforms and submarine pipelines. Waves act as one of the main factors causing the frequent occurrence of instabilities in the region. In order to explore the soil failure mode and the law for pore pressure response of the subaqueous Yellow River Delta under wave actions, in-lab flume tank experiments were conducted in this paper. In the experiments, wave loads were applied with a duration of 1 hour each day for 7 consecutive days; pore water pressure data of the soil under wave action were acquired, and penetration strength data of the sediments were determined after wave action. The results showed that the fine-grained seabed presented an arc-shaped oscillation failure form under wave action. In addition, the sliding surface firstly became deeper and then shallower with the wave action. Interestingly, the distribution of pores substantially coincided with that of sliding surfaces. For the first time, gas holes were identified along with their positioning and angle with respect to the sediments. The presence of gas may serve as a primer for submarine slope failures. The wave process can lead to an increase in the excess pore pressure, while the anti-liquefaction capacity of the sediments was improved, causing a decrease in the excess pore pressure resulting from the next wave process. Without new depositional sediments, the existing surface sediments can form high-strength formation under wave actions. The test results may provide a reference for numerical simulations and engineering practice.
1. Introduction
The Yellow River Delta is one of largest-scale deltas with the fastest progradation rate in the world. The Yellow River brings abundant high-concentration sediments from the Loess Plateau, which are rapidly deposited in the subaqueous delta of the estuary, forming a high-moisture under-consolidated silty seabed. It is estimated that the average annual sediment transport volume exceeds 800 million tons from 1950 to 2005 [1], and over 70–90% of the sediments were deposited in the sea area within 30 km from the estuary [2], gradually forming the modern subaqueous Yellow River Delta. Such newly formed seabeds under the influence of waves and storm surges are prone to instability, thereby forming unstable seabed landforms of subaqueous delta in the estuary of the Yellow River.
Previous studies reported that various ocean dynamic processes can affect the delta of the Yellow River [3,4,5]. The yearly winter storms coming from the northwest have the most powerful effect from October to March. During the winter season, the prevailing northwest winter winds becomes stronger than grade 8 on average 6.4 times each year. The wave height generated by winter storms can reach 7 m [3]. In addition, the weak southeastern winds prevail from July to August. Occasionally, hurricanes or typhoons occur in a given year. For example, Typhoon Lekima meandered over the Yellow Sea and Bohai Sea in 2019. Available survey results showed that geological disasters such as liquefaction, landslide, subsidence and depression, gully, scarp, disturbed strata, and erosion are common across the subaqueous Yellow River Delta [6,7,8,9]. The Yellow River Delta is rich in oil and gas resources and is the location of Shengli Oilfield, currently the largest offshore oil field in China. Seabed instability disasters seriously threatens the safety and stability of the offshore oil platform, submarine pipeline, wharf, and embankment [10,11,12]. For example, on December 3, 1998, the CB6A-5 oil production platform of Chengdao Oilfield collapsed, and the casing pipes at the bottom of the oil well ruptured, causing a material oil spill lasting half a year [13]. In November 2003, a submarine landslide occurred under the action of ocean power near the oil production platform CB12B, resulting in the interruption of two submarine cables [14]. In 2010, Operation Platform No. 3 of Shengli Oilfield was overturned due to the instability of the seabed stratum during a storm surge, leading to the death of two people and a direct economic loss of RMB 5.92 million [15].
There are two main types of seabed instability under wave action. In one, the shear stress is greater than the shear strength of the soil, causing the seabed to be unstable; in the other, it is the variation in the pore water pressure in the seabed under wave action that causes the seabed to undergo liquefaction, resulting in the loss of effective stress in the soil, thereby leading to instability. With respect to the studies on the instability of the seabed under wave action, especially in the subaqueous Yellow River Delta, plenty of field surveys, numerical analyses, laboratory tests, and in situ observation studies have been carried out [16,17,18,19,20,21]. However, few wave flume experiments have comprehensively investigated landforms, failure mode, gas distribution, pore pressure response, and sediment strength. In addition, failure of the seabed has been understudied, even though some interesting phenomena have been identified. For example, previous studies have confirmed fine particle migration due to wave action. In order to deeply explore the soil failure mode, gas distribution, and pore pressure response law under wave action, in-lab wave flume experiments were designed and carried out in this study. For the first time, gas holes were identified along with their positioning and angle with respect to the sediments. The presence of gas may serve as a primer for submarine slope failure.
2. Materials and Methods
2.1. Experiment Process
The flume used in the experiment was 120 cm × 50 cm × 120 cm. In order to observe the variation in soil mass, the outer wall of the flume was made of transparent glass. In the flume experiment, the sediment thickness was set to be 45 cm, and the depth of overlying water was set to be 40 cm. The sediments used in the experiment were taken from the Yellow River Delta, and its median particle size was 0.058 mm. The particle-size distribution curve of these sediment samples is shown in Figure 1.
Prior to each experiment, powdery sediments were taken, and their contents were controlled at around 40%, we then added water to have a water content of 40%, and the powdery sediment was mixed with the stirrer. The deposited sediments were then transferred to the flume until the thickness of the sediment hit 45 cm; and the pore pressure sensors were then buried with a burial depth of 0 cm, 25 cm, 35 cm, and 40 cm, respectively, as shown in Figure 2. Afterward, water was filled into the flume, avoiding the formation of erosion pits on the surface of the soil mass during the water-filling process due to high water-filling speed, and we stop adding water when the height of the water filling reached 40 cm. We kept the model flume still for 24 hours after its preparation was finished in order to complete drainage consolidation. We then performed manual wave generation with the duration of 1 hour each day and proceeded for 7 consecutive days. Simultaneously, we measured the pore water pressure and observed the experimental phenomenon. We discharged the overlying water body when the experiment ended, and determined the penetration strength of the soil mass with a micro penetrometer at different depths.
2.2. Wave Generation
A hollow cylinder with a diameter of 10 cm and height of 40 cm was used in the experiment to artificially create waves in the flume. The cylinder was placed horizontally on one end of the flume and then it was moved up and down the water surface to create the first wave as shown in Figure 3a; when the first wave propagated to the other end of the flume, a reflected wave was formed and then propagated in the opposite direction. The cylinder was moved up and down the water surface to produce the second wave as shown in Figure 3b; when two waves collided in the middle of the flume, a superposition occurred (Figure 3c); then, the two waves continued to advance in their respective directions (Figure 3d), and a reflected wave was formed simultaneously at each side wall of the flume. When the first wave was located at the hollow cylinder, the cylinder was moved up and down at the frequency of the wave to increase the amplitude of the wave or to supplement the energy lost during the propagation (Figure 3e). The second wave collided with the first wave in the middle of the flume after being reflected by the side wall of the flume and then they separated (Figure 3f); we supplemented the energy lost during the propagation in the same way. Continuous waves with different frequencies were formed in the flume in this way.
In the flume experiment, the length of the flume was short (120 cm), and the wave propagated from one side wall of the flume to the other within a short time, so that two waves were superposed together in the flume to form the standing wave. Only the waveforms in Figure 3e,f could be seen in the flume during the experiment, as shown in Figure 4.
3. Results and Discussion
3.1. Slide Surface and Ripples
No significant movement of the soil mass occurred within 5 min upon the wave application action, while the water body began to become turbid, and the 15-cm-thick sediment started to exhibit a weak waveform oscillation motion with a frequency and phase consistent with those of the water wave when the wave acted for approximately 3 min. The soil mass showed distinct arc-shaped sliding surface in 20 min. The sliding surfaces located in the middle of the flume and near the wall of the flume were higher, and those at 30 cm and 90 cm approximately from the left wall of the flume were lower. The sediment on the sliding surface reciprocated the wave, and the lower part of the sliding surface was almost stationary. As the duration of the wave action increased, the sliding surface constantly expanded deeper, and the thickness of the moving soil mass increased continuously, forming a distinct "W" shaped sliding surface. When the wave application was stopped, the concentration of suspended sediments in the water gradually decreased. In addition, fine-grained sedimentary formation occurred on the surface layer (Figure 5a).
Similar phenomenon still occurred in the course of the wave application in subsequent days, while the maximum depth of the sliding surface gradually decreased, and the sliding surface gradually moved upwards; the surface of the soil mass started to undergo local erosion and sedimentation, and ripples appeared. Similar experimental phenomena were also observed in other experiments [22,23], but “V”-shaped sliding surfaces occurred, rather than “W”-shaped. The maximum expansion depth of the sliding surface was close to the interface of water and the soil when the last wave application was made, and the soil mass did not further oscillate. Finally, a continuous array of ripples with the wavelength of 5–10 cm formed on the surface of the soil mass (Figure 6). Additionally, sedimentation occurred in the middle position of the flume and the position near the wall of the flume, and the erosion occurred at sites approximately 30 cm and 90 cm away from the left wall. The surface shape of the soil mass tended to be consistent with the sliding surface, and W-shaped forms appeared.
3.2. Gas Distribution
A sample portion of the soil approximately 10 cm in the upper layer was taken after the end of the experiment. It was found that there was a large number of gas holes in the vertical section of the soil sample (Figure 7). The gas holes in the soil were distributed in a horizontal or inclined and zonal manner rather than being uniform (Figure 8), and even a gas channel existed. Within a depth ranging from 3 cm to 4 cm and from 8 cm to 10 cm, the number of pores was greater than 100, while the holes in other depth ranges were less than 30. The area where the pores were densely distributed was consistent with the sliding surface of the soil mass.
The gas holes in the soil sample were distributed in an oblique and zonal manner at a distance of 100–110 cm from the left wall of the flume, at an angle of approximately 30°–40° with the horizontal plane. The closer they were to the surface of the soil, the smaller the inclination. The distribution of gas holes (Figure 9) was substantially consistent with that of sliding surfaces. Previous studies confirmed fine-particle migration due to external actions, such as waves [22,24,25]. However, this experiment offered the first evidence of possible gas migration due to wave action. The presence of gas may serve as a primer for submarine slope failure [26].
3.3. Pore Pressure
The pore pressure is an important indicator of the properties of soil masses [27,28]. A total of seven wave application processes each with a duration of approximately 1 hour were performed. It was found from Figure 10 that the pore pressure in the seabed soil body significantly accumulated and could reach the maximum cumulative pore pressure within a short time (approximately 5 min) and remained stable. The fine-grained seabed had low permeability, and it was difficult to quickly dissipate the excess pore water pressure caused by the wave.
Figure 10 shows the excess pore pressure curve at a depth of 20 cm and 35 cm in the seabed during seven wave application processes. The figures from 10a to 10g show that the excess pore pressure at a depth of 35 cm was slightly greater than that at a depth of 20 cm, indicating that the greater the depth was, the harder it was for the excess pore pressure to dissipate. The excess pore pressure data from the seven wave applications at the same depth (Figure 10h,i) indicated that the maximum excess pore pressure formed from the process of the last wave application was lower than that formed from previous wave applications. For example, the maximum pore pressure at a depth of 20 cm of the seabed hit approximately 1.4 kPa in the first wave application, approximately 1.0 kPa in the third wave application, and approximately 0.2 kPa in the seventh wave application. The maximum excess pore pressure inside the soil mass showed a decrease trend with the increase in the number of wave actions, indicating that the whole soil mass tended to be stable. It was consistent with the experimental phenomenon that the sliding surface gradually moved up and became shallow with wave application process, and that the thickness of the oscillation layer reduced. Each wave application process might lead to an increase in the excess pore pressure of the seabed sediment. However, the liquefaction resistance of the sediment improved upon each wave action process, resulting in a decrease in the excess pore pressure caused by the next process of wave action. This might be due to the fact that the wave action can promote the rearrangement of sediment particles. The experiment results show that the seabed is the most unstable in the initial stage of rapid deposition of sediment, and it is most likely to be destroyed under wave action. Due to the limitations of laboratory experiments [29,30], more field work is required to confirm these experimental results.
3.4. Sediment Strength
The overlying water mass was discharged after the seventh wave action, and the entire soil sample was subject to a penetration strength experiment with a micro penetration instrument. The diameter of the mini penetrometer was 3 cm, the horizontal separation distance between test points was 15 cm, and the vertical depth interval was 5 cm. As shown in Figure 11, the penetration strength of the soil mass was substantially greater than 50 kN in the depth range from 0 cm to 20 cm, and the penetration strength of the soil mass ranging from 8 cm to 13 cm was greater, with a mean value greater than 80 kN, indicating there was a high-strength formation at this depth. The soil mass had a relatively large variation in strength gradient, with the strength of the soil mass decreasing from 60 kN to 30 kN in this 7-cm-thick range. The penetration strengths of the soil mass with the depth ranging from 20 cm to 40 cm were less than 30 kN, and most of the values were approximately 10 kN, being less than the penetration strength in the hard formation of the surface strength. By comparing the strength distribution law for sliding surface and soil penetration, it was found that the depth of the high-strength formation was slightly less than the depth (15 cm) of maximum sliding surface, that is, the high-strength formation was located above the sliding surface. This indicates that exiting surface sediment undergoes multiple wave actions, and its strength is improved in the absence of new deposition conditions.
4. Conclusions
The instability behavior of the fine-grained seabed under wave action was simulated in in-lab flume experiments in this work. The main experimental results are summarized as follows:
- (1)
- The fine-grained seabed presents an arc-shaped oscillation failure form under wave action. The sliding surface becomes deeper and then shallower as the wave action continues. The distribution of the gas pores is substantially the same as that of the sliding surfaces.
- (2)
- We found the first evidence for possible gas migration due to wave action. The presence of gas may serve as a primer for submarine slope failures, which suggests a new mechanism for seafloor instability in the Yellow River Delta.
- (3)
- Each wave process may cause the perforation pressure of the sediment to increase, and the liquefaction resistance capacity of the sediment increases during each wave process, leading to a decrease in the excess pore pressure caused by the next wave process. The seabed is the most unstable and most susceptible to damage under wave action in the initial stage of rapid deposition of the sediment.
- (4)
- Without new depositional sediments, the existing surface sediments can form high-strength formation under wave actions.
Author Contributions
Conceptualization, H.L.; Data curation, X.W. and C.Z.; Formal analysis, X.W. and C.Z.; Funding acquisition, H.L.; Writing—original draft, X.W. and C.Z.; Writing—review & editing, X.W., C.Z., and H.L. The final manuscript has been approved by all the authors.
Funding
This research was funded by the National Natural Science Foundation of China (grant number 41877223) and Shandong Provincial Key Laboratory of Marine Ecology and Environment & Disaster Prevention and Mitigation (grant number 201801).
Acknowledgments
Authors acknowledge the experimental and technical support provided by Minsheng Zhang.
Conflicts of Interest
The authors declare no conflict of interest.
References
- Wang, H.; Yang, Z.; Li, G.; Jiang, W. Wave climate modeling on the abandoned Huanghe (Yellow River) delta lobe and related deltaic erosion. J. Coast. Res. 2006, 22, 906–918. [Google Scholar] [CrossRef]
- Saito, Y.; Yang, Z.S.; Hori, K. The Huanghe (Yellow River) and Changjiang (Yangtze River) deltas: A review on their characteristics, evolution and sediment discharge during the Holocene. Geomorphology 2001, 41, 219–231. [Google Scholar] [CrossRef]
- Yang, Z.; Ji, Y.; Bi, N.; Lei, K.; Wang, H. Sediment transport off the Huanghe (Yellow River) delta and in the adjacent Bohai Sea in winter and seasonal comparison. Estuar. Coast. Shelf Sci. 2011, 93, 173–181. [Google Scholar] [CrossRef]
- Bi, N.; Yang, Z.; Wang, H.; Fan, D.; Sun, X.; Lei, K. Seasonal variation of suspended-sediment transport through the southern Bohai Strait. Estuar. Coast. Shelf Sci. 2011, 93, 239–247. [Google Scholar] [CrossRef]
- Johnson, M.E.; Gudveig Baarli, B. Geomorphology and coastal erosion of a quartzite island: Hongdo in the Yellow Sea off the SW Korean Peninsula. J. Geol. 2013, 121, 503–516. [Google Scholar] [CrossRef]
- Prior, D.B.; Suhayda, J.N.; Lu, N.Z.; Bornhold, B.D. Storm wave reactivation of a submarine landslide. Nature 1989, 341, 47–50. [Google Scholar] [CrossRef]
- Guo, Z.; Zhou, W.; Zhu, C.; Yuan, F.; Rui, S. Numerical Simulations of Wave-Induced Soil Erosion in Silty Sand Seabeds. J. Mar. Sci. Eng. 2019, 7, 52. [Google Scholar] [CrossRef]
- Zhu, C.; Liu, X.; Shan, H.; Zhang, H.; Shen, Z.; Zhang, B.; Jia, Y. Properties of suspended sediment concentrations in the Yellow River delta based on observation. Mar. Georesour. Geotech. 2018, 36, 139–149. [Google Scholar] [CrossRef]
- Xu, G.; Sun, Y.; Wang, X.; Hu, G.; Song, Y. Wave-induced shallow slides and their features on the subaqueous Yellow River delta. Can. Geotech. J. 2009, 46, 1406–1417. [Google Scholar] [CrossRef]
- Jia, Y.; Zhu, C.; Liu, L.; Wang, D. Marine Geohazards: Review and Future Perspective. Acta Geol. Sin. Engl. 2016, 90, 1455–1470. [Google Scholar] [CrossRef]
- Sun, Y.; Dong, L.; Song, Y. Analysis of characteristics and formation of disturbed soil on subaqueous delta of Yellow River. Rock Soil Mech. 2008, 29, 1494–1499. [Google Scholar]
- Zhu, C.; Cheng, S.; Li, Q.; Shan, H.; Shen, Z.; Liu, X.; Jia, Y. Giant Submarine Landslide in the South China Sea: Evidence, Causes and Implications. J. Mar. Sci. Eng. 2019, 7, 152. [Google Scholar] [CrossRef]
- Chang, F. Study on Mechanism of Wave-Induced Submarine Landslide at the Yellow River Estuary, China. Ph.D. Thesis, Ocean University of China, Qingdao, China, 30 June 2009. [Google Scholar]
- Zheng, C. Shengli Chengdao Oilfield Submarine Power Cable Fault Type and Causes Analysis. Saf. Health Environ. 2016, 16, 6–10. [Google Scholar]
- Du, F. Research on the Geological Causes of Sheng Li Well Workover Platform III Overturning Accident. Ph.D. Thesis, Ocean University of China, Qingdao, China, 30 June 2013. [Google Scholar]
- Jia, Y.; Zhang, L.; Zheng, J.; Liu, X.; Jeng, D.; Shan, H. Effects of wave-induced seabed liquefaction on sediment re-suspension in the Yellow River Delta. Ocean Eng. 2014, 89, 146–156. [Google Scholar] [CrossRef]
- Keller, G.H.; Prior, D.B. Sediment dynamics of the Huanghe (Yellow River) delta and neighboring gulf of Bohai, People’s Republic of China: Project overview. Geo Mar. Lett. 1986, 6, 63–66. [Google Scholar] [CrossRef]
- Sumer, B.M.; Hatipoglu, F.; Fredsoe, J.; Sumer, S.K. The sequence of sediment behaviour during wave-induced liquefaction. Sedimentology 2006, 53, 611–629. [Google Scholar] [CrossRef]
- Tong, L.; Zhang, J.; Sun, K.; Guo, Y.; Zheng, J.; Jeng, D. Experimental study on soil response and wave attenuation in a silt bed. Ocean Eng. 2018, 160, 105–118. [Google Scholar] [CrossRef] [Green Version]
- Wang, Z.; Jia, Y.; Liu, X.; Wang, D.; Shan, H.; Guo, L.; Wei, W. In situ observation of storm-wave-induced seabed deformation with a submarine landslide monitoring system. Bull. Eng. Geol. Environ. 2018, 77, 1091–1102. [Google Scholar] [CrossRef]
- Wang, H.; Liu, H.; Zhang, M. Pore pressure response of seabed in standing waves and its mechanism. Coast. Eng. 2014, 91, 213–219. [Google Scholar] [CrossRef]
- Liu, X.; Jia, Y.; Zheng, J.; Wen, M.; Shan, H. An experimental investigation of wave-induced sediment responses in a natural silty seabed: New insights into seabed stratification. Sedimentology 2017, 64, 508–529. [Google Scholar] [CrossRef]
- Xu, G.; Liu, Z.; Sun, Y.; Wan, X.; Lin, L.; Ren, Y. Experimental characterization of storm liquefaction deposits sequences. Mar. Geol. 2016, 382, 191–199. [Google Scholar] [CrossRef]
- Zhang, S.; Jia, Y.; Wen, M.; Wang, Z.; Zhang, Y.; Zhu, C.; Li, B.; Liu, X. Vertical migration of fine-grained sediments from interior to surface of seabed driven by seepage flows—‘sub-bottom sediment pump action’. J. Ocean Univ. China 2017, 16, 15–24. [Google Scholar] [CrossRef]
- Yang, Q.; Cheng, K.; Wang, Y.; Ahmad, M. Improvement of semi-resolved CFD-DEM model for seepage-induced fine-particle migration: Eliminate limitation on mesh refinement. Comput. Geotech. 2019, 110, 1–18. [Google Scholar] [CrossRef]
- Li, A.; Davies, R.J.; Yang, J. Gas trapped below hydrate as a primer for submarine slope failures. Mar. Geol. 2016, 380, 264–271. [Google Scholar] [CrossRef]
- Yang, Q.; Ren, Y.; Niu, J.; Cheng, K.; Hu, Y.; Wang, Y. Characteristics of soft marine clay under cyclic loading: A review. Bull. Eng. Geol. Environ. 2018, 77, 1027–1046. [Google Scholar] [CrossRef]
- Zhang, Y.; Jeng, D.S.; Zhao, H.Y.; Zhang, J.S. An integrated model for pore pressure accumulations in marine sediment under combined wave and current loading. Geomech. Eng. 2016, 10, 387–403. [Google Scholar] [CrossRef]
- Barry, M.A.; Boudreau, B.P.; Johnson, B.D. Gas domes in soft cohesive sediments. Geology 2012, 40, 379–382. [Google Scholar] [CrossRef]
- Williams, S.C.P. Skimming the surface of underwater landslides. Proc. Natl. Acad. Sci. USA 2016, 113, 1675–1678. [Google Scholar] [CrossRef] [Green Version]
Figure 1.
Grading curve of sediment size.
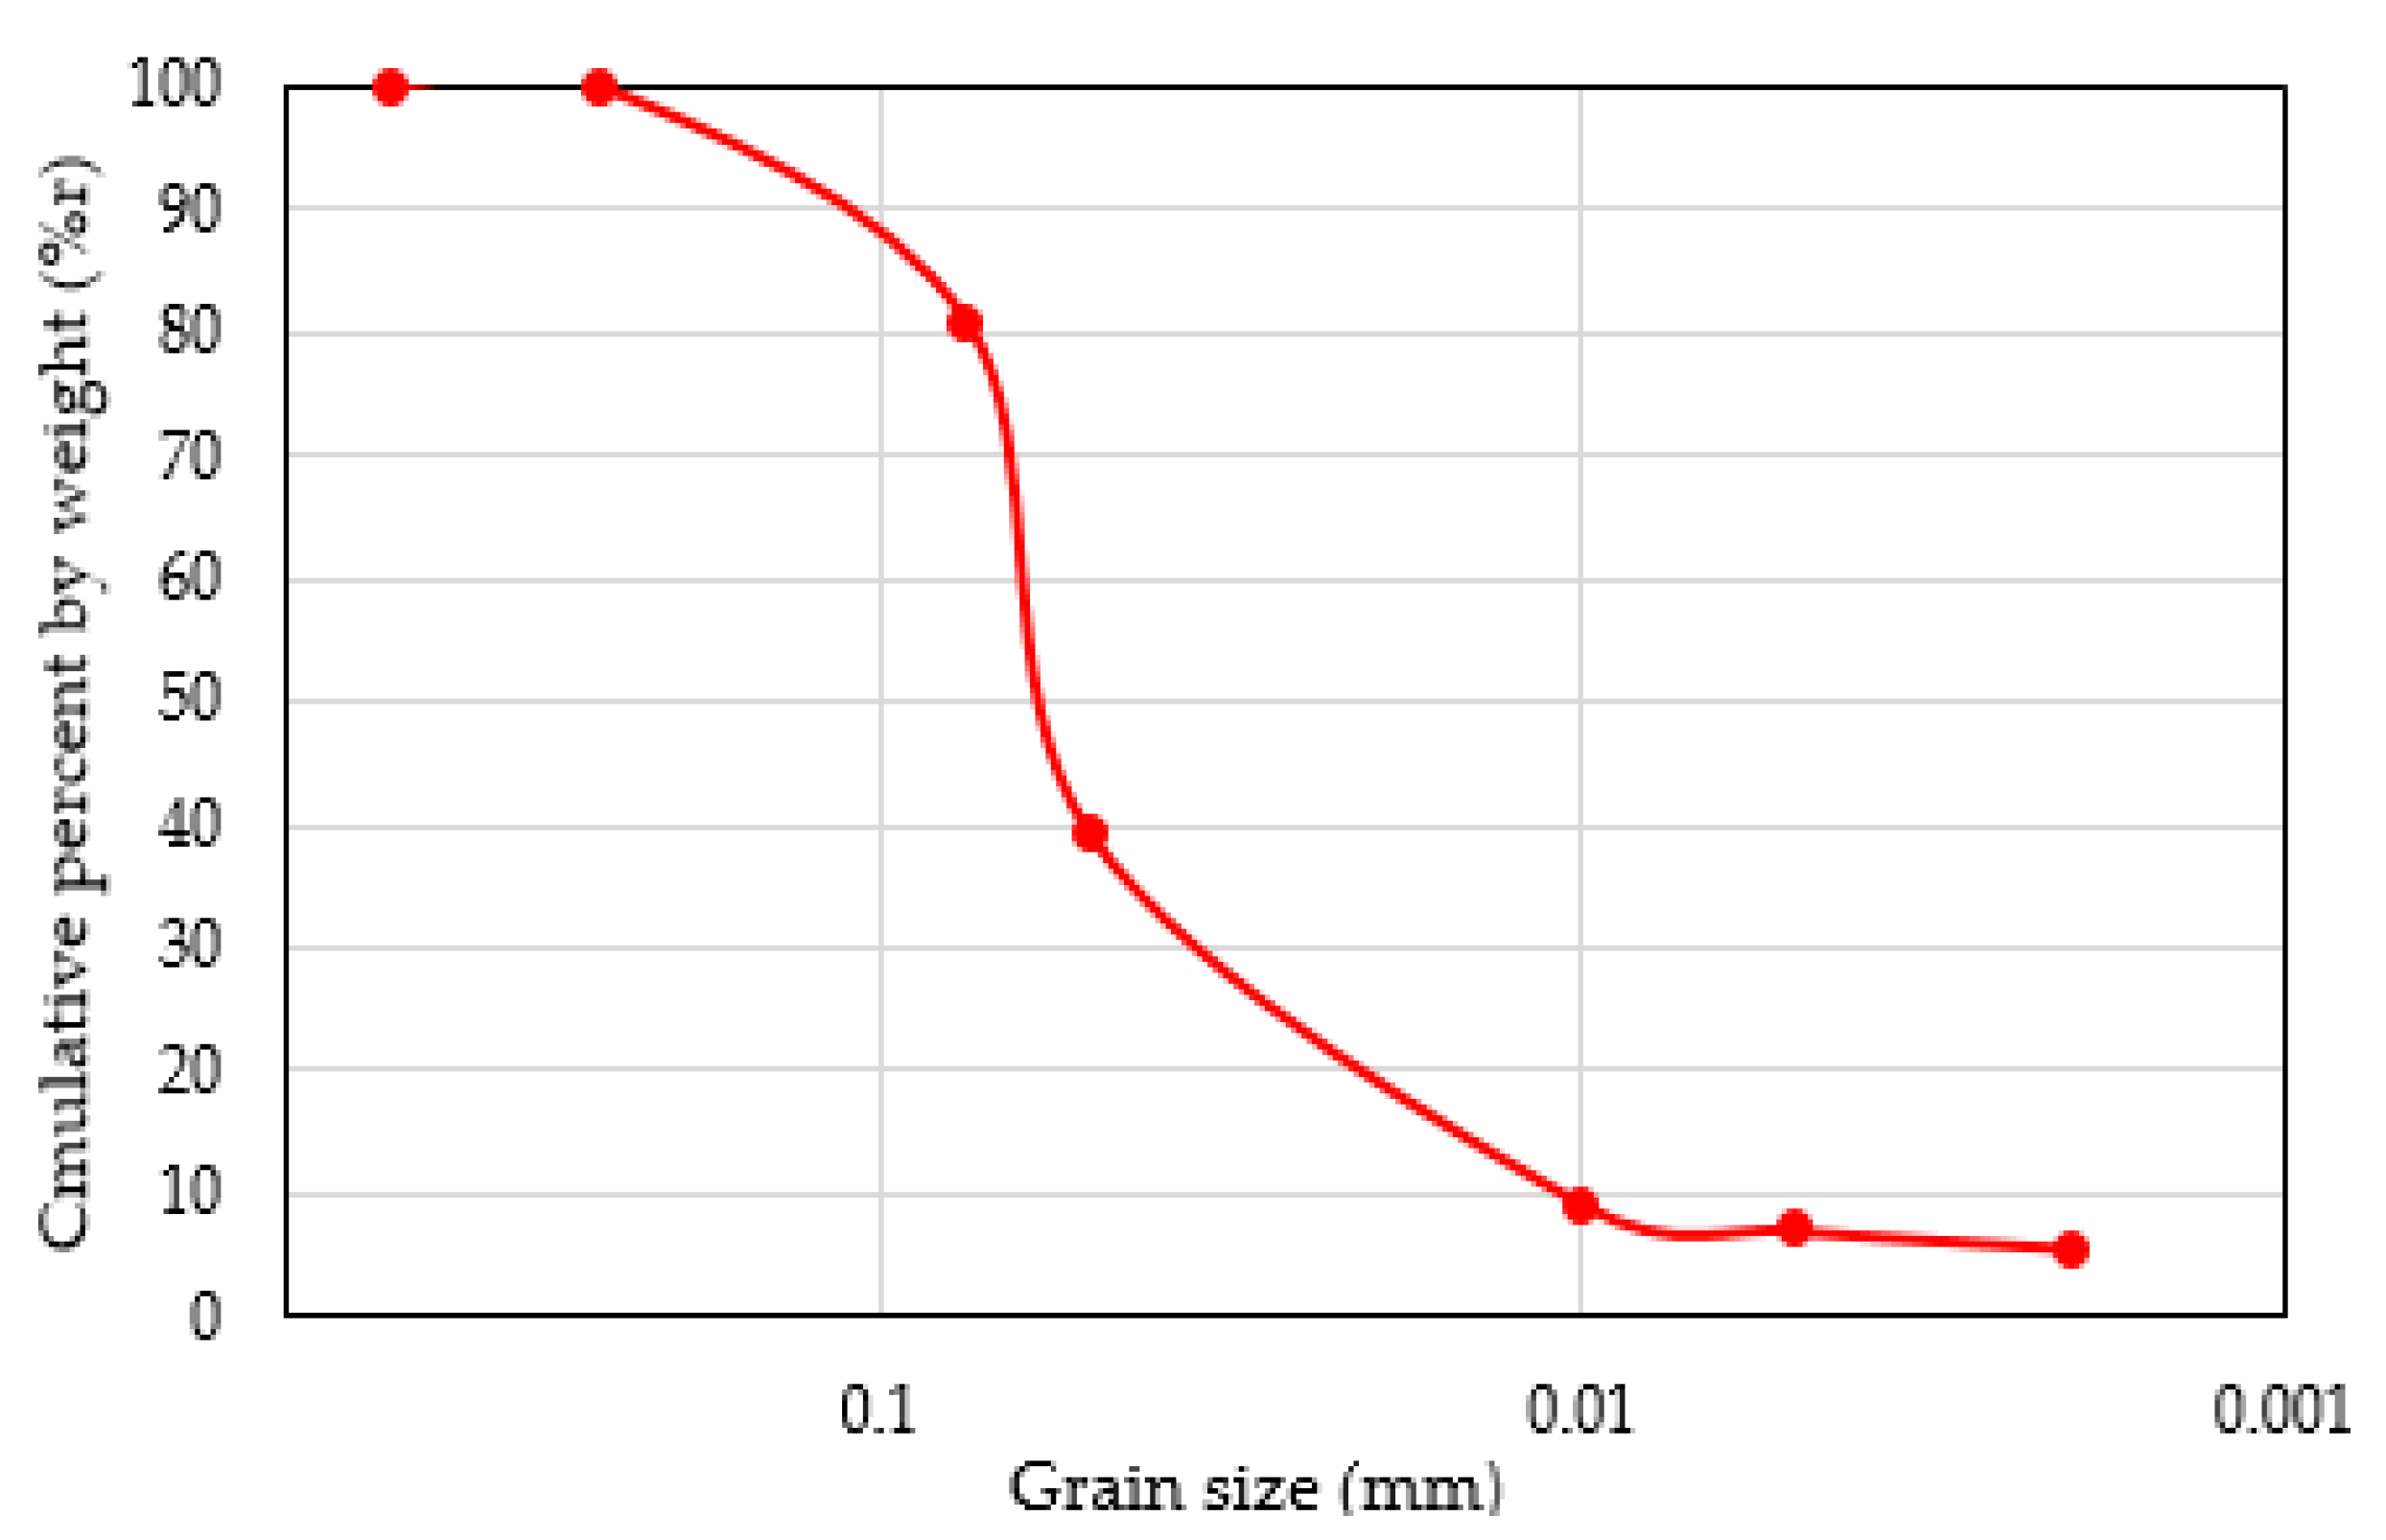
Figure 2.
Schematic diagram of wave flume.
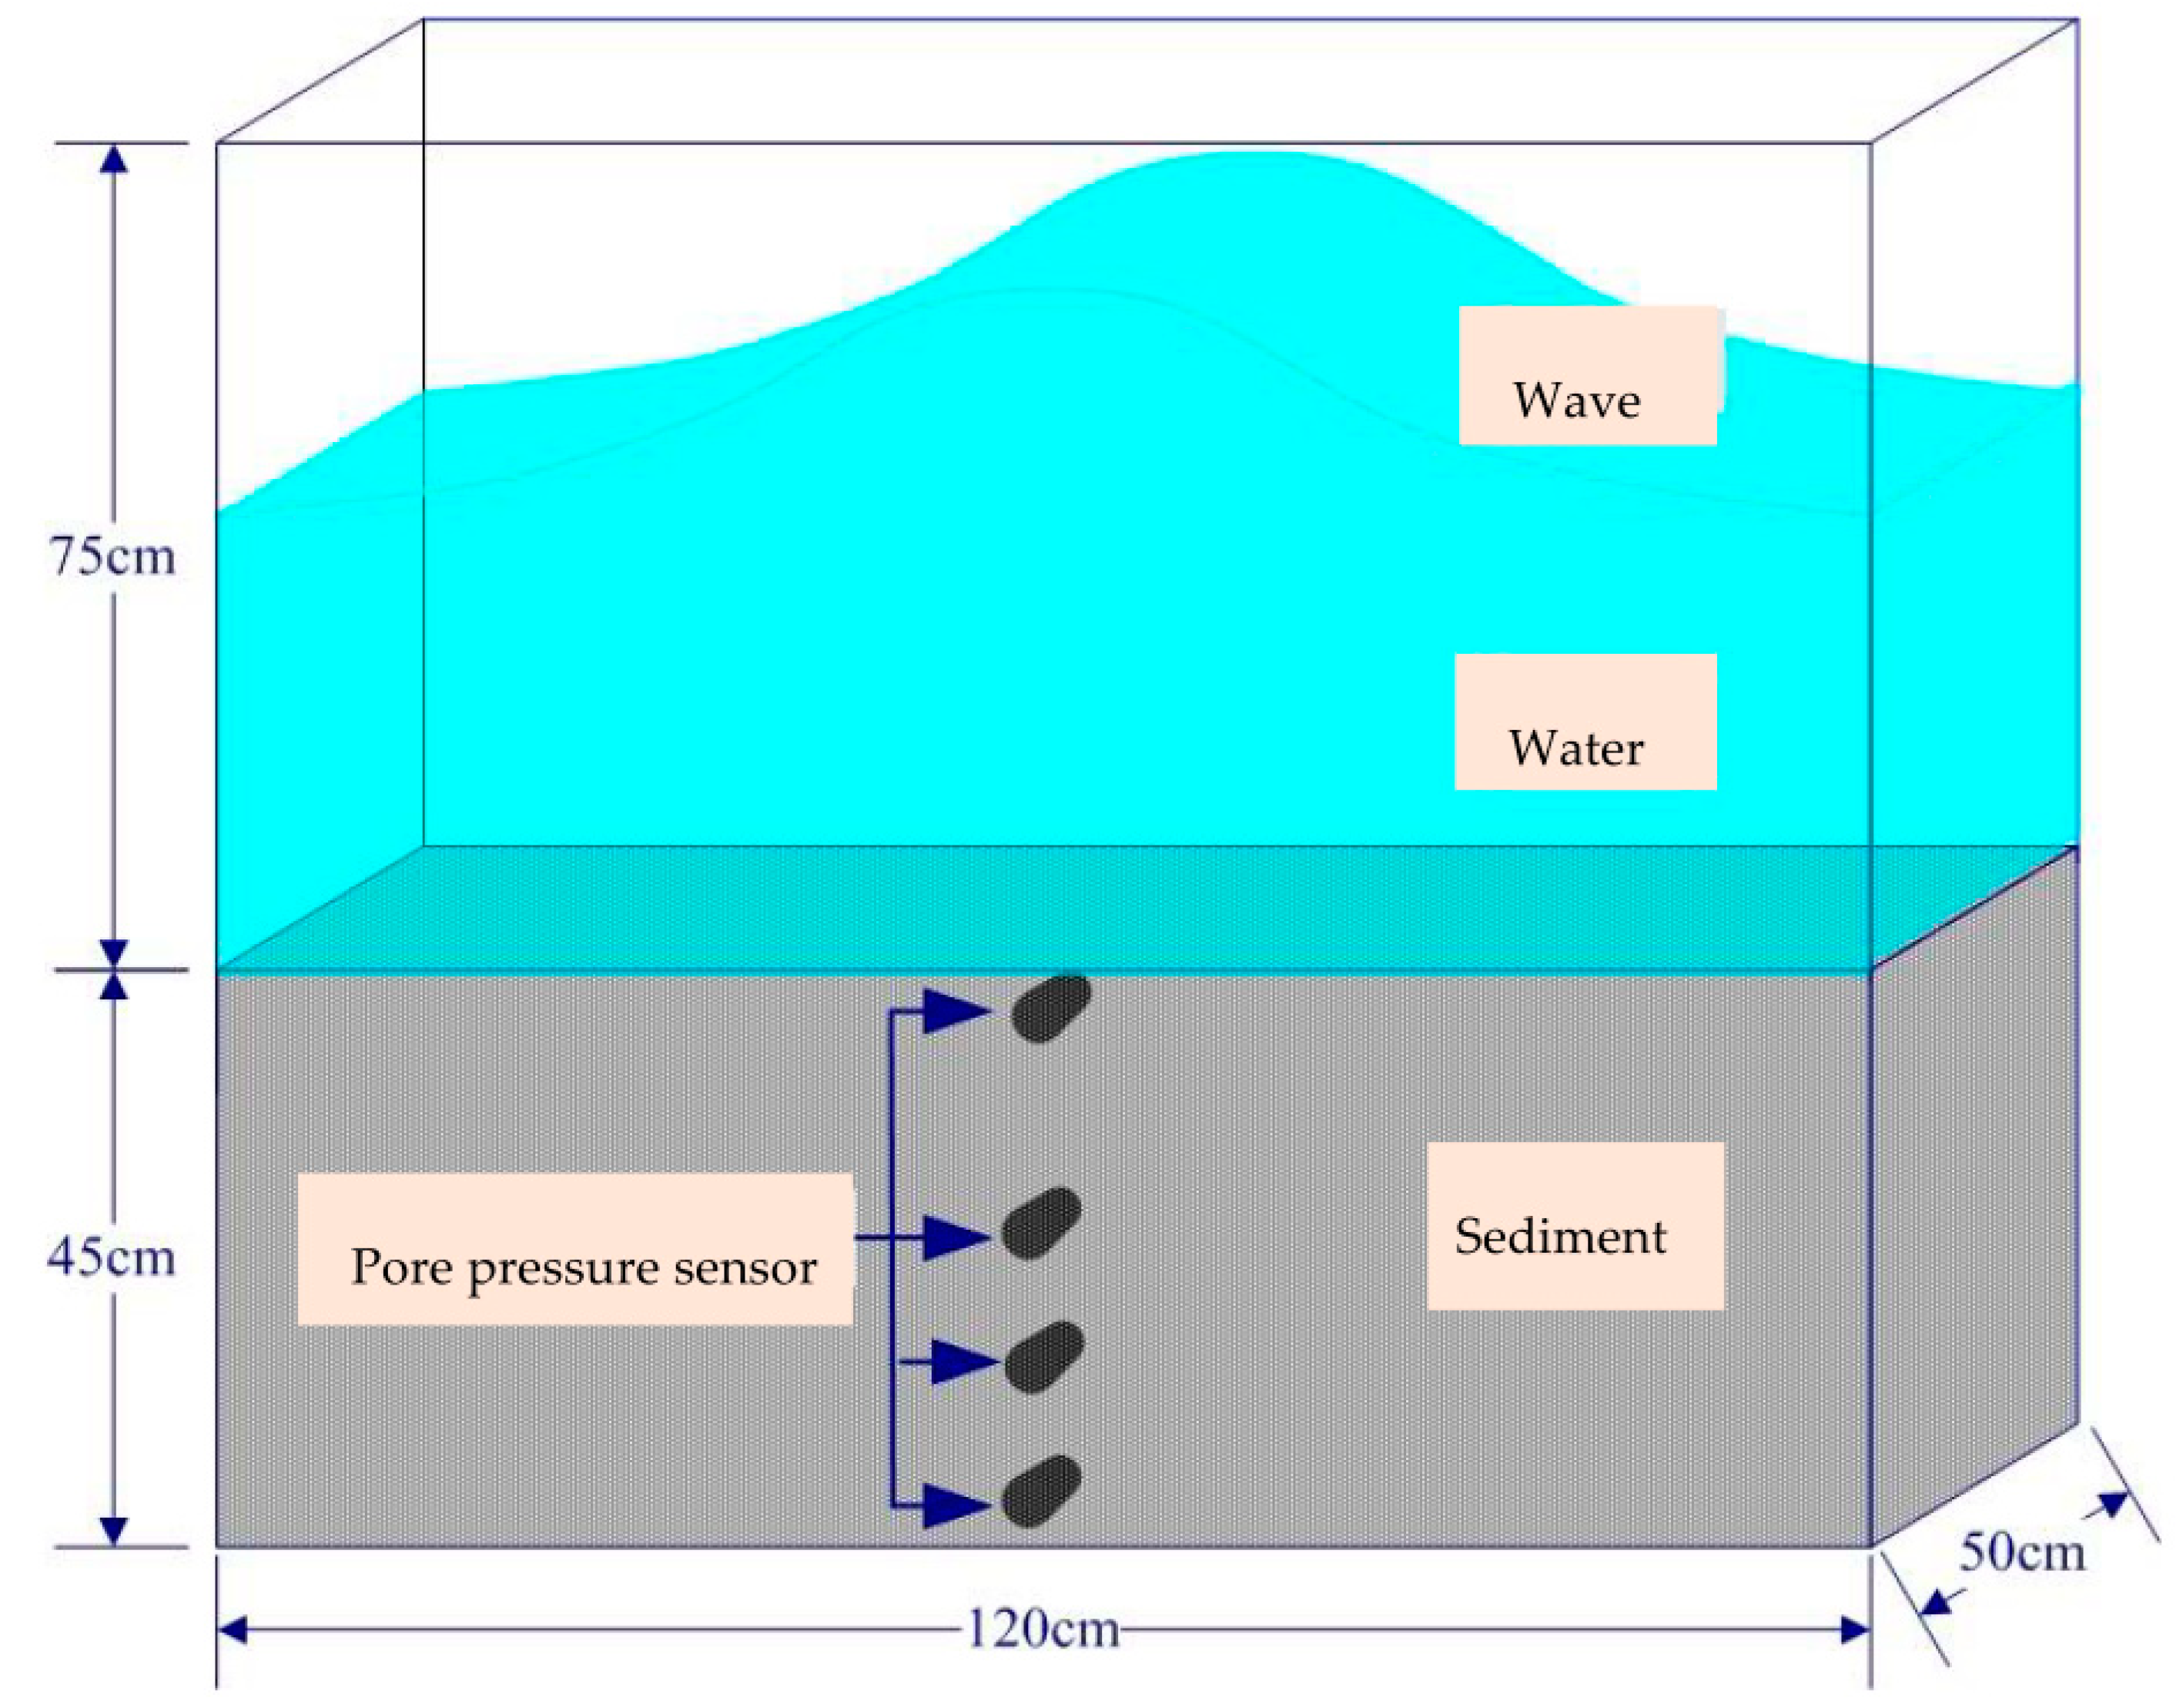
Figure 3.
Schematic diagram showing the wave generation.
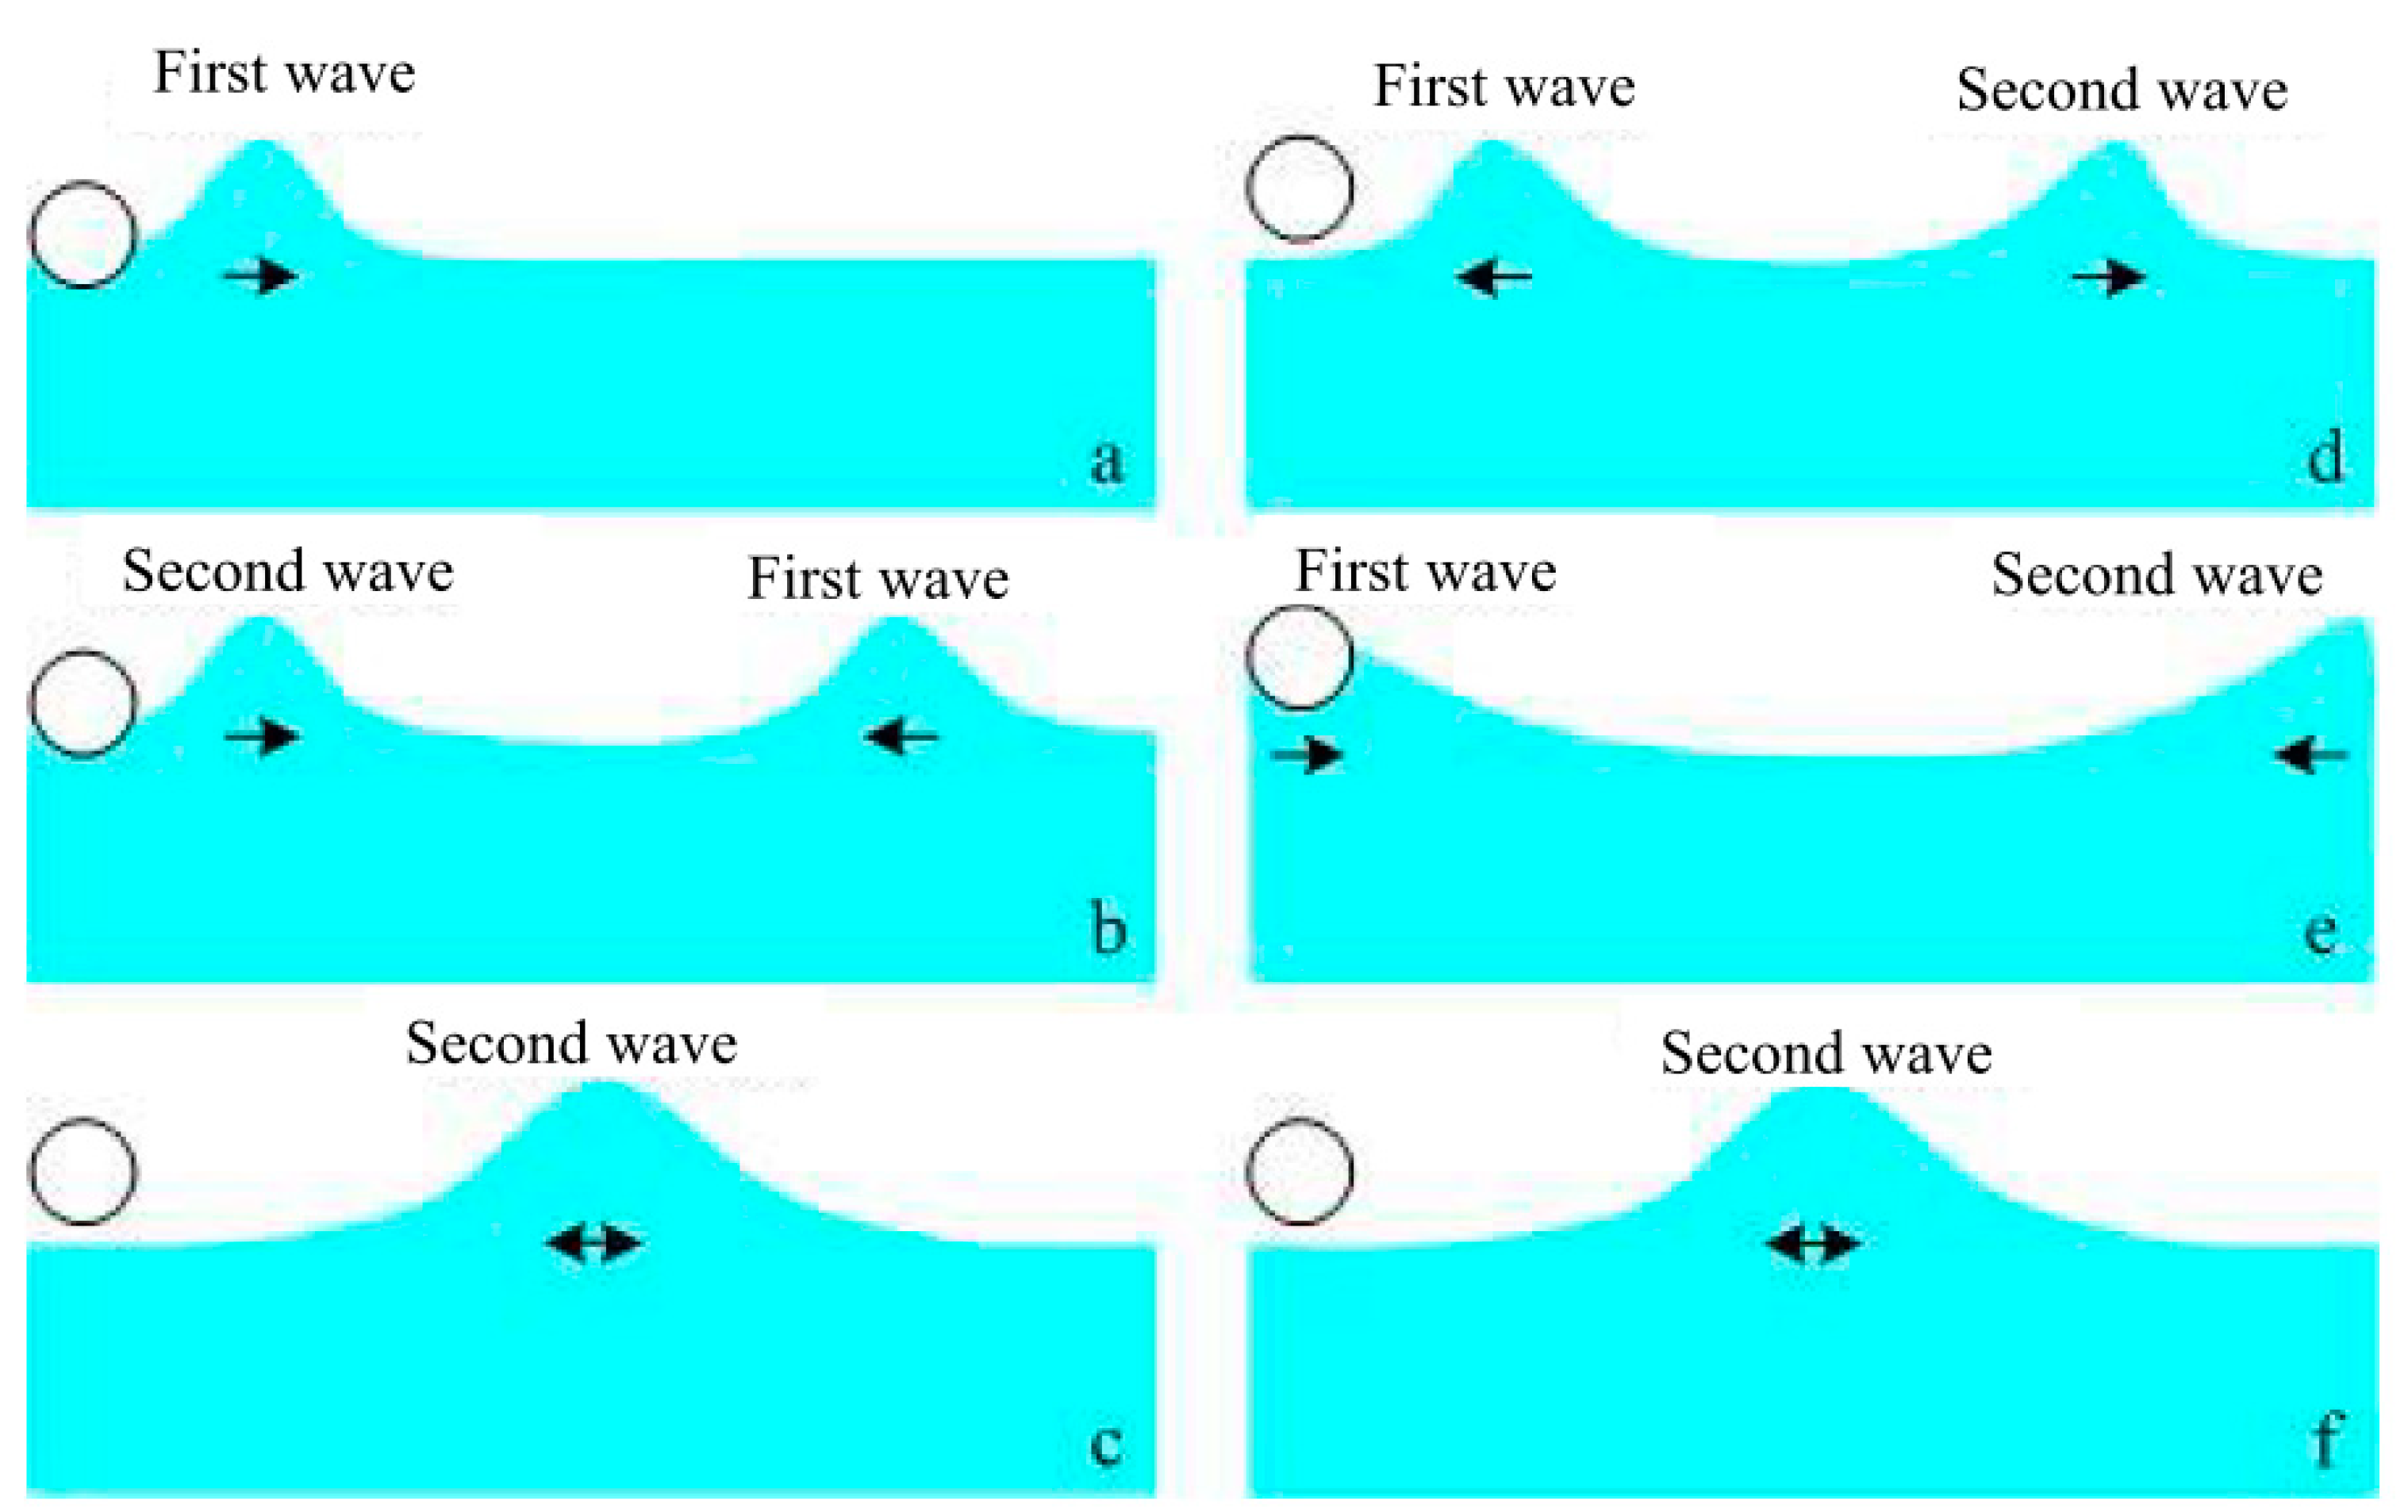
Figure 4.
Experimental photographs showing the wave generation.
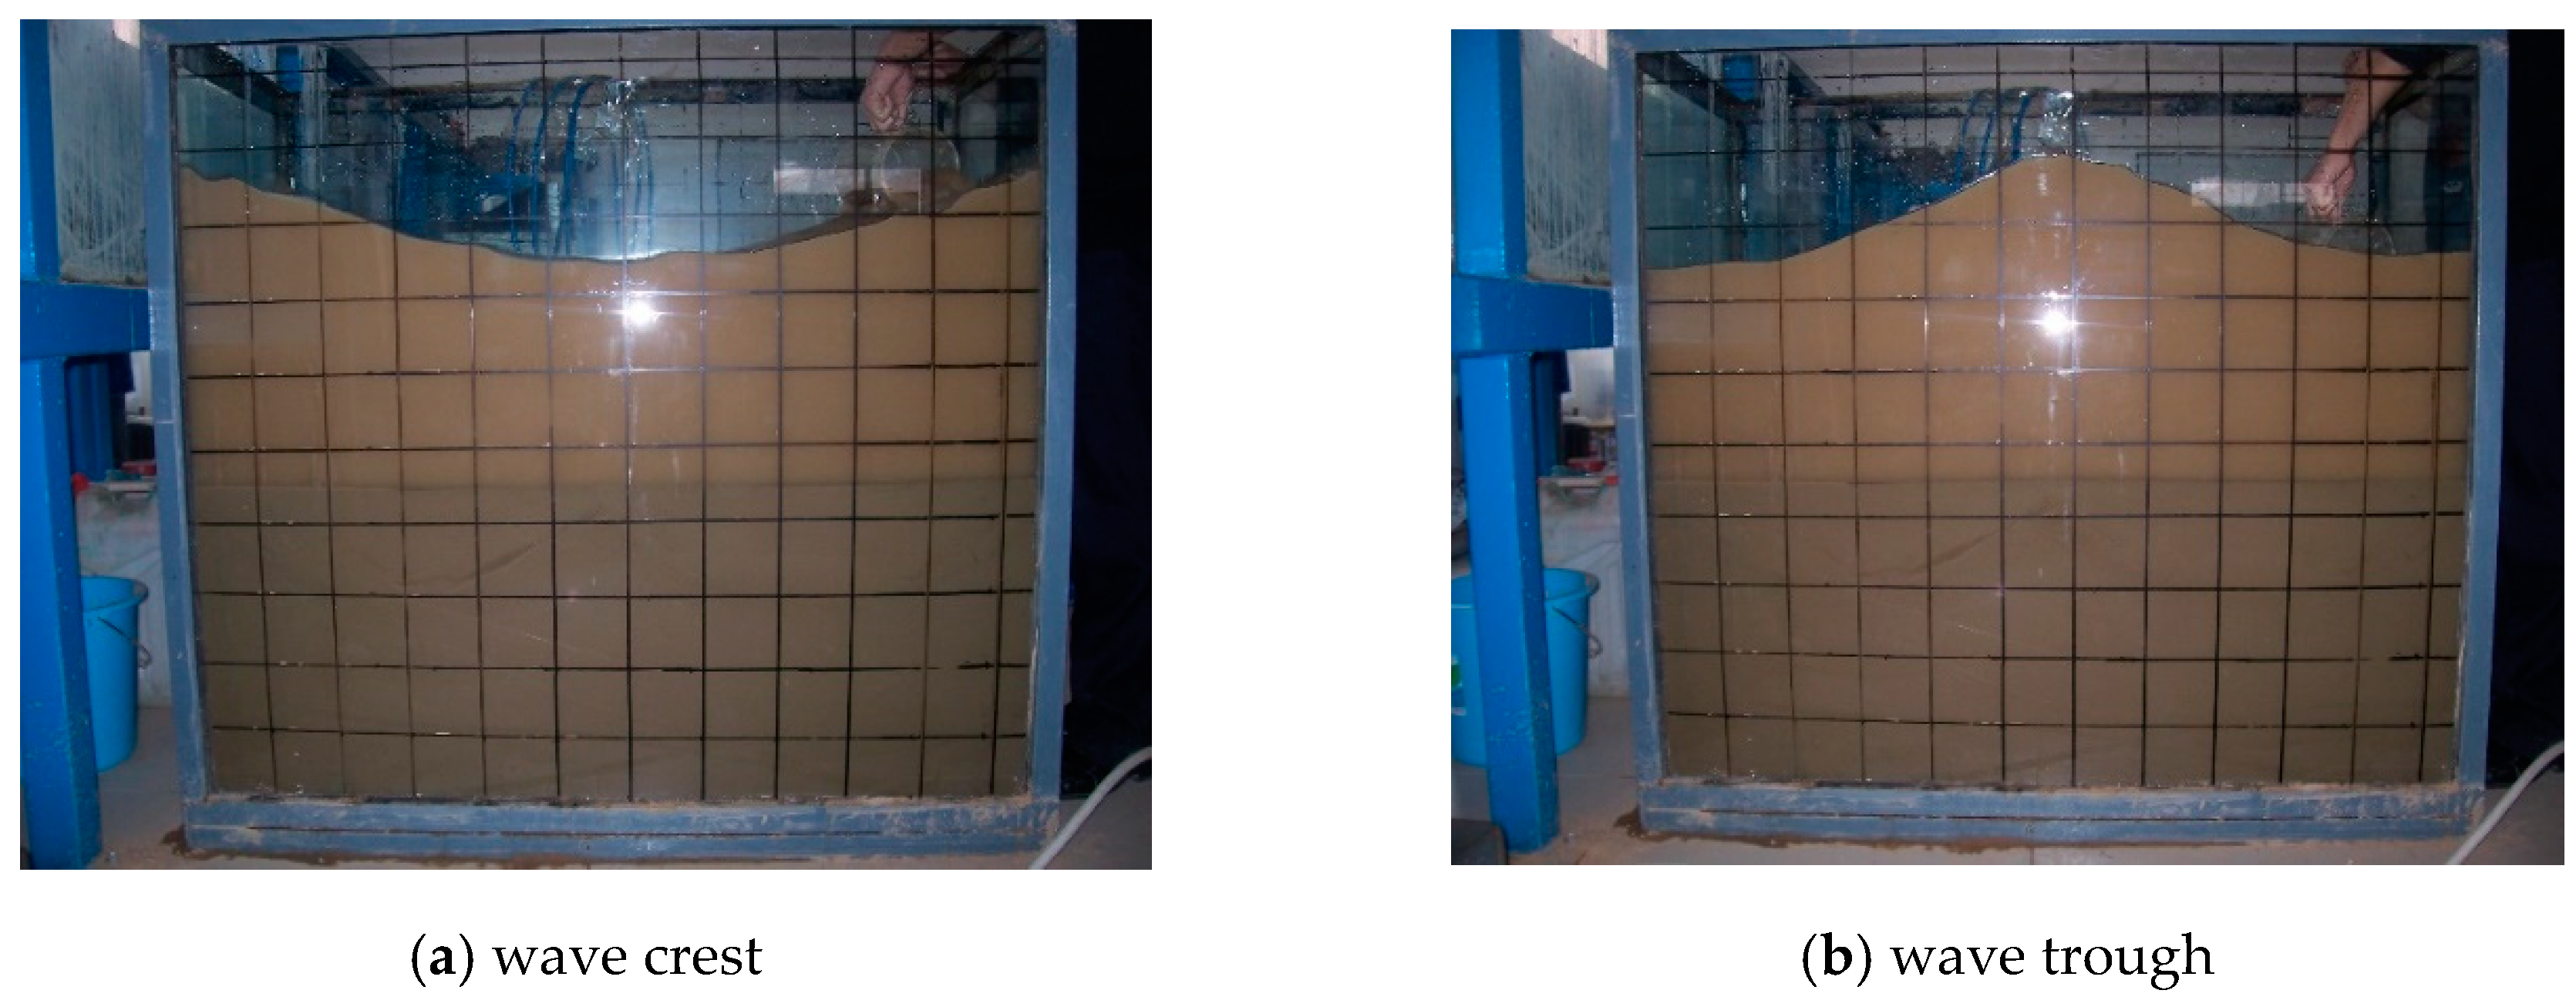
Figure 5.
Experimental photographs showing the slide surface. (a) First day; (b) Seventh day. The dotted lines are used to show the slide surface.
Figure 5.
Experimental photographs showing the slide surface. (a) First day; (b) Seventh day. The dotted lines are used to show the slide surface.
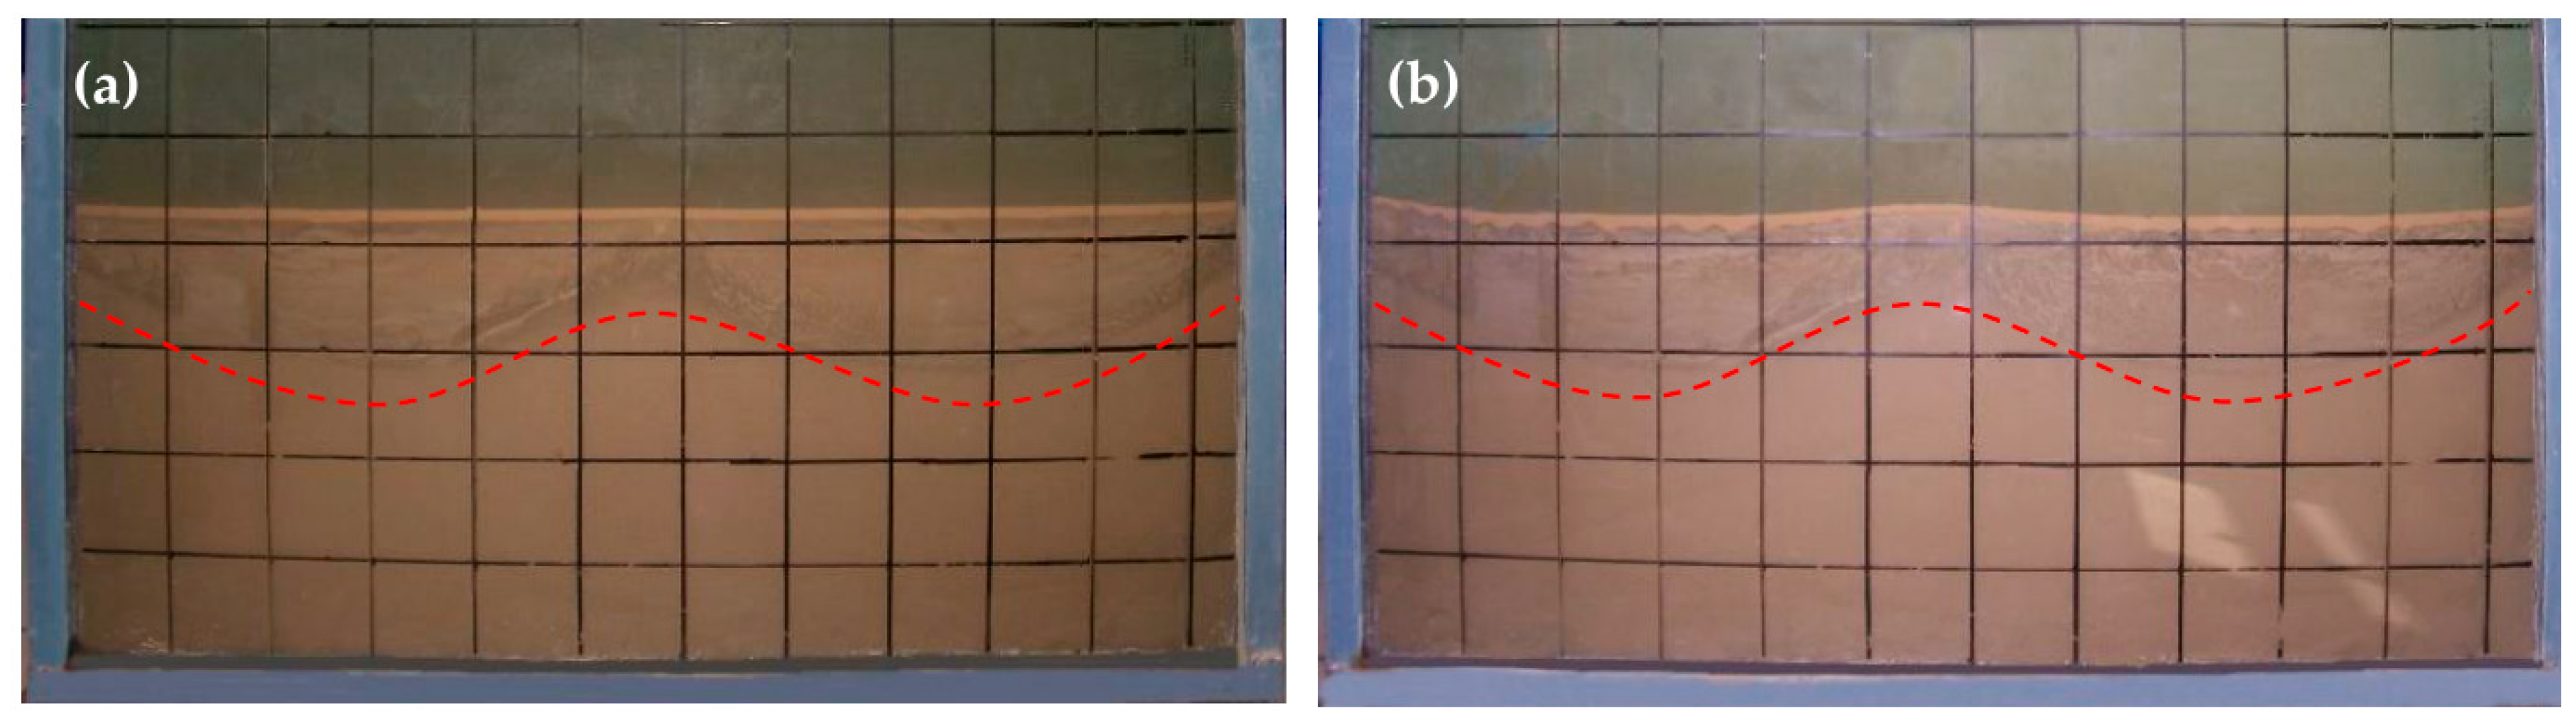
Figure 6.
Experimental photographs showing the ripples. (a) Top view; (b) Side view.
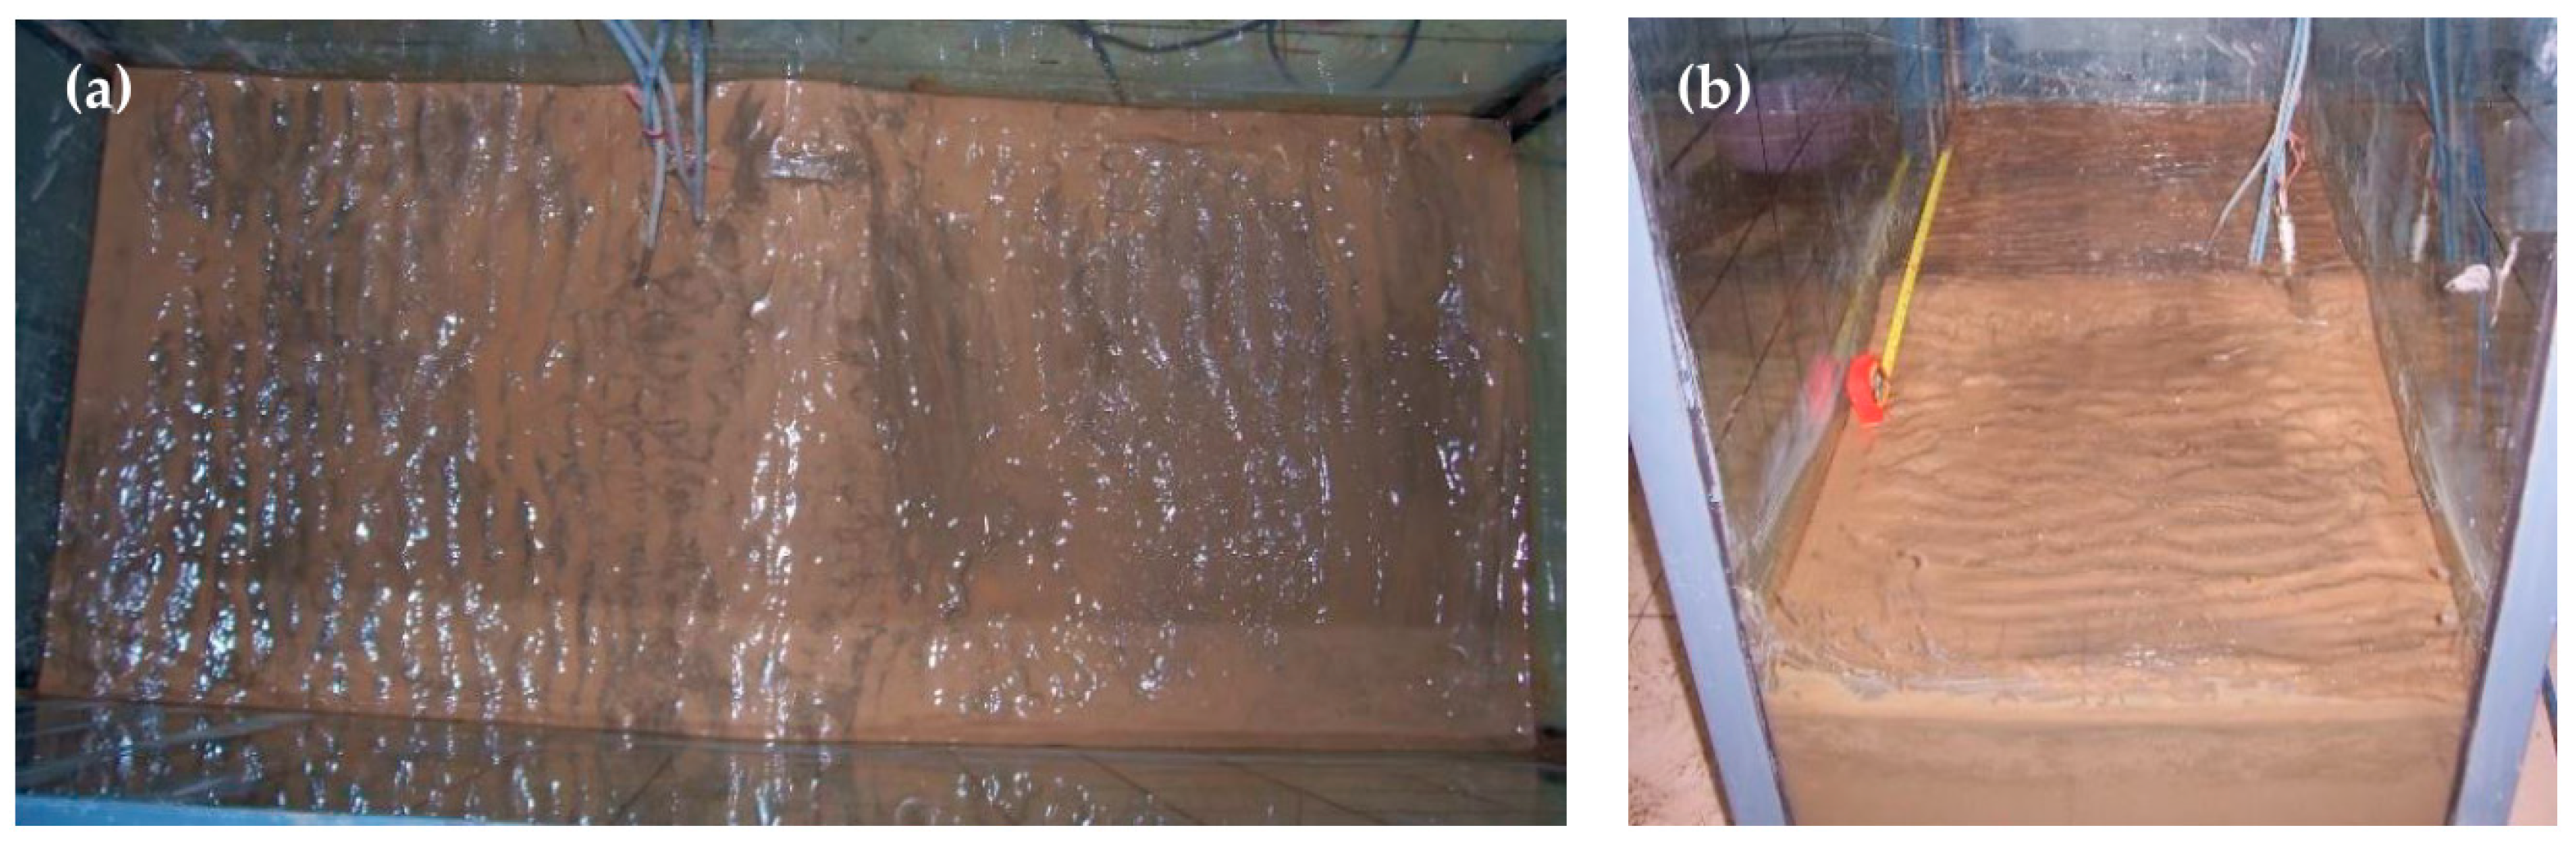
Figure 7.
Photographs showing the gas holes in different scales.

Figure 8.
Photographs showing the ribbon of gas holes.

Figure 9.
Schematic diagram showing the direction of gas distribution.

Figure 10.
Excess pore pressure during the wave action. The curves thorough from (a–g) represent the excess pore pressure curves for the first to seventh wave application process; (h) excess pore pressure of the seabed for different wave application processes at a depth of 20 cm; (i) excess pore pressure of the seabed at a depth of 35 cm from different wave application processes.
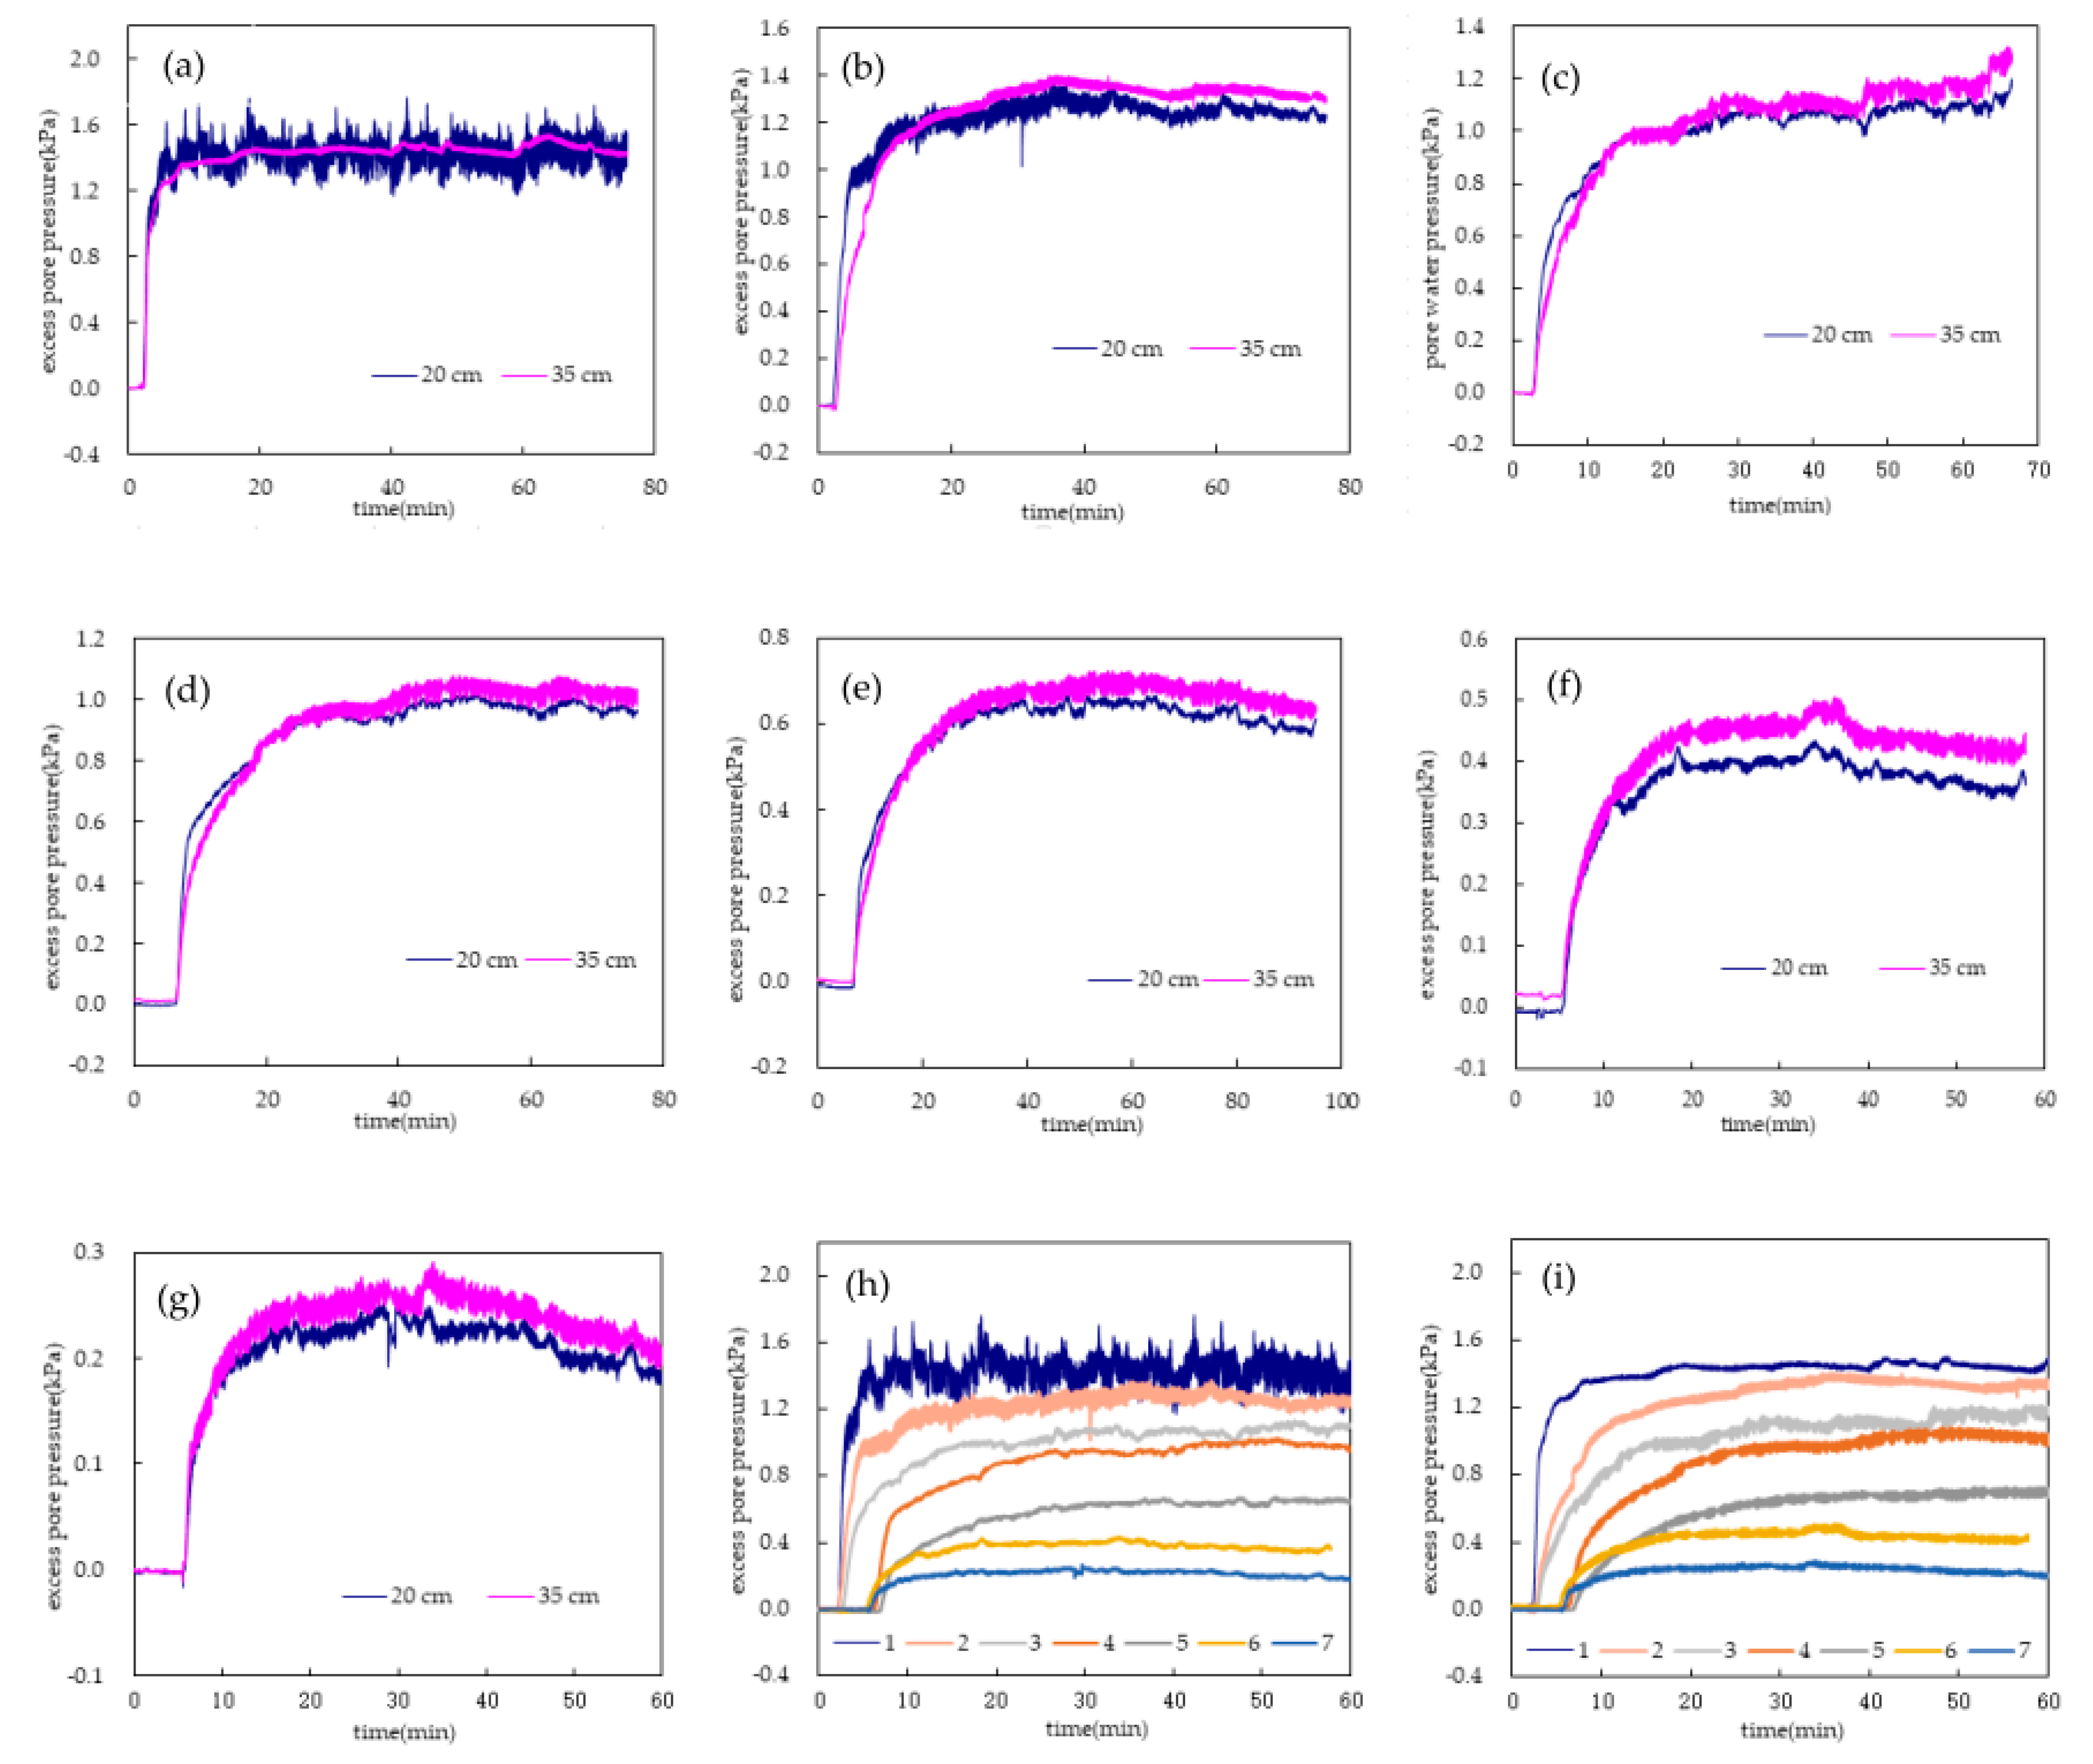
Figure 11.
Sediment penetration strength profile after the experiment.

© 2019 by the authors. Licensee MDPI, Basel, Switzerland. This article is an open access article distributed under the terms and conditions of the Creative Commons Attribution (CC BY) license (http://creativecommons.org/licenses/by/4.0/).
Share and Cite
MDPI and ACS Style
Wang, X.; Zhu, C.; Liu, H. Wave-Induced Seafloor Instability in the Yellow River Delta: Flume Experiments. J. Mar. Sci. Eng. 2019, 7, 356. https://doi.org/10.3390/jmse7100356
AMA Style
Wang X, Zhu C, Liu H. Wave-Induced Seafloor Instability in the Yellow River Delta: Flume Experiments. Journal of Marine Science and Engineering. 2019; 7(10):356. https://doi.org/10.3390/jmse7100356
Chicago/Turabian StyleWang, Xiuhai, Chaoqi Zhu, and Hongjun Liu. 2019. "Wave-Induced Seafloor Instability in the Yellow River Delta: Flume Experiments" Journal of Marine Science and Engineering 7, no. 10: 356. https://doi.org/10.3390/jmse7100356
Note that from the first issue of 2016, this journal uses article numbers instead of page numbers. See further details here.